Article

Numerical Simulation of Spray Combustion with Ultrafine Oxygen Bubbles

1
Department of Mechanical Systems Engineering, Faculty of Engineering, Nagoya University, Furo-cho, Chikusa-ku, Nagoya-shi 464-8603, Aichi, Japan
2
Department of Mechanical Engineering, Kanagawa Institute of Technology, Shimo-ogino, Atsugi-shi 243-0292, Kanagawa, Japan
*
Author to whom correspondence should be addressed.
Energies 2022, 15(22), 8467; https://doi.org/10.3390/en15228467
Submission received: 29 September 2022 / Revised: 27 October 2022 / Accepted: 9 November 2022 / Published: 12 November 2022
(This article belongs to the Section I2: Energy and Combustion Science)

Abstract

:
In this study, we focused on a fuel reforming technology by applying ultrafine oxygen bubble as the pretreatment for in-cylinder combustion s. It is assumed that oxygen is dissolved in the droplets in the form of ultrafine bubbles, and released into air when the decane fuel evaporates. A numerical simulation of the spray combustion was conducted using a PSI-CELL model. We changed the oxygen concentration of the droplets, the initial droplet diameter, and the number of injected droplets per unit time to discuss the ignition time and the temperature field. When there is no oxygen in the fuel droplet, most of the flames are diffusion flames. On the other hand, when oxygen exists in the droplets, premixed flames are formed at the upstream edge of the fuel spray. Due to the effects of ultrafine oxygen bubbles, the ignition time is shortened. However, on the condition that there is only a small amount of oxygen in the fuel droplets, as more fuel is supplied by enlarging the droplet diameter or increasing the number of injected droplets per unit time, the ignition time increases. Thus, when discussing ignition time, the balance between evaporated fuel and oxygen in the gas phase is important.

1. Introduction

Due to global warming in recent years [1,2], there is an urgent need to improve the fuel efficiency of internal combustion engines. Additionally, since air pollution in urban and rural sites has become serious, it is necessary to reduce harmful exhaust gas components such as PM and NOx [3,4,5,6]. Currently, for further reduction of PM and NOx emissions as well as less CO2, vehicle exhaust emission standards have become more stringent around the world [7,8]. In comparison with gasoline engines, diesel engines have the advantage of higher fuel efficiency [9,10]. To reduce harmful emissions, a common rail system is used where a direct fuel injection with high-pressure (over 200 MPa) accelerates the atomized combustion process [11,12,13]. Simultaneously, a DPF (diesel particulate filter) and an urea-SCR (selective catalytic reduction) device are combined in the exhaust gas after-treatment system [14,15,16,17,18].
Moreover, as the pretreatment of the engine technology, fuel additives [19,20,21] and a fuel reforming technology [22,23] are used to improve the in-cylinder combustion of the diesel engine. However, the former is expensive, and few practical applications are available. On the other hand, for the latter, there are more options including water emulsion fuel [24], CO2 blended fuel [25], liquefied petroleum gas (LPG)-blended fuel [26], and hydrous ethanol emulsion fuel [27]. Fuel reforming is reported to enhance the atomization for fuel vapor formation [28].
In this study, we focus on ultrafine oxygen bubbles applied for the fuel reforming technology. Ultrafine bubbles are those with a diameter of 1 µm or less dissolved in the liquid, which cannot be seen by our naked eyes. They have high persistence in the liquid and are used in various applications such as water purification, agriculture, and medical instruments [29]. In internal combustion engines, it is reported that oxygen bubbles can improve combustion by dissolving the oxygen in the fuel in advance, which could be one of the prospective fuel reforming technologies [30,31,32]. The properties of the reformed fuel by ultrafine bubbles are physically and chemically changed. The physical effects include an increase in size of the fuel droplets caused by dissolved gases, as well as the reduction of surface tension and viscosity, which promote the atomization of the diesel spray [25,28]. As for the chemical effects, the intensified vaporization by dissolved oxygen and the resultant generation of free radicals are expected to improve the ignitability, uniformity, and shorten the period of the combustion rate [33]. Resultantly, the oxygen-blended fuel can cause significant reduction in soot and NOx emissions during combustion [34]. It has been confirmed that the fuel consumption rate is improved by 2 to 14%.
However, previous research has mainly focused on the physical aspects of fuel atomization, and there are few studies which examine the chemical effects of dissolved gases on the combustion field. Since the fuel supply by injector is a highly transient process [35], it may be difficult to control the injector parameters and set the experimental conditions efficiently. More data would be needed to clarify the nature of the spray combustion. Thus, a numerical simulation is suitable for understanding the effects of ultrafine bubbles on vapor formation and the combustion process. In our research group, numerical simulations of the spray combustion were conducted [36]. The processes of the fuel droplet injection and the evaporation were modeled by a so-called particle-source-in cell (PSI-CELL) model [37]. This model has been used for the gas-liquid flow, such as polymer combustion [38], air-mist spray [39], and spray drying process [40]. Elementary processes were included in the spray combustion to make clear the correlation between spray conditions and ignition characteristics, largely related with the combustion characteristics of fuel droplets.
The objective of this study is to identify the effects of ultrafine bubbles on the combustion field. We mainly focus on the chemical effects of ultrafine bubbles on the reaction rate due to the change in oxygen concentration, rather than the physical effects such as the splitting of fuel droplets during atomization. For this purpose, the numerical simulation of the spray combustion was performed using the PSI-CELL model. By assuming that oxygen is dissolving in the droplets in the form of ultrafine bubbles, oxygen is released into gas phase simultaneously with the fuel evaporation. The droplets are injected into high-temperature air to simplify diesel combustion. The oxygen concentration in the fuel droplet was varied in the simulation. The droplet diameter and the number of injected droplets per unit time were also changed. By changing these parameters systematically, we discussed the ignition time and the temperature field.

2. Numerical Model

2.1. Numerical Domain and Conditions

The numerical model of the spray combustion is shown in Figure 1. Three-dimensional Cartesian coordinates were used. From the fuel nozzle located at x = 0 mm, the fuel droplets were randomly injected, where x is the direction of the fuel jet, and the origin of the coordinate system is located at the center of the fuel nozzle. The numerical domain is a cubic, and the total domain size is 8 mm × 8 mm × 8 mm. The number of the numerical grids is 81 × 81 × 81, with a spatial grid size of 0.1 mm.
The shape of the fuel nozzle is circular with a diameter of 1 mm. As for the boundary conditions, the inlet boundary at x = 0 mm, except for the fuel nozzle, was set to be adiabatic and nonslip wall for the flow. For the outlet boundary at x = 8 mm as well as four side walls at y = z = ±4 mm, the developed boundary condition was adopted, where the gradient normal to the wall of the scalar, such as temperature and species concentrations, was zero. Decane (C10H22) was used as fuel, and the initial diameter of all fuel droplets was the constant of d0 (= 5~50 µm [41,42]). Each fuel droplet was placed inside the fuel nozzle at x = 0 mm randomly. The injection velocity of the droplet along the x-direction was 100 m/s. For the measurement of the fuel spray in diesel in-cylinder combustion, it was reported that the stable spray cone angle is in the range of 20° to 40° [43]. Thus, the droplet injection angle for y- and z-directions were set so that the spray cone angle was 40°. The number of injected droplets per unit time, n, was 20~80 µs−1. In this case, the fuel mass flow rate was 0.025 to 0.1 g/s, which is close to 0.05 g/s in the simulation of the fuel spray [44]. The injection period of the fuel spray was 80 µs. It was assumed that the fuel droplet was injected by air. Dependent on the droplet size and the number of injected droplets, the initial overall equivalent ratio of the fuel jet was varied from 2.39 to 76.4. The initial temperatures of the fuel droplet and injected air were set to be the boiling point of decane (=447.35 K). On the other hand, the ambient gas in the numerical domain was air whose temperature and pressure were 1200 K and 0.1013 MPa, respectively.
In this simulation, we observed fuel droplets with ultrafine oxygen bubbles. The evaporation of the fuel droplets was described by PSI-CELL model [32]. In this model, to describe the evaporation of the fuel droplet, the source term of the evaporated fuel was added in the conservation equations of the gas phase. The governing equations of the gas phase and the droplets are explained in Section 2.2 and Section 2.3, respectively. The oxygen mass fraction in the fuel droplet was 0 to 40%, denoted as YO2. In experiments [34], the amount of oxygen in the fuel droplet was approximately 1%. It was assumed that the oxygen bubble did not change the droplet size and the oxygen released from bubble during the fuel evaporation. The latent heat of decane evaporation was 300 kJ/kg, and its density was 700 kg/m3.

2.2. Conservation Equations of Gas Phase

The following equations were considered, maintaining conservation of mass, momentum, energy, and species i for compressible flow [45,46,47,48,49,50]. In the momentum equation, the effect of the gravity was not included.
  • Continuity equation
ρ t + · ( ρ v ) = Z F
where ρ is density, v is velocity, and ZF is a source term in the PSI-CELL model described in Section 2.3.
  • Momentum equation
( ρ u m ) t + · ( ρ v u m ) · ( μ u m ) = p x m + ( μ x u j x j + μ x j u j x ) + Z M , m m , j = x , y , z
where μ is viscosity and ZM,m is a source term in the PSI-cell model.
  • Energy equation
( ρ T ) t + · ( ρ v T ) 1 c p · ( λ T ) = 1 c p D p D t 1 c p i h i w i + Z T c p
where T is temperature, p is pressure, cp is specific heat, λ is thermal conductivity, wi is mass production rate, hi is enthalpy of species i, and ZT is a source term in the PSI-CELL model.
  • Species equation
( ρ Y i ) t + · ( ρ v Y i ) · ( ρ D i Y i ) = w i + δ i Z F
where Yi is mass fraction of species i and Di is a diffusion coefficient of species i.
  • Ideal-gas equation
p = ρ R 0 T i Y i M i
where Mi is molecular weight of species i and R0 is the general gas constant. A finite volume method was used to discretize these conservation equations. The first-order upwind difference scheme was applied to the convection term, and the first order fully implicit scheme was applied to the time evolution. The Patankar’s SIMPLE method [51] was used for the coupling of pressure and velocity. The time step was 3 μs, and the simulations were performed up to 450 μs when the spray combustion was sufficiently advanced for all conditions. The thermodynamic properties for the species were obtained from the CHEMKIN database [52]. The transport properties were calculated according to a Smooke’s simplified transport model [53].
For the chemical reaction, an overall one-step irreversible reaction between decane and oxygen was considered by C10H22 + 15.5 O2  10 CO2 + 11 H2O. The mass production rate of species i in Equations (3) and (4) is expressed by
w i = M i · A C C 10 H 22 a C O 2 b exp ( E / R 0 T )    
where C i is the molar concentration of species i. The pre-exponential factor, A, and the effective activation energy, E, were referred to [54]. The constants of a and b are 0.25 and 1.5, respectively.

2.3. Equation of Fuel Droplet by PSI-CELL Model

It was noted that the initial placement of the fuel droplet was determined by pseudorandom numbers produced by the FORTRAN code. If the number of injected droplets is the same, the initial position of each fuel droplet is the same even if the concentration of oxygen dissolved in the fuel droplet is changed. The equation of motion of the fuel droplet, whose diameter is d, is described as follows:
ρ p ( π d 3 6 ) d U d t = C D 1 2 ρ | v U | ( π d 2 4 )
where U and ρ p are the velocity vector and the density of the fuel droplet. The drag coefficient, C D , is
C D = 24.0 1 + 0.15 R e d 0.687 R e d ,   R e d ρ | v U | d μ
As a counterforce to the drag force, the following source term corresponding to the momentum of the gas phase per particle is added in Equation (2).
Z M | 1   particle = C D 1 2 ρ | v U | ( v U ) ( π d 2 4 )
On the other hand, as for the mass conservation equation for individual fuel droplets, we assumed that the mass transfer rate was obtained by dividing the heat transfer rate by the latent heat of evaporation. Using the heat transfer coefficient, h, the mass conservation equation for individual droplets is as follows:
    ρ p d d t ( π d 3 6 ) h ( T T B ) ln ( 1 + Z B ) Z B ( π d 2 ) L = ( π λ N u d ) ln ( 1 + Z B ) c p , m / L L
Z B c p , m ( T T B ) L ,   N u h d λ = 2 + 0.552 R e d 0.5 P r 1 3
where ZB is the Spalding’s heat transfer number, L is latent heat of vaporization, Pr is the Prandtl number, and TB is boiling temperature of fuel. From the above equation, the droplet lifetime can be calculated based on the change in droplet diameter, at which the droplet diameter becomes zero. The following source term per particle of the fuel droplet is added in the continuity equation in the gas phase.
Z F | 1   particle = h ( T T B ) ln ( 1 + Z B ) Z B ( π d 2 ) L
As for the energy equation, we assumed that the temperature at the droplet surface as well as inside the droplet was boiling temperature. By considering that there is the heat transfer during the droplet evaporation, the following source terms per particle of the fuel droplet is added in the energy equation in Equation (3).
Z T | 1   particle = h ( T T B ) ln ( 1 + Z B ) Z B ( π d 2 )
It is noted that the terms of ZF and ZT are widely used in the model of the spray combustion [55].

3. Results and Discussion

3.1. Combustion Field of Fuel Droplet with Ultrafine Bubbles

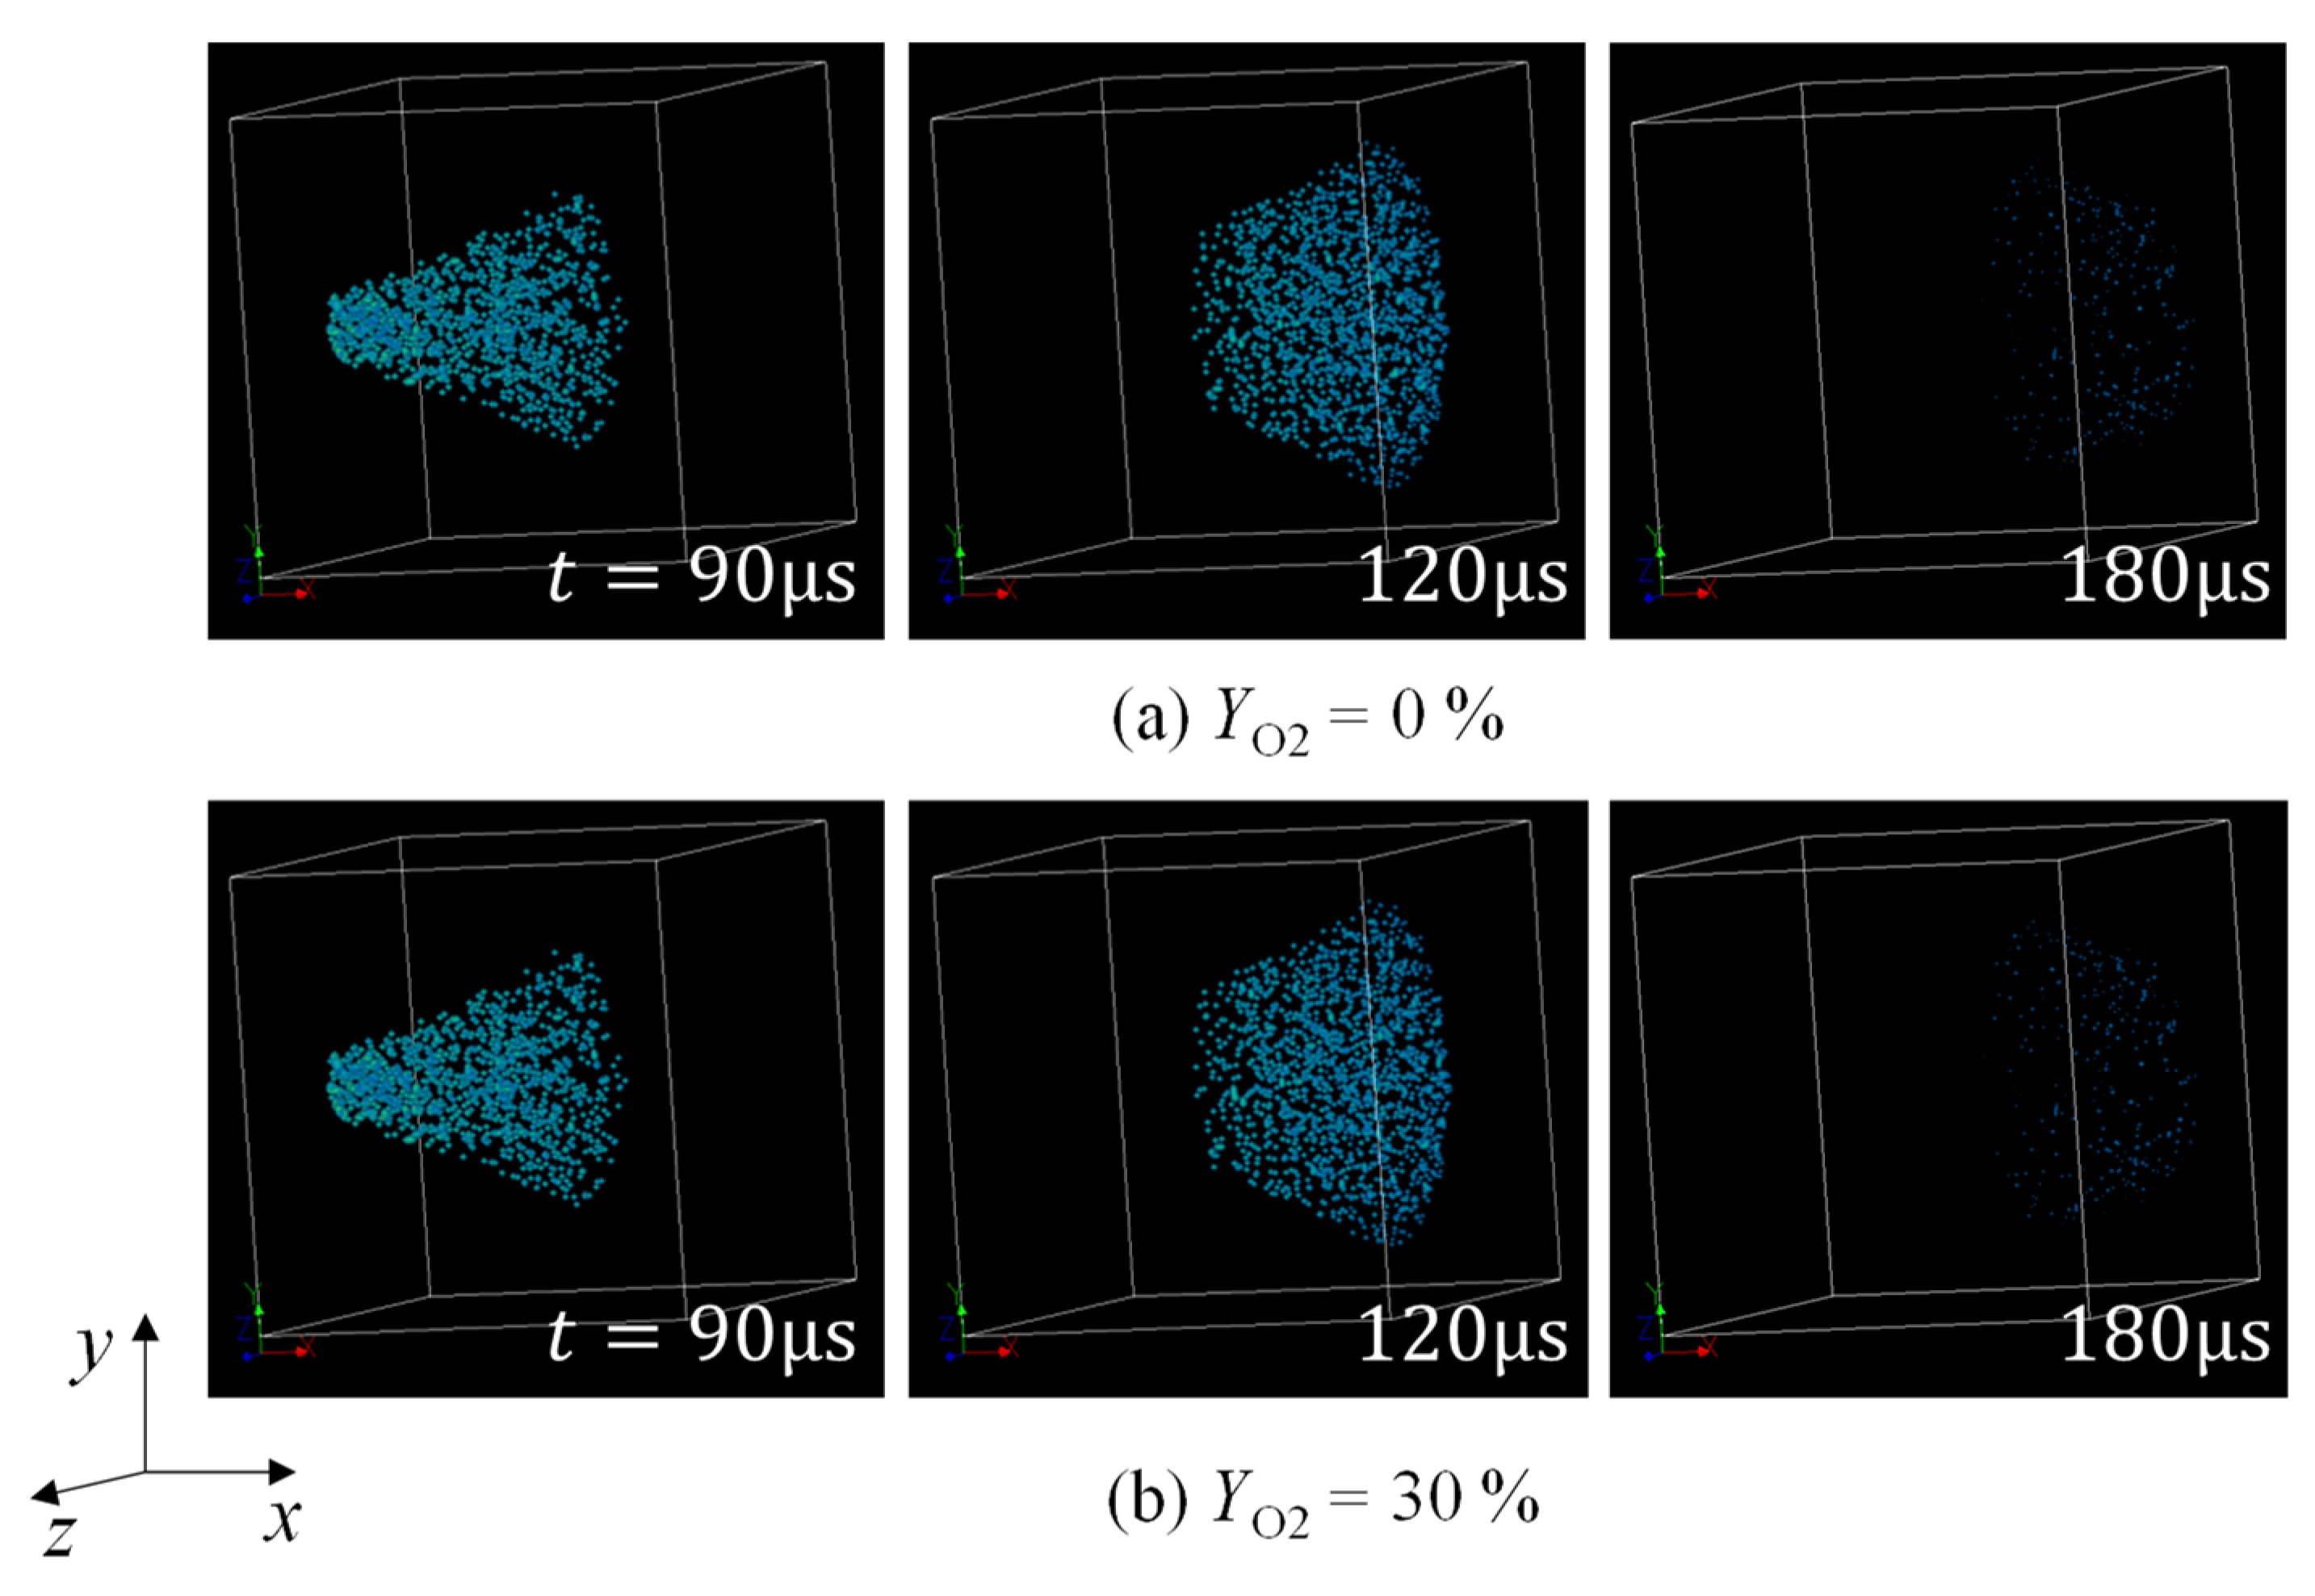
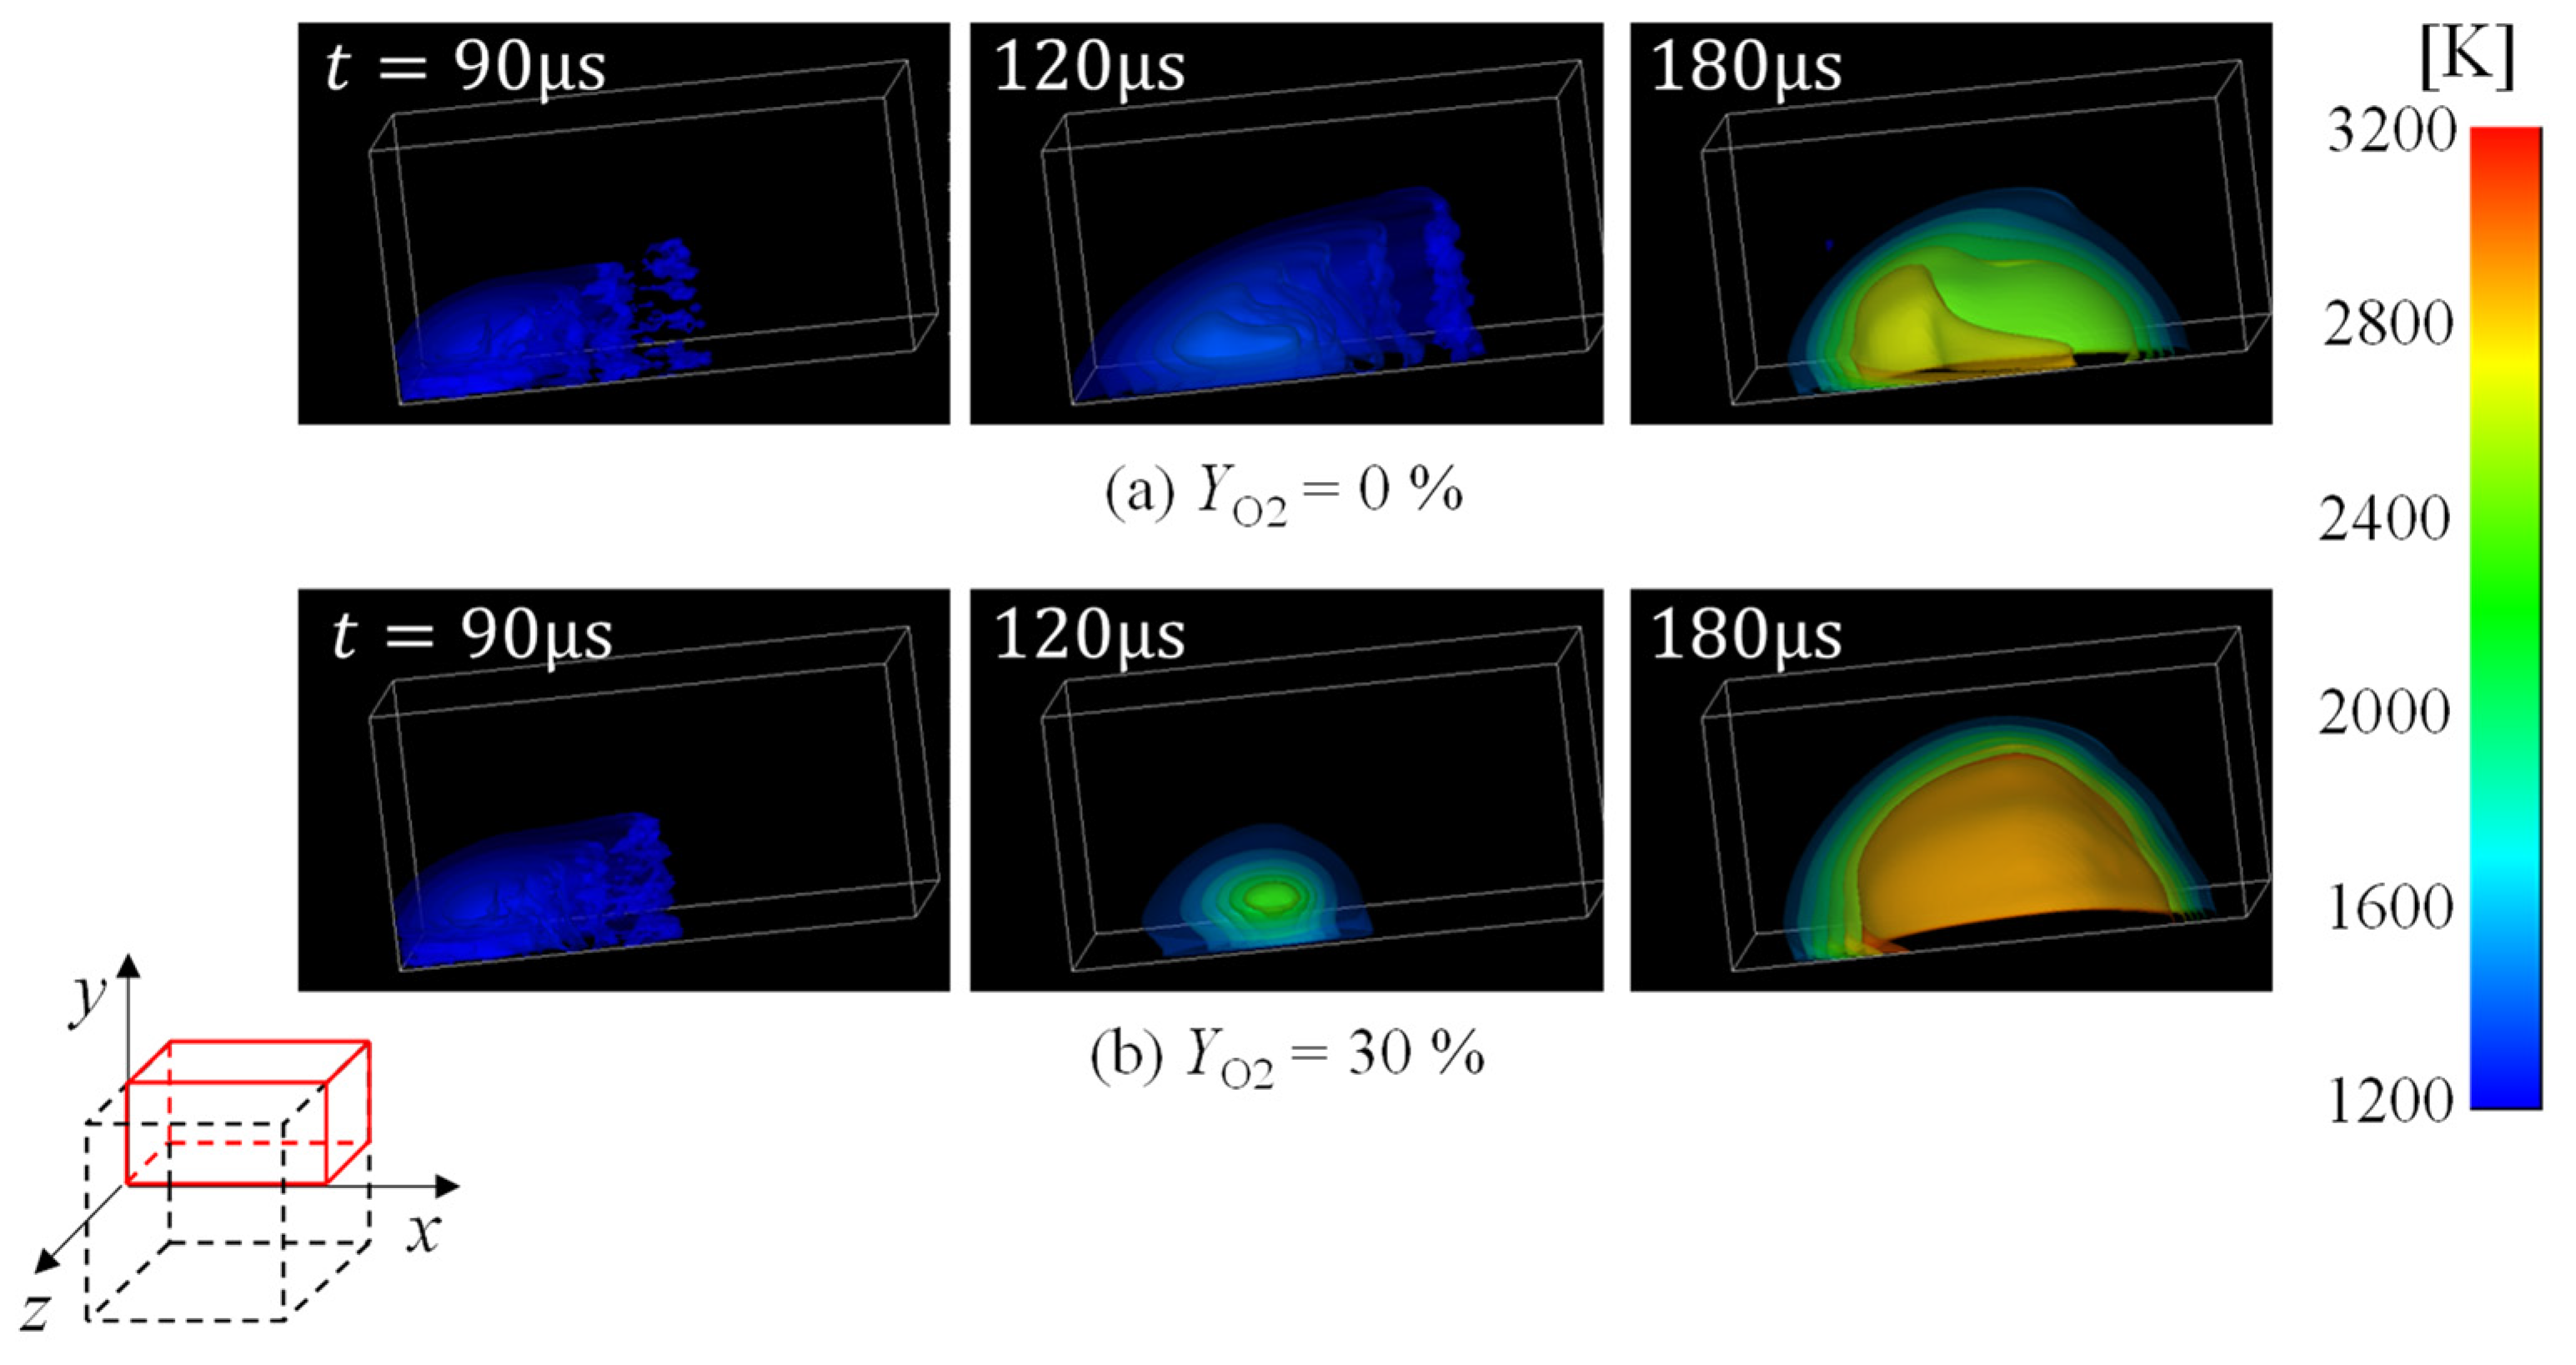
Figure 2a,b show the time-variation of the droplet distribution when the mass fraction of oxygen in the fuel droplet is YO2 = 0 or 30%. For both cases, the initial droplet diameter of d0 is 15 µm, and the number of injected droplets per unit time of n is 20 µs−1. Figure 3 shows the temperature distributions at the same period, which are indicated only for a quarter of the numerical domain (see the red region). Since the fuel injection time is 80 µs, these are the profiles of 10, 40, 100 µs after the end of the fuel injection. It was seen that the droplets were distributed in a conical shape. Before long, the injected droplets evaporate as they move downstream, and the evaporation is completed by t = 180 µs. In the time-variations of the droplet distribution, even when the ultrafine bubbles are added in the fuel droplet, there is no significant difference. On the other hand, as shown in Figure 3, the temperature was still low at t = 120 µs for YO2 = 0% and no ignition occured, whereas for YO2 = 30%, the ignition has already occurred at the upstream edge of the fuel spray. In addition, the earlier temperature increase was observed because the specific heat is smaller when there is oxygen in the fuel droplet. Then, the addition of oxygen in the fuel droplet causes the reduction of the ignition time. Moreover, at t = 180 µs, the maximum temperature for YO2 = 30% was higher.
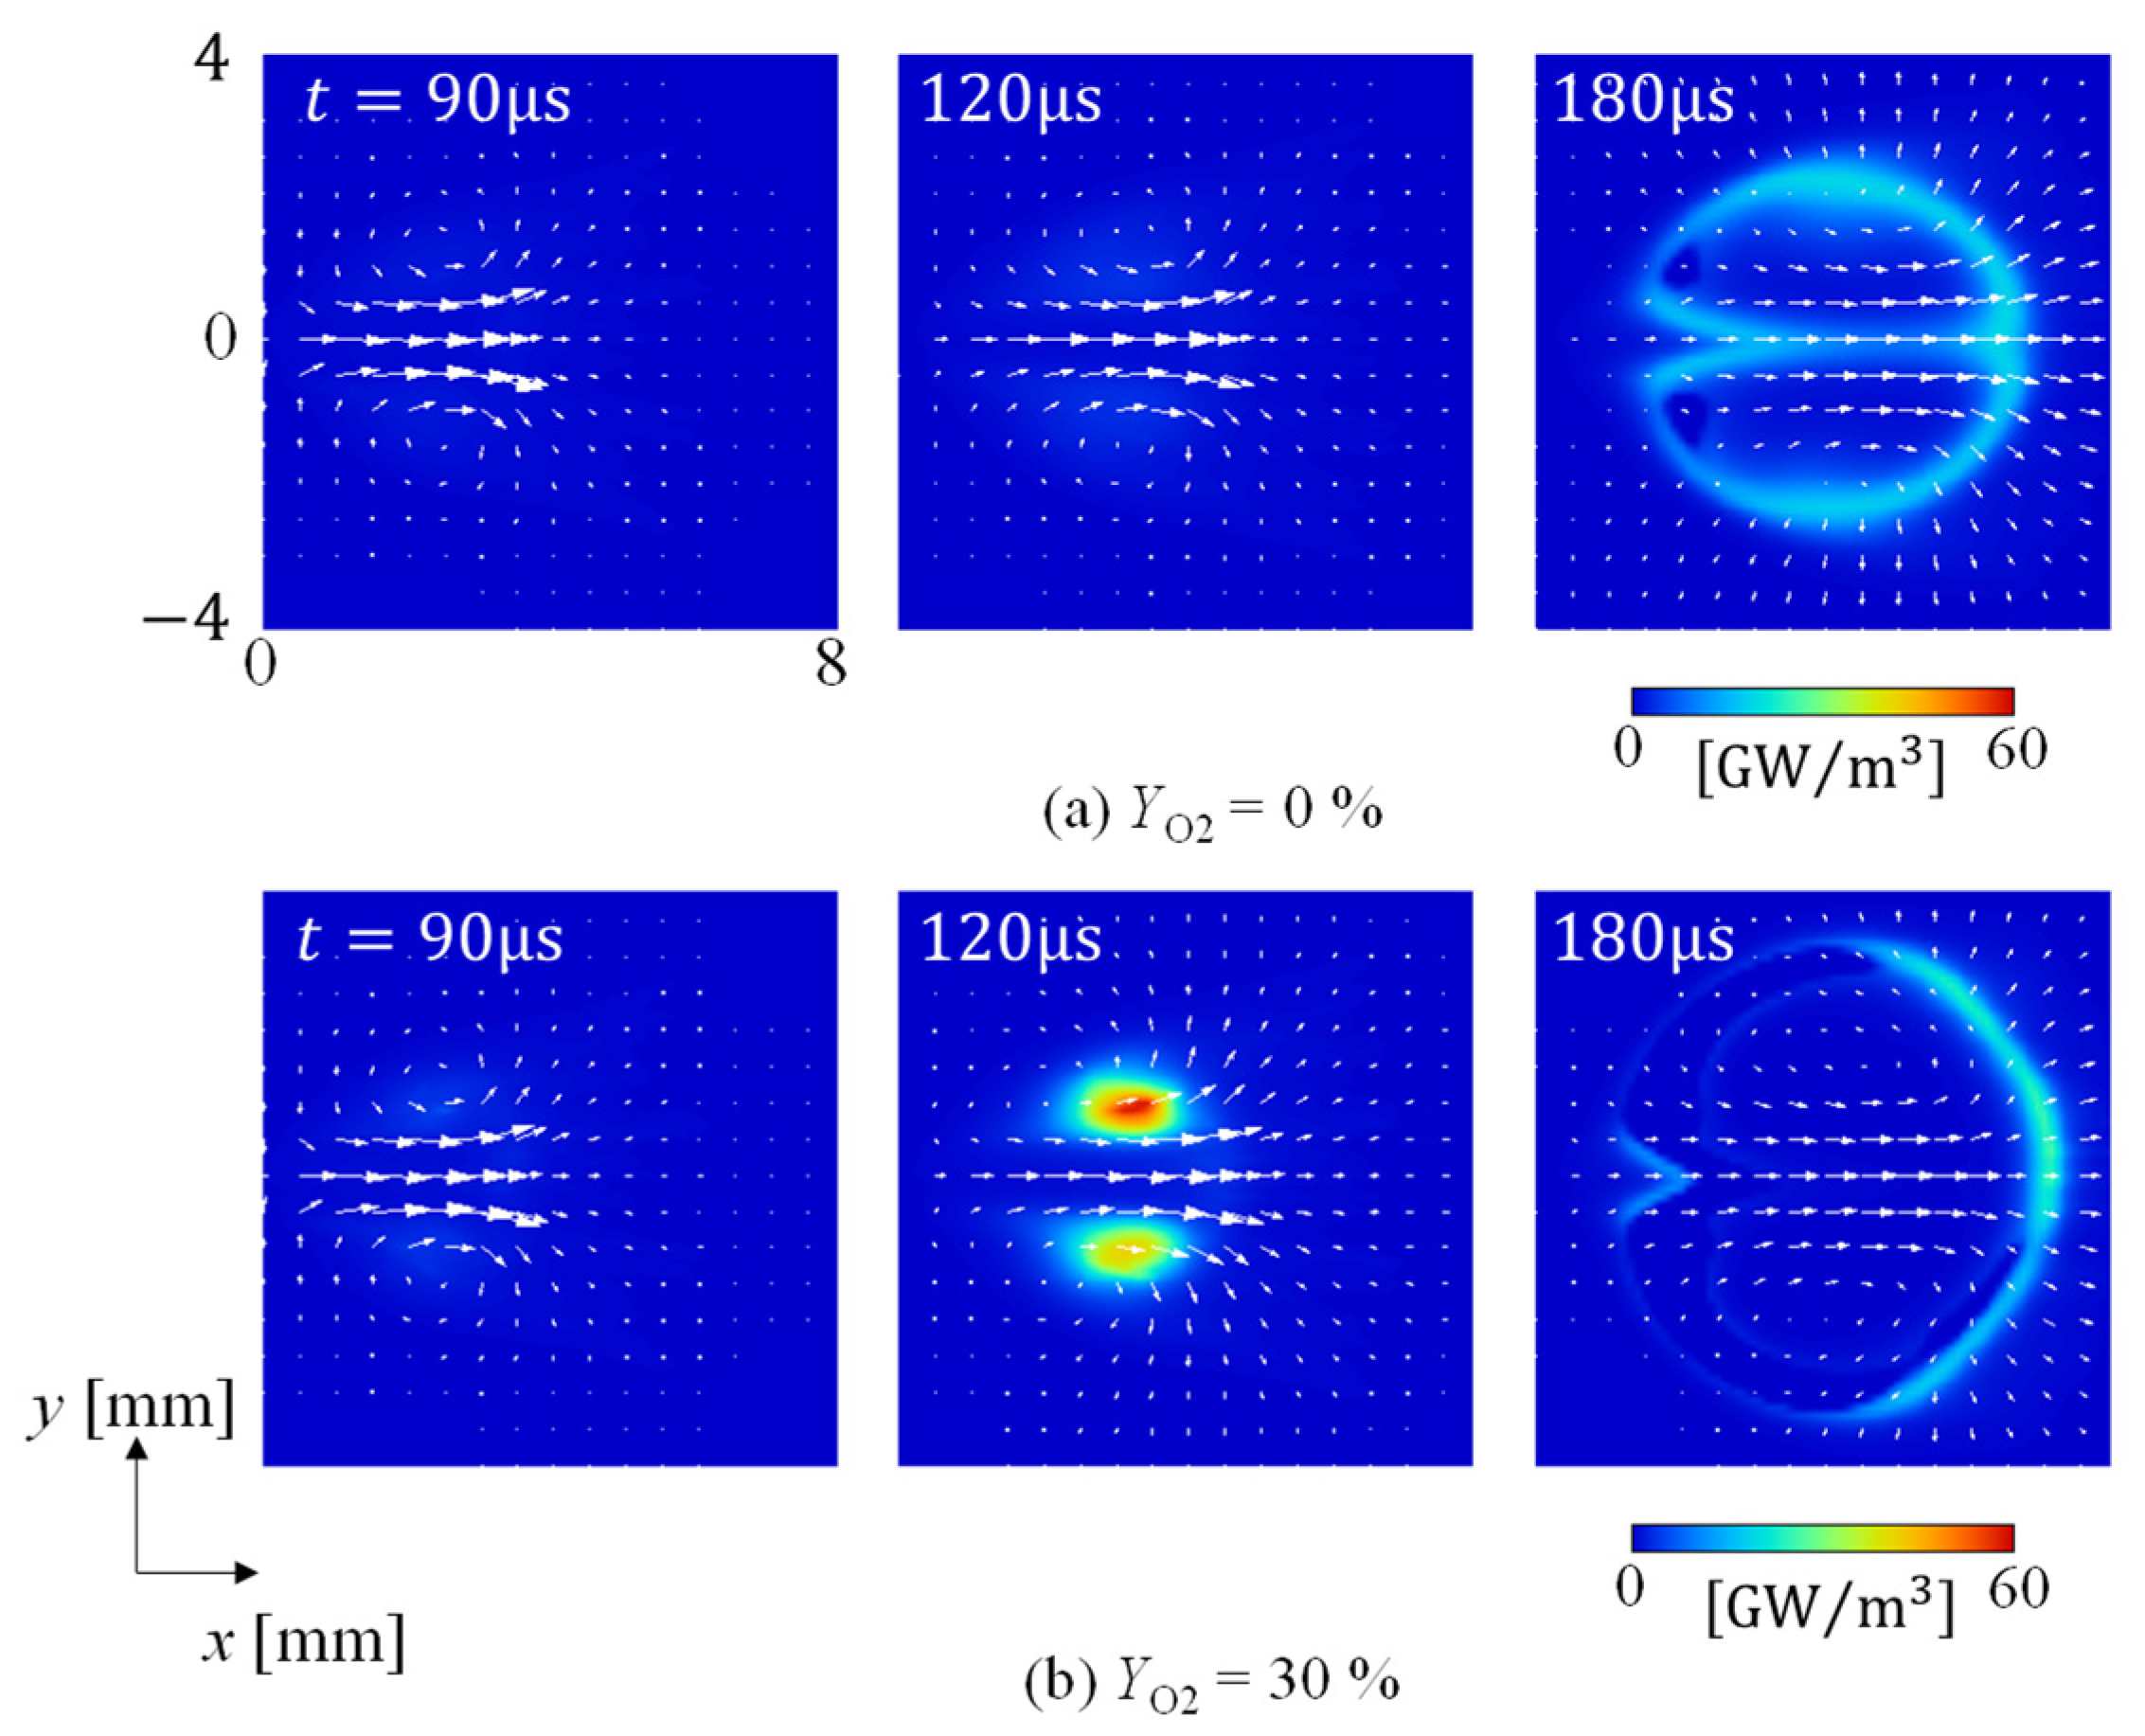
The mass fractions of decane and oxygen at z = 0 mm are shown in Figure 4 and Figure 5 at the same period. Regardless of the value of YO2, the distribution of decane is almost the same at t = 90 and 120 µs. However, at t = 180 µs, the decane mass fraction for YO2 = 30% is smaller at the boundaries of the area where the fuel is present, indicating that more decane is consumed, with the maximum temperature higher in Figure 3. As a result, the area where oxygen is consumed expands in Figure 5. For further discussion, the distributions of the heat release rate at z = 0 mm are shown in Figure 6. It is seen that, for YO2 = 0%, the heat release rate is almost zero at t = 120 µs, while for YO2 = 30%, there is a region of large heat release rate, where oxygen is consumed in Figure 5. Thus, it was found that the addition of ultrafine oxygen bubbles to the fuel droplet promotes the consumption of decane and oxygen.
To distinguish areas of the diffusion flame and the premixed flame, a flame index is used, which is defined by the following equation [47,50].
G F O = grad Y F · grad Y O     ( q / q max > 0.01 )
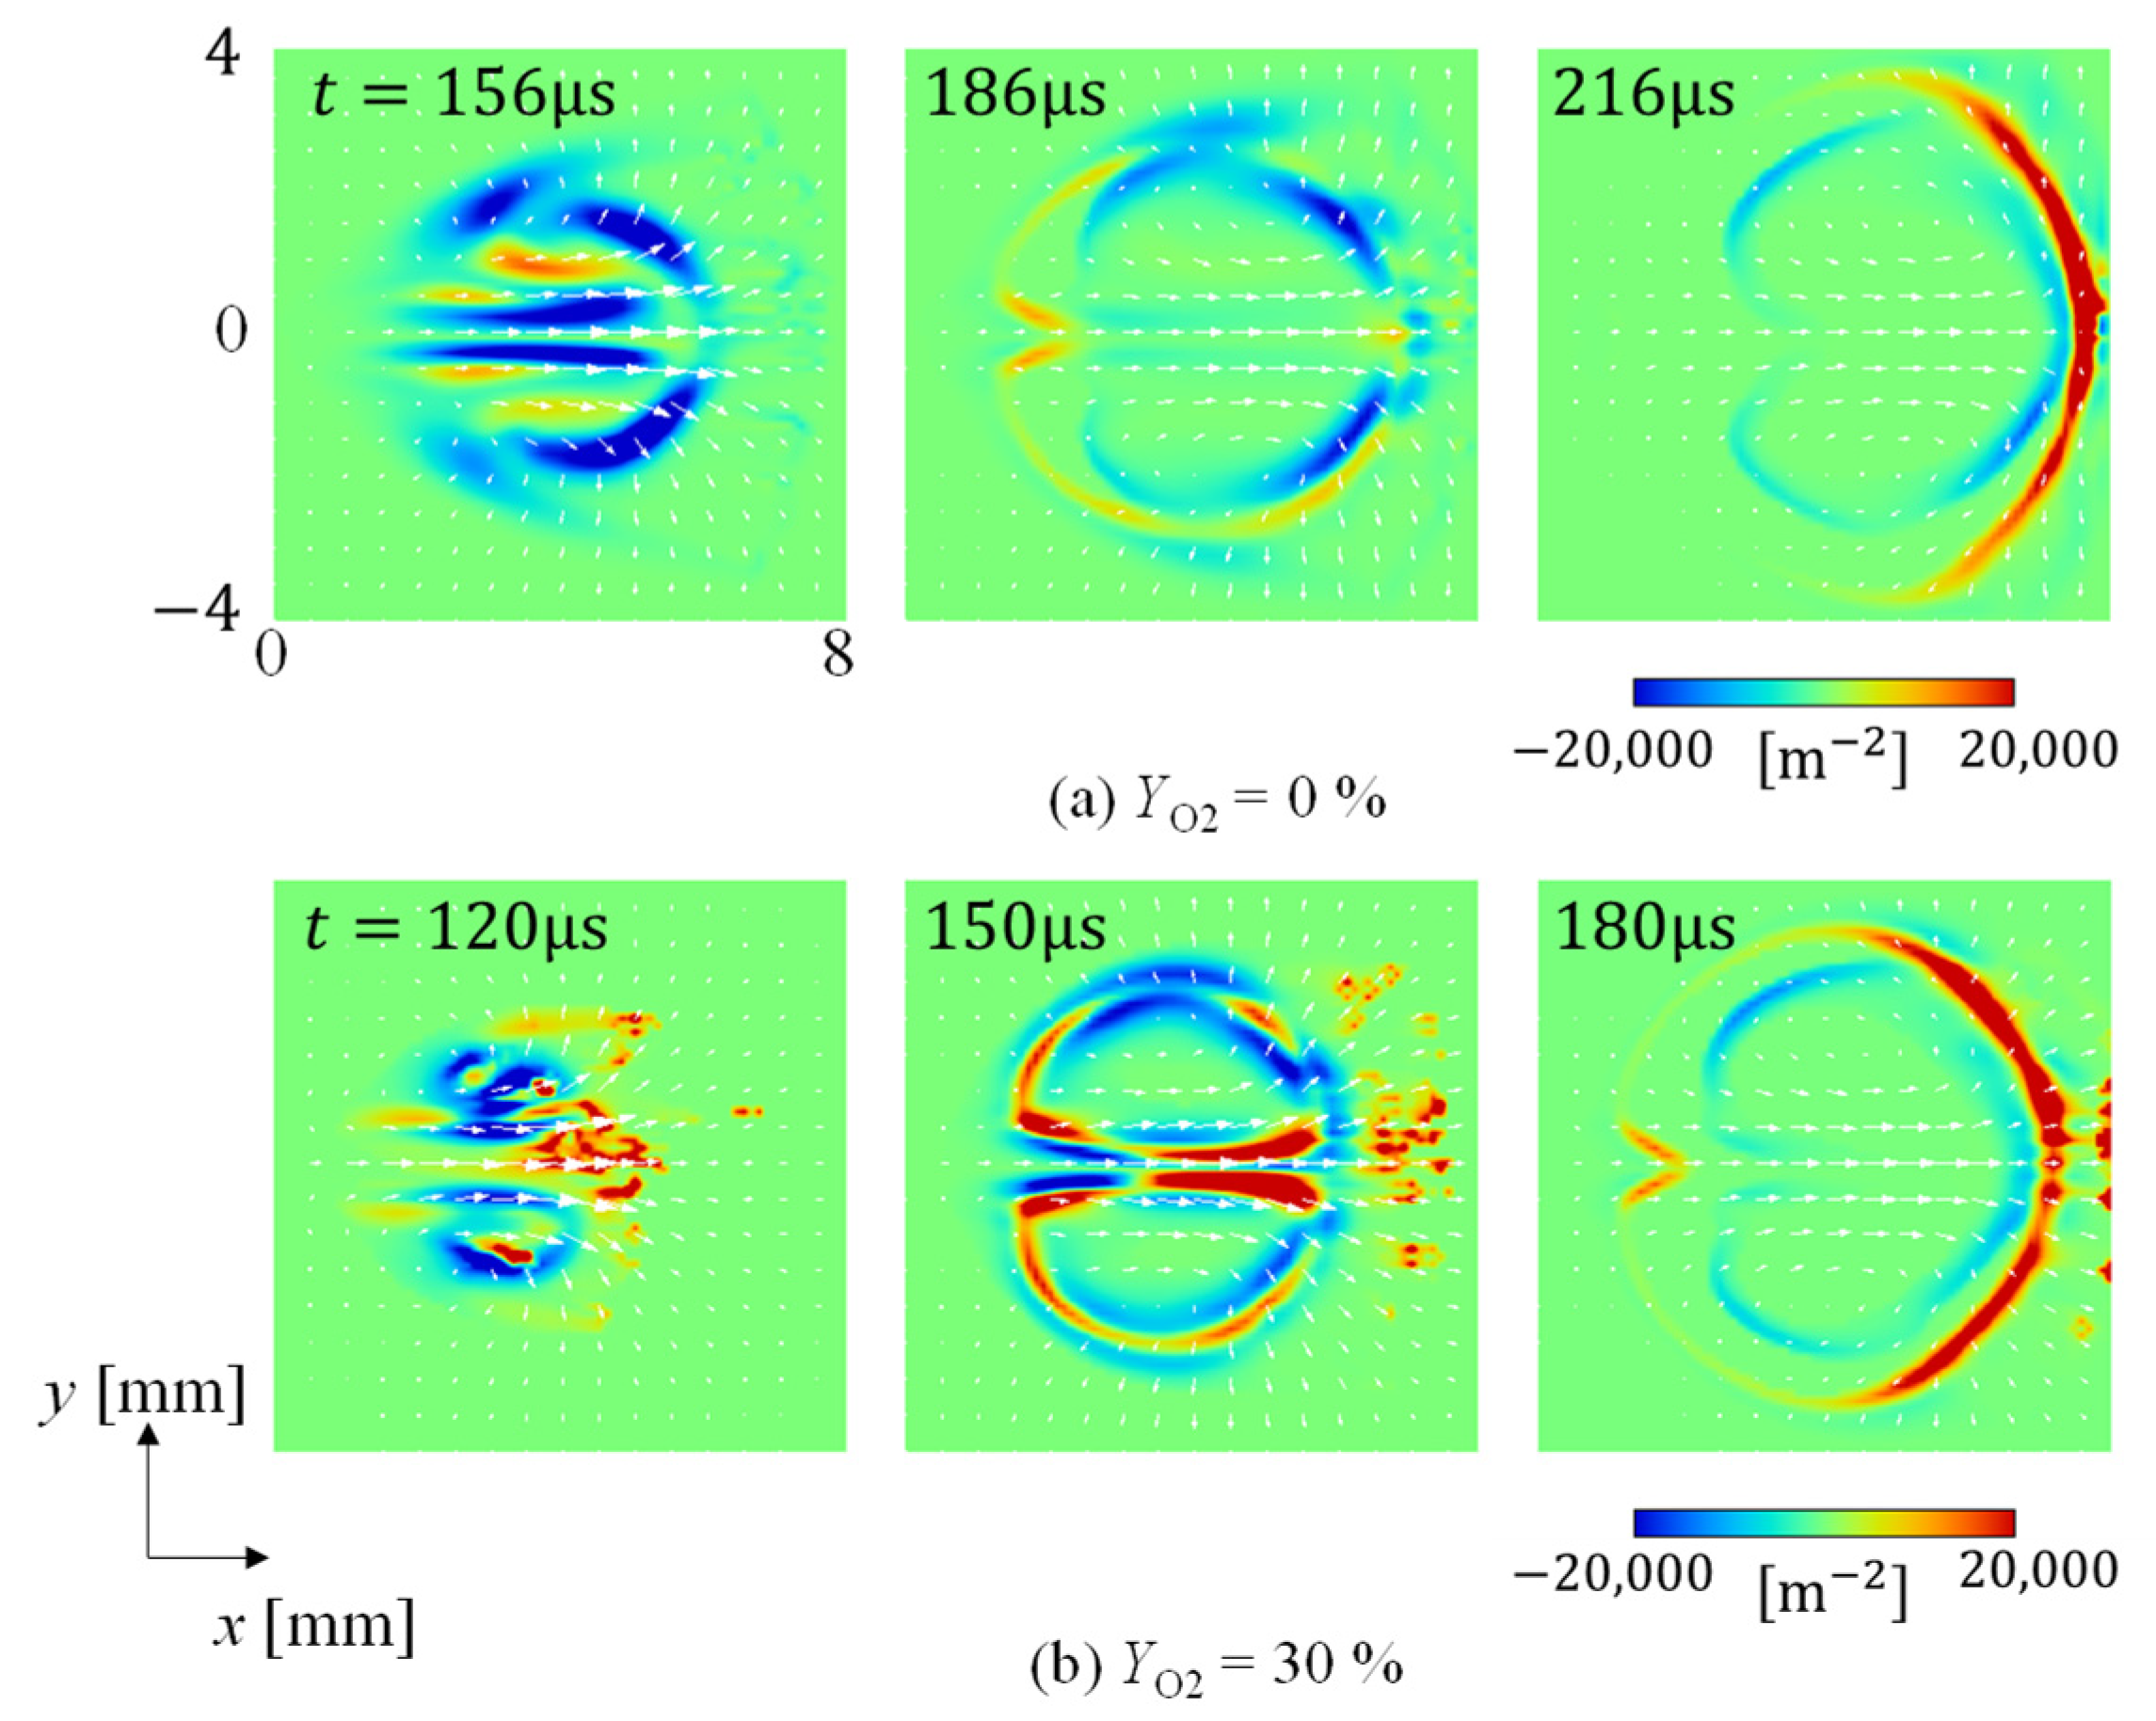
where YF and YO are the mass fractions of fuel and oxidizer (oxygen), respectively. Here, q is the heat release rate. The area of the negative flame index indicates the diffusion flame and that of the positive flame index indicates the premixed flame. The larger absolute value of the flame index corresponds to a higher reaction rate. Figure 7 shows the flame index distribution right after the ignition for YO2 = 0% and 30%. As explained later, the ignition times is 156 µs for YO2 = 0%, and for YO2 = 30% is 120 µs. As shown in the flame index at t = 156 µs for YO2 = 0%, the diffusion flame is dominant, and the inner premixed flame is small. Since there is no oxygen in the fuel droplet, most of the flames are the diffusion flame, except that there is the premixed flame of the unburned fuel reacted with oxygen in the ambient air at t = 216 µs. On the other hand, for YO2 = 30% at t = 120 µs, the ignition occurred around the center where the premixed flames are formed, which are located at the upstream edge of the fuel spray in Figure 2b. This is because the flammable mixture of the evaporated fuel and oxygen of the fuel droplet exists [50]. Simultaneously, the diffusion flame is observed outside the premixed flame. Even at the period of 30 µs after ignition (t = 150 µs), the premixed flame still exists. When 60 µs has passed after the ignition (t = 180 µs), the inner premixed flame disappears, and only the outer diffusion flame remains, followed by the premixed flame.
To summarize, it was derived that addition of ultrafine oxygen bubbles to the fuel droplet causes the formation of the premixed flame, resulting in the reduction of the ignition time. This finding will be discussed in the next section.

3.2. Effects of Oxygen Concentration in Fuel Droplet

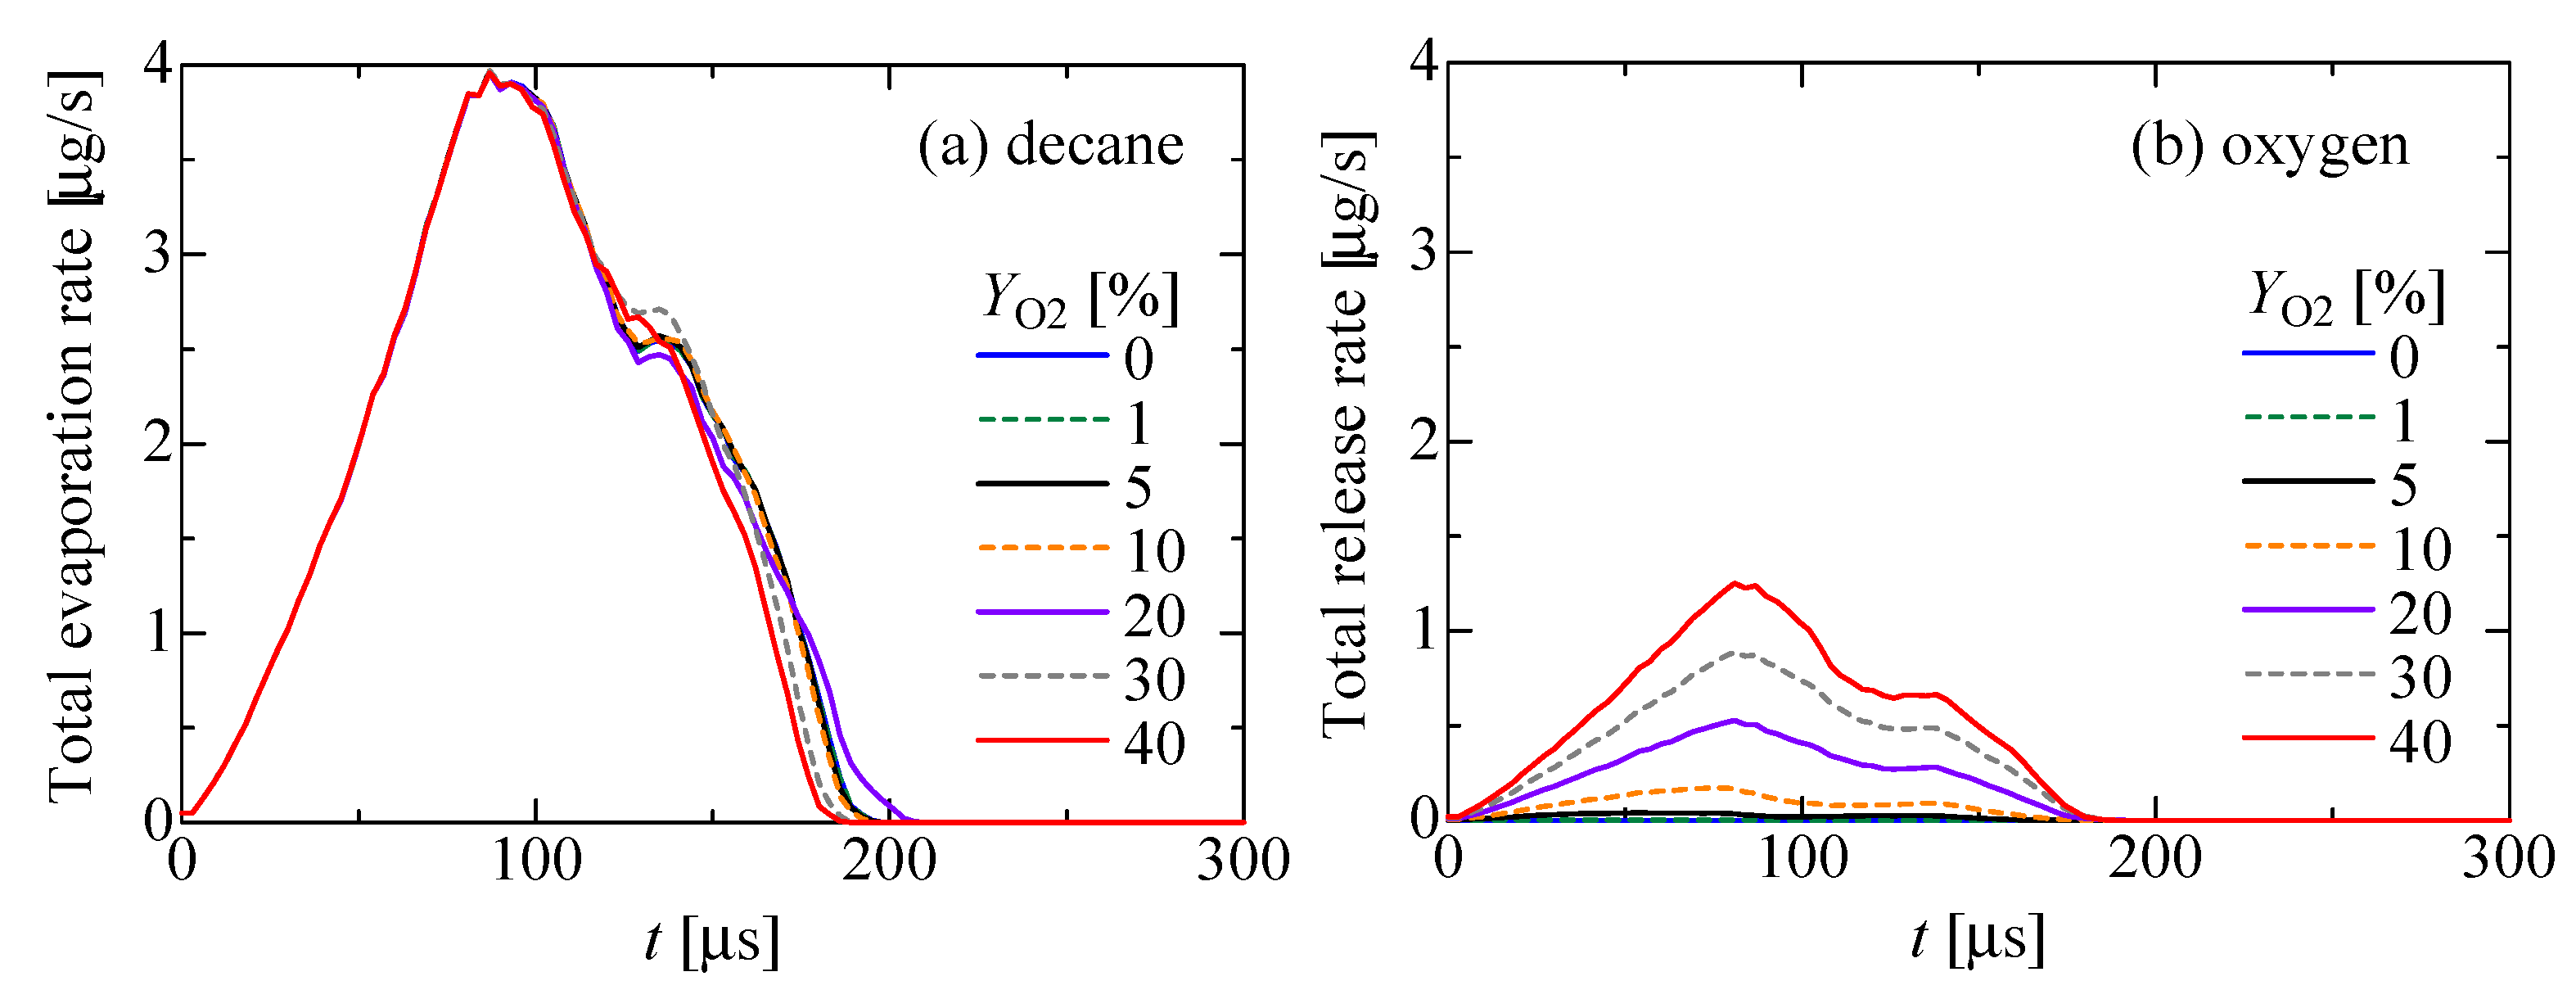
Next, we examined the effects of YO2 on the fuel evaporation rate, the ignition time, and the temperature field in detail. Figure 8a,b show the time-variation of the total decane evaporation rate and the total oxygen release rate, which are the integrated value in the whole numerical domain. Independent of oxygen in the fuel droplet, it was seen that both rates reach the maximum around t = 90 µs. After t = 90 µs, they decrease simply because roughly half of the fuel droplets have already evaporated. At t = 180 µs, decane and oxygen in the fuel droplet are fully evaporated. It seems that the addition of ultrafine oxygen bubbles does not greatly alter the fuel evaporation rate.
Here, we discuss the effect of oxygen added in the fuel droplet. Based on Figure 8a, the time-variation of the total decane evaporation rate does not change even if oxygen exists in the fuel droplet until t = 120 µs. After that, as more oxygen is added, the total decane evaporation rate drops more quickly. Then, it was derived that added oxygen promotes the fuel evaporation rate. On the other hand, based on the time-variation of the oxygen release rate in Figure 8b, the oxygen release rate is simply larger for increasing YO2. It looks reasonable because more oxygen is produced from the fuel droplet at larger YO2.
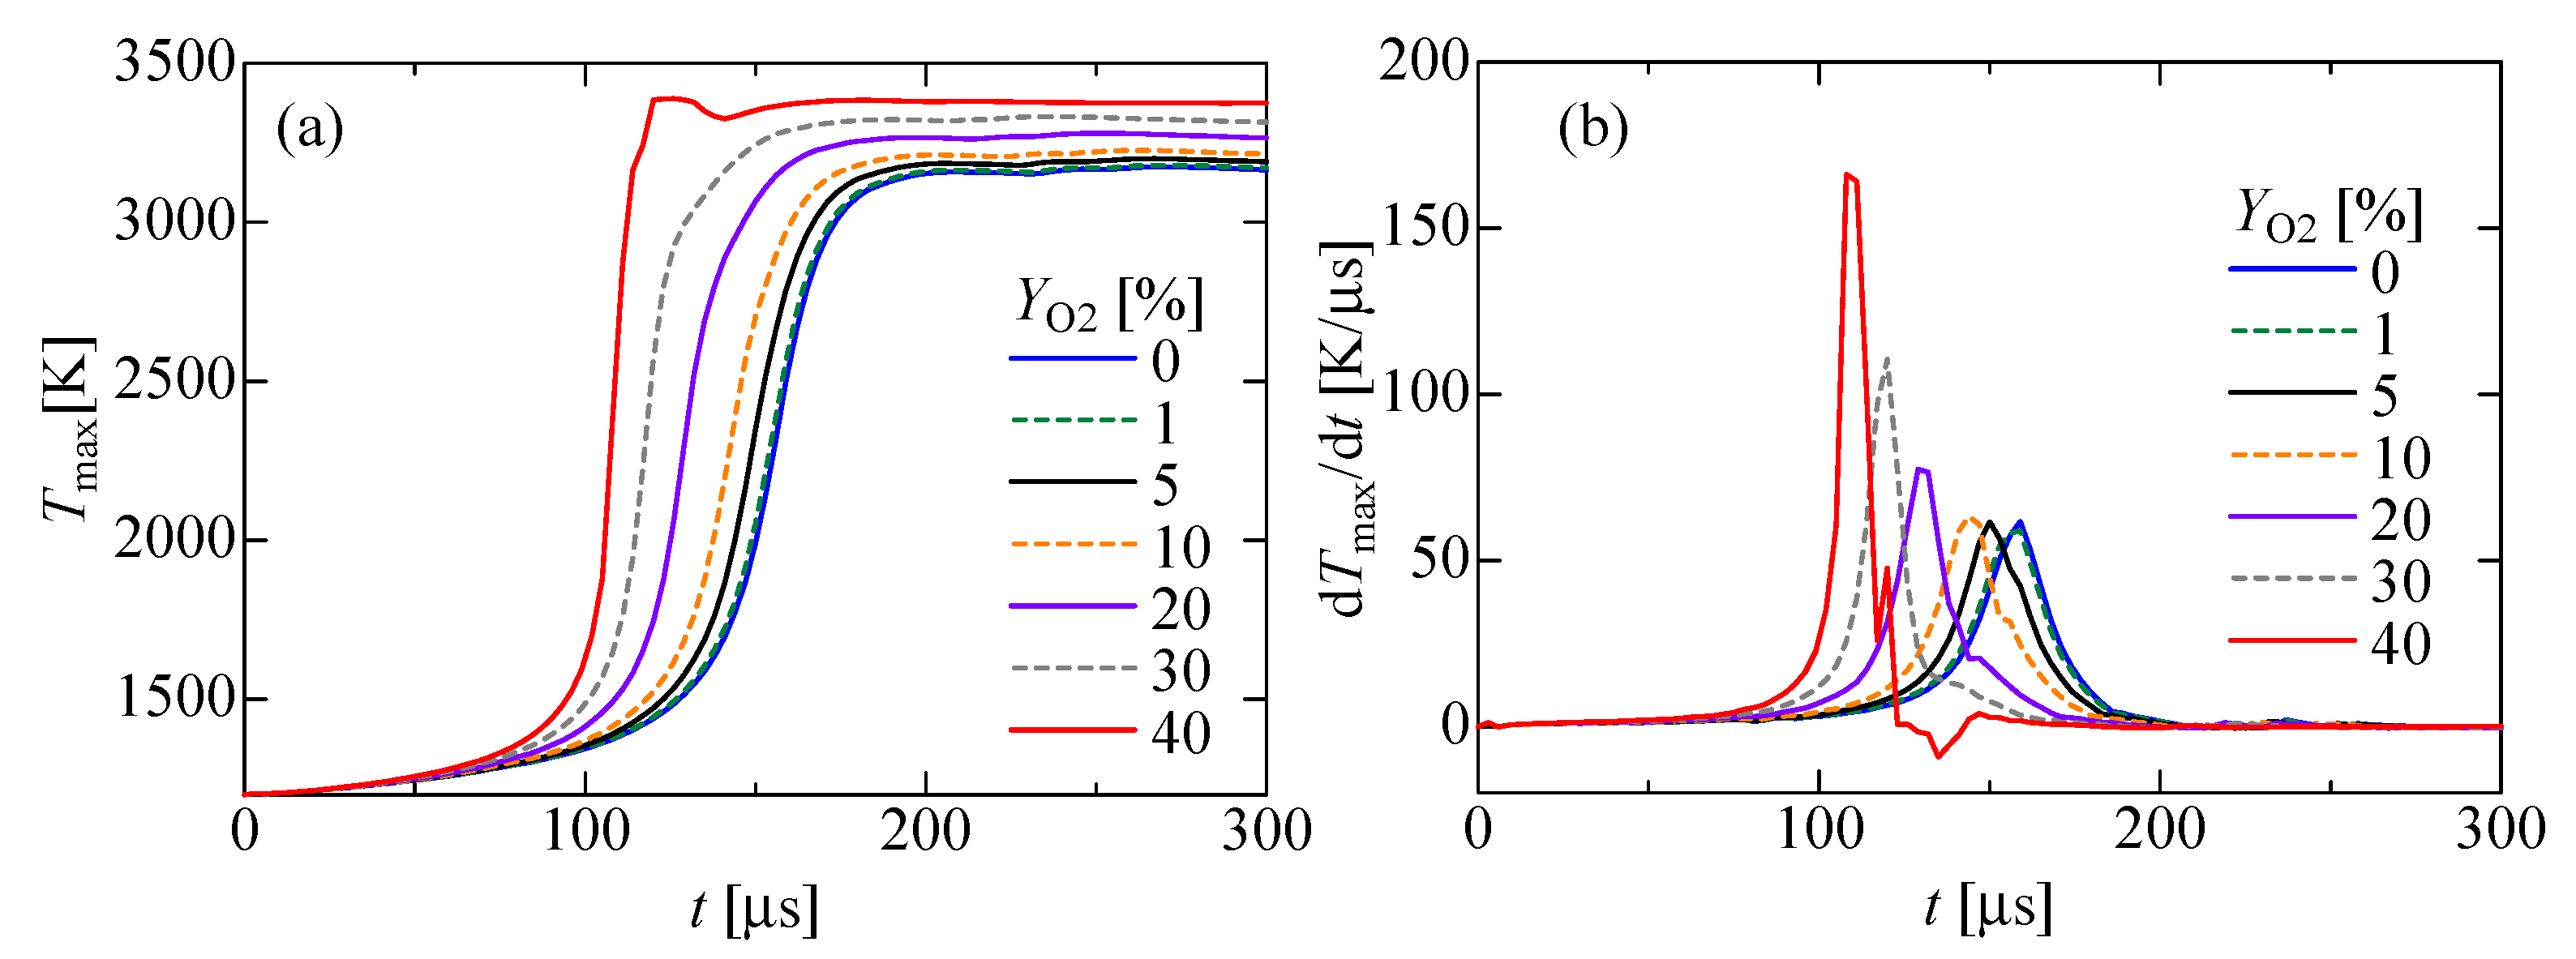
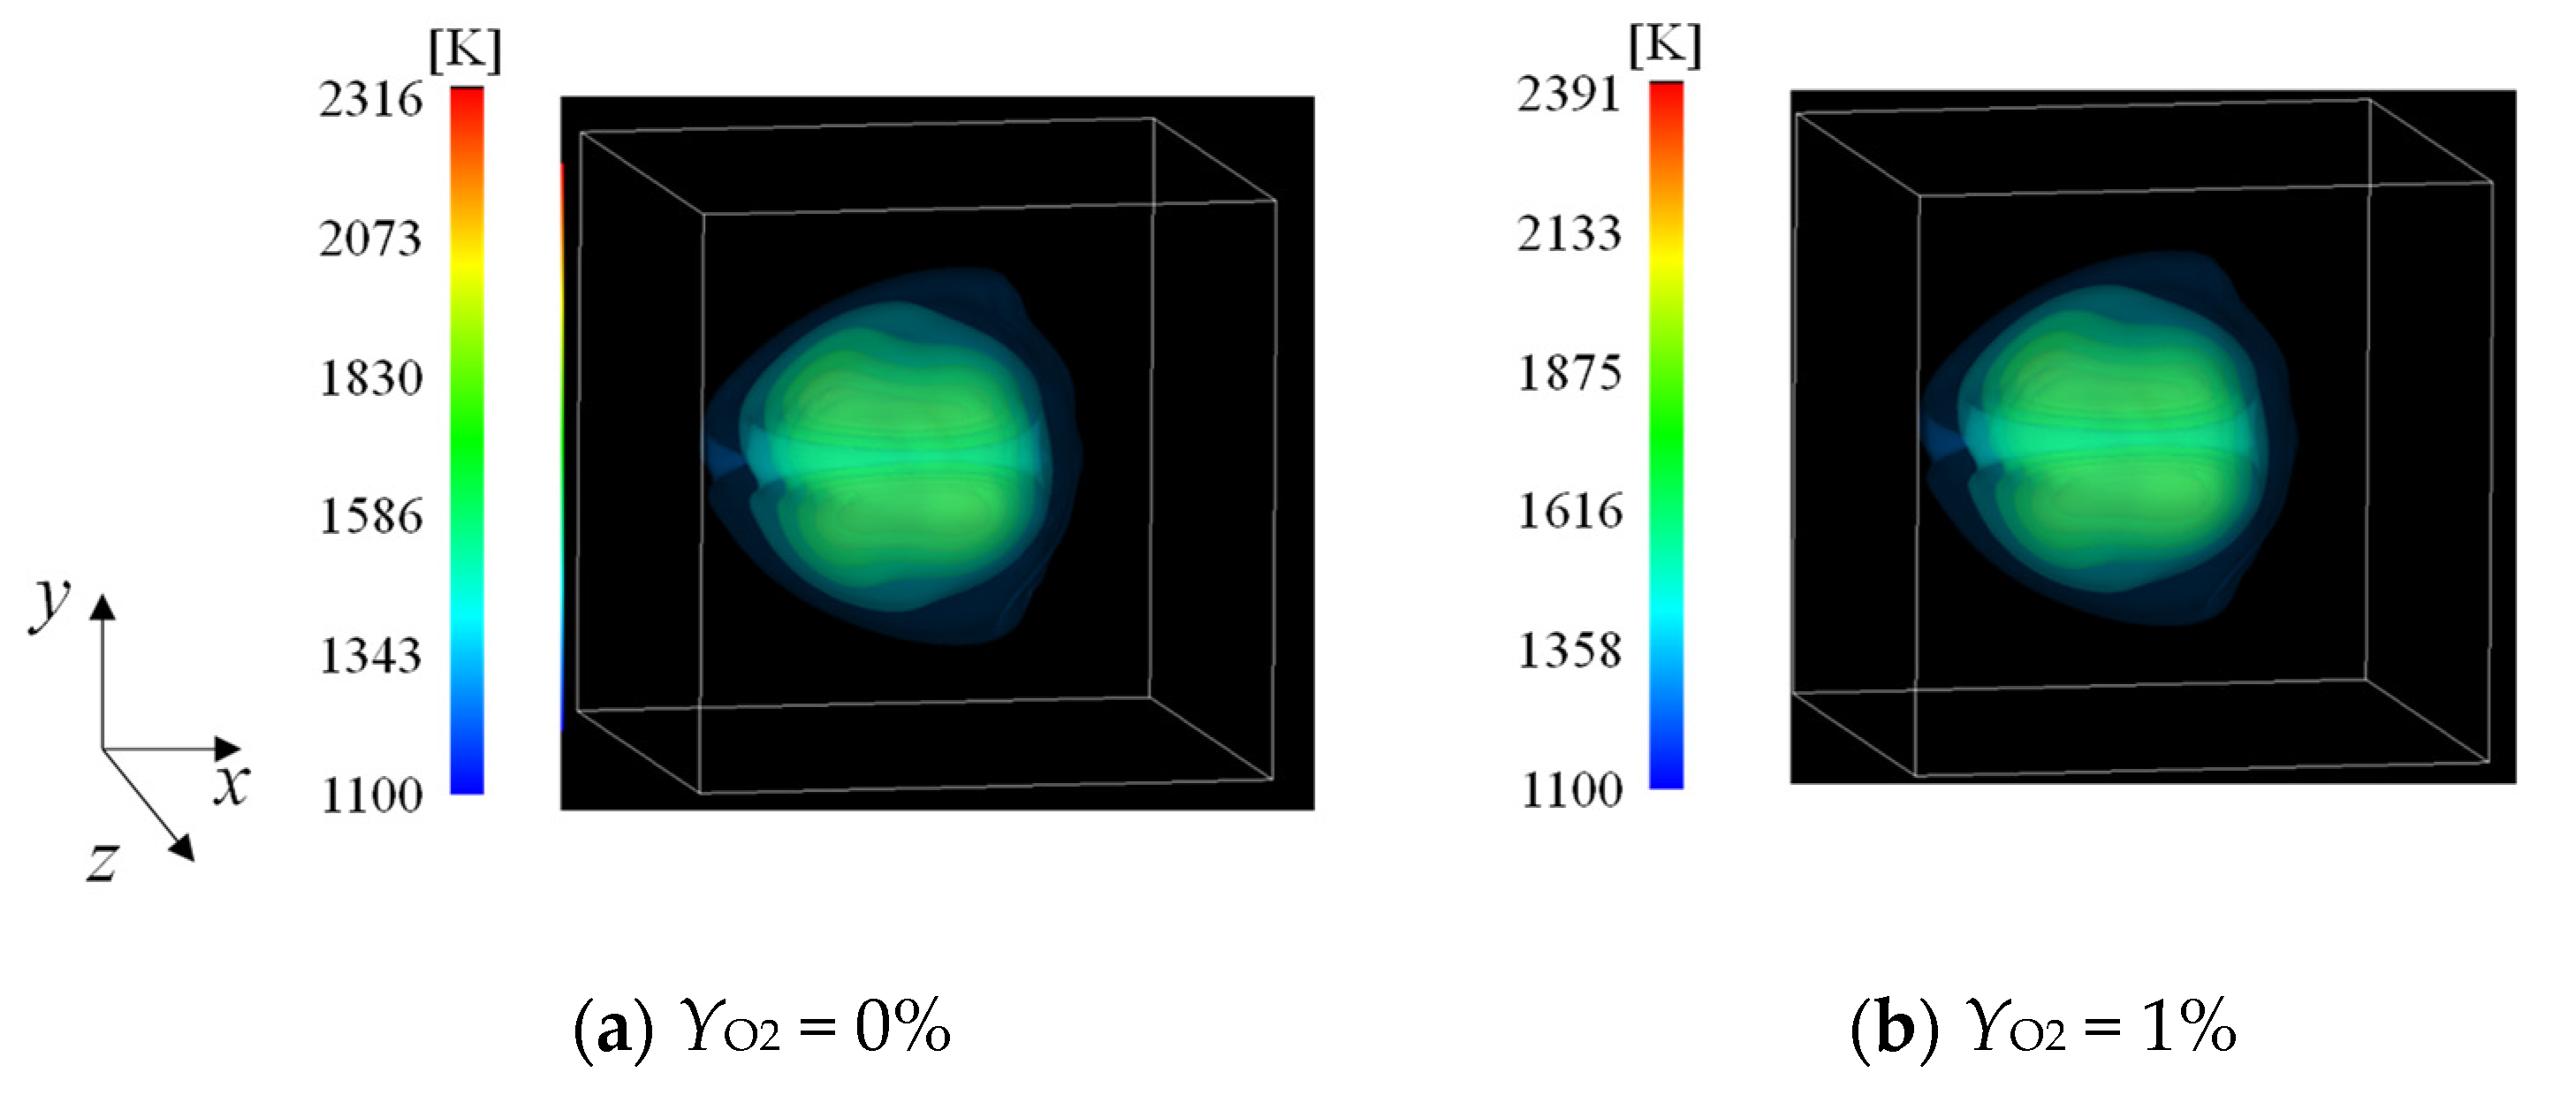
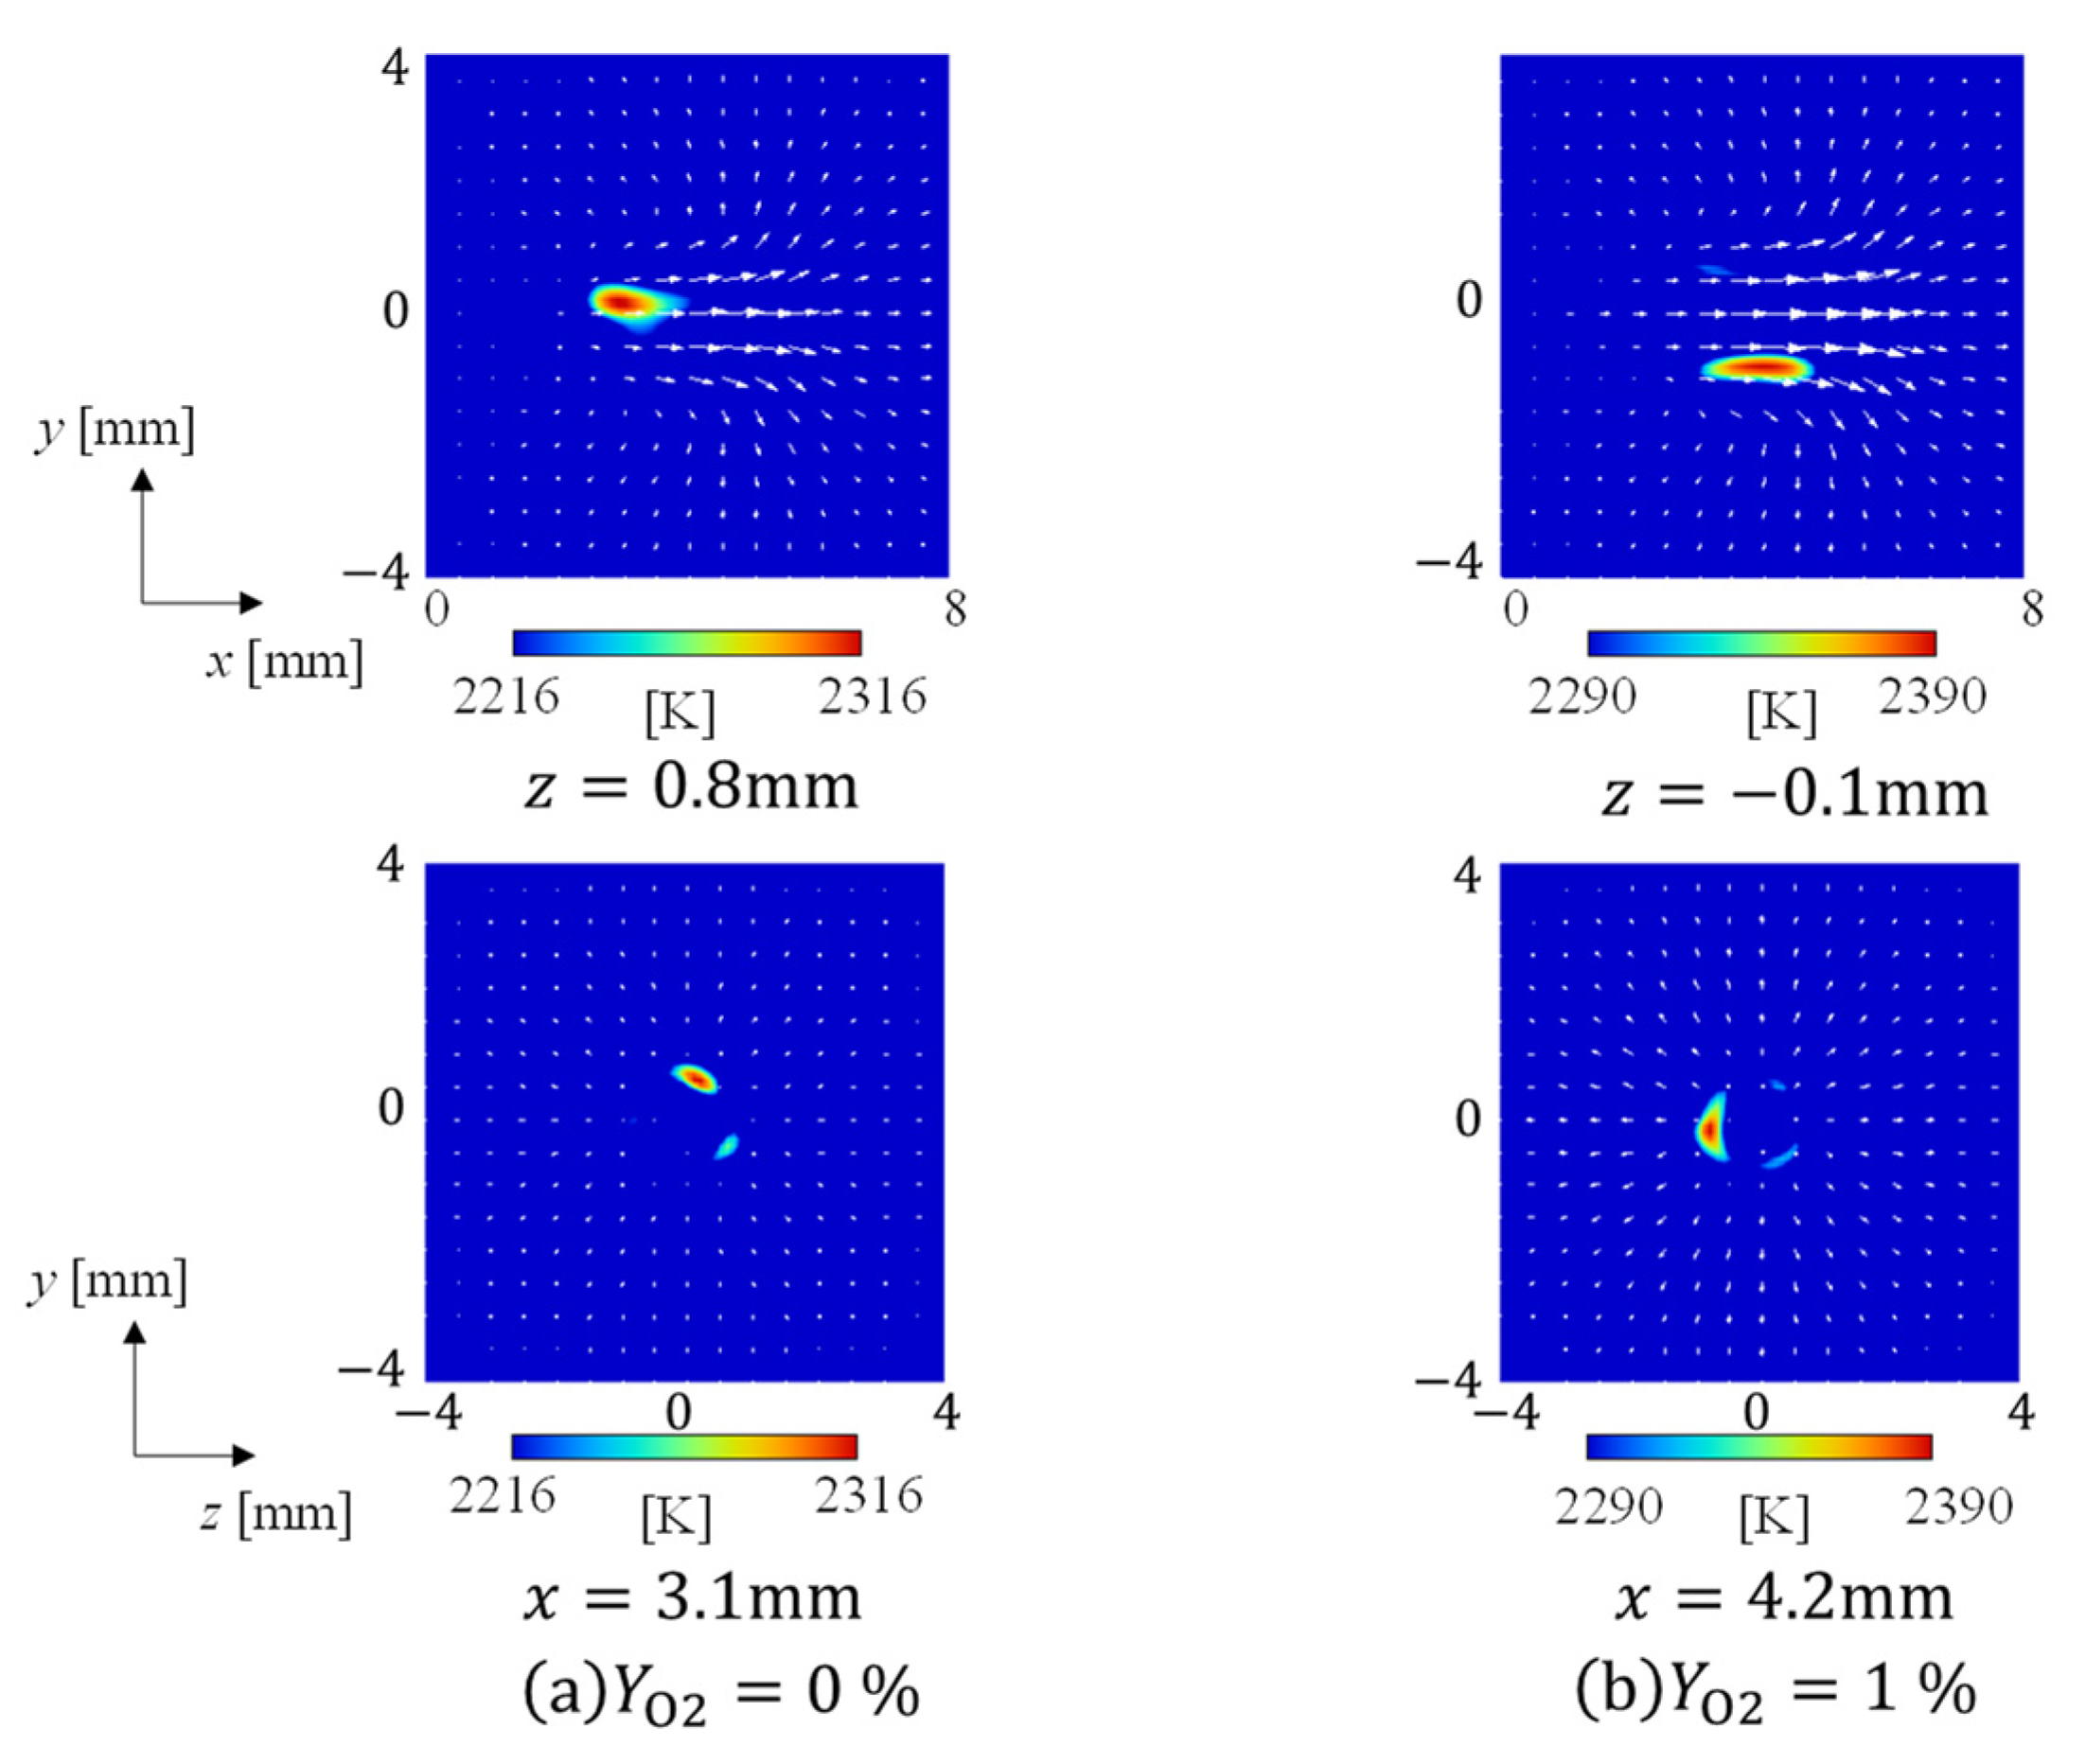
For further discussion, the time-variation of the maximum temperature was examined. Results for YO2 = 0~40% are shown in Figure 9a, together with the time-derivative of the maximum temperature in Figure 9b. As more oxygen exists in the fuel droplet, the maximum temperature increases. Resultantly, the ignition time was expected to be shorter. Then, we examined the effect of YO2 on the ignition time, ti. Results are shown in Figure 10. The ignition time decreases at larger YO2. As discussed in Section 3.1, when more oxygen is produced from the droplets, the premixed flame is formed. Needless to say, ignition occurs at the region where the flammable mixture is formed [44,50,56,57]. In experiments [34], the ignition time is also shortened even at the condition of YO2 = 1%. Then, the temperature distributions were compared at t = 156 µs, corresponding to the period right after the ignition for YO2 = 0 and 1%. Figure 11 shows the three-dimensional temperature distributions at t = 156 μs for d0 = 15 µm, n = 20 µs−1. Figure 12 shows the two-dimensional cross-sectional x-y and y-z planes across the ignition point, where only the high temperature region is shown. It was found that, dependent on YO2, the ignition point slightly changes. That is, for YO2 = 0%, the ignition point is located at x = 3.1 mm, y = 0 mm, z = 0.8 mm, whereas that for YO2 = 1% is located at x = 4.3 mm, y = −1.2 mm, z = −0.1 mm. Therefore, it seems that the ignition time is determined by the period when the flammable mixture is formed.
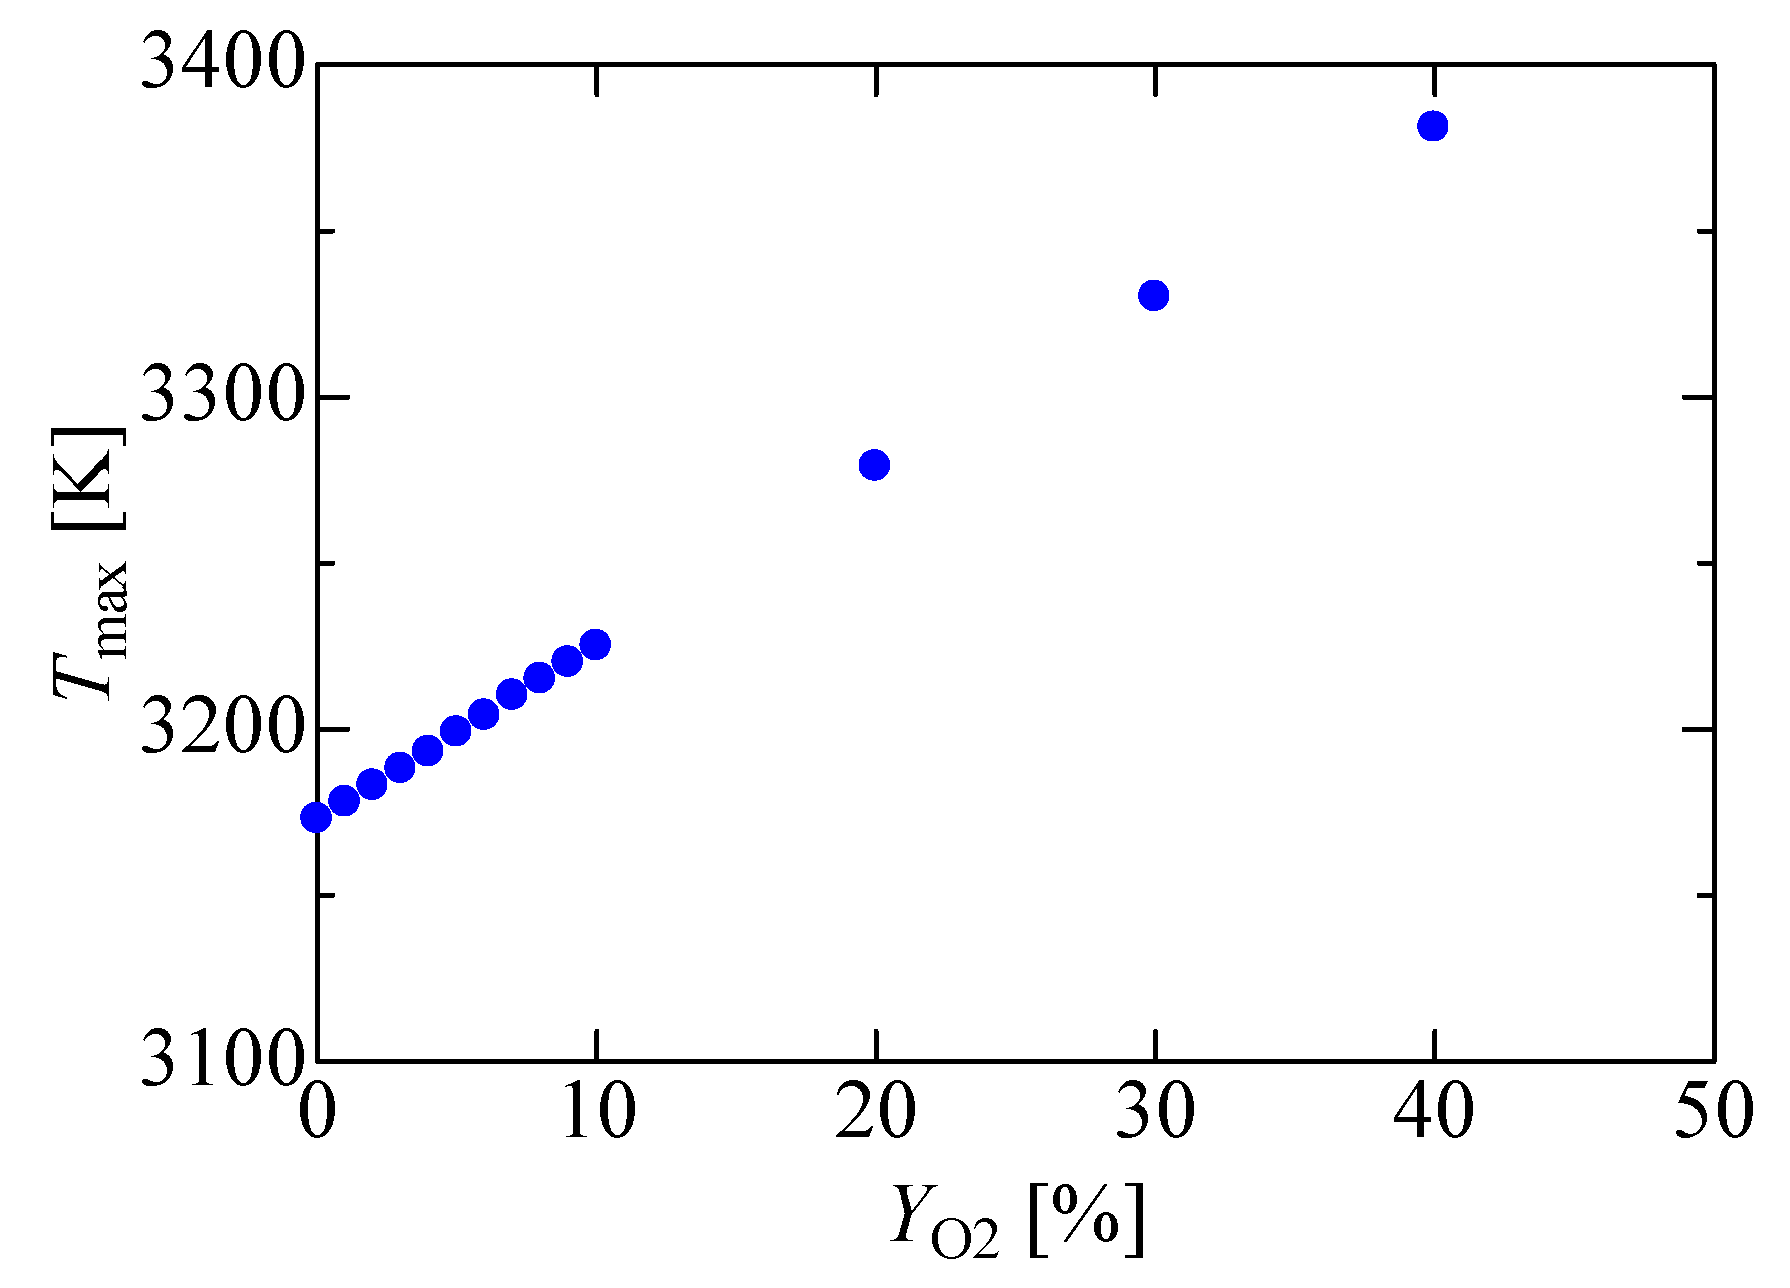
For further investigation, the maximum temperature, Tmax, was plotted by changing the oxygen mass fraction in the fuel droplet. Results are shown in Figure 13. Interestingly, the maximum temperature linearly increases at larger YO2. Therefore, even when there is a small amount of oxygen in the fuel droplet, the flammable mixture is easily formed in the region where the fuel coexists with oxygen. Resultantly, the steep temperature rise is shown in Figure 9b, with the ignition time shorter.

3.3. Effects of Diameter and Number of Injected Droplets per Unit Time

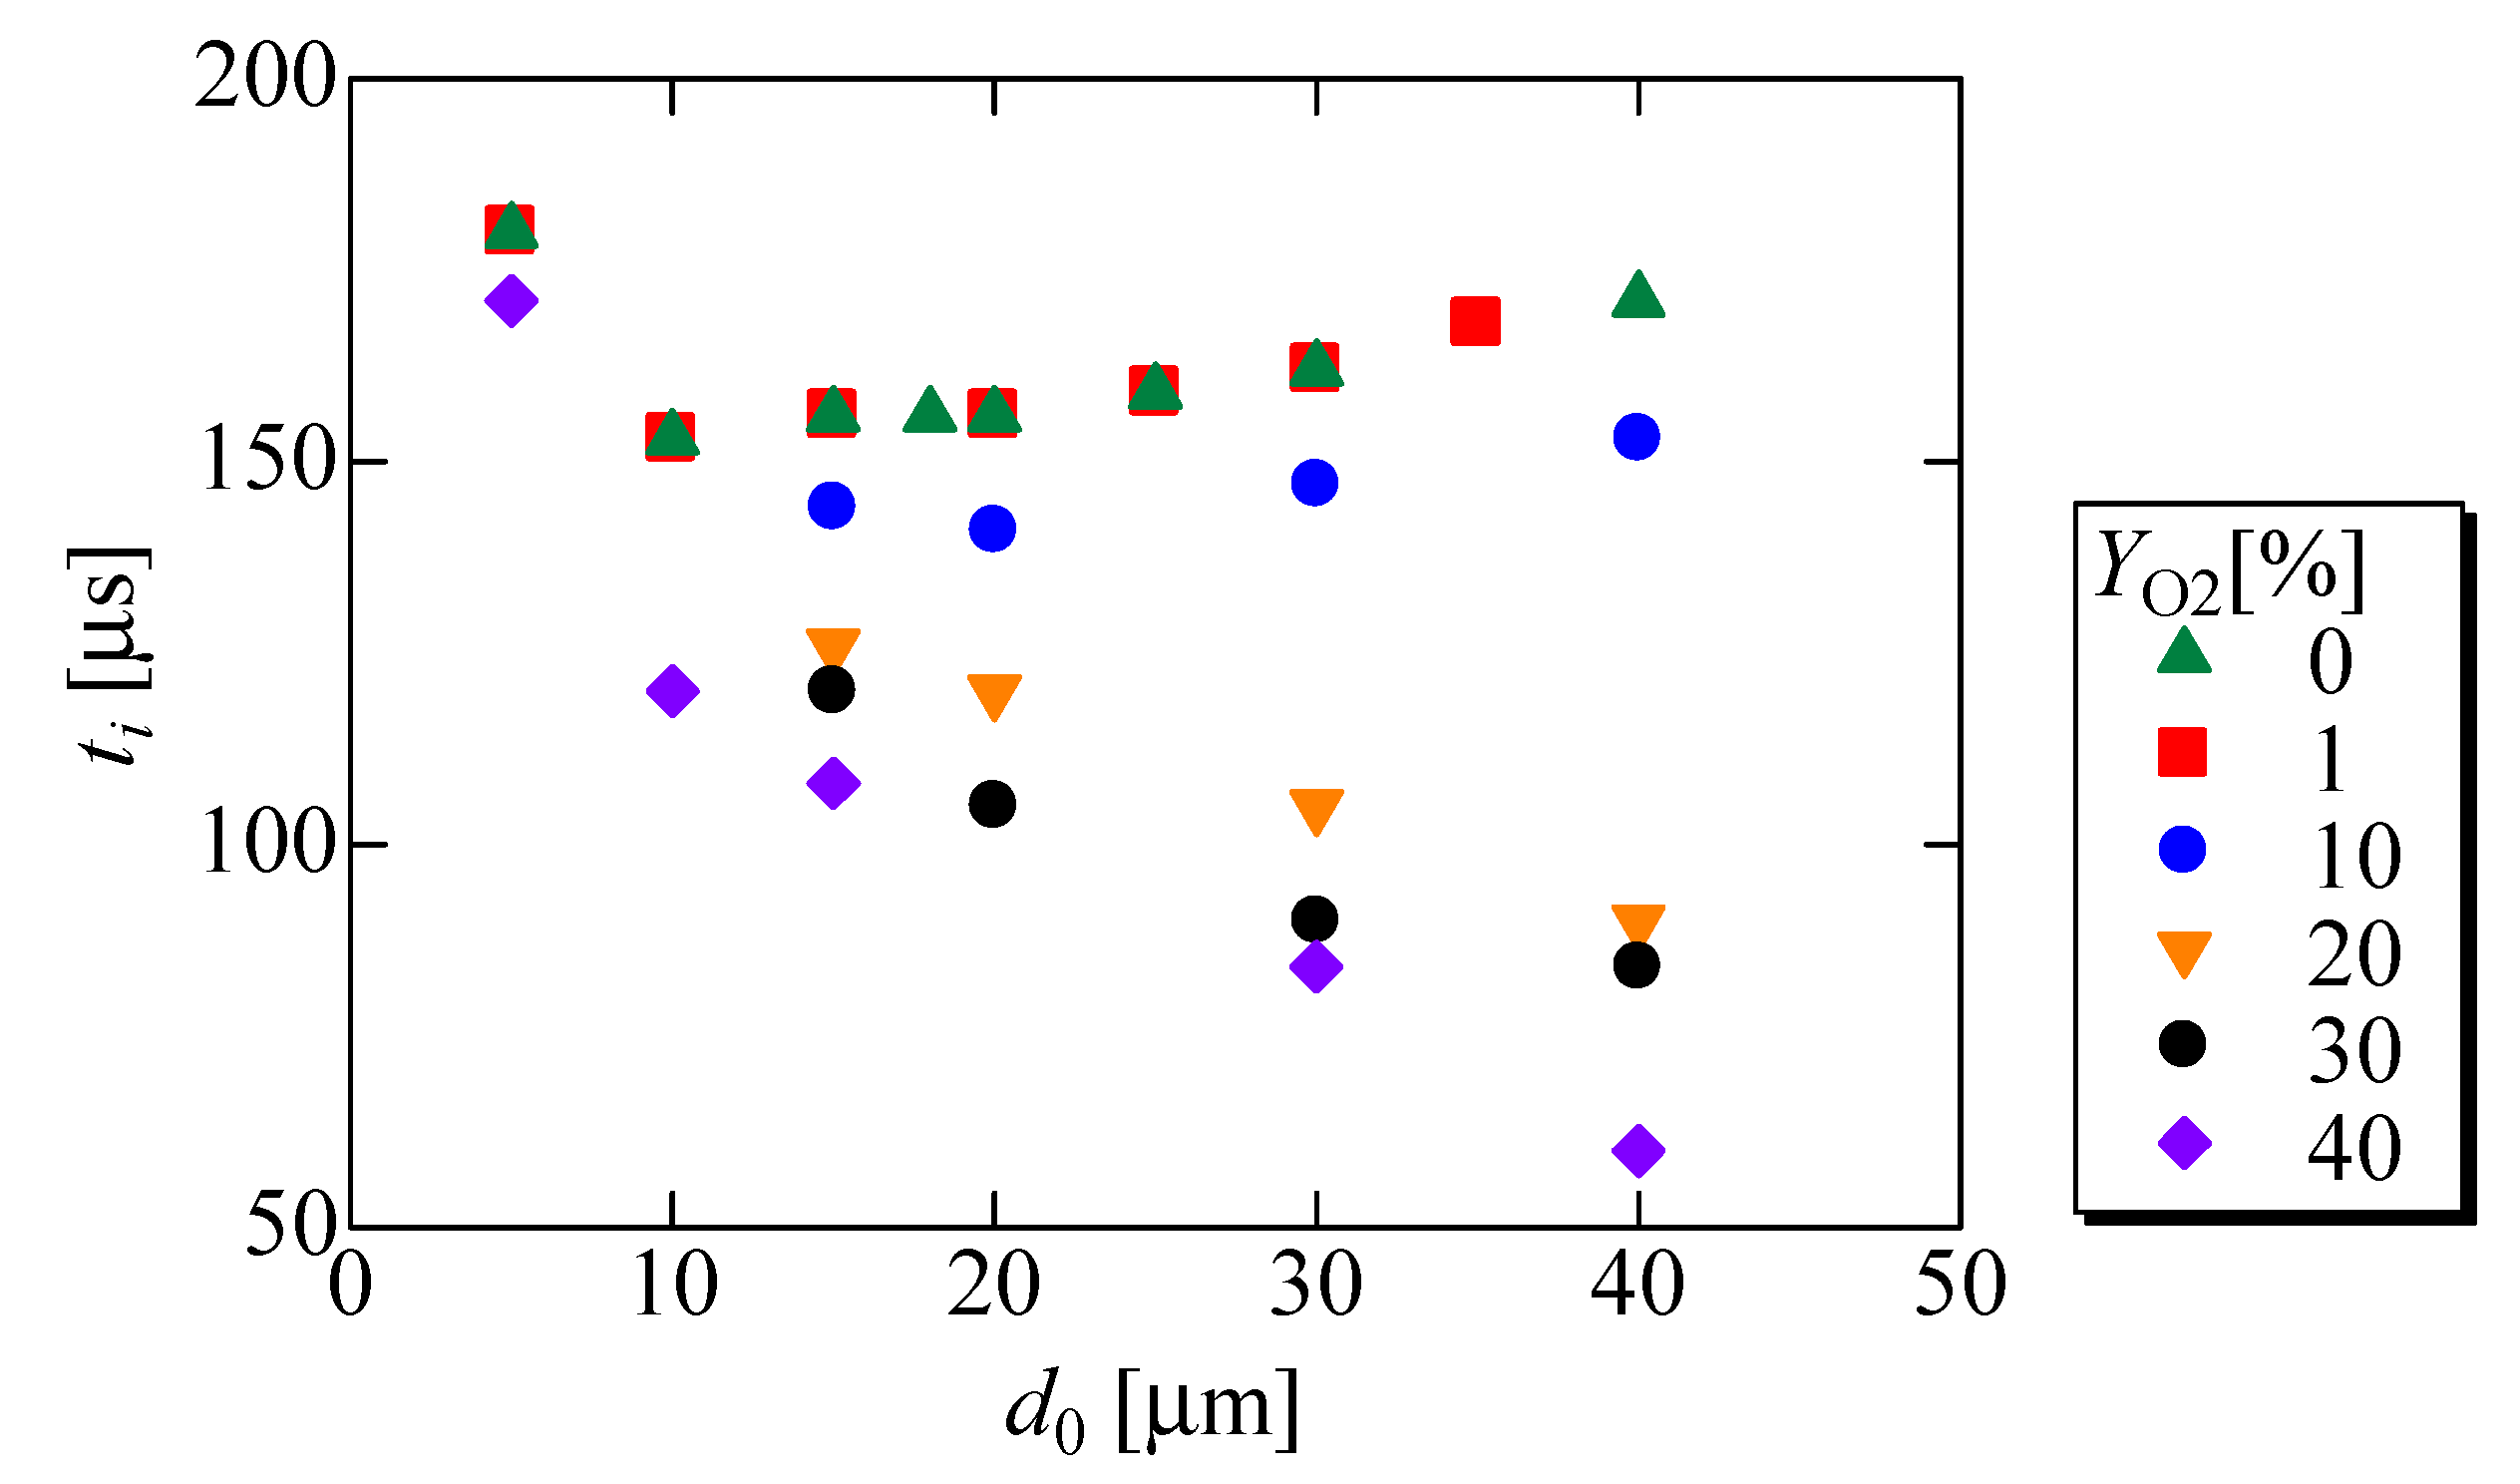
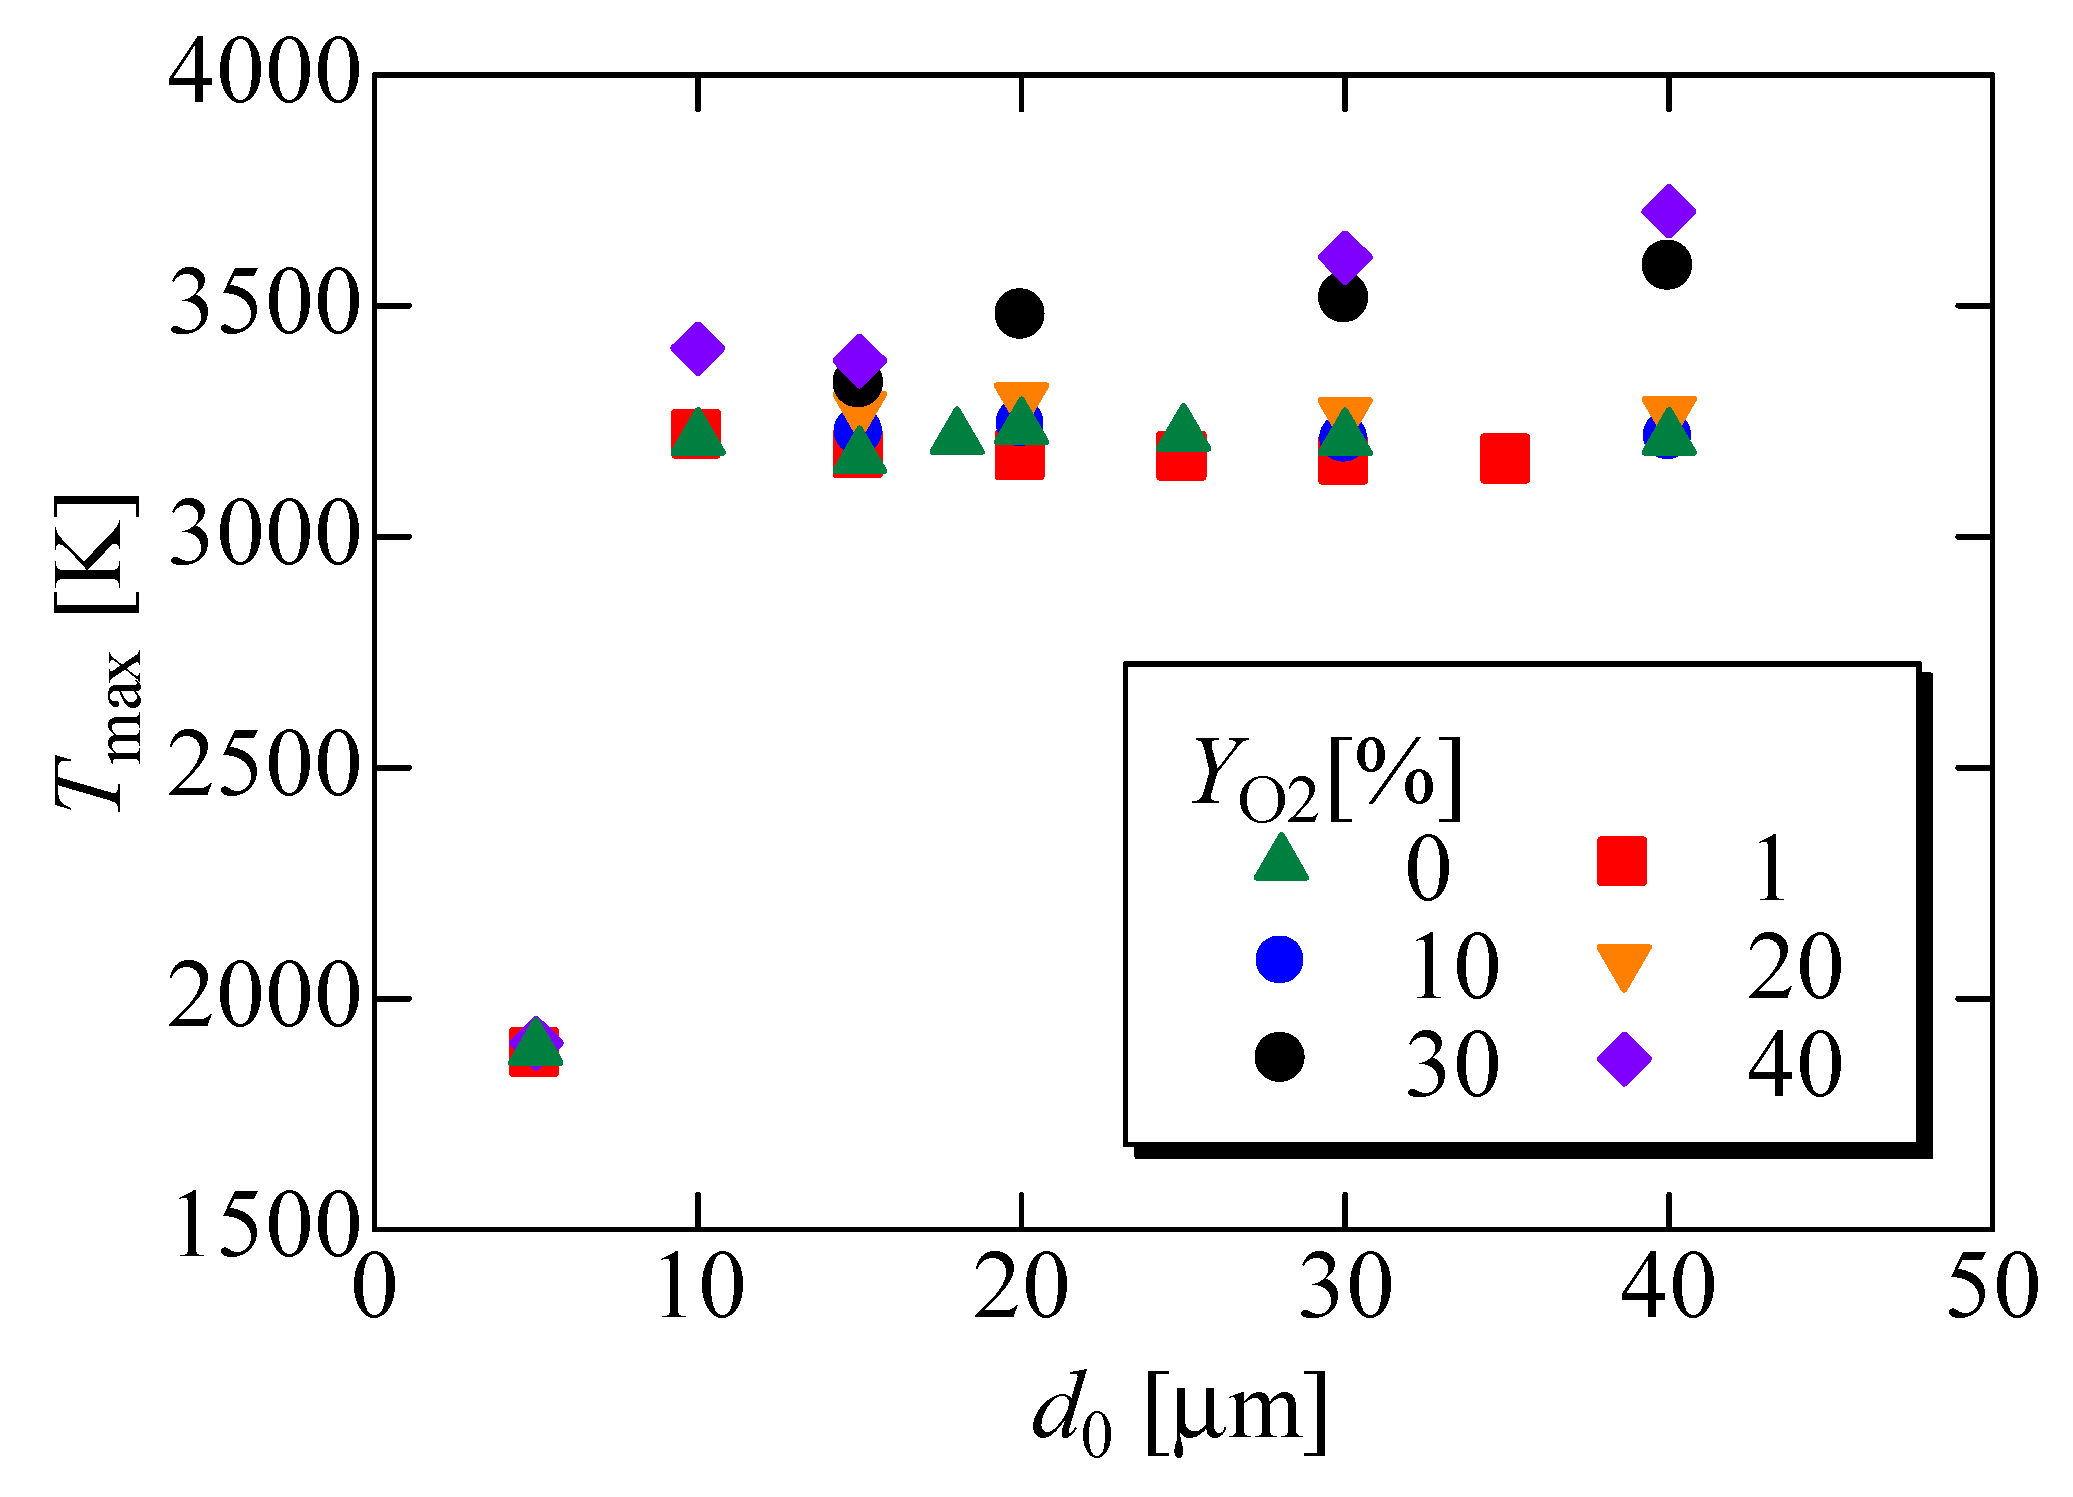
In this section, we examined the effects of the droplet diameter (d0) and the number of injected droplets per unit time (n) on the ignition time (ti) and the maximum temperature (Tmax). Figure 14 and Figure 15 show the ignition time and the maximum temperature, respectively. For both cases, n is 20 µs−1. It was found that, for d0 ≤ 10 µm, the ignition time decreases as d0 increases. That is, the ignition time is shorter as more fuel is supplied. However, d0 ≥ 10 µm, ti conversely increases because more evaporation time is required as d0 increases. For YO2 = 20% or more, as d0 increases, the ignition time is always shorter. As shown in Figure 8, the oxygen release rate increases as YO2 increases. Thus, on the condition that the premixed flame of fuel and oxygen from the droplets is formed, the ignition time is always shortened.
As seen in Figure 15, for d0 ≤ 10 µm, as the diameter of the fuel droplet is larger, the maximum temperature is enlarged. Under these conditions, the ignition time in Figure 15 monotonically decreases, suggesting that the spray combustion is intensified as the droplet diameter is larger. However, for d0 ≥ 10 µm and YO2 ≤ 20%, there are no effects of the droplet diameter. This probably corresponds to conditions where the premixed flame is unlikely formed. For YO2 ≥ 30%, as the droplet diameter is larger, the maximum temperature is always higher, resulting in the shorter ignition time.
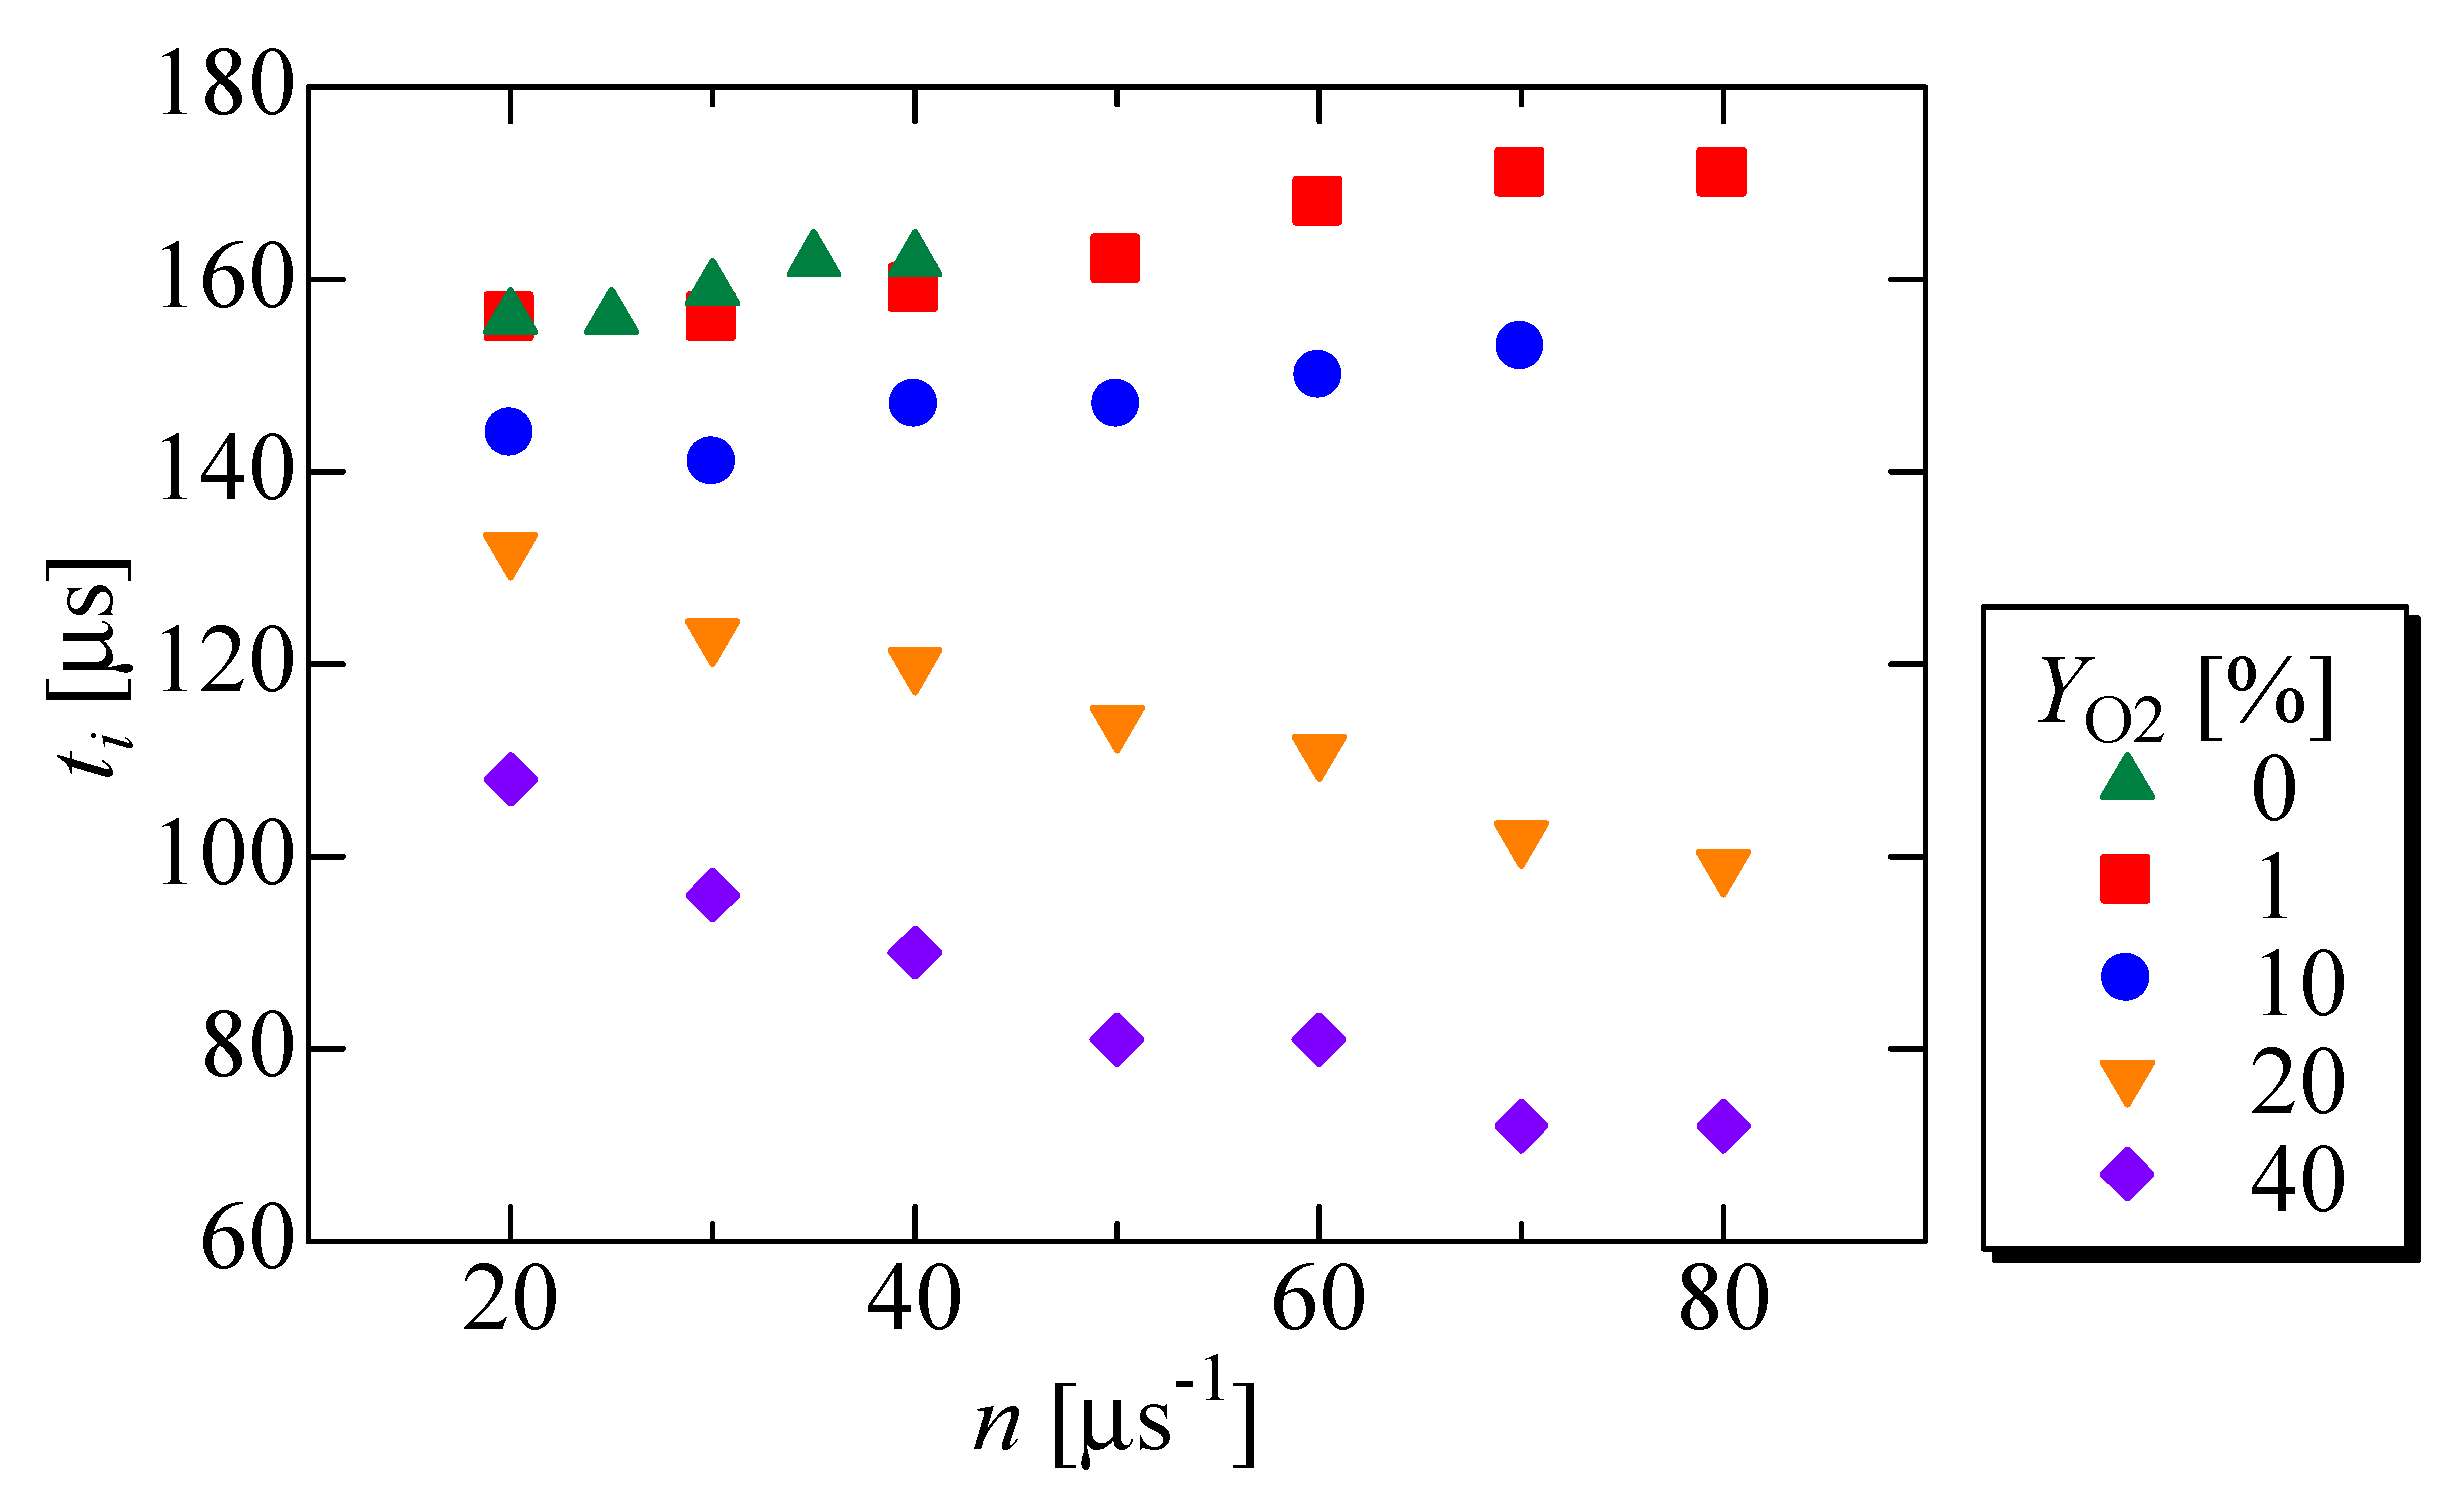
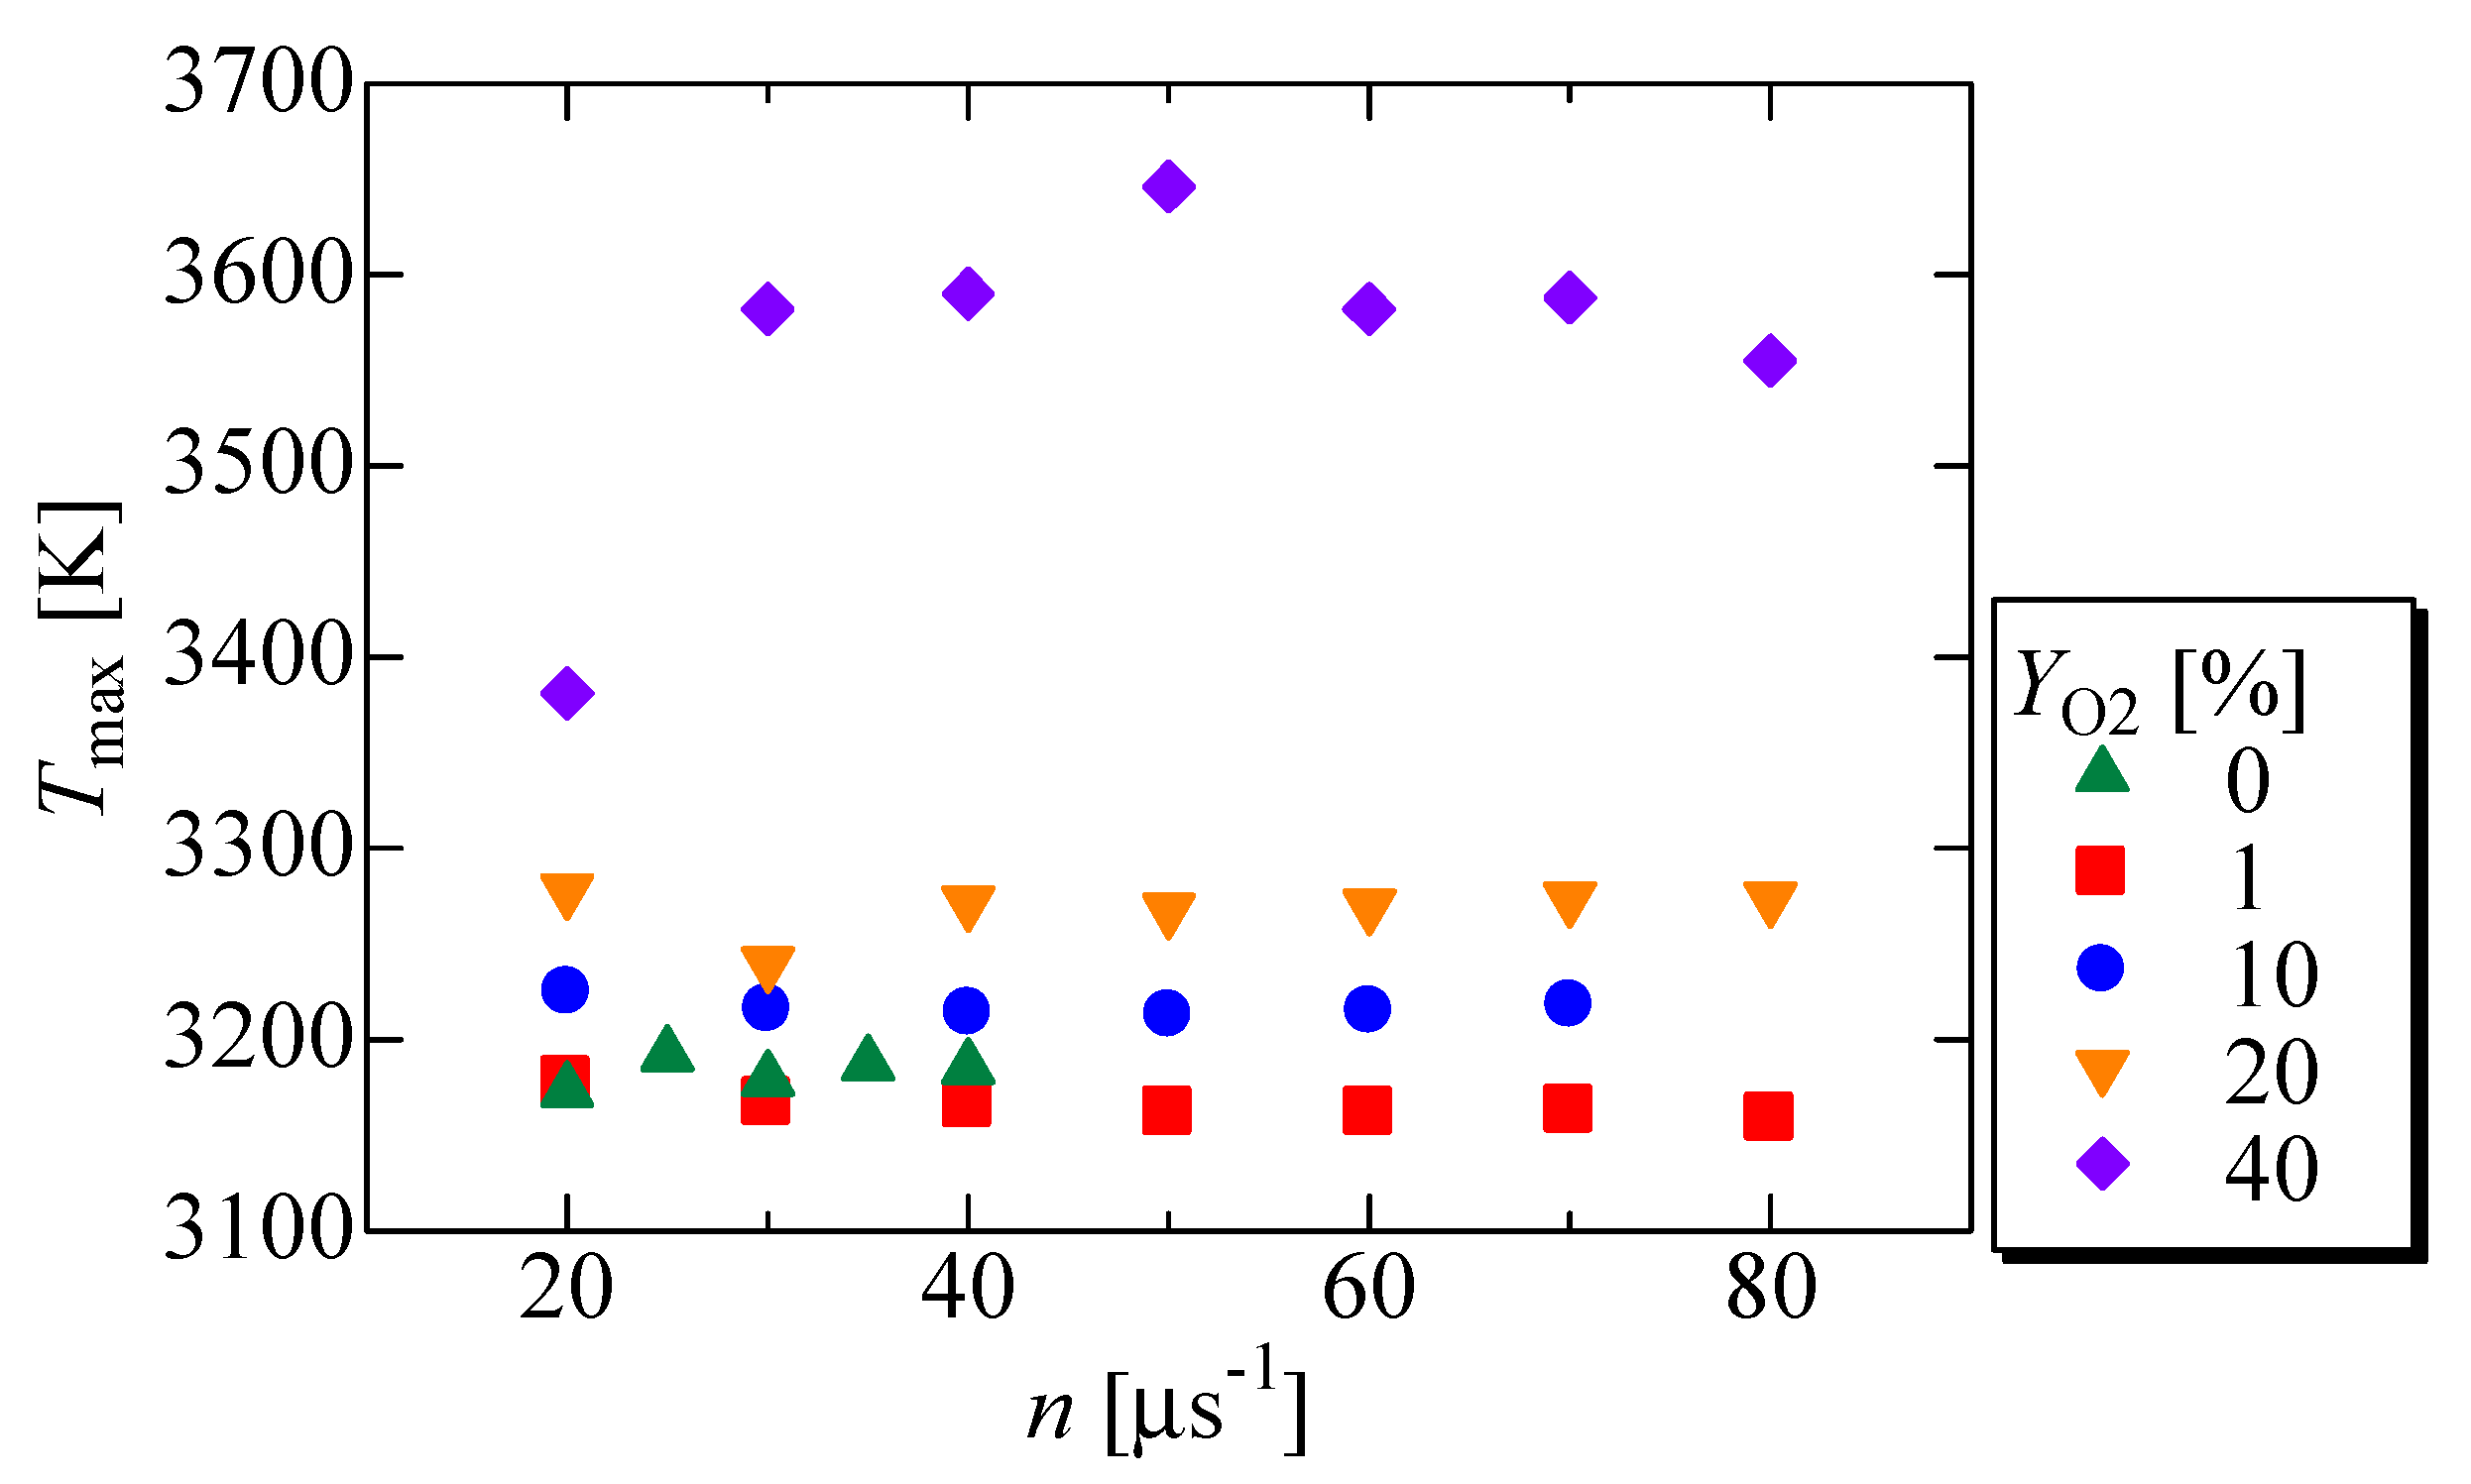
Finally, we changed the number of injected droplets per unit time, n. The ignition time, ti, is shown in Figure 16, and the maximum temperature Tmax is shown in Figure 17. For all cases, the droplet diameter is 15 µm. First, the results of the ignition time are explained. For YO2 ≤ 10%, ti increases as n is larger. This is because there is not enough oxygen for the formation of the premixed flame. At these conditions, the maximum temperature in Figure 17 does not change much at a larger n. Thus, for discussing the ignition time, it was found that the balance between the evaporated fuel and oxygen in the gas phase is important. On the other hand, for YO2 ≥ 20%, ti decreases with an increase of n. Similar to the tendency of d0 in Figure 14, this can be attributed to the rapid formation of the flammable mixture of decane and oxygen. In this case, the maximum temperature becomes higher. It was derived that, on the condition that the flammable mixture of the premixed flame is formed by decane and oxygen contained in the fuel droplet, the ignition occurs earlier, and the maximum temperature is increased.

4. Conclusions

In this study, we conducted a numerical simulation of the spray combustion by the PSI-CELL model. By assuming that oxygen dissolves in the droplets in the form of ultrafine bubbles, oxygen is simultaneously released when the fuel evaporates. The droplets were injected into the high-temperature air. We changed the oxygen concentration in the fuel droplets, the initial droplet diameter, and the number of injected droplets per unit time to discuss the ignition time and the temperature field. As a result, the following findings were derived.
(1)
Before ignition, the fuel droplets move downstream and evaporate, and the flammable mixture is formed, which is important for causing the ignition. When there is no oxygen in the fuel droplet, most of the flames are diffusion flames. On the other hand, when oxygen exists in the droplets, premixed flames are formed at the upstream edge of the fuel spray. Simultaneously, the diffusion flame is observed outside the premixed flame. After some time after ignition, the inner premixed flame disappears, and only the outer diffusion flame remains, followed by the premixed flame of the unburned fuel reacted with oxygen in the ambient air.
(2)
The ignition time is determined by the period when the flammable mixture is formed. Due to the effects of ultrafine oxygen bubbles, the ignition time is shortened. This is because the flammable mixture is easily established in the region where the fuel coexists with oxygen. After ignition, a steep temperature increase is observed, which affects the subsequent fuel evaporation and reaction rate, with a higher maximum temperature.
(3)
As the droplet diameter is smaller than 10 µm, the ignition time is shorter. However, when the droplet diameter is too large, more evaporation time is needed and the ignition time is conversely longer. As the number of injected droplets per unit time is higher, the ignition time increases. For YO2 = 20% or more, the ignition time is always shorter with an increase of the droplet diameter, with a higher maximum temperature. It corresponds to the condition that there are premixed flames formed by decane and oxygen contained in the fuel droplet. Thus, for discussing the ignition time, the balance between the evaporated fuel and oxygen in the gas phase is important.
In future research, broad parametric simulations will be conducted for optimizing the fuel spray conditions. It also requires a comparison with other fuel reforming technologies, such as water emulsion or CO2 blended fuel, to confirm the usefulness of fuel reforming with ultrafine bubbles.

Author Contributions

K.Y. had the original idea for the study and drafted the manuscript. Y.A. and N.H. were responsible for data analyses. All authors have read and agreed to the published version of the manuscript.

Funding

This research received no external funding.

Conflicts of Interest

The authors declare no conflict of interest.

References

  1. Ghezloun, A.; Saidane, A.; Merabet, H. The COP 22 New commitments in support of the Paris Agreement. Energy Procedia 2017, 119, 10–16. [Google Scholar] [CrossRef]
  2. Máté, D.; Novotny, A.; Meyer, D.F. The impact of sustainability goals on productivity growth: The moderating role of global warming. Int. J. Environ. Res. Public Health 2021, 18, 11034. [Google Scholar] [CrossRef] [PubMed]
  3. Moral, F.J.; Rebollo, F.J.; Valiente, P.; López, F. Modeling of atmospheric pollution in urban and rural sites using a probabilistic and objective approach. Appl. Sci. 2019, 9, 4009. [Google Scholar] [CrossRef] [Green Version]
  4. Liu, H.; Li, Q.; Yu, D.; Gu, Y. Air quality index and air pollutant concentration prediction based on machine learning algorithms. Appl. Sci. 2019, 9, 4069. [Google Scholar] [CrossRef] [Green Version]
  5. Hinojosa-Baliño, I.; Infante-Vázquez, O.; Vallejo, M. Distribution of PM2.5 air pollution in Mexico City: Spatial analysis with land-use regression model. Appl. Sci. 2019, 9, 2936. [Google Scholar] [CrossRef] [Green Version]
  6. Zhao, W.; Liu, Y.; Wei, H.; Zhang, R.; Luo, G.; Hou, H.; Chen, S.; Zhang, R. NO removal by plasma-enhanced NH3-SCR using methane as an assistant reduction agent at low temperature. Appl. Sci. 2019, 9, 2751. [Google Scholar] [CrossRef] [Green Version]
  7. Aoyagi, Y. Improvement of BSFC and effective NOx and PM reduction by high EGR rates in heavy duty diesel engine. Combust. Engines 2017, 56, 4–10. [Google Scholar] [CrossRef]
  8. Kang, S.; Lee, S.; Bae, C. Effects of multi-stage split injection on efficiency and emissions of light-duty diesel engine. Energies 2022, 15, 2219. [Google Scholar] [CrossRef]
  9. Johnson, T. Vehicular emissions in review. SAE Int. J. Engines 2016, 9, 1258–1275. [Google Scholar] [CrossRef]
  10. Winkler, S.L.; Anderson, J.E.; Garza, L.; Ruona, W.C.; Vogt, R.; Wallington, T.J. Vehicle criteria pollutant (PM, NOx, CO, HCs) emissions: How low should we go? Clim. Atmos. Sci. 2018, 1, 26. [Google Scholar] [CrossRef]
  11. Gauthier, C.; Sename, O.; Dugard, L.; Meissonnier, G. Modelling of a diesel engine common rail injection system. IFAC Proc. Vol. 2005, 38, 188–193. [Google Scholar] [CrossRef] [Green Version]
  12. Guang, T.X.; Lang, S.H.; Tao, Q.; Qiang, F.Z.; Hui, Y.W. The impact of common rail system’s control parameters on the performance of high-power diesel. Energy Procedia 2012, 16, 2067–2072. [Google Scholar] [CrossRef] [Green Version]
  13. Kamaltdinov, V.G.; Markov, V.A.; Lysov, I.O.; Zherdev, A.A.; Furman, V.V. Experimental studies of fuel injection in a diesel engine with an inclined injector. Energies 2019, 12, 2643. [Google Scholar] [CrossRef] [Green Version]
  14. Schejbal, M.; Štěpánek, J.; Marek, M.; Kočí, P.; Kubíček, M. Modelling of soot oxidation by NO2 in various types of diesel particulate filters. Fuel 2010, 89, 2365–2375. [Google Scholar] [CrossRef]
  15. Tzamkiozis, T.; Ntziachristos, L.; Samaras, Z. Diesel passenger car PM emissions: From Euro 1 to Euro 4 with particle filter. Atmos. Environ. 2010, 44, 909–916. [Google Scholar] [CrossRef]
  16. Lapuerta, M.; Oliva, F.; Agudelo, J.R.; Boehman, A.L. Effect of fuel on the soot nanostructure and consequences on loading and regeneration of diesel particulate filters. Combust. Flame 2012, 159, 844–853. [Google Scholar] [CrossRef]
  17. Tsuneyoshi, K.; Yamamoto, K. Experimental study of hexagonal and square diesel particulate filters under controlled and uncontrolled catalyzed regeneration. Energy 2013, 60, 325–332. [Google Scholar] [CrossRef]
  18. Yamamoto, K.; Yoshizawa, K. Fuel supply system to DOC by nanopore-ceramic tube and measurement of fuel evaporation rate. Fuel 2021, 298, 120793. [Google Scholar] [CrossRef]
  19. Gürü, M.; Karakaya, U.; Altıparmak, D.; Alıcılar, A. Improvement of diesel fuel properties by using additives. Energy Convers. Manag. 2002, 43, 1021–1025. [Google Scholar] [CrossRef]
  20. Jeevanantham, A.K.; Nanthagopal, K.; Ashok, B.; Al-Muhtaseb, A.H.; Thiyagarajan, S.; Geo, V.E.; Ong, H.C.; Samuel, K.J. Impact of addition of two ether additives with high speed diesel-Calophyllum Inophyllum biodiesel blends on NOx reduction in CI engine. Energy 2019, 185, 39–54. [Google Scholar] [CrossRef]
  21. Cheng, A.S.; Dibble, R.W.; Buchholz, B.A. The effect of oxygenates on diesel engine particulate matter. SAE Tech. Pap. 2002, 1, 1705. [Google Scholar]
  22. Wittka, T.; Müller, V.; Dittmann, P.; Pischinger, S. Development and investigation of diesel fuel reformer for LNT regeneration. Emiss. Control Sci. Technol. 2015, 1, 226–236. [Google Scholar] [CrossRef] [Green Version]
  23. Remzi, J.P.; Jan, C.S.; Tschauder, M.A.; Peters, R. Recent advances in diesel autothermal reformer design. Int. J. Hydrogen Energy 2020, 45, 2279–2288. [Google Scholar]
  24. Woo, S.; Kim, W.; Lee, J.; Lee, K. Fuel properties of water emulsion fuel prepared using porous membrane method for low pollutant engine at various temperatures. Energy Rep. 2021, 7, 6638–6650. [Google Scholar] [CrossRef]
  25. Mukayama, T.; Hattori, Y.; Kuribayashi, M.; Asai, G.; Matsumura, E.; Senda, J. Effects of spray internal EGR using CO2 gas dissolved fuel on combustion characteristics and emissions in diesel engine. SAE Tech. Pap. 2019, 32, 0592. [Google Scholar]
  26. Cardone, M.; Marialto, R.; Ianniello, R.; Lazzaro, M.; Di Blasio, G. Spray analysis and combustion assessment of diesel-LPG fuel blends in compression ignition engine. Fuels 2021, 2, 1–15. [Google Scholar] [CrossRef]
  27. Zhang, X.; Li, T.; Ma, P.; Wang, B. Spray combustion characteristics and soot emission reduction of hydrous ethanol diesel emulsion fuel using color-ratio pyrometry. Energies 2017, 10, 2262. [Google Scholar] [CrossRef] [Green Version]
  28. Mukayama, T.; Yamamoto, J.; Kuribayashi, M.; Asai, G.; Matsumura, E.; Senda, J. Improvement of combustion characteristics and emissions by applying CO2 gas dissolved fuel in diesel engine. SAE Tech. Pap. 2019, 1, 2274. [Google Scholar]
  29. Terasaka, K.; Yasui, K.; Kanematsu, W.; Aya, N. Ultrafine Bubbles, 1st ed.; Jenny Stanford Publishing: Dubai, United Arab Emirates, 2021. [Google Scholar] [CrossRef]
  30. Nakahara, H. Study on the air-mixed fuel injection in a diesel engine. Proceeding JSAE 1991, 912, 35–38. [Google Scholar]
  31. Ohashi, K.; Maruyama, S. Reduction of smoke emission in diesel engines by injection of air-solved fuel. Rep. Mech. Eng. Lab. 1991, 46, 46–57. [Google Scholar]
  32. Le Coz, J.F.; Cherel, J.; Le Mirronet, S. Fuel/air mixing process and combustion in an optical direct-injection engine. Oil Gas Sci. Technol. 2003, 58, 63–78. [Google Scholar] [CrossRef]
  33. Nakatake, Y.; Kisu, S.; Eguchi, T. Effect of nano air-bubbles mixed into gas oil on common-rail diesel engine. Energy 2013, 59, 233–239. [Google Scholar] [CrossRef]
  34. Imazu, H.; Kojima, Y. Physical properties and combustion characteristics of emulsion fuels of water/diesel fuel and water/diesel fuel/vegetable oil prepared by ultrasonication. J. Jpn. Pet. Inst. 2013, 56, 52–57. [Google Scholar] [CrossRef] [Green Version]
  35. Wen, H.; Jiang, Y.; Ma, J. Effect of fuel mass flow at the end of injection on cavitation and gas ingestion in the nozzle. Appl. Sci. 2021, 11, 258. [Google Scholar] [CrossRef]
  36. Hagihara, K.; Yamashita, H.; Yamamoto, K. Numerical study on influence of size and number density of droplet on spray combustion mode. J. Combust. Soc. Jpn. 2009, 51, 343–353. (In Japanese) [Google Scholar]
  37. Crowe, C.T.; Sharma, M.P.; Stock, D.E. The particle-source-in cell model for gas-droplet flows. Trans. ASME J. Fluids Eng. 1977, 99, 325–332. [Google Scholar] [CrossRef]
  38. Novozhilov, V.; Joseph, P.; Ishiko, K.; Shimada, T.; Wang, H.; Liu, J. Polymer combustion as a basis for hybrid propulsion: A comprehensive review and new numerical approaches. Energies 2011, 4, 1779–1839. [Google Scholar] [CrossRef] [Green Version]
  39. Anisiuba, V.; Ma, H.; Silaen, A.; Zhou, C. Computational studies of air-mist spray cooling in continuous casting. Energies 2021, 14, 7339. [Google Scholar] [CrossRef]
  40. Ur Rahman, U.J.; Pozarlik, A.K. Numerical study and experimental validation of skim milk drying in a process intensified counter flow spray dryer. Energies 2021, 14, 4974. [Google Scholar] [CrossRef]
  41. Semibo, V.; Andrade, P.; Carvalho, M. Spray characterization: Numerical prediction of Sauter mean diameter and droplet size distribution. Fuel 1996, 75, 1707–1714. [Google Scholar] [CrossRef]
  42. Gallot-Lavallée, S.; Jones, W.P.; Marquis, A.J. Large eddy simulation of an ethanol spray flame with secondary droplet breakup. Flow Turbul. Combust. 2021, 107, 709–743. [Google Scholar] [CrossRef]
  43. Han, J.S.; Wang, T.C.; Xie, X.B.; Lai, M.C.; Henein, N.A.; Harrington, D.L.; Pinson, J.; Miles, P. Dynamics of multiple-injection fuel sprays in a small-bore HSDI diesel engine. J. Engines 2000, 109, 1538–1554. [Google Scholar]
  44. Mohaddes, D.; Boettcher, P.; Ihme, M. Hot surface ignition of a wall-impinging fuel spray: Modeling and analysis using large-eddy simulation. Combust. Flame 2021, 228, 443–456. [Google Scholar] [CrossRef]
  45. Yamashita, H.; Baum, H.R.; Kushida, G.; Nakabe, K.; Kashiwagi, T. Heat transfer from radiatively heated material in a low Reynolds number microgravity environment. J. Heat Transf. 1993, 115, 418–425. [Google Scholar] [CrossRef]
  46. Nakabe, K.; McGrattan, K.B.; Kashiwagi, T.; Baum, H.R.; Yamashita, H.; Kushida, G. Ignition and transition to flame spread over a thermally thin cellulosic sheet in a microgravity environment. Combust. Flame 1994, 98, 361–374. [Google Scholar] [CrossRef]
  47. Yamashita, H.; Shimada, M.; Takeno, T. A numerical study on flame stability at the transition point of jet diffusion flames. Symp. Int. Combust. 1996, 26, 27–34. [Google Scholar] [CrossRef]
  48. Yamamoto, K.; Ishizuka, S.; Hirano, T. Effects of pressure diffusion on the characteristics of tubular flames. Symp. Int. Combust. 1996, 26, 1129–1135. [Google Scholar] [CrossRef]
  49. Nakamura, Y.; Kushida, G.; Yamashita, H.; Takeno, T. Effects of gravity and ambient oxygen on a gas-phase ignition over a heated solid fuel. Combust. Flame 2000, 120, 34–48. [Google Scholar] [CrossRef]
  50. Yamamoto, K.; Ogata, Y.; Yamashita, H. Flame structure and flame spread rate over a solid fuel in partially premixed atmospheres. Proc. Combust. Inst. 2011, 33, 2441–2448. [Google Scholar] [CrossRef]
  51. Patanker, S.V. Numerical Heat Transfer and Fluid Flow; Mcgraw-Hill: New York, NY, USA, 1980. [Google Scholar]
  52. Kee, R.J.; Rupley, F.M.; Meeks, E.; Miller, J.A. CHEMKIN-II: A FORTRAN chemical kinetics package for the analysis of gas-phase chemical kinetics. SAND 1989, 89, 8009. [Google Scholar]
  53. Smooke, M.D. Reduced Kinetic Mechanisms and Asymptotic Approximations for Methane-Air Flames; Springer: Berlin, Germany, 1991. [Google Scholar]
  54. Westbrook, C.K.; Dryer, F.L. Simplified reaction mechanisms for the oxidation of hydrocarbon fuels in flames. Combust. Sci. Technol. 1981, 27, 31–43. [Google Scholar] [CrossRef]
  55. Kanury, M.A. Introduction to Combustion Phenomena; Gordon and Breach Science Publishers: Philadelphia, PA, USA, 1975; pp. 142–194. [Google Scholar]
  56. Crowl, D.A. Minimize the risks of flammable materials. Chem. Eng. Prog. 2012, 108, 28–33. [Google Scholar]
  57. Glassman, I.; Yetter, R.A.; Glumac, N.G. Combustion, 5th ed.; Academic Press: Cambridge, MA, USA, 2014; pp. 363–391. [Google Scholar]
Figure 1. Numerical model of the spray combustion with 3D Cartesian coordinates.
Energies 15 08467 g001
Figure 2. Time-variation of droplet distributions for (a) YO2 = 0% and (b) YO2 = 30%; d0 = 15 µm, n = 20 µs−1.
Energies 15 08467 g002
Figure 3. Time-variation of temperature distributions for (a) YO2 = 0% and (b) YO2 = 30%; d0 = 15 µm, n = 20 µs−1.
Energies 15 08467 g003
Figure 4. Time-variation of distributions of decane mass fraction at z = 0 mm for (a) YO2 = 0% and (b) YO2 = 30%; d0 = 15 µm, n = 20 µs−1.
Energies 15 08467 g004
Figure 5. Time-variation of distributions of oxygen mass fraction at z = 0 mm for (a) YO2 = 0% and (b) YO2 = 30%; d0 = 15 µm, n = 20 µs−1.
Energies 15 08467 g005
Figure 6. Time-variation of heat release rate distributions at z = 0 mm for (a) YO2 = 0% and (b) YO2 = 30%; d0 = 15 µm, n = 20 µs−1.
Energies 15 08467 g006
Figure 7. Time-variation of flame index distributions at z = 0 mm for (a) YO2 = 0% and (b) YO2 = 30%; d0 = 15 µm, n = 20 µs−1.
Energies 15 08467 g007
Figure 8. Time-variation of (a) total decane evaporation rate and (b) total oxygen release rate for YO2 = 0 to 40%; d0 = 15 µm, n = 20 µs−1.
Energies 15 08467 g008
Figure 9. Time-variation of (a) maximum temperature and (b) time-derivative of maximum temperature for YO2 = 0 to 40%; d0 = 15 µm, n = 20 µs−1.
Energies 15 08467 g009
Figure 10. Variation of ignition time with oxygen mass fraction; d0 = 15 µm, n = 20 µs−1.
Energies 15 08467 g010
Figure 11. 3D temperature distributions for (a) YO2 = 0% and (b) 1% at t = 156 μs; d0 = 15 µm, n = 20 µs−1.
Energies 15 08467 g011
Figure 12. 2D temperature distributions of cross-sectional x-y (upper) and y-z (lower) planes across the ignition point for YO2 = 0% and 1% at t = 156 μs; d0 = 15 µm, n = 20 µs−1.
Energies 15 08467 g012
Figure 13. Variation of maximum temperature with oxygen mass fraction; d0 = 15 µm, n = 20 µs−1.
Energies 15 08467 g013
Figure 14. Variation of ignition time with droplet diameter for YO2 = 0 to 40%; n = 20 µs−1.
Energies 15 08467 g014
Figure 15. Variation of maximum temperature with droplet diameter for YO2 = 0 to 40%; n = 20 µs−1.
Energies 15 08467 g015
Figure 16. Variation of ignition time with number of injected droplets per unit time for YO2 = 0 to 40%; d0 = 15 µm.
Energies 15 08467 g016
Figure 17. Variation of maximum temperature with number of injected droplets per unit time for YO2 = 0 to 40%; d0 = 15 µm.
Energies 15 08467 g017
Publisher’s Note: MDPI stays neutral with regard to jurisdictional claims in published maps and institutional affiliations.