Abstract
The low permeability and submicron throats in most shale or tight sandstone reservoirs have a significant impact on microscale flow. The flow characteristics can be described with difficultly by the conventional Darcy flow in low-permeability reservoirs. In particular, the thickness of the boundary layer is an important factor affecting the formation permeability, and the relative permeability curve obtained under conventional conditions cannot accurately express the seepage characteristics of porous media. In this work, the apparent permeability and relative permeability were calculated by using non-Darcy-flow mathematical modeling. The results revealed that the newly calculated oil–water relative permeability was slightly higher than that calculated by the Darcy seepage model. The results of the non-Darcy flow based on the conceptual model showed that the area swept by water in non-Darcy was smaller than that in Darcy seepage. The fingering phenomenon and the high bottom hole pressure in the non-Darcy seepage model resulted from the larger amount of injected water. There was a large pressure difference between the injection and production wells where the permeability changed greatly. A small pressure difference between wells resulted in lower variation of permeability. Consequently, the non-Darcy simulation results were consistent with actual production data.
1. Introduction
Low-permeability reservoirs have small pore throats and serious heterogeneity [1]. Low seepage velocity is considered microscale seepage. Its flow process is mainly controlled by nonlinear seepage [2,3]. Therefore, the accurate characterization of nonlinear seepage is of great significance for the exploration and exploitation of the remaining oil in low-permeability reservoirs [4]. At present, the main models for characterizing nonlinear seepage flow include: the threshold pressure gradient model [5,6,7,8]; nonlinear models based on equal diameter capillary bundle model; the fractal model [9]. Seepage fluid is the fluid in a seepage environment, including bulk and boundary fluid [10]. The properties of bulk fluid are influenced by the interface, which is distributed in the central axis of the pore throat. Boundary fluid affected by the interface is close to the pore throat wall and shows the shape of the boundary layer. The above studies have gradually reveals the existence of the “boundary layer effect” [11]. For ultra-low-permeability reservoirs, the pore radius and boundary layer thickness have almost the same order of magnitude or less. The influence of a solid–liquid boundary layer is greatly enhanced, and the proportion of boundary fluid in pore fluid increases [12]. Consequently, the influence of the boundary layer cannot be ignored because the existence of a boundary layer compresses the effective flow space. The small flow radius and the difficult flow of the boundary fluid limit the flow capacity of the bulk fluid [13,14].
The relative permeability curve is a very important factor in exploring low-permeability reservoirs [15,16]. The relative permeability and water displacement law of the oilfield are of great significance for accurately understanding the fluid seepage characteristics and efficient development of the oilfield [17]. The fluid flow in a low-permeability reservoir is very different from that in conventional reservoirs [18,19,20]. There are many unique fluid flow characteristics of ultra-low-permeability reservoirs, such as large seepage resistance, threshold pressure gradient, and nonlinear seepage. Ren et al. (2009) [21] built single-phase flow based on a new non-Darcy flow equation according to fluid properties and pressure gradient in a porous media. Yao et al. (2011) [22] proposed a novel method to solve Darcy and non-Darcy flow. Wang et al. (2017) [23] built a model to discuss low-velocity non-Darcy flow and the existence of TPG.
In this paper, permeability is calculated by Darcy seepage theory using mathematical software such as Eclipse and CMG. The results calculated using the original Darcy seepage formula in low-permeability reservoirs are too ideal and not consistent with actual data. The small displacement pressure difference, wide range of injected water streamline, high sweep efficiency, and high oil recovery efficiency affect the actual results of the residual oil distribution. In order to solve the confusion caused by this problem, a non-Darcy equivalent calculation formula is used to reflect the remaining oil distribution. First, apparent permeability and relative permeability in non-Darcy flow are described using mathematical modeling. Then, the non-Darcy flow simulation results based on the conceptual model are discussed. Lastly, based on the modified non-Darcy model, simulation results and actual production curves are compared.
2. Mathematical Model
2.1. Apparent Permeability
Previous studies have stated that the threshold pressure gradient obtained by laboratory experiments and field tests hinders the fluid flow in low-permeability reservoirs [24]. The fluid in the center of a pore (called bulk fluid) is different from fluid directly in contact with the inner surface of the porous medium (called boundary fluid) (see Figure 1). The properties of boundary fluid are affected by interface phenomena, and the fluid forms a boundary layer close to the pore wall [25,26]. The fluid inside the boundary layer does not easily flow. The thickness of the boundary layer is affected by the threshold pressure gradient. A large threshold pressure gradient and a narrow boundary layer lead to a large radius of the bulk fluid. Conversely, a small threshold pressure gradient and a thicker boundary layer lead to a smaller radius of the bulk fluid. The boundary fluid is a main factor leading to the occurrence of nonlinear seepage.
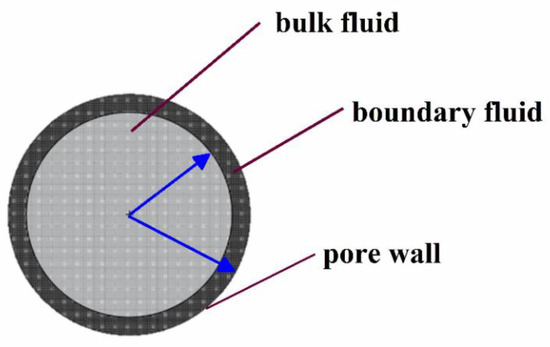
Figure 1.
The distribution of seepage fluid in pores.
Therefore, the thickness of the boundary layer changes the flow porosity in pores, which in turn leads to changes in permeability. This permeability is different from the absolute permeability, which is called apparent permeability in this article.
According to the Kozeny formula, permeability and throat size have the following relationship:
In the formula, K represents the absolute permeability; R represents the radius of the throat in microns; r represents radius of the bulk fluid; n represents the number of capillaries per unit area, each.
In the same reservoir, the number of capillaries per unit area is fixed. Therefore, there is the following relationship between apparent permeability and air permeability:
which is:
It can be seen from the above formula that the apparent permeability is less than the air’s permeability.
The pressure difference ΔP and the thickness of the boundary layer δ were established by using microtubes of equal diameter under laboratory conditions, and we found the thickness of the boundary layer and the pressure difference.
The radius of the bulk fluid r = R – δ; that is, the radius of the bulk fluid and the pressure difference also have an exponential relationship. This can be expressed as:
Assuming two definite solution conditions, when the fluid does not flow, which is ΔP = 0, the radius of the body in fluid r = 0 at this time. When ΔP approaches infinity, r = R. Therefore:
We obtained c = 0, a = R.
Then
The value of the coefficient b in Formulas (1)–(4) can be obtained through experiments.
2.2. Relative Permeability Curve Processing
The process of calculating the conventional oil–water relative permeability curve generally involves measuring the oil–water flow velocity under different pressure differences through indoor water flooding experiments, and then calculating the oil–water relative permeability using the Darcy flow equation. However, for low-permeability reservoirs, this algorithm is obviously unreasonable, and the oil–water relative permeability curve must be corrected.
- (1)
- Correction of oil–water relative permeability curve
In order to facilitate the calculation, we adopted the established low-velocity non-Darcy flow formula:
where , where and are constant [2,20].
The Darcy flow formula is
For comparison, the low-velocity non-Darcy flow formula has the same format as the Darcy flow formula:
Because the pressure difference and seepage velocity are both known during the measurement process, the above formulas are compared in pairs:
Through the above method, the relative permeability curve of the studied sample was corrected.
The results in Figure 2 show that the newly calculated oil–water relative permeability was slightly higher than the previous results calculated according to the Darcy flow model.
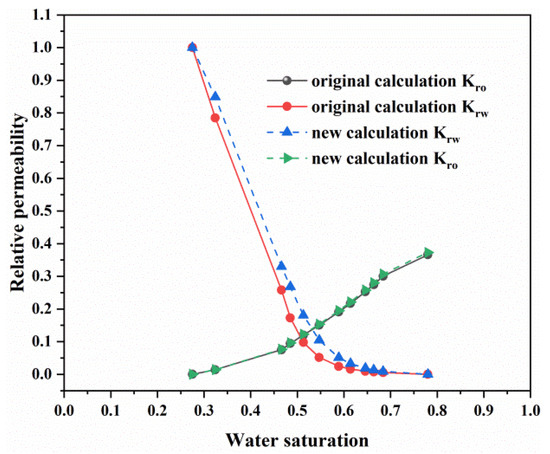
Figure 2.
Comparison of oil–water relative permeability curves of the two models.
- (2)
- Water cut model
The conventional algorithm is based on the Berkeley–Levelt oil displacement mechanism. Oil–water seepage follows Darcy’s law of linear seepage [12,25,26]. When the oil–water weight ratio and capillary force are not considered, the following can be obtained:
The water cut model of non-Darcy flow with low velocity is:
In oil–water non-Darcy seepage flow, the influential factors of water cut are: phase permeability curve, oil–water viscosity ratio, density ratio, and other factors.
The results of water cut are shown in Figure 3, which compares the two models. The water cut calculated according to the non-Darcy flow method with low velocity was slightly higher than the result calculated according to the Darcy flow method. The conclusion was the same as the results from the previous simulation based on the established low-velocity non-Darcy equivalent seepage model. In the low-velocity non-Darcy flow model, a fingering phenomenon of injected water would easily occur, which resulted in an increase in water recovery.
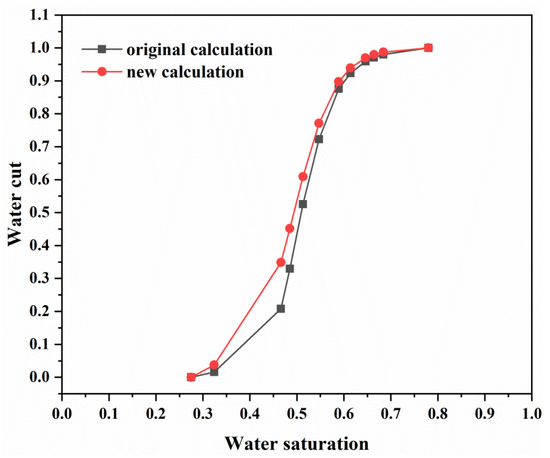
Figure 3.
Comparison of water cut between two models.
3. Simulation Results
3.1. Conceptual Model
A conceptual 20 × 20 × 5 model was established, and the reverse nine-point well pattern was used for water injection development (Figure 4 and Figure 5). The total time in the simulation was 10 years, and the time step was 1 month. The Darcy flow method and the low-speed non-Darcy equivalent flow method were separately adopted for 8 months’ simulation. Judging from the comparison results, a large area of water was washed in the Darcy seepage, and the remaining oil was only concentrated near the four corners (Figure 6, Figure 7 and Figure 8). From the pressure distribution (Figure 9, Figure 10 and Figure 11), the overall pressure level was low. The affected area was smaller than the Darcy seepage, the injected water showed a fingering phenomenon, and the bottom hole pressure was much higher than that under the Darcy seepage mode. This was due to the short distance along the straight line, the small boundary layer thickness, the large bulk fluid radius, and pressure gradient. Therefore, the absolute permeability contribution value in the straight line direction was large relative to the angle well direction, and the injected water intruded faster. The water cut in the non-Darcy flow mode of well P2 in the early straight direction was lower than that of the Darcy flow model in Figure 12. From the eighth month, the water cut started to be higher than in the Darcy flow mode. This was because in the initial state, the non-Darcy seepage had a low-permeability contribution value, so the flow rate of water was slow. In the later stage, due to the influence of fingering, the injected water burst, resulting in the water cut gradually becoming higher than the water cut under the Darcy seepage method.
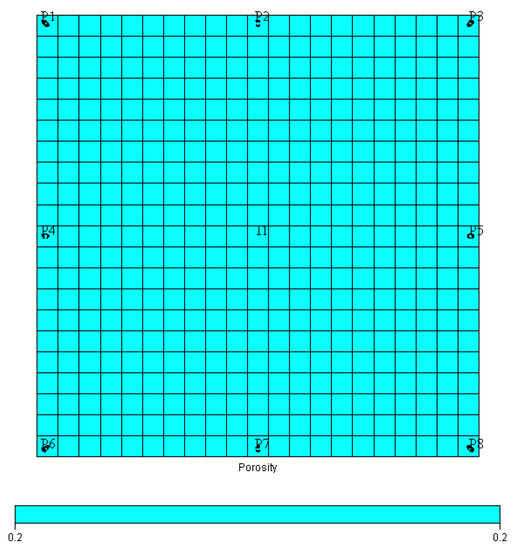
Figure 4.
Porosity model.
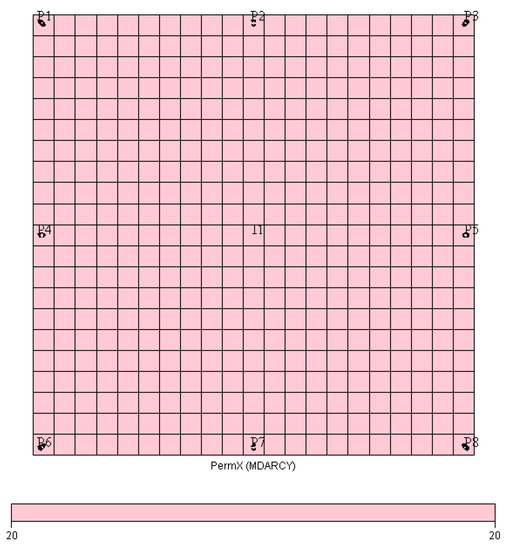
Figure 5.
Permeability model.
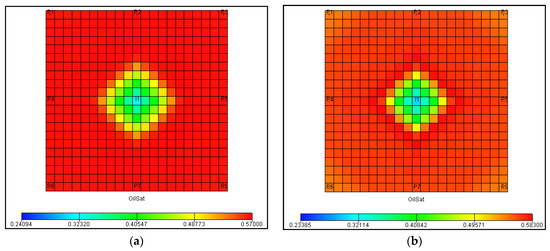
Figure 6.
Residual oil saturation diagram on January: (a) Darcy seepage; (b) non-Darcy seepage.
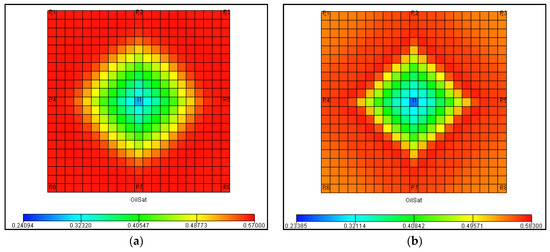
Figure 7.
Residual oil saturation diagram on March: (a) Darcy seepage; (b) non-Darcy seepage.
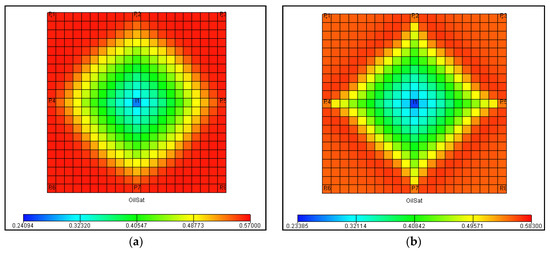
Figure 8.
Residual oil saturation diagram on June: (a) Darcy seepage; (b) non-Darcy seepage.
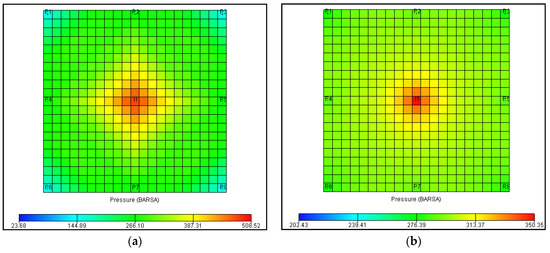
Figure 9.
Pressure distribution map on January: (a) Darcy seepage; (b) non-Darcy seepage.
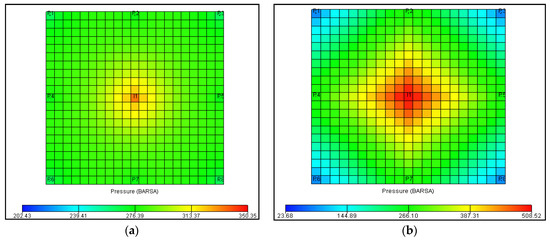
Figure 10.
Pressure distribution map on March: (a) Darcy seepage; (b) non-Darcy seepage.
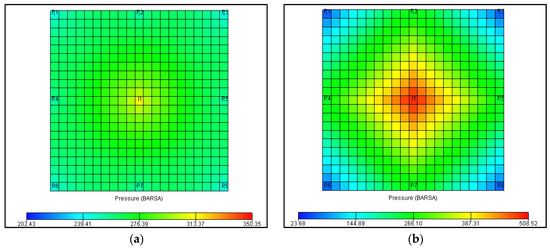
Figure 11.
Pressure distribution map on June: (a) Darcy seepage; (b) non-Darcy seepage.
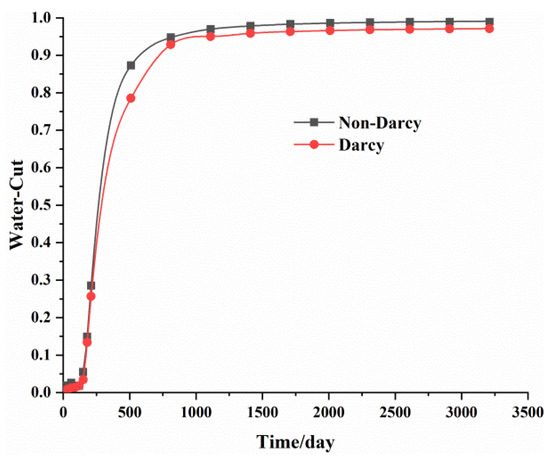
Figure 12.
Comparison of water cut curves of P2 well under Darcy and non-Darcy flow mode.
It can be seen from the graph of permeability change over time (Figure 13) that permeability rapidly changes at the bottom of the production well and water injection well, while the interwell permeability slowly changes. This is mainly because the energy supplemented by the injected water is mainly consumed around the well bottom, resulting in a faster rise in the bottom flow pressure. The bottom of the production well is affected by the start-up pressure gradient, which results in a faster pressure drop. Therefore, the large pressure difference between the water injection well and the production well greatly changes the permeability. However, the pressure difference between the grids in the interwell area is small, resulting in a small change in permeability. It can also be seen from Figure 14 that despite the large displacement pressure difference between the two wells, the production pressure difference will be small.
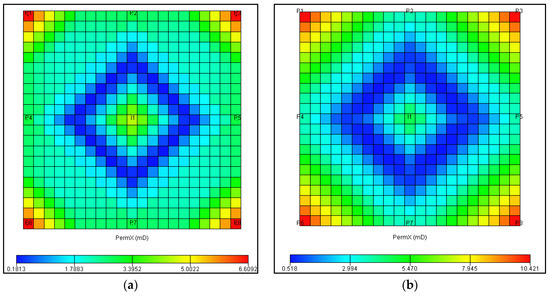
Figure 13.
Permeability distribution diagram under non-Darcy flow: (a) January and (b) March.
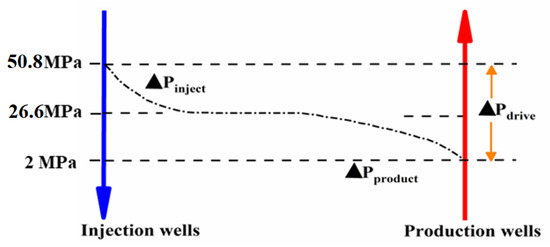
Figure 14.
Schematic diagram of pressure changes between injection and production wells.
Due to the large distance of the injection-production wells, the low pressure propagation and the rapid pressure decrease at the bottom hole resulted in a large pressure difference between the grids and a large change in permeability. Because the four side wells are slightly closer to the water injection well, the pressure spreads slightly faster, and the bottom hole pressure slowly drops, resulting in a smaller pressure difference between the grids than that of the corner wells, so the permeability change range is smaller than that of the corner wells.
3.2. Fitting Results
The three indicators of the whole region mainly include: comprehensive water cut, daily oil production, and cumulative oil production. Due to the smaller number of wells and time points in the study area, it was difficult to reflect the overall pressure level of the study area. Therefore, in the fitting process, pressure was not used as a fitting index to avoid partial coverage errors.
The comprehensive water cut curve, daily oil production, and cumulative oil production are shown in Figure 15 and Figure 16. The results of these three factors were in good agreement with the actual curves, and the cumulative oil production error was less than 1%.
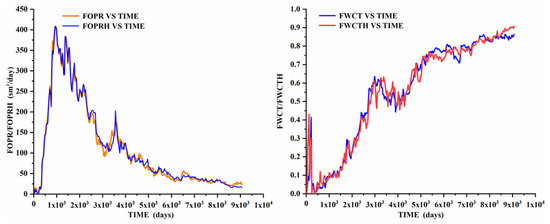
Figure 15.
(a) Comprehensive water cut fitting; (b) fitting of daily oil production in the whole region.
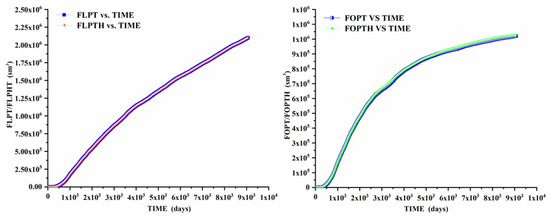
Figure 16.
(a) Accumulated oil production fitting; (b) Fitting of cumulative fluid production across the region.
4. Discussion
Taking a certain reservoir as an example, the reservoir has a burial depth of 3523 m, average permeability of 16.7 mD, average porosity of 14.3%, and original formation pressure of 36.4 MPa. Comparing the calculation results of Darcy and non-Darcy flow in Figure 17, the difference in formation pressure between oil wells and water wells is small (<3 MPa) in Darcy flow and large in non-Darcy flow, resulting in serious pressure around water wells. The large pressure drop around oil wells indicates that the pressure transfer of water injection is slow. Compared with the actual monitoring results, the calculation results of the non-Darcy seepage model are more accurate, as shown in Table 1.
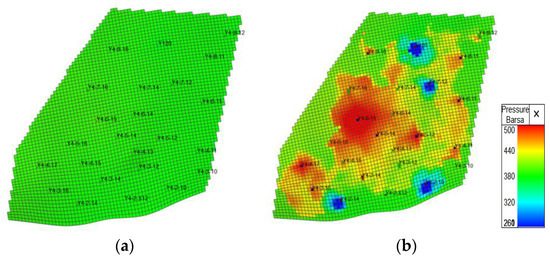
Figure 17.
Pressure profile in April 2020: (a) Darcy flow; (b) non-Darcy flow.

Table 1.
Calculation results of Darcy and non-Darcy flow.
The test results of Table 2 and Table 3 show that the relative water absorptions calculated by non-Darcy in Well Y4-6-15 in July 2009 and Well Y4-4-17 in May 2020 agree with the actual testing results.
Table 2.
Comparison of relative water absorption in Well Y4-6-15 (July 2009).
Table 3.
Comparison of relative water absorption in Well Y4-4-17 (May 2020).
As can be seen from Figure 18, the large hierarchical difference between the remaining oil saturation in Well Y120 and the high remaining oil saturation of the 71 and 722 layers show weak submerged layers and consistency with the test results of the liquid production profile. The results of relative liquid production and water cut stratification show that the non-Darcy calculation method is more consistent with the actual monitoring results, as shown in Table 4.
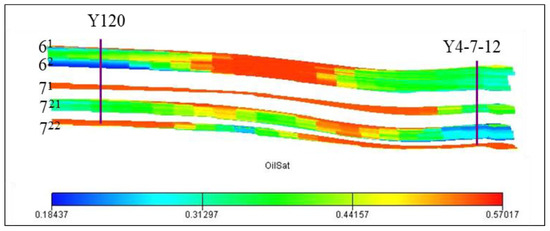
Figure 18.
The well profiles of remaining oil saturation Wells Y120 and Y4-7-1.
Table 4.
Testing results of liquid production in in Y4-5-14 Well.
5. Conclusions
Apparent permeability and relative permeability were employed to describe the non-Darcy flow in low-permeability reservoirs. The simulation results showed the difference between Darcy and non-Darcy flow.
- (1)
- The boundary layer is the key parameter affecting the nonlinear characteristics of oil–water two-phase seepage in low-permeability reservoirs. Smaller pressure gradients and thicker boundary layers result in smaller effective seepage radii and smaller apparent permeability. Therefore, the equation between apparent permeability and pressure gradient constructed in this study can effectively characterize the nonlinear seepage characteristics of low-permeability reservoirs.
- (2)
- Based on the relationship between the apparent permeability and pressure gradient, the fractional flow equation was also modified in this study. The calculation results showed that the water cut calculated by the new fractional flow equation is higher than that calculated by Darcy seepage, and is consistent with the actual development of low-permeability reservoirs.
- (3)
- A numerical simulation of low-permeability reservoir was carried out, which proved that the calculated results were in good agreement with the test results. The key parameters of Equation (4) need to be obtained through laboratory experiments.
Author Contributions
Conceptualization, N.L. and H.X.; methodology, Y.T.; software, Y.C.; validation, H.X., N.L. and Y.C.; formal analysis, Y.T.; investigation, Z.G.; resources, Y.H.; data curation, Y.C.; writing—original draft preparation, H.X.; writing—review and editing, H.X.; visualization, W.J.; supervision, N.L.; funding acquisition, N.L. All authors have read and agreed to the published version of the manuscript.
Funding
The authors would like to acknowledge the financial support from the Science and Technology Project of Changzhou City (grant no. CJ20210120), Jiangsu Key Laboratory of Oil-gas Storage and Transportation Technology (grant no. CDYQCY202201), and the Research Start-up Fund of Changzhou University (grant no. ZMF21020056).
Data Availability Statement
The data used to support the findings of this study are included within the article.
Conflicts of Interest
The authors declare that they have no known competing financial interest or personal relationships that could have appeared to affect the work reported in this paper.
References
- Hao, P.; Xiang, J.; Wang, W.; Kang, Y. Study on the relationship between starting pressure gradient and permeability in low permeability reservoirs. J. Oil Gas Technol. 2008, 28, 1416–1423. [Google Scholar]
- Thauvin, F.; Mohanty, K.K. Network modeling of non-Darcy flow through porous media. Transp. Porous Media 1998, 31, 19–37. [Google Scholar] [CrossRef]
- Xiong, Y.; Yu, J.; Sun, H.; Yuan, J.; Huang, Z.; Wu, Y.S. A new Non-Darcy flow model for low-velocity multiphase flow in tight reservoirs. Transp. Porous Media 2017, 117, 367–383. [Google Scholar] [CrossRef]
- Xu, J.; Jiang, R.; Xie, L.; Wang, R.; Shan, L.; Li, L. Non-Darcy flow numerical simulation for low-permeability reservoirs. In Proceedings of the SPE Europec/EAGE Annual Conference, Copenhagen, Denmark, 4–7 June 2012. [Google Scholar]
- Ding, J.; Yang, S.; Nie, X.; Wang, Z. Dynamic threshold pressure gradient in tight gas reservoir. J. Nat. Gas Sci. Eng. 2014, 20, 155–160. [Google Scholar] [CrossRef]
- Hao, F.; Cheng, L.S.; Hassan, O.; Hou, J.; Liu, C.Z.; Feng, J.D. Threshold pressure gradient in ultra-low permeability reservoirs. Petrol. Sci. Technol. 2008, 26, 1024–1035. [Google Scholar] [CrossRef]
- Sedahmed, M.; Coelho, R.C.V.; Wardal, H.A. An improved multicomponent pseudopotential lattice Boltzmann method for immiscible fluid displacement in porous media. Phys. Fluids 2022, 34, 023102. [Google Scholar] [CrossRef]
- Zeng, J.; Wang, X.; Guo, J.; Zeng, F.; Zhang, Q. Composite linear flow model for multi-fractured horizontal wells in tight sand reservoirs with the threshold pressure gradient. J. Petrol. Sci. Eng. 2018, 165, 890–912. [Google Scholar] [CrossRef]
- Xu, P.; Qiu, S.; Yu, B.; Jiang, Z. Prediction of relative permeability in unsaturated porous media with a fractal approach. Int. J. Heat Mass Tran. 2013, 64, 829–837. [Google Scholar] [CrossRef]
- Sedahmed, M.; Coelho, R.C.V.; Araújo, N.A.M.; Wahba, E.M.; Wardal, H.A. Study of fluid displacement in three-dimensional porous media with an improved multicomponent pseudopotential lattice Boltzmann method. Phys. Fluids 2022, 34, 103303. [Google Scholar] [CrossRef]
- Zhao, L.; Jiang, H.; Wang, H.; Yang, H.; Sun, F.; Li, J. Representation of a new physics-based non-Darcy equation for low-velocity flow in tight reservoirs. J. Petrol. Sci. Eng. 2020, 184, 106518. [Google Scholar] [CrossRef]
- Lu, D.; Seadawy, A.R.; Khater, M.M.A. Structure of solitary wave solutions of the nonlinear complex fractional generalized Zakharov dynamical system. Adv. Differ. Equ. 2018, 2018, 266. [Google Scholar] [CrossRef]
- Liu, N.; Ju, B.; Yang, Y.; Brantson, E.T.; Wang, J.; Tian, Y. Experimental study of different factors on dynamic characteristics of dispersed bubbles rising motion behavior in liquid-saturated porous media. J. Petrol. Sci. Eng. 2019, 180, 396–405. [Google Scholar] [CrossRef]
- Zeng, Z.; Grigg, R. A criterion for non-Darcy flow in porous media. Transp. Porous Media 2006, 63, 57–69. [Google Scholar] [CrossRef]
- Cui, J.; Sang, Q.; Li, Y.; Yin, C.; Li, Y.; Dong, M. Liquid permeability of organic nanopores in shale: Calculation and analysis. Fuel 2017, 202, 426–434. [Google Scholar] [CrossRef]
- Guan, C.; Hu, W.; Li, Y.; Ma, R.; Ma, Z. Prediction of oil-water relative permeability with a fractal method in ultra-high water cut stage. Int. J. Heat Mass Tran. 2019, 130, 1045–1052. [Google Scholar] [CrossRef]
- Muljadi, B.P.; Blunt, M.J.; Raeini, A.Q.; Bijeljic, B. The impact of porous media heterogeneity on non-Darcy flow behaviour from pore-scale simulation. Adv. Water Resour. 2016, 95, 329–340. [Google Scholar] [CrossRef]
- Chai, Z.; Shi, B.; Lu, J.; Guo, Z. Non-Darcy flow in disordered porous media: A lattice Boltzmann study. Comput. Fluid 2010, 39, 2069–2077. [Google Scholar] [CrossRef]
- Feng, Q.; Xu, S.; Wang, S.; Li, Y.; Gao, F.; Xu, Y. Apparent permeability model for shale oil with multiple mechanisms. J. Petrol. Sci. Eng. 2019, 175, 814–827. [Google Scholar] [CrossRef]
- Liu, N.; Chen, X.; Ju, B.; He, Y.; Yang, Y.; Brantson, E.; Tian, Y. Microbubbles generation by an orifice spraying method in a water-gas dispersion flooding system for enhanced oil recovery. J. Petrol. Sci. Eng. 2021, 198, 108196. [Google Scholar] [CrossRef]
- Ren, X.J.; Zhang, G.H.; Liao, F.F. Criterion of starting pressure gradient existence of non-Darcy flowing in low permeability porous media. J. Liaoning Tech. Univ. 2009, 28, 273–276. [Google Scholar]
- Yao, Y.; Ge, J. Characteristics of non-Darcy flow in low-permeability reservoirs. Pet. Sci. 2011, 8, 55–62. [Google Scholar] [CrossRef]
- Wang, X.; Sheng, J.J. Effect of low-velocity non-Darcy flow on well production performance in shale and tight oil reservoirs. Fuel 2017, 190, 41–46. [Google Scholar] [CrossRef]
- Wang, C.; Liu, H.; Wang, X.C.; Zhang, L.H. High Blocking Capacity of Fuzzy-Ball Fluid to Further Enhance Oil Recovery after Polymer Flooding in Heterogeneous Sandstone Reservoirs. ACS Omega 2021, 6, 34035–34043. [Google Scholar] [CrossRef] [PubMed]
- Mohamed, K.; Seadawy, A. Finite volume scheme for numerical simulation of the sediment transport model. Int. J. Mod. Phys. B 2019, 33, 1950283. [Google Scholar] [CrossRef]
- Khan, K.A.; Seadawy, A.R.; Jhangeer, A. Numerical appraisal under the influence of the time dependent Maxwell fluid flow over a stretching sheet. Math. Methods Appl. Sci. 2021, 44, 5265–5279. [Google Scholar] [CrossRef]


Publisher’s Note: MDPI stays neutral with regard to jurisdictional claims in published maps and institutional affiliations. |
© 2022 by the authors. Licensee MDPI, Basel, Switzerland. This article is an open access article distributed under the terms and conditions of the Creative Commons Attribution (CC BY) license (https://creativecommons.org/licenses/by/4.0/).