Abstract
The aim of this paper is modeling and parameter identification of the leader stage preceding the positive stroke of natural cloud-to-ground lightning. This research is based on electric field and 3D Doppler radar data recorded during thunderstorms in Poland, as supplied by database information from long range lightning location systems. The numerical simulation performed in the MATLAB platform showed that a high number of assumed model parameters, such as non-uniform leader tip speed and lightning channel charge density, allowed us to obtain greater compliance between simulated and measured electric field signatures than in the classical approach. The proposed model can be implemented in lightning location systems and forest fire warning systems, operating globally to reduce the risk of damages caused by positive cloud-to-ground flashes being one of the most dangerous type of lightning events. An alternative application of the model can be for research, including ground-based lightning data supplementation for the corresponding satellite and airborne registrations.
1. Introduction
Negative and positive CG flashes differ in their properties and occurrence rates. The polarity of a cloud-to-ground (CG) flash can be classified as positive or negative. This category is based on the polarity of the net effective electric charge transferred by such lightning discharge from a thundercloud to the ground. If the result of the lightning discharge is to move negative charge from a cloud to the ground, it is called a negative CG flash. However, when this flash is effectively transferring positive charge from a cloud to the ground, then it is called a positive CG flash. This terminology is in common use in lightning literature [1]. The different polarity of the lightning influences the leader stage preceding CG strokes, e.g., positive leaders are observed in case of downward positive and upward negative CG lightning.
A positive CG flash is one of the most dangerous types of lightning discharges [2]. Therefore, there is a strong motivation to properly model the initial stage of this phenomenon. The occurrence of positive leaders is highly dependent on a number of downward positive lightning events [2,3]. Downward positive CGs usually dominate some winter storms, constituting up to 90–100% of their total lightning CG events, as is reported by Brook et al. [4]. However, overall lightning rates in winter are low. Summer thunderstorms produce predominantly negative CG flashes, e.g., negatives represent more than 97% of the CG flashes in the continental USA. A similar ratio of negative to positive CG flash numbers is also observed in Poland, where about 90% of all CG flashes are detected by the Polish lightning detection network called PERUN [5]. An increase in the fraction of positive lightning in summer thunderstorms is usually correlated with increasing latitude and with increasing elevation above sea level.
Pierce [6] was the first who carried out electric field measurements at the earth’s surface with a sufficient time resolution to identify slow and rapid changes in the electric field that he attributed, respectively, to the positive leader and return stroke in ground flashes. The next milestone in the research of positive CG lightning discharges was achieved by Berger [7]. He introduced four possible and different types of CG flash initiations, from which two of them were recognized as those responsible for lowering positive charge to the ground. The amount of electric charge distributed in the lightning leader channel is strongly dependent on the peak current observed during the return stroke stage. Berger found that the median of typical values of charge transfer in positive return strokes of CG flash was about 15 C, but that 5% of such strokes can transfer more than 150 C to the ground. Taking into account that the longest time duration of the return stroke may be 3 ms [1], it means that the value of the lightning peak current of positive CG flashes recorded by Berger in Switzerland ranged from 5 kA to 50 kA. However, Rakov and Uman [1] reported that such a lightning peak current of positive CG flashes in the USA can sometimes exceed the value of 300 kA.
Recently, increasing parameters of high speed video recording give us many new and unique possibilities of optical observations of the lightning leader process [8]. Using video acquisition speed time resolutions from a thousand up to more than ten thousand frames per second, the initial of the lightning discharge processes can be analyzed in detail on its way between the ground and the thundercloud [9,10,11]. Some representative high-speed video analyses of positive leader development can be found in [1,2].
One of the most advanced models of a positive downward lightning leader development, assuming a distributed LCR circuit representation of the lightning channel, was provided by Fofana et al. [12]. Their predictive model was able to estimate a leader current and the corresponding charge distribution, propagation velocity and the energy injected into the gap. In turn, in this paper, we present a new approach to modeling of the downward leader stage of a positive CG flash and computation of some important parameters of this lightning process, having to dispose of remote electric field signatures of CG flash incidents recorded and detected in the ELF/MF frequency range by our measuring stations.
Lightning is one of the most common causes of forest fires [13]. Positive lightning is especially dangerous because of the statistically higher peak currents and the continuing current component often occurring during this type of lightning [1,2]. In fact, the proposed method, being a further extension of the model of positive lightning leader presented by [14], can be implemented in the large lightning monitoring systems operating all over the world [15,16,17] to effectively identify CG positive lightning. This information can significantly reduce the time between the lightning fire’s ignition and firefighting actions. Another way of applying this model is to use estimated characteristics of positive lightning as complementary data for satellite [18] and airplane [19] geospatial lightning research. Our improvements, introduced to the modeling procedure, take into account the linearly varied velocity of the downward leader that is changing during its propagation and estimation of charge density of the lightning leader channel. The optimal selection of initial conditions for the fitting of the proposed model was supplemented by data from a wide range of lightning location systems (LLS): PERUN and LINET, our recordings of electric field signatures representing the positive lightning leader stages and the corresponding volumetric Doppler radar visualization.
2. Measurement Setup
The lightning data used in this paper were obtained from two lightning research systems operating in Rzeszow [20] and Warsaw [21]. The electric field recordings, being the primary source of data, were obtained with the application of a similar E-field antenna working in the ELF/MF frequency range and developed at the Warsaw University of Technology [22]. Both systems have dedicated triggering circuits that mainly enable researchers to detect and record cloud-to-ground (CG) flashes (Figure 1).
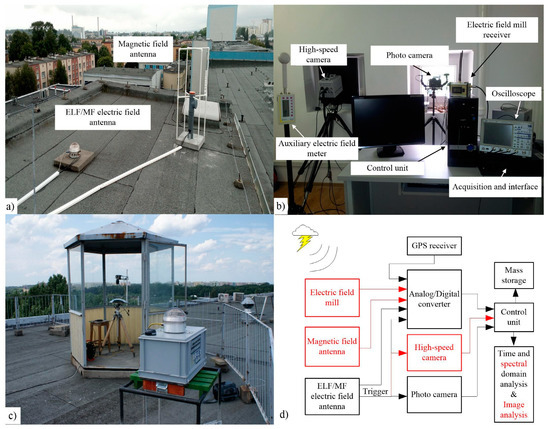
Figure 1.
Lightning observatory sites in Rzeszow and Warsaw; sensors used for electromagnetic measurements in Rzeszow are shown in panel (a), and the supplementary video acquisition portion is provided in panel (b), while the general view of the LLDN-F station located on the roof of IG PAN building is presented in panel (c). Here, the GPS/Garmin receiver and E-field antenna sensor are mounted on the top of the grey box with the A/D recorder and the power supply buffer inside. The additional cabin used for optical lightning observations has the parabolic mirror inside and a digital fast camera mounted on a tripod. (d) Block diagram of lightning registration systems in Rzeszow and Warsaw. Notice that both systems are similar regarding their hardware configuration. Additional elements which were present in the system operating in Rzeszow were highlighted in red in the diagram.
The Lightning Observatory in Rzeszow (LOR) is located at the roof of Building B of the Rzeszow University of Technology. It consists of two main functional blocks, used for the lightning electromagnetic field detections and recordings, and a high-speed video camera used for optical lightning observations and records. The station was set up in 2013 with the capability for only lightning E-field acquisition. In the next years, it was supplemented by the high-speed video camera Photron SA5 and bi-directional magnetic antenna. Moreover, the additional slow E-field sensor working in the frequency range from DC to 10 Hz, the so-called electric field mill, gave us the possibility to monitor polarity and any approaching thundercloud dipole [23]. More detailed analysis, including lightning detection and identification of different fast E-flied changes occurring during consecutive development stages of the ground flashes, can be obtained using data from the so-called fast E-field antenna operating in the frequency range from 0.5 Hz to 3 MHz [20]. E-field signatures of all main components of the lightning ground flash, such as preliminary breakdown (PB) phase, leader (L) stage, return stroke (RS) and continuing current (CC), can be recorded and recognized. The frequency bandwidth and detection range of our magnetic [24] and E-field antenna are close to each other. The LOR lightning detection range is about 50 km. As to the high speed color camera used, it was set at 7000 fps and run under the dedicated application that was developed in the MATLAB, and which automatically selected the most valuable camera recordings synchronized with the triggering of fast E-field antenna records. The camera application was based on the Photron software development kit (SDK) for MATLAB. The automatic recognition of particular lightning flashes was based on a frame by frame analysis of lightning channel luminosity. The lightning flash preselection was necessary because the camera was triggered by the omnidirectional electric field antenna. Therefore, most of the registered lightning events were not in the camera’s field of view, which was about 60°. The entire data acquisition system was GPS synchronized with UTC time with a precision of 1 µs and was realized with the application of a 4-channel 25 MS/s Spectrum Mi3131 card.
In the summer of 2009, the Local Lightning Detection Network (LLDN) in the Warsaw region was set up as the result of the research project No. COST/204/2006, granted by the Polish Ministry of Science and Higher Education. In that time, this network consisted of six E-field measurement stations. Each LLDN measuring station records the variations in the vertical component of the electric field coming from a lightning flash. The stations were equipped with an E-field antenna with a triggering circuit, two-channel data recording device, commercial GPS receiver and a power supply system with a battery backup. The specially constructed data recorders were based on the standard PC/104 built-in computer (AMD LX800 @ 500 MHz) run on a Linux operating system. Each recording device has been designed as a stand-alone station working without any operator assistance required during a measurement session. The built-in internal hard drive (~150 GB data buffer) allowed us to store recorded data for 3 days maximum, i.e., 72-hour continuous recording in fast mode with a bandwidth up to 100 kHz. A more detailed description of the software and hardware used by each LLDN station is provided by Baranski et al. [21]. As of summer of 2019, after ten years, only one LLDN station, i.e., the LLDN-F, kept its initial location in Warsaw (20°939444 E, 52°245833 N), and its general view was shown in Figure 1c.
3. Analytical Model of Positive Lightning Leader with Varied Propagation Velocity and Charge Density Prediction
A new approach to the modeling of a positive lightning leader is presented in the three following sections. The model was based on a well-known formula for the negative lightning leader, but with several significant changes made. One of the most important improvements was the introduction of the varied velocity of the leader tip during its propagation. The analytic model is presented in Section 3. The initial conditions necessary for computer simulation are found in Section 4 and Section 5. In Section 6, the model is verified using measured electric field signatures of several leader stages observed during positive CG lightning. The block diagram for the proposed algorithm is presented in Figure 2.
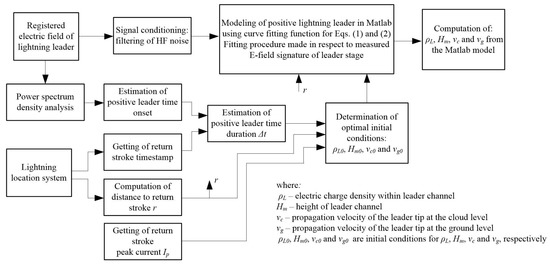
Figure 2.
Block diagram for proposed method of modeling leader stage in positive CG lightning.
The proposed model of a positive lightning leader is based on Equation (1), which corresponds to the formula for the vertical component of an electric field Ez from a negative downward leader given by Rakov and Uman [1]:
where ρL is the linear charge density in C/m deposited along the vertical leader channel, ε0 is the electric permittivity of a vacuum assumed as 8.84 × 10⁻¹² F/m, r is the horizontal distance to the leader channel in m, Hm is the leader channel height given in m and zt is the height above ground of the stepped leader tip in meters at the time t, given in seconds. The geometry of the model is presented in Figure 3.
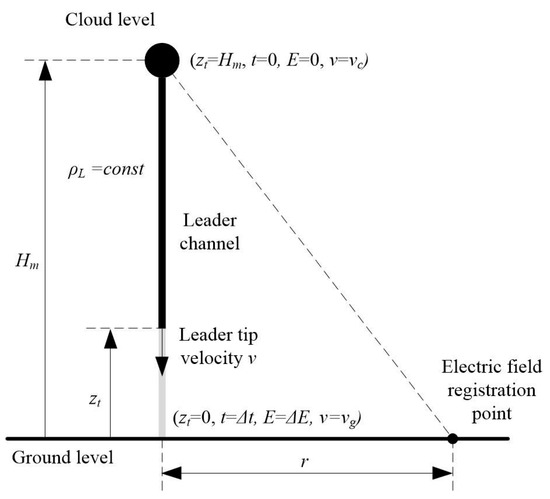
Figure 3.
Positive lightning leader geometry applied in the modeling procedure.
This model assumes that the electric field is generated by the positive point charge located at height Hm above ground level and that the electric charge is removed from this source point and distributed in the vertically developing downward leader channel. Nevertheless, the net electric charge is taken as fixed. It should be noted that the negative sign in Equation (1) denotes that we take into consideration a case of positive lightning leader occurrence. Here, it should be added that, in practice, the parameter Hm can be treated as the level from which the lightning leader starts its downward propagation rather than the absolute leader channel length. This assumption results from a very low change in the vertical electric field that may be caused by a horizontally propagating lightning leader at an onset development phase and from which an E-field recording is very difficult to obtain.
Variation in lightning leader propagation velocity was introduced to the model by the new Formula (2) that replaces the former linearly changing variable zt = Hm − vt, where v was the constant propagation velocity of the lightning leader:
The new approach which is proposed in this paper assumes a linearly changing leader propagation velocity from vc at the cloud level to vg observed near the ground. Both velocities should be put into (2) in m/s. The Formula (2) is more complex than this one taken previously, in the case of constant leader propagation velocity. It increases the number of degrees of freedom of the model, but the fitting quality is much better for positive lightning leaders, for whom variation in the propagation velocity is usually greater than for the negative stepped leaders of CG flashes. The effect of increasing velocity, in the case of a positive lightning leader, can usually be observed in the corresponding E-field signatures by the abrupt increase in the E-field waveform’s steepness. Introducing Equation (2) into Equation (1) provides a better fit to measured E-field data.
4. Determination of Optimal Initial Conditions for Conducted Simulation of Positive Lightning Leader Development
Formula (1), together with (2), is highly nonlinear, with many local extremes for most of its input parameters, such as ρL, Hm, vc and vg. The optimal set of these values should provide a good compliance of the model with the particular electric field registration of individual CG flash. The calculations presented in this section allow us to establish a set of initial conditions which increases the probability of finding the model fit that is closer to the real characteristics of a lightning leader observed in nature. However, in order to find this set, the selection should be started from the reasonably proposed initial conditions: ρL0, Hm0, vc0 and vg0, and then, the positive lightning leader model fitting procedure for these parameters should be applied based on the data from lightning location systems and recorded E-field signatures of the positive lightning incidents. The optimal choice of initial conditions was based on knowledge about lightning leaders outlined in literature (Equations (3) and (4)), the correlation between electric charge density and lightning current peak (Equation (5)) and the initial assumption of uniform distribution of leader tip propagation velocity (Equations (6) and (7)).
At first, an initial evaluation of the leader charge density ρL0 can be conducted by the application of the empirical formula given by Rakov and Uman [1]:
where Ip is the peak value of the lightning return stroke current in A, which can be obtained from the lightning location system, E30 is the vertical electric field change in V/m observed at a distance of 30 m from the lightning channel, given in kV/m, and a and b are constant coefficients assumed by Rakov and Uman [1] as a = 2.48 × 10³ A, b = 0.49 (A·m)/V.
This close vertical electric field change can be reasonably approximated as:
where ε0 is the electric permittivity of the air in F/m, and r30 = 30 m is the distance to the lightning channel where E30 is observed.
By the combination of Equations (3) and (4), one can remove the unknown E30 parameter and calculate the linear density of a charge during the return stroke stage on the basis of the known peak value of the lightning current, that is:
where ρL is expressed, in this case, in C/m. Note that one can assume ρL = ρL0 when the often-used assumption is made that electric charge density in the lightning channel during the leader stage and in the return stroke stage is the same. This assumption means that the entire electric charge distributed in the leader lightning channel during its propagation is neutralized by the following return stroke stage. Generally, this is a very raw approximation of the lightning leader charge density, but using more advanced formulas taking into account different lightning current attenuation models [25] can make the model simulation, based on Formula (1), much more complex and the computer time consuming [26].
Further, the initial condition, Hm0, can be estimated from Equation (1) and recorded E-field signatures of the positive lightning leader stage. In fact, ∆E = Eg − Ec can be estimated on the basis of the leader electric field stage identified from the recorded E-field signatures of the particular CG flash, where Eg is the electric field for zt = 0 when the leader tip is located at ground level, and Ec is the electric field for zt = Hm when the leader tip is located at in-cloud level. Finally, the total leader electric field change can be expressed from (1), as follows:
and the parameter Hm, given in meters, can be obtained directly from Equation (6) when ∆E in V/m is registered at the distance r, put into (6) in meters, which is known from the particular lightning location system. Equation (6) has two solutions from which only one fulfills the reasonable initial condition, that is, 200 m < Hm0 < 30,000 m reported for this parameter in the natural CG flashes. Note that Hm = Hm0 at the beginning of the optimization procedure. Therefore, the solution Hm0 from this value range was chosen for further analysis.
In addition, at the beginning of determining the optimal values of the lightning channel parameters and the processes taking place in this channel, it was assumed that the initial distribution of leader propagation velocity along the lightning channel was constant, and it was based on the computed initial leader channel height, as follows:
where ∆t given in seconds is the total duration of the leader stage obtained from the corresponding and recorded E-field signature [14]. The velocities vc0 and vg0 and the lightning channel height Hm0 should be put into (7) in m/s and meters, respectively. The procedure for determining this time interval, ∆t, is presented in the following Section 5 together with the general procedure describing how to identify the positive lightning leader stage.
5. Estimation of the Positive Leader Time Onset Based on the Recorded Lightning Electric Field and Power Spectrum Density
This section outlines how we can retrieve some important parameters related to the positive lightning leaders’ development, taking into account their recorded E-field time domain signatures and the relevant power spectrum density (PSD) spectrograms. Those parameters can then be used in the determination of the initial conditions given in Section 4. The total duration of lightning leader ∆t and its total electric field change ∆E were obtained from the mutual time and spectral domain analyses, according to the procedure presented in [14]. For this purpose, we have chosen 16 representative positive CG flash incidents from our lightning databases, which are listed in Table 1.

Table 1.
Positive CG flash incidents selected from Rzeszow (LOR) and Warsaw (LLDN) lightning databases. The distances were obtained from the LINET system for the LOR and from the PERUN system for the LLDN.
The criteria of CG events selection were the distance to the lightning strike point and the quality of E-field recordings. Note that the wide distance range of CG flashes indicated in Table 1 enabled us to validate the modeling for different types of E-field signatures of the positive lightning leader stages. Firstly, the end of such a positive lightning leader stage was identified by using lightning data from the LINET system [27] for Rzeszow detection and from the PERUN network [5,28] for Warsaw detection. Secondly, the time onset of the positive lightning leader stage was estimated from comparison of its E-field and the corresponding PSD signature occurring before the following RS. Thirdly, this ∆E characteristic for the particular positive lightning leader stage was calculated as the difference in E-field values recorded at the previously determined onset and termination of the considered leader stage.
Below, in Figure 4, Figure 5, Figure 6, Figure 7, Figure 8 and Figure 9, we present how these three evaluation procedures are proceeding in the case of the six positive CG flashes given in Table 1.
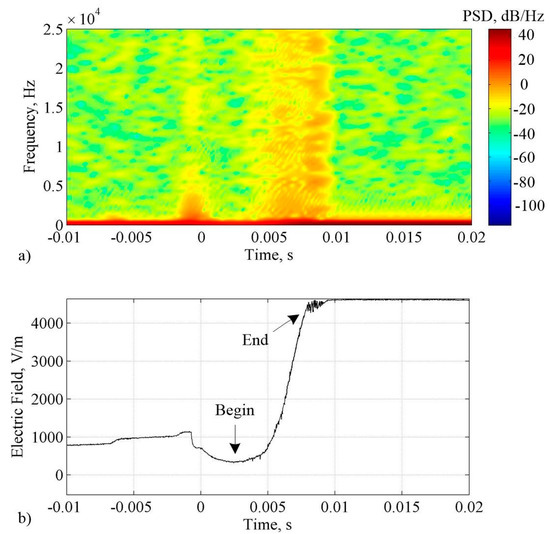
Figure 4.
Analysis of positive lightning leader stage for the closest positive CG flash detected by the LOR on 8 July 2014 at 12:31:46.918851 UTC (the Case #4 in Table 1). The zero-time moment in this plot corresponds to the reported trigger timestamp. This leader stage is seen in the E-field record shown in panel (b), and its relevant PSD spectrogram is given in panel (a), where black arrows indicate the beginning and ending time moment during the evolution of the considered leader stage. The adopted STFT parameters for this presentation are as follows: window = 150 samples, overlap = 149 samples, FFT length = 150 samples and fS = 50 kHz.
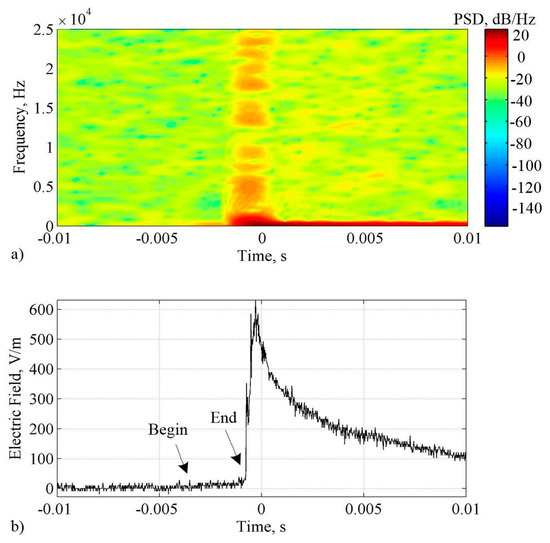
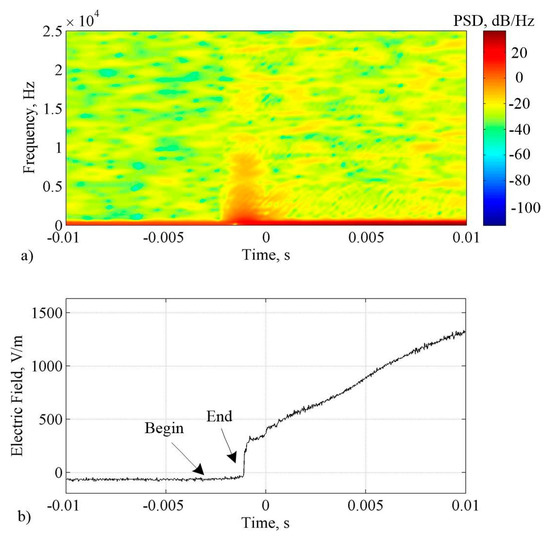
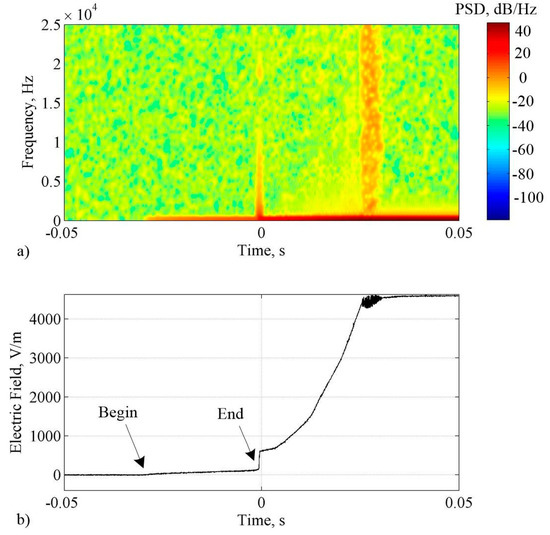
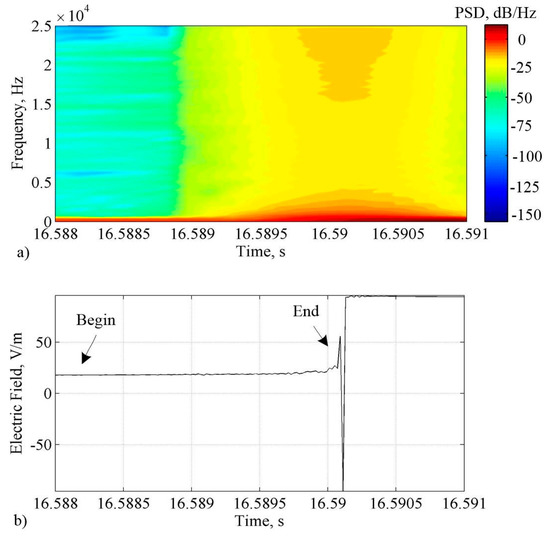
Figure 8.
Detection of the positive leader at the far distance to the lightning channel. It was obtained by the LLDN station on 7 June 2020 at 18:37:16.5901 UTC (see Case #11 in Table 1). The time in this plot corresponds to the reported positive return stroke timestamp. In panel (a), the PSD spectrogram of lightning’s positive leader stage is shown and corresponds with the course of its E-field signature given in panel (b). Here, the STFT parameters were chosen the same as in Figure 4.
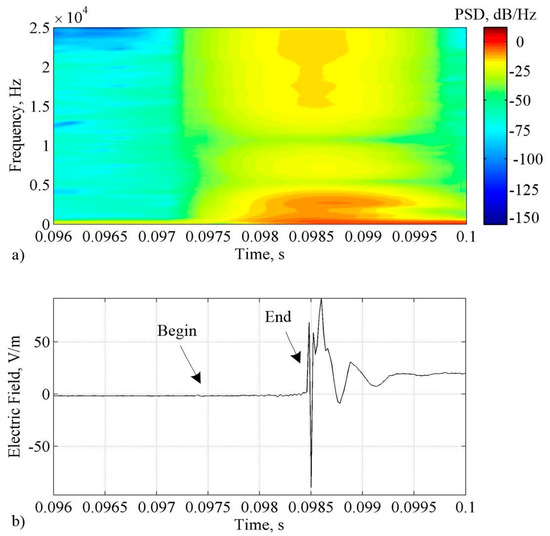
The first selected case, denoted by #4 in Table 1, is related to the closest positive CG flash detected by the LOR in Rzeszow. The relevant PSD spectrogram, together with the E-field signature of the positive lightning leader stage preceding the first RS incident, are shown in Figure 4.
The duration of the considered leader stage was ∆t = 5.48 ms, and its total electric field change was ∆E = 4.18 kV. The small, fast electric field change observed just before t = 0 resulted from another negative CG flash. This was also confirmed by the LINET detections. The corresponding spectral analysis was performed for 150 sample windows and 50 kHz sampling frequency, which gave a 3 ms width of the STFT (short-time Fourier transform) window. This value of the STFT width was selected based on the previous, and similar, analysis reported by Karnas et al. [29] as being optimal in the case of slow and fast lightning E-field signatures presented in one plot. The spectral intensity of the considered lightning leader stage is high in the entire frequency bandwidth. Lower frequencies correspond to the leader’s E-field changes, while those above 5 kHz correspond to the superimposed fast E-field pulse train generated by other lightning discharges from a distant thundercloud.
The second case from the presented selection is referred to as Case #5 in Table 1, where the distance of 7.6 km to the positive CG flash detected by the LOR can be comparable to the typical positive CG lightning channel length reported in the literature [1,2]. The relevant PSD spectrogram together with the E-field signature of the positive lightning leader stage preceding the first RS incident in this case are shown in Figure 5.
In Case #5, the identified time interval of the positive lightning leader stage duration was ∆t = 3.16 ms, and the leader total E-field change was ∆E = 27.8 V/m. The characteristic flat-type of such leader E-field changes usually recorded in this distance range from the lightning channel made recognition of the leader time’s onset difficult. On the other hand, the corresponding PSD spectrogram showed increased intensity in the low frequency bandwidth just before the first RS jump. It is worth noting that this leader spectrogram starts about 6 ms before the RS change. Thus, the real duration of the leader was reduced by 3 ms, resulting from the STFT window length blur.
The third case we took into consideration was Case #7 from Table 1. That event was related to the occurrence of a positive single CG flash recorded at the middle distance of 12.5 km from the LOR in Rzeszow. The relevant PSD spectrogram together with the E-field signature of a positive lightning leader stage preceding the first RS incident in this case are shown in Figure 6.
In Case #7, the evaluated time interval of the positive lightning leader stage’s duration was ∆t = 2.06 ms, and the leader total E-field change was ∆E = 46.4 V/m. Unless there is a much higher peak value of the lightning current for this lightning event, the value of leader ∆E change is much lower than in Case #4. This resulted from the greater than 1/r dependence of the magnitude of the electric field given by Equation (1) and which referred to the recorded flash distance for the middle and far r value.
For many positive CG flashes detected within a middle distance range, their E-field signatures of the positive lightning leader stage have a flat shape [1] that did not allow us to find the onset and ending point of this leader stage. Hence, the PSD spectrogram together with E-field signature of the positive lightning leader stage preceding the first RS incident in these cases can show only the corresponding return stroke PSD stripe with the frequency bandwidth up to 10 kHz. However, any spectral change of such a flat leader stage signature would not be possible to obtain. On the other hand, to improve the PSD visibility of the considered leader stage, a wider STFT window should be applied. However, the time domain resolution of such a PSD spectrogram can decrease, and it would be impossible to distinguish the lightning leader stage from the following RS change.
A further increase in the distance for detected positive CG flashes moves our analysis to Case #3, indicated in Table 1, when another single positive CG flash was recorded at 17.2 km from the LOR in Rzeszow. The relevant PSD spectrogram together with E-field signature of the positive lightning leader stage preceding the first R S incident in this case are shown in Figure 7.
In Case #3, the time duration of the positive lightning leader stage was ∆t = 30.8 ms, and it was the longest time interval from all considered cases. The total E-field leader change was found as ∆E = 167.2 V/m, and this value was almost four times greater than in Case #7, although the distance from the positive CG flash location was greater. It was due to the 25% higher peak value of the lightning current and the increasing steepness of the lightning leader’s E-field change, when the distance from the positive CG flash was greater than the reversal distance for lightning leader polarity E-field change, which is comparable to the average lightning channel length of 7 km reported for positive CG flashes [25].
Case #11 (Table 1) is the exemplary record of a positive single CG flash collected in the LLDN database related to the positive RS incident with a lightning peak current equal to 193.8 kA and detected 30.3 km from the LLDN station. This case is presented in Figure 8.
In Case #11, the evaluated duration of the lightning positive leader stage was ∆t = 1.9 ms, and its total E-field change was ∆E = 6.2 V/m. The major part of lightning’s positive leader E-field increase was observed at the end of leader stage, but the remaining part of this E-field course was flat. Thus, determination of the leader time onset from the relevant PSD spectrogram was impossible. This was due to the lightning leader’s short duration and the spectral leakage effect of the corresponding RS stripe [30].
Case #12 was the last that we have taken into consideration in this section. It is related to another far away detection of a single positive CG flash and recorded by the LLDN station operating in the Warsaw region (see Figure 9). In this case, the distance to positive RS was 69.2 km and to the RS peak current was 179.1 kA. Both parameters were obtained from the PERUN system [5].
In Case #12, the evaluated duration of lightning’s positive leader stage was ∆t = 1.04 ms, and its total E-field change was ∆E = 3.9 V/m. Similarly to Case #11, the recorded E-field signature of lightning’s positive leader stage is also flat. Except for the very high peak value of the RS current in Case #12, the total E-field change of lightning’s positive leader stage is the lowest from all considered cases. However, such an E-field change recorded at the distance of 69.2 km is dominated by the fastest radiated components of lightning’s electric field, while slowly changing the electrostatic component corresponding to lightning’s positive leader E-field change is almost completely attenuated. Therefore, close positive CG flash detections are the most useful for the relevant determination of lightning’s positive leader duration.
Finally, it is worth noting that when the lightning’s positive leader stage spectrum is dominated by the following return stroke spectral stripe, then this leader stage cannot be distinguished effectively (see Figure 6a). Such difficulties also arise when the total duration of lightning’s positive leader is lower than the applied STFT window used for its spectral analysis.
6. Verification of the Proposed Model Using Lightning E-Field Registrations
Positive lightning leader E-field signatures considered in Section 5 were simulated by using Equations (1) and (2) given in Section 3 and applying the initial conditions obtained from Equations (3) through (7), specified in Section 4. The aim of such simulations was determination from the ρL, Hm, vc and vg parameters that ensure the best fit of modeled lightning leader E-field changes to their recorded E-field signatures. This model fit was accomplished on the MATLAB platform by application of the built-in fit() function. This function was invoked with the ‘NonlinearLeastSquares’ method type and ‘Trust-Region’ algorithm as parameters of the fitting procedure. Both settings were found automatically by the fitoptions() function, invoked for the curve defined by Equations (1) and (2) as an input parameter. The noisy influence of fast E-field pulses superimposed on the lightning leader stage was reduced by using the preliminary filtering function of MATLAB, called smooth(). This function was applied with a default setting, which means that the filtering algorithm was moving the average filter (MA). The minimum MA window length, which gave satisfying filtering quality without leader stage distortion, was found to be five samples. The wider MA window would significantly reduce the steepness of the lightning leader stage due to the low-pass character of the moving average filter. The narrower MA window would be not effective in removing of high-frequency noise superimposed on the lightning leader stage. The resulting simulations corresponding to the selected positive lightning leader stages and presented in Figure 4, Figure 5, Figure 6, Figure 7, Figure 8 and Figure 9 are shown in Figure 10, Figure 11, Figure 12, Figure 13, Figure 14 and Figure 15, respectively. It is almost physically impossible to record all lightning events starting from the value of E-field being 0 V/m. There is usually a strong variation in the E-field just before the leader stage. The reason for this is a preliminary breakdown activity inside the thunderstorm cloud, which leads to leader development. Please note that during the signal conditioning procedure, the beginning E-field level of lightning’s leader stage (see Figure 4, Figure 5, Figure 6, Figure 7, Figure 8 and Figure 9) was reduced to 0 V/m (see Figure 10, Figure 11, Figure 12, Figure 13, Figure 14 and Figure 15). It was necessary because the electric field from the lightning leader can only be correctly modeled by our procedure. The set of initial conditions taken as the starting point to the conducted simulations was specified in Table 2.
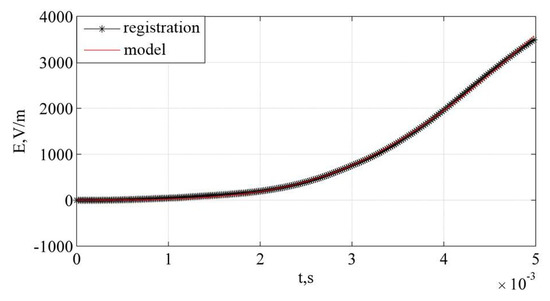
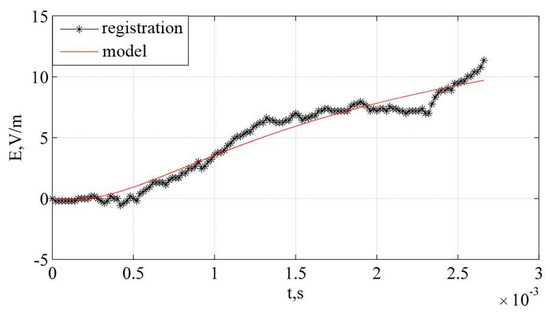
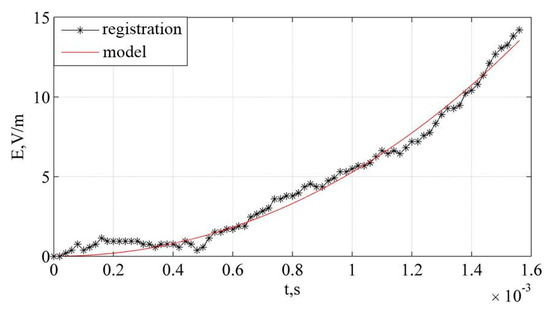
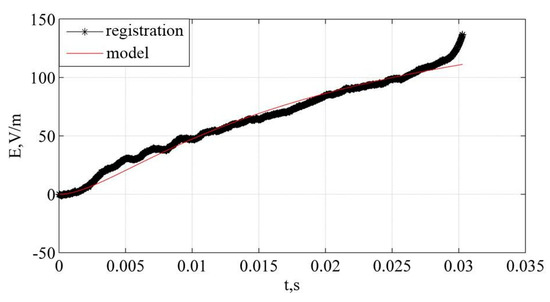
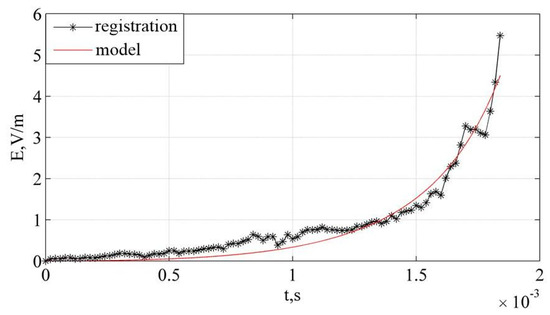
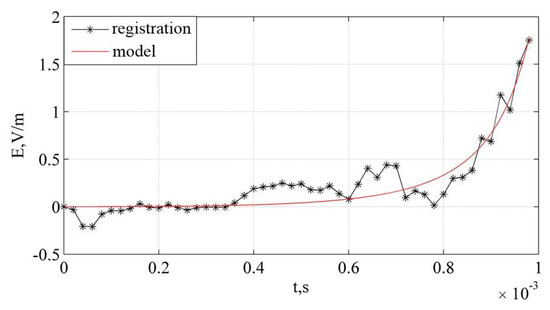
Table 2.
Set of initial conditions used in simulations of positive lightning leader stages and remaining parameters ∆t and ∆E identified from the recorded E-field leader signatures.
We can see from Table 2 that the initial condition for the linear charge density of the considered leader channel for Case #4 was one order lower than for the remaining cases. It was due to a relatively low lightning current peak value following this leader stage. On the other hand, the leader channel heights for Cases #8 to #16 were below 1 km, what seems to be unrealistic for real positive CG flashes. However, such low values of this parameter may suggest that the leader channel shapes can be highly nonlinear and can change its direction of propagation several hundreds of meters above the ground surface [31]. The range of leader propagation velocity corresponds to the typical values reported in the literature [1,2,3] and, initially, this velocity is assumed to be uniform. The evaluated leader durations taken to the model simulation decreased with the distance from the lightning channel. It was due to the attenuation of the electrostatic component of recorded leader E-field signatures and the dominance in the radiation part. The total E-field change in the considered positive lightning leader stage also decreased with distance. However, this trend was also dependent on the reported lightning peak current.
The leader stage presented in Figure 10 was accurately modeled. In this case, the recorded E-field leader course was precisely reproduced by the applied model. The quality of this fitting is described by the estimated coefficient of correlation Rsq. The definition of Rsq = 1 − RSS/TSS, where RSS is the sum of squared residuals between modeled and measured curves, and TSS is the total sum of squares of the measured curve in respect to its average value. The Rsq parameter was directly obtained from MATLAB simulation. The Rsq coefficient was 0.9996 for curves given in Figure 10. Notice that the increase in E-field steepness of the latter part of the signature in Figure 10 was correctly recreated by the proposed model.
In Figure 11, the considered E-field leader signature was disturbed in the middle part of the presented record, and it was probably influenced by slow E-field variations caused by some of the in-cloud electric charge displacements, but Rsq reported in this simulation case is also high and equal to 0.9997. It also can be noted that such recorded E-field distortions influenced the obtained result of the used model at the end stage of simulated leader course.
In the case presented in Figure 12, the recorded E-field leader change was noised by E-field variations, mainly parasitic, generated from in-cloud lightning discharges and other distant CG strokes. Despite this, the quality of the model fitting was still high, and Rsq = 0.9854. It is worth noting that the recorded E-field leader signature is fully reproduced by the model.
The fitting quality was Rsq = 0.9979 in the case shown in Figure 13, which means that the recorded leader stage was expressed properly by the model. Some deviations were only noted at the end of the recorded E-field leader signature, where the greater steepness appeared in E-field course changes. It may also be due to the more complex geometry of the leader channel and the density of the charge distributed along it.
Further, the fit corresponding to the recorded lightning leader E-field changes shown in Figure 14 had Rsq = 0.9483. Such a decrease in simulation quality was mainly caused by an abrupt E-field peak change that occurred at the end of the recorded lightning leader stage. On the other hand, this case of the lightning leader E-field signature was convenient for simulation because of its low number of E-field noise inflections and predictable character. The main part of E-field leader change was noted at the end of the leader stage, and it was typical for the occurrence of distant lightning leaders from the detection station.
Finally, the quality of modeling given in Figure 15 was also satisfying, and the considered indicator was Rsq = 0.8697. Here, the shape of the lightning leader E-field signature was different than in the former analyzed cases. Such E-field variation was flat for most of the leader duration. The fast single E-field jump during this leader change occurred just before the following RS phase. It was probably due to the attenuation of the electrostatic component of the recorded leader E-field change, which was usually dominated at the beginning and in the middle part of the distant recorded leader E-field signature.
The set of positive lightning leader parameters obtained from the conducted model simulations is listed in Table 3.
Table 3.
Set of positive lightning leader parameters obtained from the used model fitting and auxiliary computations. “↑” stands for increasing trend and “↓” stands for decreasing trend, respectively.
All parameters of positive lightning leaders refined from the performed model simulation were within ranges reported in literature [1,2]. Almost all these parameters changed their values compared to the initial ones assumed at the start of fitting process. Most of the lightning charge densities increased from their initial values. The high values of lightning charge density were noted in Cases #1, #3 and #11. Most of them were correlated with the higher peak values of the following RS events. The highest value of ρL was obtained in Case #1 despite the low RS current peak of 8.5 kA. Such high disproportion between the charge amounts of the leader and the following RS can be caused by the possible presence of the continuing current, which can be involved into neutralization of the major part of the electric charge distributed during the leader stage.
In most cases of close and middle distance leader incidents, the Hm parameter decreased significantly (see Table 2). This suggests that the upper part of the lightning leader channel above the Hm level could propagate horizontally [31]. Note that in our analysis, the parameter Hm, which was strongly correlated with determined time duration of the leader stage ∆t, was calculated from Equation (6), and therefore, its value depends not only on the recorded electric field change ∆E but also on the lightning distance from the station reported by the LLS. Hence, if the longer distance to the lightning leader and the shorter total duration ∆t of the leader stage are obtained from the corresponding E-field signature, then the lightning leader channel height Hm is lower. Finally, it makes the model more inaccurate in the cases of distant lightning leaders than for the closer ones.
The possibility of close lightning leader E-field recordings can be a complementary option for the future development of the lightning location systems, for which algorithms are typically based on dependencies derived for distant range CG flashes. For example, LLS stations that are idle for the close and middle distance CG flashes can work during this time with the new algorithm, and it would finally be beneficial for lightning parameter identification and analysis.
Table 3 also shows that the considered positive leader propagation velocity was characterized by its high variation. In eight cases, this velocity increased and, for the same number of cases, it decreased. Such a velocity decreasing trend of the positive leader propagation is not a common feature for this type of lightning leader. However, recent analyses of the high-speed video recordings of positive lightning leader development, reported in [32], suggest that such a scenario of its development is possible. The highest leader propagation speeds above 106 m/s were noted in the following Cases: #2, #6, #10, #13, #14 and #16. However, no correlation was found there with any other considered leader parameter. The lowest velocity propagations below 105 m/s were obtained in Cases #5 and #11. Such very slow leader propagation might be related to the specific lightning channel development conditions and, additionally, caused by a possible deviation in the bottom part of the lightning leader channel from the vertical geometry.
The last closely-related parameters depicted in Table 3 are leader charge density and the total electric charge of each lightning leader event, for which there is a relationship Q = ρLHm. It should be highlighted that this is the charge distributed in the nearest part of the leader channel that is taken perpendicular to the earth’s surface. The highest values of lightning leader charge were obtained in Case #1 and Case #9. In Case #1, a significant value of leader charge linear density appeared, while in Case #9, the total large leader charge was influenced by the relatively high lightning channel height. The lowest values of Q were evaluated in Case #2 and Case #5 and resulted from the low values of the linear charge density.
The presented method of positive lightning leader identification is dedicated to application in lightning location systems. Currently, the algorithm computation time is too long to use it directly for each registered lightning event. Therefore, some kind of preselection should be made by the LLS in advance. The basic step could be the preliminary identification of CG lightning’s polarity and, then, adaptation of the proposed method for positive CG lightning only. A further reduction in positive flash events which need to be identified in detail can be achieved by, e.g., selection of only those lightning events which were detected in the critical zones, such as airports, forests, elevated buildings, or urbanized areas of cities. This approach can substantially reduce the necessary computing power without a significant reduction in information important for lightning warning systems.
7. Doppler Radar Reflectivity in the Area of Estimated Positive Leader Channel
The aim of the analysis in this section was to check if, at the time moment when the particular lightning leader occurred (see Figure 10, Figure 11, Figure 12, Figure 13, Figure 14 and Figure 15), the significant value of radar reflectivity was registered and how it was in spatial domain. The temporal and spatial comparison of results obtained from lightning location systems, our model and Doppler radar data gave the possibility to analyze the correlation of characteristics of precipitation cores and expected lightning channel geometry predicted by our analysis.
The Doppler radar reflectivity profiles, as described by Tuszyńska [33], were computed for all 16 lightning leader events considered in this paper. The radar data were obtained from the Institute of Meteorology and Water Management, Poland. The time interval between consecutive radar volumetric data for the same area was much higher than the duration of particular lightning leader events. Therefore, such radar reflectivity was linearly approximated in the relevant spatial and time domain using two consecutive radar volumes which were close to the particular lightning leader event (see Table 4).
Table 4.
Doppler radar reflectivity in the area of positive lightning leader onset.
For the purpose of the following analysis, the relevant radar reflectivity volumes were cut by three perpendicular planes, whose intersection indicated the point of positive lightning leader onset predicted in Section 6 (see Table 3). Some exceptions to this rule were outlined in the footnote of Table 4. In the following Figure 16, Figure 17, Figure 18, Figure 19, Figure 20 and Figure 21, such thundercloud radar reflectivity presentations were graphically shown in the 3D domain. They correspond to the six selected positive lightning leader cases that have been previously analyzed in detail in Figure 4, Figure 5, Figure 6, Figure 7, Figure 8, Figure 9, Figure 10, Figure 11, Figure 12, Figure 13, Figure 14 and Figure 15. All locations of the considered lightning leader onset points were related to the positions of the Doppler radar in Rzeszow (50.11383 N, 22.03669 E, altitude: 241 m ASL) or other similar radar near Warsaw, in Legionowo (52.40547 N, 20.96125 E, 87 m ASL). The position of a particular Doppler radar was assumed to be the onset of the coordinate systems used in Figure 16, Figure 17, Figure 18, Figure 19, Figure 20 and Figure 21. The particular values of Doppler radar reflectivity obtained from these volumetric slicing cross-sections at the corresponding positive leader onset spatial locations were listed in Table 4. x, y and z coordinates given in the text and figures correspond to EW distance, NS distance and altitude as depicted in Doppler radar scanning data (Figure 16, Figure 17, Figure 18, Figure 19, Figure 20 and Figure 21) and are used interchangeably within this paper.
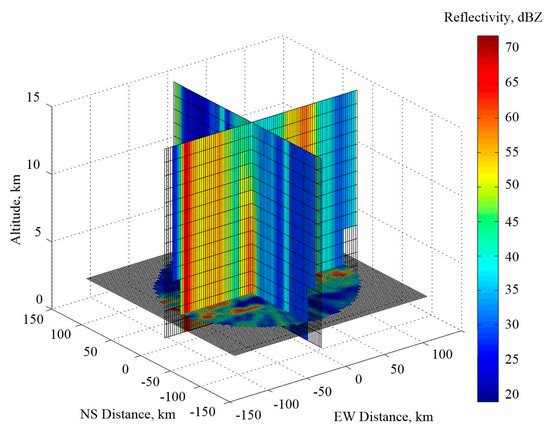
Figure 16.
Slicing cross-sections of the thundercloud volumetric Doppler radar reflectivity through the computed positive lightning leader onset, which is relevant to Case #4. Slicing cross-section planes are forward through the point indicated by coordinates: x = −11.9 km, y = −6.9 km, z = 2 km.
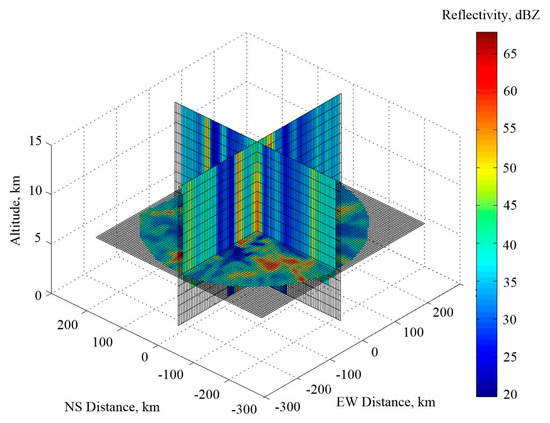
Figure 17.
Description is the same as in Figure 16, except for the relevant positive lightning leader onset indicated by Case #5 and slicing cross-section planes that are forward through the point indicated by coordinates: x = −2.3 km, y = −5.6 km, z = 5.9 km.
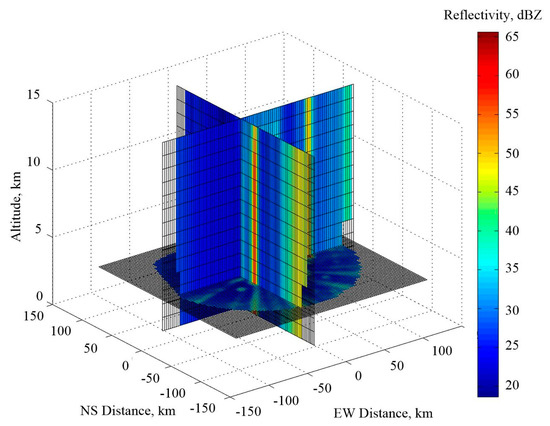
Figure 18.
Description is the same as in Figure 16, except for the relevant positive lightning leader onset indicated by Case #7 and slicing cross-section planes that are forward through the point indicated by coordinates: x = −21.7 km, y = −0.3 km, z = 3.3 km.
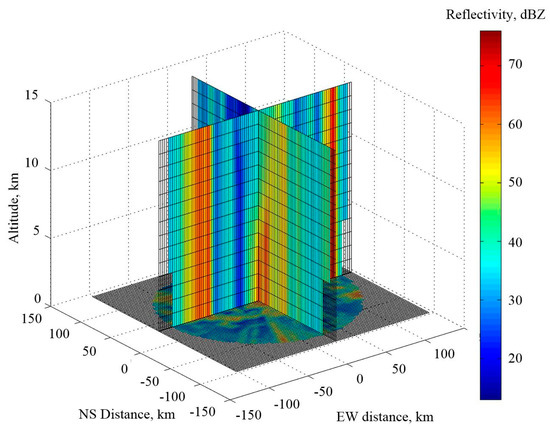
Figure 19.
Description is the same as in Figure 16, except for the relevant positive lightning leader onset indicated by Case #3 and cross-section planes that are forward through the point indicated by coordinates: x = 5.0 km, y = 5.2 km, z = 1 km. Notice that the slicing cross-section altitude was increased here, from 0.7 km to its indicated value of 1 km, and was caused by the lack of such radar reflectivity data at this extremely low altitude.
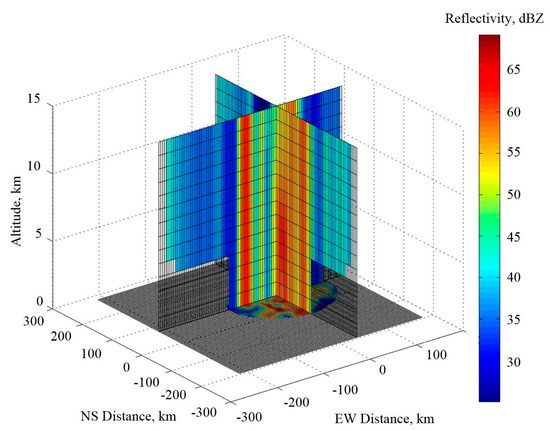
Figure 20.
Description is the same as in Figure 16, except for the relevant positive lightning leader onset, indicated by Case #11 and slicing planes that are forward through the point indicated by the coordinates: x = 2.9 km, y = 20.7 km, z = 1 km. Again, the slicing cross-section altitude was increased here, from 0.2 km to its indicated value of 1 km.
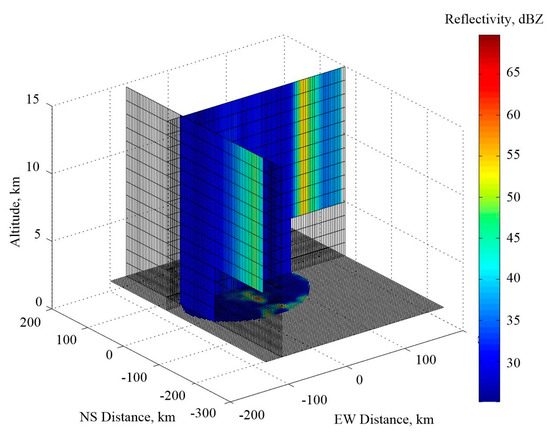
Figure 21.
Description is the same as in Figure 16, except for the relevant positive lightning leader onset indicated by Case #12 and slicing planes that are forward through the point, indicated by coordinates: x = −79.7 km, y = 29.2 km, z = 1 km. Again, the slicing cross-section altitude was increased here, from 0.3 km to its indicated value of 1 km.
The volumetric slicing cross-sections of radar reflectivity data related to Case #4 were presented in Figure 16. The radar reflectivity was 60.2 dBZ in the area of expected positive lightning leader onset. Such a high reflectivity value could mean that the initiation of the lightning leader incident probably occurred near or inside the precipitation core, even with a moderate hail. This can be confirmed by a high altitude, about 7 km, of such a precipitation core involved in lightning leader onset.
The next simulation based on radar reflectivity data, which corresponds to Case #5 (see Table 4), was given in Figure 17. This time, the radar reflectivity was 54.7 dBZ in the area of expected positive lightning leader onset. Hence, such a positive lightning leader incident could be developed inside an extended precipitation core with a moderate intensity. The spatial extension of this core was about 60 km in the x and y directions and above 15 km in the z direction.
The volumetric simulation of radar reflectivity data related to Case #7 were shown in Figure 16. Here, the expected positive lightning leader onset was placed near the high intensity thundercloud precipitation core. This precipitation core was thin regarding its x–y extension, but with the high attitude above 15 km. Without the close location of the considered positive lightning leader onset to such a precipitation core, the radar reflectivity at this point was only 27.8 dBZ.
The result of the last selected case that used data from the Doppler radar in Rzeszow was presented in Figure 19. Here, the radar reflectivity in the area of positive lightning leader onset had the highest value from all considered cases and was equal to 70.4 dBZ. This lightning leader onset was located at the boundary of a high intensity thundercloud precipitation core, for which the altitude was about 6 km.
Two volumetric simulations of radar reflectivity data from the Warsaw region related to Case #11 and Case #12 were depicted in Figure 20 and Figure 21. For all these cases obtained from the LLDN-F station, the evaluated lightning leader onset heights were placed below the Doppler radar scanning area of the considered thundercloud (see Table 3), for which the bottom altitude was 1 km. Therefore, the closest radar slicing cross-section at the z = 1 km plane was taken as the relevant one. In Case #11, the considered positive lightning leader event was developing inside an extended thundercloud precipitation core with the radar reflectivity of 57 dBZ. On the other hand, in Case #12, the scenario was extremely different. Here, any radar detected a thundercloud precipitation core around the positive lightning leader onset. The noted radar reflectivity of this thundercloud region had the lowest value from all cases reported in Table 4 and was only at the level of 27.7 dBZ. This means that a light in-cloud rain precipitation is expected in this area of positive lightning leader development.
Comparison of 3D Doppler radar data with the estimated positive CG lightning channel geometry showed that for most of the considered lightning events, there always was a strong precipitation core located close to the estimated lightning channel. There was no evident correlation found between the altitude of the positive leader onset and height of the corresponding precipitation core. This might be influenced by the complex geometry of the prospective lightning channel. However, further research based on a much larger dataset and supplemented by the satellite data or airplane high-speed video registration is desirable to prove this hypothesis.
8. Conclusions
This paper aimed to analyze several cases of positive lightning leader developments preceding the first RS in the considered single positive CG flashes. The implementation of the varied lightning leader propagation velocities and the capacity for leader channel charge density prediction significantly improved fitting quality of the used model to the recorded E-field signatures for considered positive lightning leader stages. Some auxiliary computations of initial conditions enabled a better selection of the optimal starting point for the numerical simulations performed. Mutual, time and PSD domain analyses showed the greater potential in application of the proposed model for the better identification of the positive lightning leader stage in comparison to the basic analysis of its E-field signatures. However, in some cases in which the evaluated time duration of the positive lightning leader stage is short, the used PSD analysis cannot determine the positive lightning leader stage’s duration properly due to the spectral leakage effect, which decreases the resolution of the spectrum in the time domain. On the other hand, the conducted analysis of the lightning leader E-field signatures recorded at different distances from the lightning channel suggests that the most valuable results can be obtained in cases of the close range E-field signatures when its electrostatic component dominates the entire recorded E-field course. In the remaining middle and distant cases of the collected positive lightning leader stages, the attenuation of the E-field electrostatic component of recorded positive lightning leader incidents is greater, and the shape of the positive lightning leader stage becomes flat, which can lead to an inaccurate result in its identification. Therefore, LLS stations that are usually idle for the close and middle distance CG flashes can work during this time with the algorithm proposed in this paper, and it would be finally beneficial for the overall lightning parameter identification and lightning phenomena analysis. The relatively low values of the simulated positive lightning leader channel heights suggest that such leaders can be able to start their downward propagation in the bottom part of a pattern thundercloud. This scenario can be possible if we take into account the statistical assessment of consecutive cases of positive lightning leader onsets presented by the relevant volumetric simulation of Doppler radar reflectivity profiles for different thunderclouds.
Author Contributions
Conceptualization, G.K. and G.M.; methodology, G.K.; software, G.K.; validation, G.K. and P.B.; formal analysis, G.K. and P.B; investigation, G.K. and P.B.; resources, G.K.; data curation, G.K.; writing—original draft preparation, G.K.; writing—review and editing, G.K. and P.B; visualization, G.K.; supervision, G.M.; project administration, G.M.; funding acquisition, G.M. All authors have read and agreed to the published version of the manuscript.
Funding
This research and the APC were funded by the Minister of Science and Higher Education of the Republic of Poland: Maintain the research potential of the discipline of automation, electronics, electrical engineering and space technologies. Grant number: PB22.ET.22.001. The participation of Piotr Baranski in this work was supported by a subsidy from the Polish Ministry of Education and Science for the Institute of Geophysics, Polish Academy of Sciences.
Data Availability Statement
Not applicable.
Acknowledgments
Special thanks are also directed to the Nowcast GmbH from Germany for providing the LINET lightning data and to the Institute of Meteorology and Water Management for the PERUN and radar volumetric data.
Conflicts of Interest
The authors declare no conflict of interest.
References
- Rakov, V.A.; Uman, M.A. Lightning: Physics and Effects; Cambridge University Press: Cambridge, UK, 2003; ISBN 9780521583275. [Google Scholar]
- Cooray, V. An Introduction to Lightning; Springer: Dordrecht, The Netherlands, 2015; ISBN 9789401789370. [Google Scholar] [CrossRef]
- Uman, M.A. The Lightning Discharge; Elsevier: Amsterdam, The Netherlands, 1987; ISBN 9780127083506. [Google Scholar]
- Brook, M.; Henderson, R.W.; Pyle, R.B. Positive lightning strokes to ground. J. Geophys. Res. 1989, 94, 13295. [Google Scholar] [CrossRef]
- Czernecki, B.; Taszarek, M.; Kolendowicz, L.; Konarski, J. Relationship between Human Observations of Thunderstorms and the PERUN Lightning Detection Network in Poland. Atmos. Res. 2016, 167, 118–128. [Google Scholar] [CrossRef]
- Pierce, E.T. (a) Electrostatic Field-Changes Due to Lightning Discharges. (b) The Development of Lightning Discharges. Q. J. R. Meteorol. Soc. 1955, 81, 626–628. [Google Scholar] [CrossRef]
- Berger, K. Parameters of lightning flashes. Electra 1975, 41, 23–37. [Google Scholar]
- Huang, L.; Zhang, Q.; Qiu, S.; Shi, L.; Wang, J.; Gao, C. Development of a High-Speed Optical System for Lightning Flash Observation. Measurement 2019, 131, 85–91. [Google Scholar] [CrossRef]
- Saba, M.M.F.; Campos, L.Z.S.; Krider, E.P.; Pinto, O., Jr. High-speed video observations of positive ground flashes produced by intracloud lightning. Geophys. Res. Lett. 2009, 36. [Google Scholar] [CrossRef]
- Saba, M.M.F.; Schulz, W.; Warner, T.A.; Campos, L.Z.S.; Schumann, C.; Krider, E.P.; Cummins, K.L.; Orville, R.E. High-Speed Video Observations of Positive Lightning Flashes to Ground: Positive lightning flashes to ground. J. Geophys. Res. 2010, 115. [Google Scholar] [CrossRef]
- Warner, T.A.; Cummins, K.L.; Orville, R.E. Upward lightning observations from towers in Rapid City, South Dakota and comparison with National Lightning Detection Network data, 2004-2010: Upward lightning nldn comparison. J. Geophys. Res. 2012, 117. [Google Scholar] [CrossRef]
- Fofana, I.; Ben Rhouma, A.; Béroual, A.; Auriol, P. Modelling a Positive Lightning Downward Leader to Study Its Effects on Engineering Systems. IEE Proc-Gener. Transm. Distrib. 1998, 145, 395. [Google Scholar] [CrossRef]
- Kato, A.; Thau, D.; Hudak, A.T.; Meigs, G.W.; Moskal, L.M. Quantifying Fire Trends in Boreal Forests with Landsat Time Series and Self-Organized Criticality. Remote Sens. Environ. 2020, 237, 111525. [Google Scholar] [CrossRef]
- Karnas, G.; Maslowski, G.; Baranski, P. A Novel Algorithm for Determining Lightning Leader Time Onset from Electric Field Records and Its Application for Lightning Channel Height Calculations. Electric Power Syst. Res. 2020, 178, 106021. [Google Scholar] [CrossRef]
- Rodger, C.J.; Werner, S.; Brundell, J.B.; Lay, E.H.; Thomson, N.R.; Holzworth, R.H.; Dowden, R.L. Detection Efficiency of the VLF World-Wide Lightning Location Network (WWLLN): Initial Case Study. Ann. Geophys. 2006, 24, 3197–3214. [Google Scholar] [CrossRef]
- Murphy, M.J.; Said, R.K. Comparisons of Lightning Rates and Properties from the U.s. National Lightning Detection Network (NLDN) and GLD360 with GOES-16 Geostationary Lightning Mapper and Advanced Baseline Imager Data. J. Geophys. Res. 2020, 125. [Google Scholar] [CrossRef]
- de Abreu, L.P.; Gonçalves, W.A.; Mattos, E.V.; Albrecht, R.I. Assessment of the Total Lightning Flash Rate Density (FRD) in Northeast Brazil (NEB) Based on TRMM Orbital Data from 1998 to 2013. Int. J. Appl. Earth Obs. Geoinf. 2020, 93, 102195. [Google Scholar] [CrossRef]
- Jacobson, A.R.; Light, T.E.L.; Hamlin, T.; Nemzek, R. Joint Radio and Optical Observations of the Most Radio-Powerful Intracloud Lightning Discharges. Ann. Geophys. 2013, 31, 563–580. [Google Scholar] [CrossRef]
- Christian, H.J.; Goodman, S.J. Optical Observations of Lightning from a High-Altitude Airplane. J. Atmos. Ocean. Technol. 1987, 4, 701–711. [Google Scholar] [CrossRef]
- Karnas, G. Time Synchronization of Electric Field Measurement and Highspeed Video Registration at the Lightning Observation Station in Rzeszow, Poland. Prz. Elektrotech. 2015, 1, 237–240. [Google Scholar] [CrossRef]
- Loboda, M.; Betz, H.D.; Baranski, P.; Wiszniowski, J.; Dziewit, Z. New Lightning Detection Networks in Poland–LINET and LLDN. Open Atmos. Sci. J. 2009, 3, 29–38. [Google Scholar] [CrossRef]
- Berlinski, J.; Pankanin, G.; Kubicki, M. Large scale monitoring of troposphere electric field. In Proceedings of the 13th ICAE, Beijing, China, 13–17 August 2007; Volume I, pp. 124–126. [Google Scholar]
- Baranski, P.; Loboda, M.; Wiszniowski, J.; Morawski, M. Evaluation of Multiple Ground Flash Charge Structure from Electric Field Measurements Using the Local Lightning Detection Network in the Region of Warsaw. Atmos. Res. 2012, 117, 99–110. [Google Scholar] [CrossRef]
- Karnas, G.; Filik, K. A Low-Cost ELF-MF Orthogonal Sensor and Preamplifier Dedicated for Wide Range Lightning Magnetic Field Registration. Sens. Actuators A Phys. 2020, 315, 112281. [Google Scholar] [CrossRef]
- Nucci, C.A.; Diendorfer, G.; Uman, M.A.; Rachidi, F.; Ianoz, M.; Mazzetti, C. Lightning Return Stroke Current Models with Specified Channel-Base Current: A Review and Comparison. J. Geophys. Res. 1990, 95, 20395. [Google Scholar] [CrossRef]
- Maslowski, G.; Rakov, V.A. Review of Recent Developments in Lightning Channel Corona Sheath Research. Atmos. Res. 2013, 129–130, 117–122. [Google Scholar] [CrossRef]
- Betz, H.D.; Schmidt, K.; Laroche, P.; Blanchet, P.; Oettinger, W.P.; Defer, E.; Dziewit, Z.; Konarski, J. LINET—An International Lightning Detection Network in Europe. Atmos. Res. 2009, 91, 564–573. [Google Scholar] [CrossRef]
- Loboda, M.; Dziewit, Z.; Konarski, J.; Maciszewska, A.; Betz, H.D. Lightning Location with the Two Networks Perun and Linet in Poland. In Proceedings of the 2010 30th International Conference on Lightning Protection (ICLP), Cagliari, Italy, 13–17 September 2010. [Google Scholar]
- Karnas, G.; Maslowski, G.; Baranski, P. Power Spectrum Density Analysis of Intra-Cloud Lightning Discharge Components from Electric Field Recordings in Poland. In Proceedings of the 2016 33rd International Conference on Lightning Protection (ICLP), Estoril, Portugal, 25–30 September 2016. [Google Scholar]
- Oppenheim, A.V.; Schafer, R.W.; Buck, J.R. Discrete-Time Signal Processing, 2nd ed.; Prentice Hall: Upper Saddle River, NJ, USA, 1999. [Google Scholar]
- Tran, M.D.; Rakov, V.A. Initiation and Propagation of Cloud-to-Ground Lightning Observed with a High-Speed Video Camera. Sci. Rep. 2016, 6, 39521. [Google Scholar] [CrossRef] [PubMed]
- Montanyà, J.; van der Velde, O.; Williams, E.R. The Start of Lightning: Evidence of Bidirectional Lightning Initiation. Sci. Rep. 2015, 5, 15180. [Google Scholar] [CrossRef] [PubMed]
- Tuszynska, I. Charakterystyka Produktów Radarowych; Institute of Meteorology and Water Management. National Research Institute: Warsaw, Poland, 2011. (In Polish) [Google Scholar]


Publisher’s Note: MDPI stays neutral with regard to jurisdictional claims in published maps and institutional affiliations. |
© 2022 by the authors. Licensee MDPI, Basel, Switzerland. This article is an open access article distributed under the terms and conditions of the Creative Commons Attribution (CC BY) license (https://creativecommons.org/licenses/by/4.0/).