Article

Research and Application of Surface Throttling Technology for Ultra-High-Pressure Sour Natural Gas Wells in Northwestern Sichuan Basin

1
Northwest Sichuan Gas District of Southwest Oil and Gasfield Company, Jiangyou 621741, China
2
Petroleum Engineering School, Southwest Petroleum University, Chengdu 610500, China
*
Author to whom correspondence should be addressed.
Energies 2022, 15(22), 8641; https://doi.org/10.3390/en15228641
Submission received: 30 July 2022 / Revised: 27 October 2022 / Accepted: 7 November 2022 / Published: 17 November 2022

Abstract

:
The gas reservoirs in the Northwestern Sichuan Basin have great development potential. However, their production efficiency is seriously reduced by the complex surface multistage throttling process and frequent hydrate plugging caused by the ultra-high-pressure sour gas. Considering the prevention and control of hydrates, properly designing the throttling temperature and pressure to optimize the surface production process is the key to solving this problem. First, this work presents a method for predicting the hydrate formation conditions of ultra-high-pressure sour natural gas based on the vdW-P (van der Waals–Platteeuw) model and the CPA (cubic-plus-association) equation of state (EoS) and considering the association between acid gases (H2S, CO2) and H2O. Secondly, the throttling temperature prediction method was developed by coupling the isenthalpic throttling model and the modified Lee–Kesler EoS mixing rule; the maximum throttling pressure difference calculation method was constructed based on the critical flow principle. Finally, field cases are given to illustrate the distribution process of assigning the maximum throttling pressure differences. The results show that the proposed model can accurately predict the hydrate formation conditions and throttling temperature of ultra-high-pressure sour natural gas, and reveal their changing laws. The surface throttling technology of the ultra-high-pressure sour gas wells Long 004-X1 and Long 016-H1 was optimized from five-stage to three-stage, and the application of the fixed throttle valve in the field is successfully demonstrated.

1. Introduction

The Sichuan Basin, known for its rich natural gas resources, is one of the main natural gas production bases in China. A 30-billion-cubic-meter production base was built here by PetroChina Southwest Oil & Gasfield Company to meet continued growth in natural gas consumption. This figure is expected to increase to 50 billion cubic meters by 2025. The deep marine carbonate gas reservoir in the western Sichuan Basin has become the key exploration and development object for increasing natural gas production [1]. Since 2014, many wells in the Qixia Formation, Maokou Formation, and Feixianguan Formation in the Shuangyushi Block, the Northwestern Sichuan Basin, have successively obtained high-yield industrial gas flows. For instance, the gas flow obtained from Well Longtan 1 in the Qixia Formation has reached 105.66 × 10⁴ m3/d, showing good exploration prospects [2,3]. The gas reservoirs in this area are typically characterized as being ultra-deep (>7000 m), high-temperature (431.0 K), high-pressure (a partial wellhead pressure exceeding 100 MPa), and rich in sulfur (0.014–15.19 g/m3) [2,3]. It poses a great challenge to the design and safety management of gas well test production and the subsequent production processes.
The processes for dealing with high-pressure natural gas flow include throttling [4], drainage gas recovery, gas lift oil recovery [5], etc. This work mainly focuses on the throttling process in the field of surface gathering and transportation technology. High-pressure natural gas in the formation should be throttled to reduce the pressure before it can safely enter the downstream gathering and transportation system. Due to the Joule–Thomson effect, the temperature of natural gas after throttling varies with the decrease in pressure. Once it is lower than the hydrate formation temperature, hydrates may form and cause blockages of surface process equipment. Under the superimposition of ultra-high pressure and sulfur gas, such gas wells face severe hydrate prevention and control problems in the process of production testing and depressurization [6,7]. To avoid hydrate blockage and ensure the safe production of gas wells, the multistage throttling process with a small pressure difference was widely adopted at the wellhead in the early stages. However, this requires complex surface processes, a lot of equipment, and has low operational efficiency. Considering the prevention and control of hydrates, rationally redistributing the multistage throttling pressure difference and simplifying the throttling process is of great significance for improving the production efficiency and safety management of ultra-high-pressure sour gas fields.
At present, research on hydrate formation conditions, throttle temperature prediction, and throttle differential pressure distribution cannot solve the above problems. In hydrate prediction, traditional thermodynamic models, such as the van der Waals–Platteeuw (vdW-P) model [7] and Ng–Robinson model [8], usually rely on the EoS to describe the multiphase system containing hydrates. However, widely used cubic EoSs, such as Soave–Redlich–Kwong (SRK) and Peng–Robinson (PR) EoSs [9,10], mainly characterize intermolecular attractive and repulsive interactions but are difficult to describe the association between H2S, CO2, water, and other polar molecules, which leads the prediction results to deviate from reality [11]. The cubic additional association (CPA) EoS adopts different association models and mixing rules to characterize the association strength between molecules [12], which is competent for improving the description of molecular interactions in sour natural gas systems. The CPA EoS has been successfully used to solve the thermodynamic problems for multiphase equilibrium systems involving water, methanol (MEG), flue gas, and salt-containing mixtures [4,12,13]. In terms of throttling temperature prediction, most theoretical models are based on the isenthalpic throttling principle, so it is necessary to accurately calculate the enthalpy of natural gas. The Lee–Kesler (LK) EoS [14] proposed based on the corresponding state principle is considered to be the most accurate EoS for calculating the enthalpy of hydrocarbons. Li et al. [15] established a throttling temperature prediction model for high-temperature and high-pressure condensate gas based on the isenthalpic throttling model, gas–liquid equilibrium model, and LK EoS. Compared with HYSYS and other commercial software, their model exhibits higher accuracy [15], but the applicability of this method to ultra-high-pressure sour natural gas still needs to be verified. For the throttling pressure distribution, the critical flow pressure of natural gas after flowing through the throttle valve is the basis for determining the maximum throttling pressure difference. The omega method determines the correlation between the equilibrium compression coefficient ω and the critical pressure ratio η for single-component systems, and improves the calculation accuracy of the critical pressure for two-phase flow [16]. Henry and Fauske [17] introduced the boiling delay coefficient N in the omega method to consider the noninstantaneous equilibrium phenomenon of gas–liquid phase change in a saturated fluid. Diener and Schmidt [18] combined the ideas of the above model and proposed a more accurate nonequilibrium homogeneous model (the homogeneous nonequilibrium Diener–Schmidt (HNE-DS) model). However, these models were developed for single-component systems, and their applicability to multicomponent systems remains to be improved.
This paper focuses on the optimization method of the surface multistage throttling process for ultra-high-pressure sour gas wells. Firstly, a prediction model of hydrate formation conditions was constructed based on the vdW-P model and CPA EoS. Then, the methods of throttling temperature prediction and throttling pressure difference calculation were established. Finally, combined with the above methods and field cases, the optimization techniques of the multistage throttling process were explored to simplify the surface processing equipment and improve the gathering and transportation efficiency.

2. Prediction of Formation Conditions of Ultra-High-Pressure Sour Gas Hydrate

The hydrate formation condition is the constraint boundary for the subsequent optimization of the surface throttling process. To obtain more accurate predictions, this work takes into account the associations between H2S, CO2, and water molecules ignored by conventional thermodynamic models, and proposes a prediction model based on the vdW-P model and CPA EoS for ultra-high-pressure sour natural gas.

2.1. vdW-P Hydrate Thermodynamic Model

According to the phase equilibrium theory, the chemical potential or fugacity of water in the hydrate phase and other fluid phases should be equal for a multiphase equilibrium system containing hydrate. In the vdW-P model [9], the chemical potential difference of water in empty and hydrate-filled phases can be calculated by the following formula:
Δ μ W β H = R T m = 1 2 γ m ln ( 1 j Y j , m )
where γm is the characteristic constant of hydrate structure. For structure I (CH4, H2S, CO2), γ1 takes 1/23 and γ2 takes 3/23, and for structure II, γ1 takes 2/17 and γ2 takes 1/17. R is the gas constant; T is temperature, K; Yj,m is the probability of a cage type m holes occupied by component j, which is given by Equation (2):
Y j , m = C j , m f j 1 + j C j , m f j
where fj is the fugacity of component j in the gas phase, MPa; Cj,m is Langmuir constant of component j in a cage of type m, 1/MPa, which can be calculated from Equation (3) to (5):
C j , m = 4 π k T 0 R c exp { [ W ( r ) k T ] r 2 } d r
where W(r) is the spherically symmetric cell potential function, and r indicates the distance from the center of the cavity. In this work, the Kihara potential function is used for the evaluation of the W(r) as shown below:
W ( r ) = 2 Z ε [ σ 12 ( R c ) 11 r ( δ 10 + a R c δ 11 ) σ 6 ( R c ) 5 r ( δ 4 + a R c δ 5 ) ]
δ N = [ ( 1 r + a R c ) N ( 1 + r + a R c ) N ] / N
where Z is the coordination number of water molecules; α represents the radius of the spherical molecular core; ε is the characteristic energy; σ denotes the collision diameter [19,20]; Rc is the cavity radius; N is an integer equal to 4, 5, 10, or 11.

2.2. Description of the Polar System Based on CPA EoS

In addition to the hydrate phase, it is also necessary to accurately characterize the properties of the water-rich phase. To describe the influence of the association between hydrogen sulfide, carbon dioxide, and water molecules on the water-rich phase and hydrate phase, this paper introduced the CPA EoS developed from statistical association theory, which can be expressed as follows:
P = R T v b a v ( v + b ) 1 2 R T v ( 1 v ln g v ) i x i A i ( 1 X A i )
where P is pressure, kPa; a is a function of temperature, kPa·m6·mol−2; b is the volume parameter, m3·mol−1; v is the molar volume, m3·mol−1; g is dimensionless radial distribution function; xi is the dimensionless mole fraction of component i; Ai represents the active association sites A on molecule i; XAi is the fraction of sites A on component i that are not bonded with other active sites, which is given by Equation (7):
X A i = 1 1 + ρ j x j B j X B j Δ A i B j
where ρ is the molar density of the mixture, mol·m−3; ΔAiBi is the association strength between the association site A on molecule i and site B on molecule j, which is given by Equations (8) and (9):
Δ A i B j = g [ exp ( ε A i B j R T ) 1 ] b i j β A i B j
b i j = b i + b j 2
where εAiBi is the associate energy parameter, kPa·m3·mol−1; βAiBi is the associate volume parameter.
The first two terms on the right side in Equation (6) are the traditional cubic EoS (SRK EoS). This mainly describes the gravitational and repulsive interactions between inert molecules. The third term is the associative term of CPA EoS, which describes the association between molecules. For mixtures, the van der Waals mixing rule is introduced to determine parameters a and b, as shown in Equations (10) and (11); the Cr-1 mixing rule [21] is introduced to determine the association parameters, as shown in Equations (12) and (13):
a = i j x i x j a i a j ( 1 k i j )
b = j x i b i
ε A i B j = ε A i B i + ε A j B j 2
β A i B j = β A i B i β A j B j
where kij is the binary interaction coefficient. This reflects the influence of interactions between molecules on the thermodynamic properties of the mixed system. To improve the accuracy of the thermodynamic model, binary interactions between methane, hydrogen sulfide, carbon dioxide, and water molecules are considered in this paper, and the parameters are shown in Table 1.
In this work, the self-association between water molecules, and the cross-association between acid gas molecules and water molecules are considered to characterize the association strength of fluids containing water, hydrogen sulfide, and carbon dioxide. Tsivintzelis et al. [22,23] found that the phase behavior and properties of binary systems can be well described when H2S has two proton donor sites and one proton acceptor site to associate with the H2O molecule, and CO2 has one electron acceptor site to associate with the H2O molecule. Based on this assumption, the 4C association scheme is used for water molecules, the 3B association scheme is adopted for hydrogen sulfide and water molecules, and carbon dioxide is modeled as a solvent molecule to associate with water molecules. The association parameters are shown in Table 2.

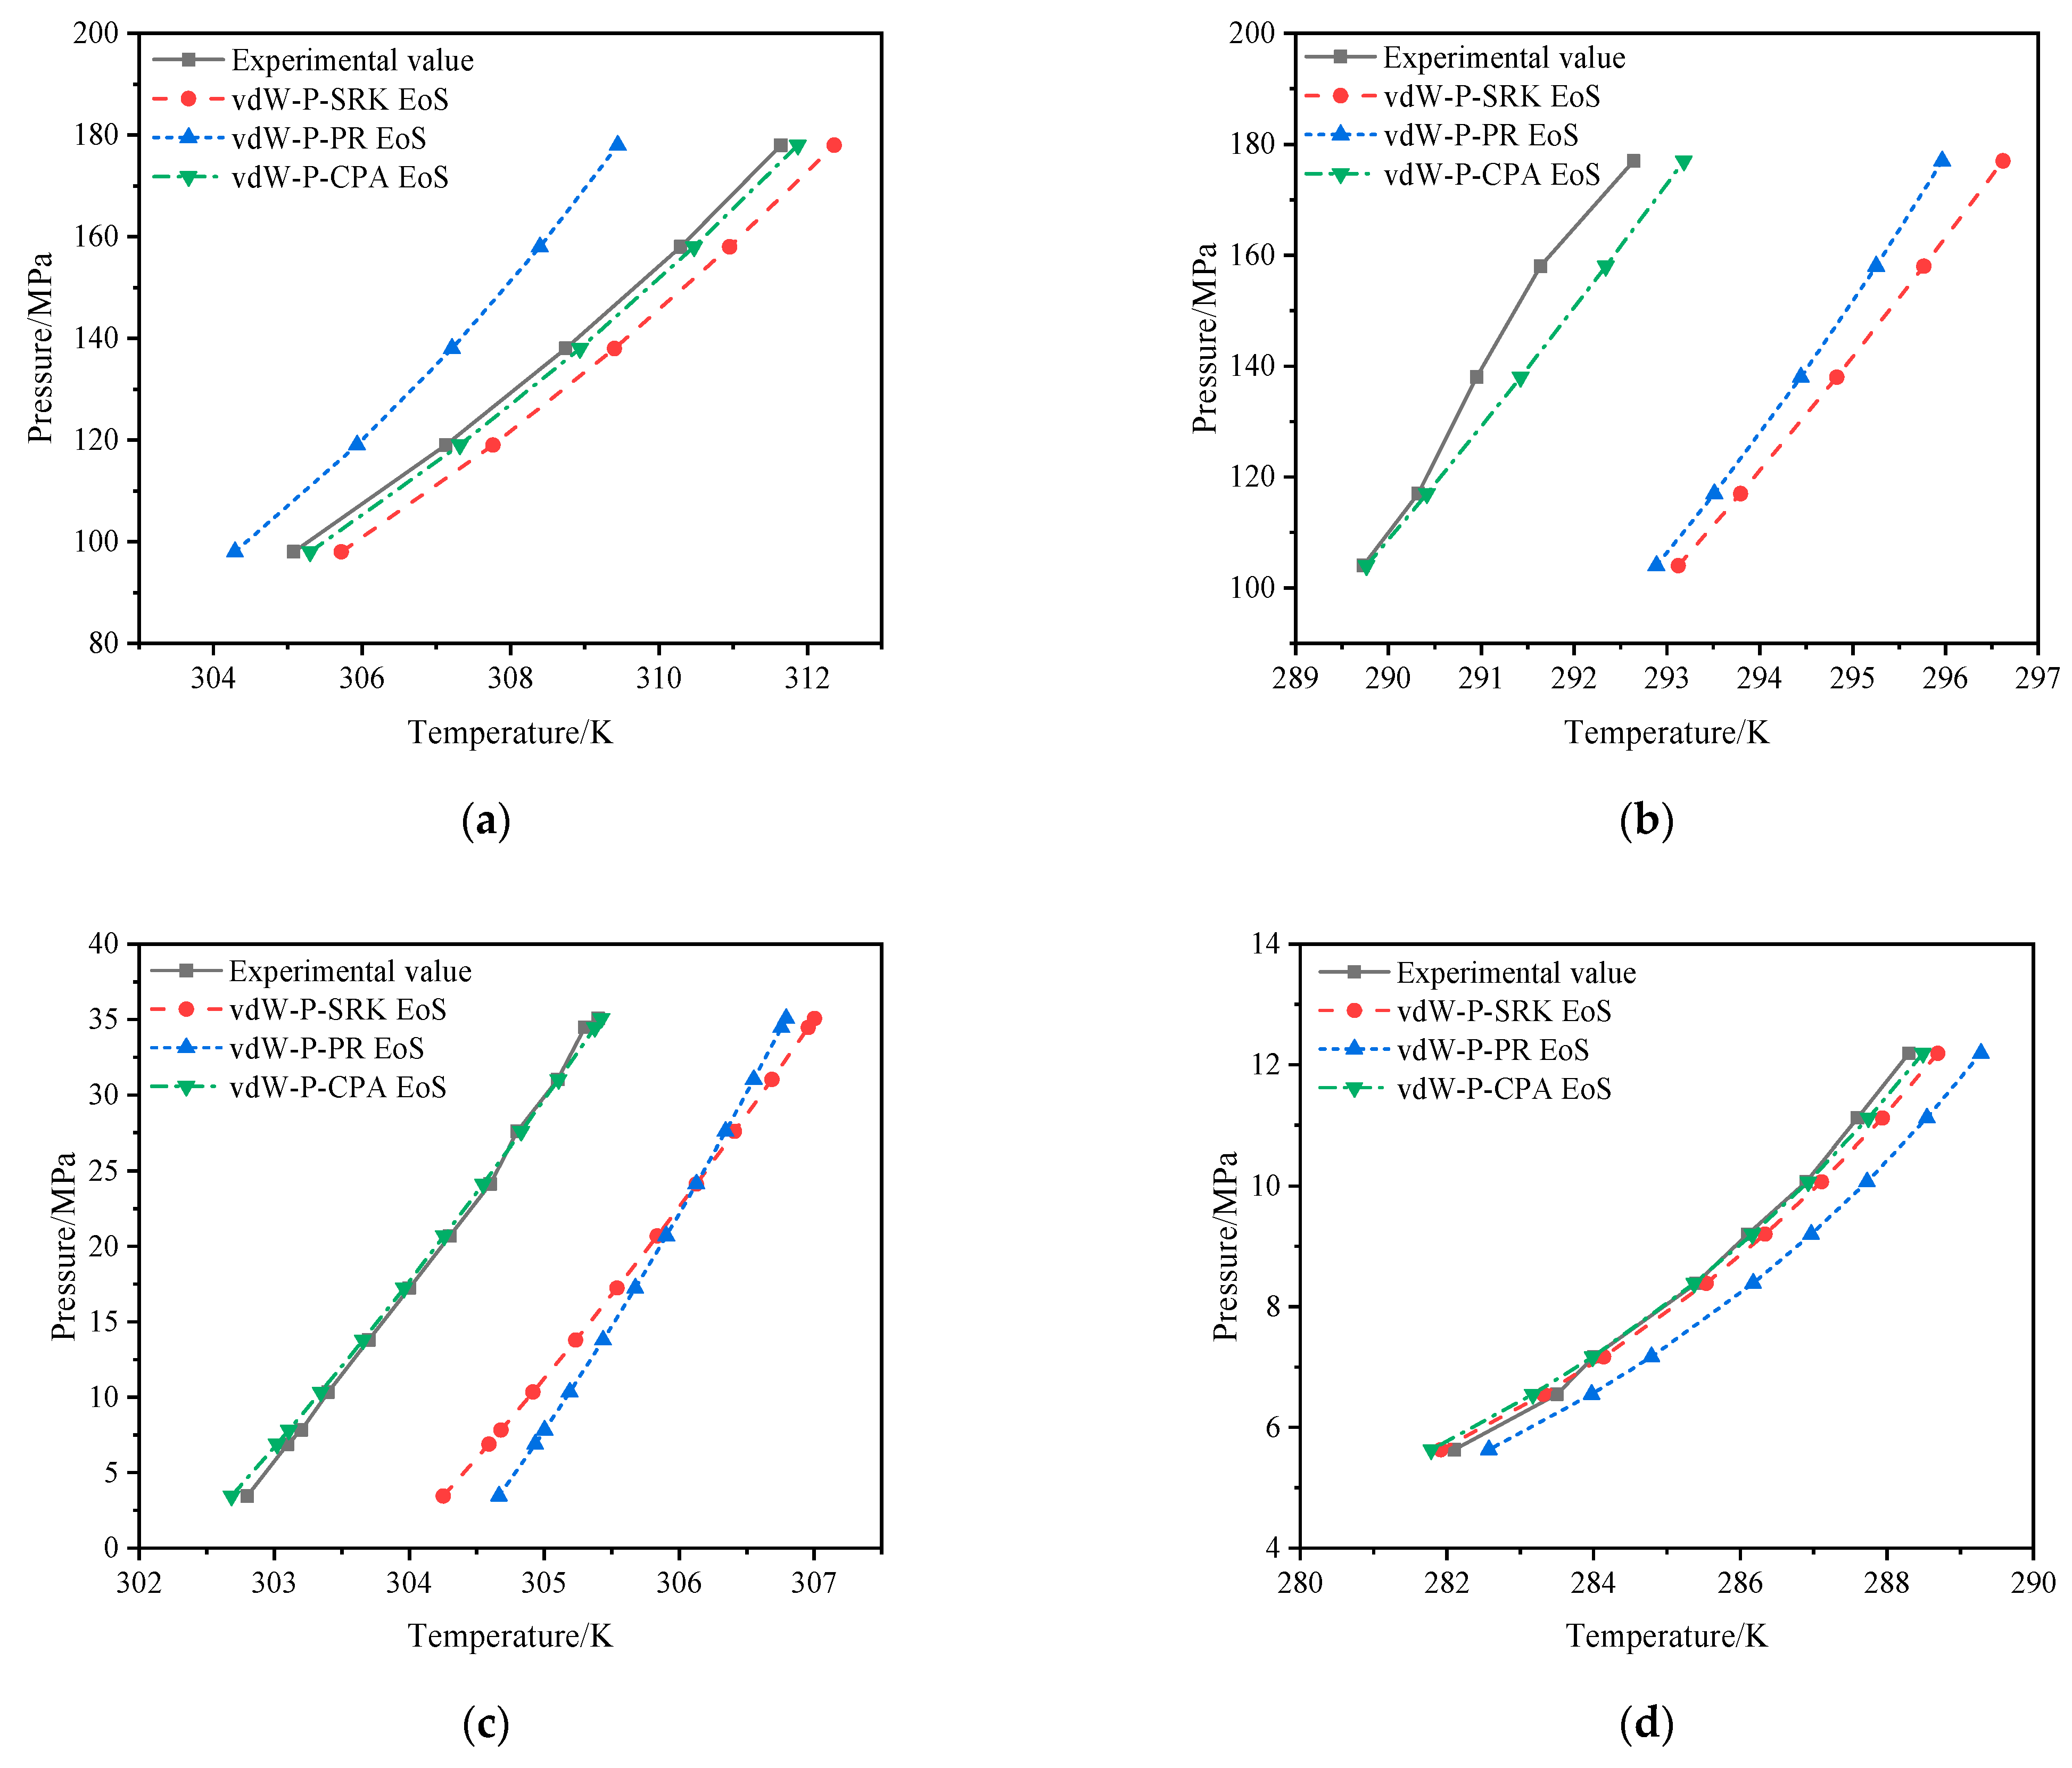
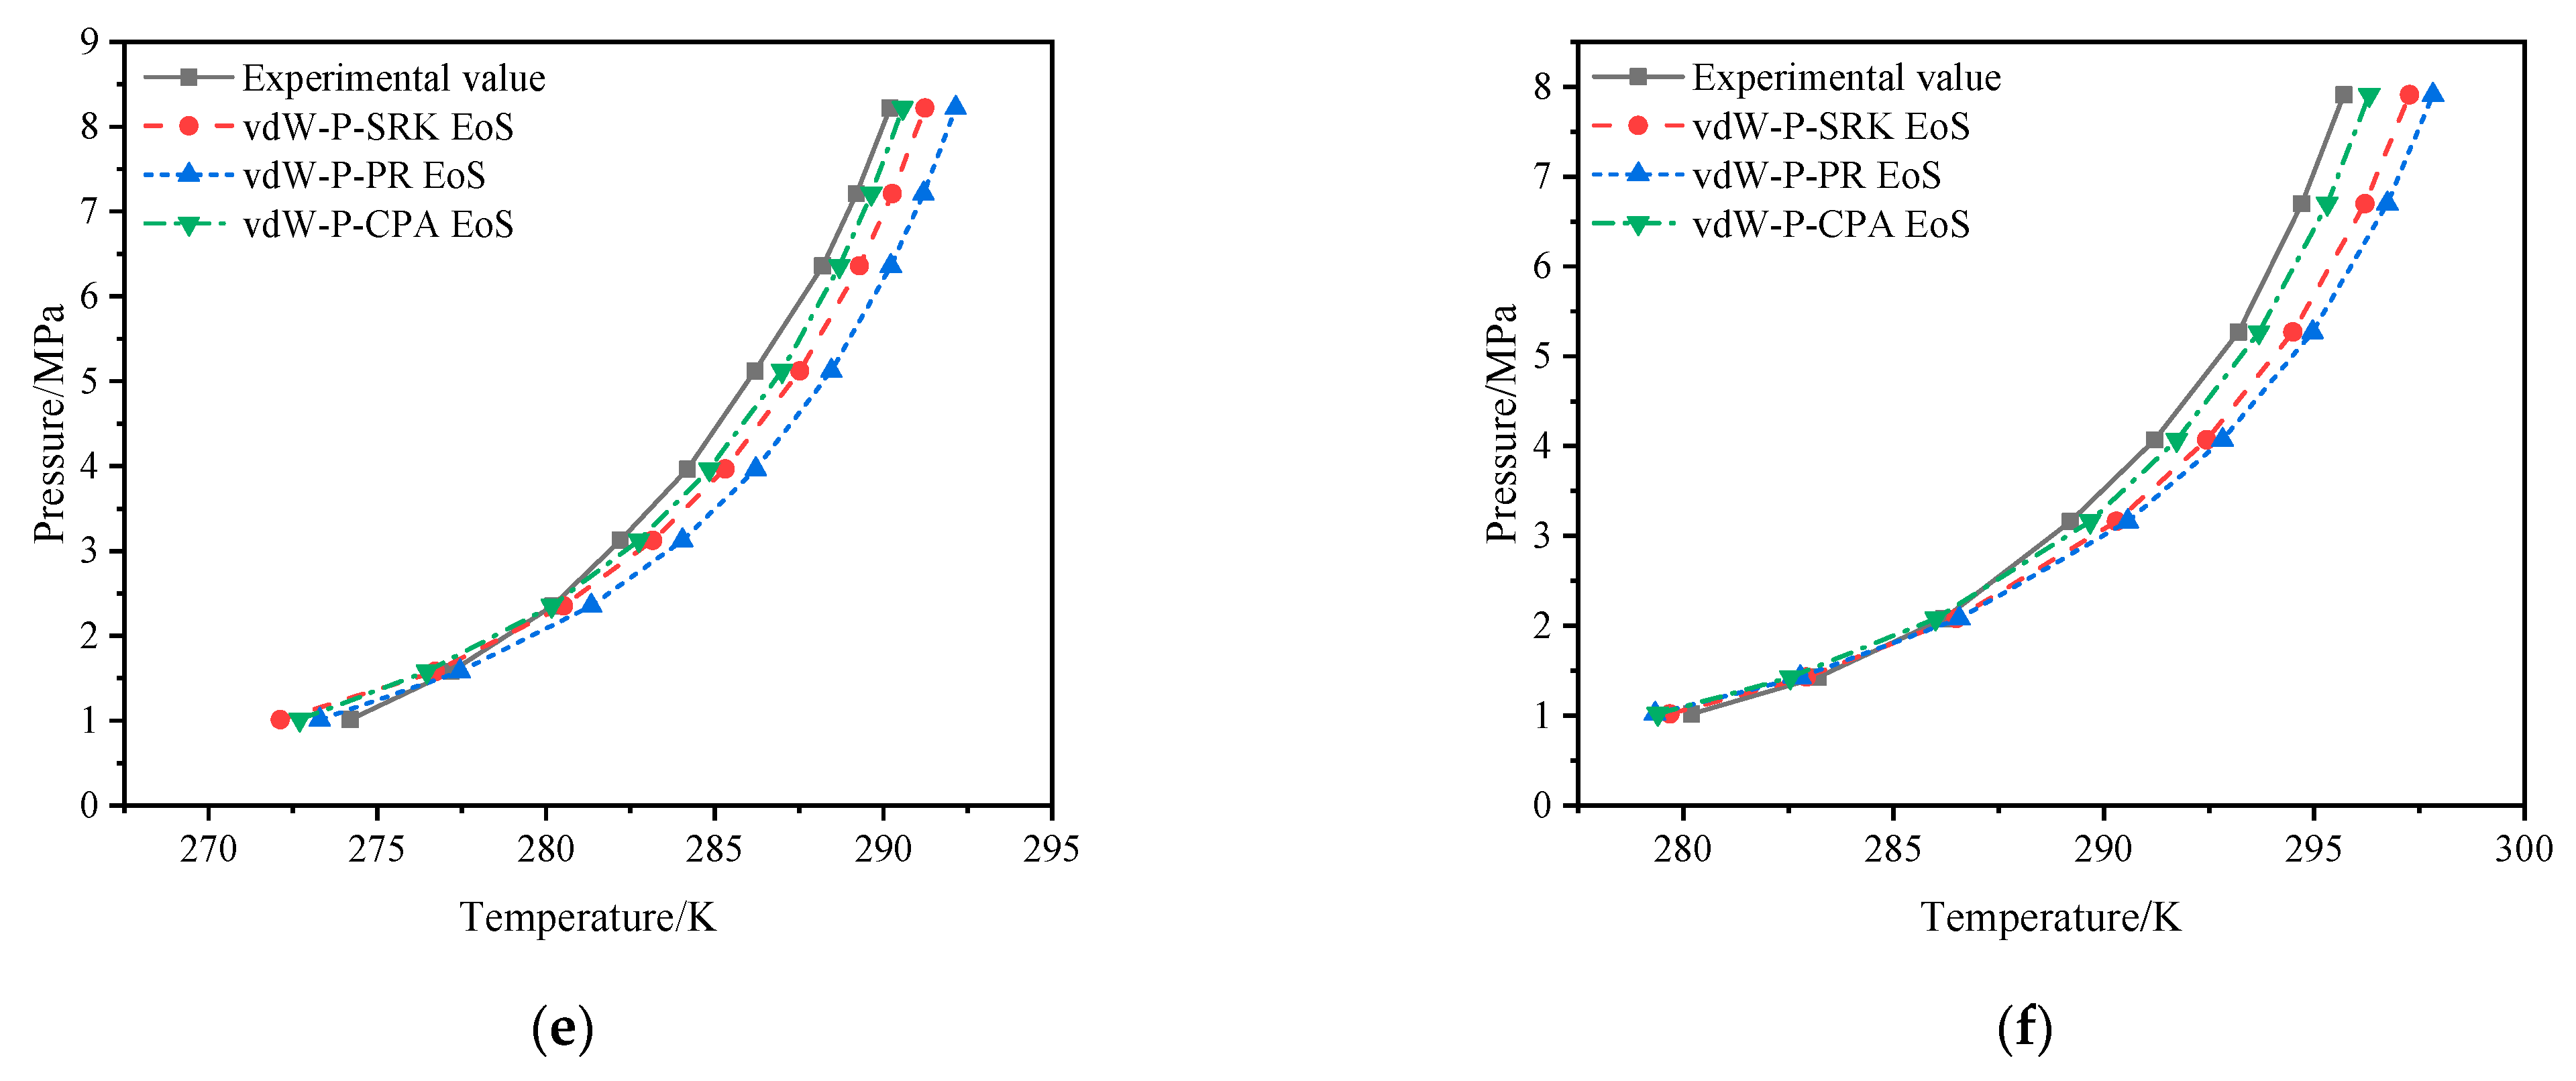
2.3. Verification of Hydrate Formation Condition Prediction Model

The natural gas produced in the Northwestern Sichuan Basin is mainly composed of CH4 (content above 97%) and contains a small amount of H2S, CO2, and other hydrocarbon gases. To evaluate the accuracy of the proposed model, the experimental data of binary systems and multicomponent systems composed of CH4, H2S, CO2, and H2O are preferred as the evaluation basis (Table 3 and Table 4). The predictions based on traditional cubic EoSs including SRK and PR EoSs are also used for comparison. The results are shown in Figure 1. The prediction deviations of different models for the hydrate formation temperature for systems NG1~NG6 are listed in Table 5, where the average absolute deviation (AAD) between the predicted and experimental values is defined as follows:
A A D = i N | T cal , i T exp , i | / N d
where Tcal and Texp are the calculated and experimental values, respectively, of the hydrate formation temperature; and Nd is the number of experimental data.
As depicted in Figure 1, the hydrate formation temperatures predicted by the vdW-P model and CPA EoS show a high consistency with the experimental data for all systems. Combined with the deviations in Table 5, in the given pressure ranges of 3.45–177.00 MPa, the AADs between the predicted hydrate formation temperature (from the proposed model) and experimental value are less than 0.5K for binary systems (NG1, NG2, NG3) of CH4/CO2/H2S and H2O. For the multicomponent system (NG4~NG6) containing 0.05~14.98 mol% H2S, the AADs of the prediction from the proposed model are still less than 1K in pressure ranges 0.58–12.19 MPa. It can also be observed in Figure 1 and Table 5 that the accuracy of the proposed model is superior to those of the vdW-P model and PR/SRK EoSs. This indicates that the proposed model accurately describes the effect of the association between H2S, CO2, and water molecules on the formation of hydrate, which is essential to improve the prediction in sour gas hydrate formation conditions. It is precisely because of the lack of modeling of this association property that the PR/SRK EoSs exhibit a larger deviation.

3. Calculation Method of Throttling Temperature and Throttling Pressure Difference

3.1. Throttling Temperature Prediction Model

When ultra-high-pressure natural gas flows through the throttle valve, it travels at an extremely fast speed due to the small cross-sectional area of the valve core. This process can be approximately regarded as an adiabatic flow process and conforms to the isenthalpic throttling principle. That is to say that the enthalpy of natural gas is equal before and after throttling [29]. Enthalpy is a state variable related to the pressure, temperature, and composition of natural gas. The total enthalpy of the fluid can be determined for a given inlet pressure and temperature of the throttle valve. Once the throttle outlet pressure is specified, the throttle outlet temperature can be calculated according to the isenthalpic throttling principle. The Lee–Kesler EoS is one of the most accurate EoSs for calculating enthalpy [14]. In this work, it is introduced to calculate the enthalpy of sour natural gas. Its general form is
Ζ = p r V r T r = 1 + B V r + C V r 2 + D V r 5 + c 4 T r 3 V r 2 ( β + γ V r 2 ) exp ( γ V r 2 )
where Z is the compression factor; pr is reduced pressure, pr = p/pc; p is pressure; pc is the critical pressure; Vr is reduced temperature, Vr = pcV/RTc; V is the mole volume for a simple fluid or heavy reference fluid (n-Octane); R is the gas constant; Tc is the critical temperature; Tr is reduced temperature, Tr = T/Tc; T is temperature; B, C, D, γ, β, and c4 are parameters related to fluid type and the values refer to reference [14].
In Equation (15), the virtual critical temperature and pressure of mixtures are important parameters affecting the enthalpy calculation. According to the literature [30], when natural gas is under high temperature and pressure with Tr > 1 and Pr > 5, the Plocker–Knapp mixed rule and Prausnitz–Gunn rule are proposed to compute the virtual critical temperature and pressure, respectively. When the natural gas is in the state of Tr < 1 or Pr < 5, API mixing rules are recommended to calculate these two virtual critical parameters. The specific mixing rules can be found in the literature [31].

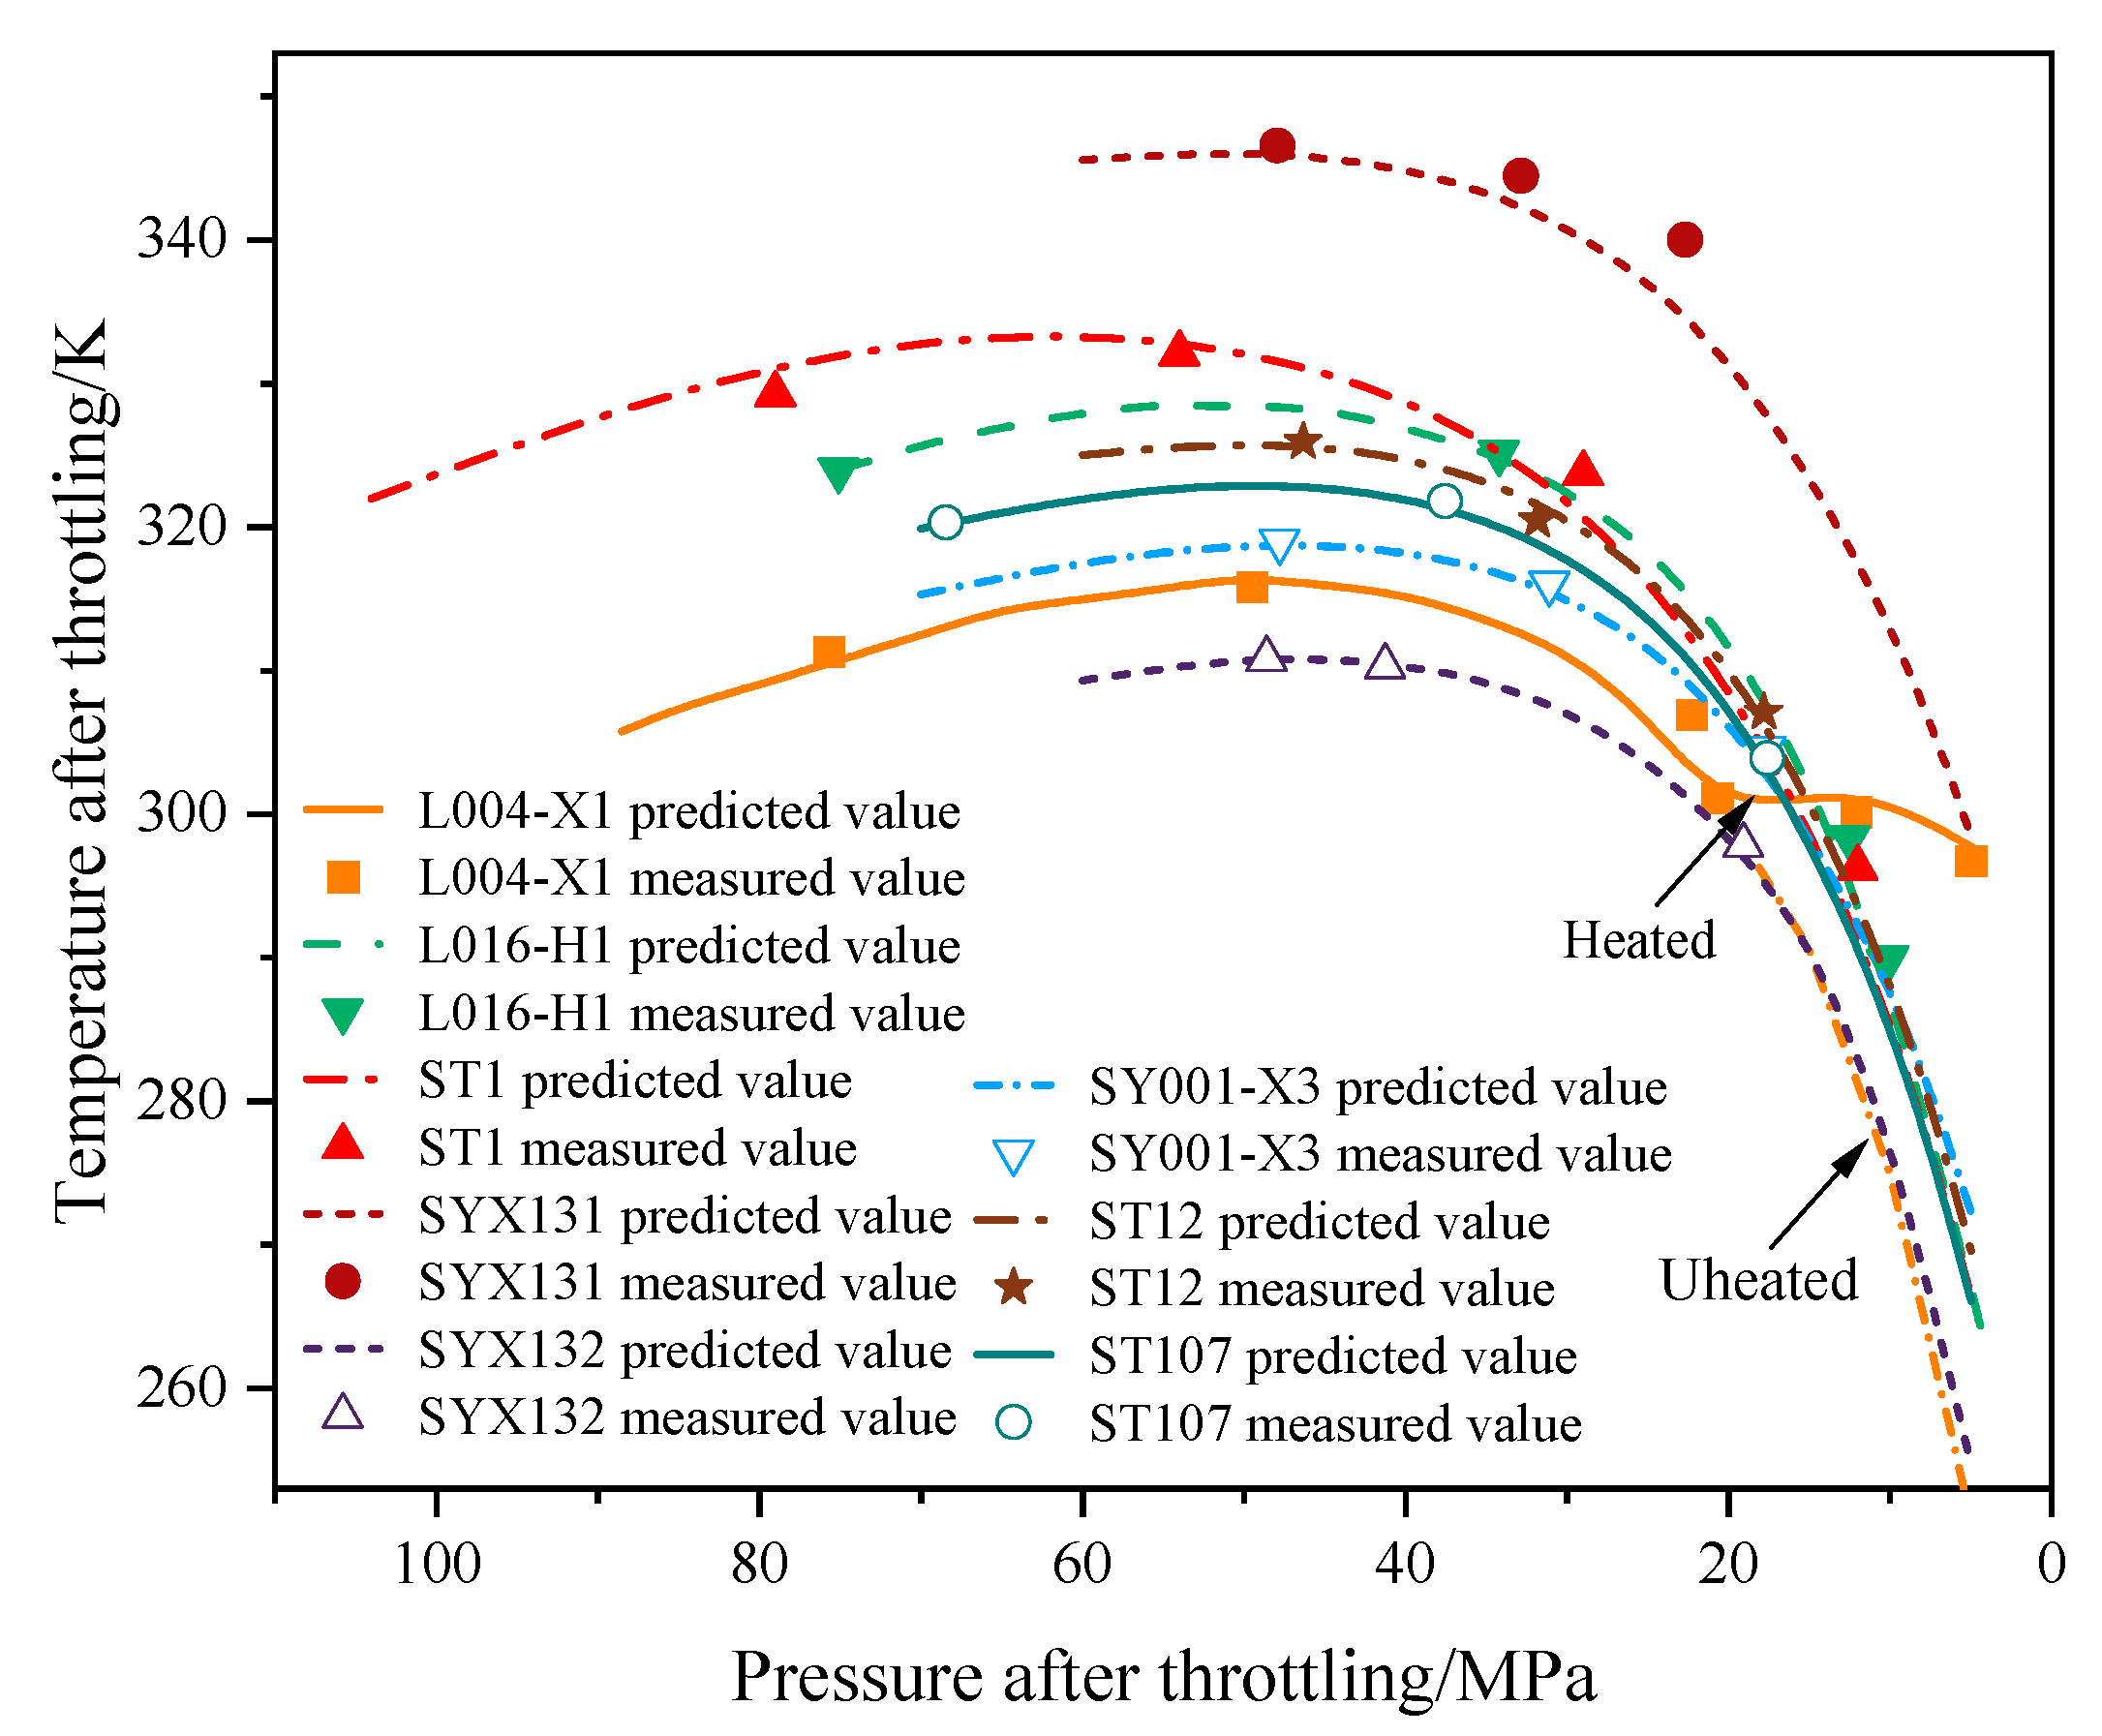
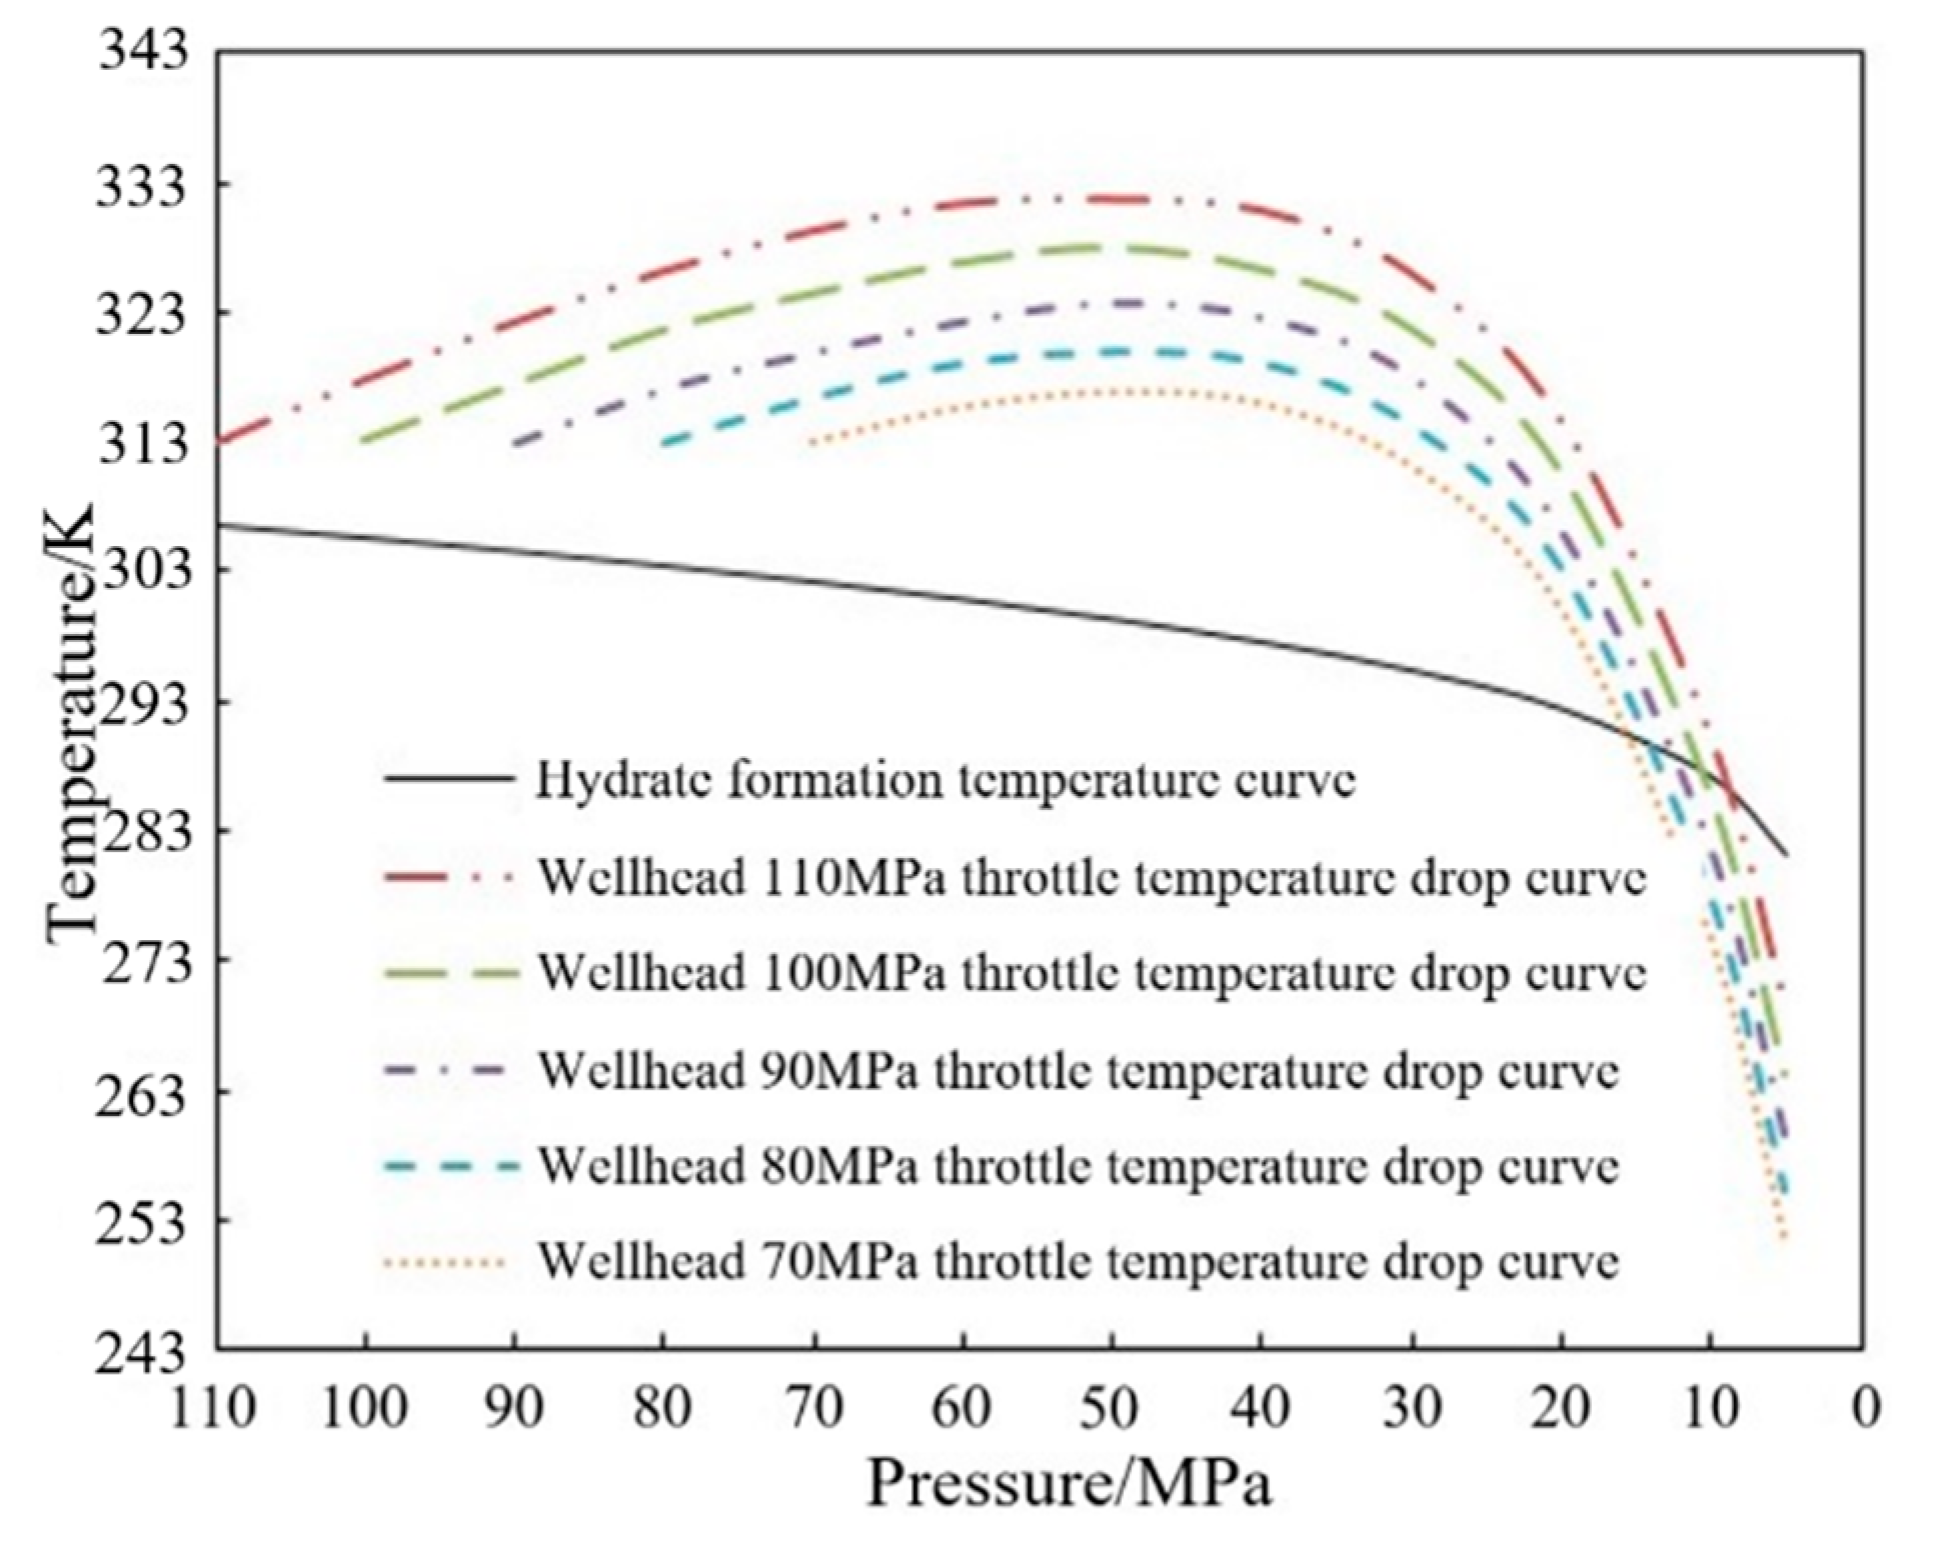
3.2. Model Verification and Throttling Temperature Variation Analysis

To evaluate the applicability of the throttling temperature prediction model, the surface throttling temperature and pressure parameters from eight gas wells in the Northwestern Sichuan Basin were measured, including L004-X1, L016-H1, ST1, and SYX131. The comparisons of the predicted and measured values of the proposed model are presented in Table 6 and Figure 2. In the range of pressure 5~104 MPa and range of temperature 289.59~346.42 K, the outlet temperature of the throttle valve from this model is in good agreement with most of the measured data. The average absolute deviation between the predicted and measured throttling temperatures is only 1.29 K, and the maximum deviation is 3.45 K. Overall, the prediction accuracy of the model for throttling temperature is acceptable, considering the measurement error in the temperature data under ultra-high pressure.
To further analyze the variation characteristics of throttling parameters of ultra-high-pressure sour gas wells in Northwest Sichuan, Figure 2 presents the predicted curves and measured values of the throttling temperature drop for eight gas wells. As shown in Figure 2, except for the case where the end stage was heated, the surface choke temperature of all gas wells shows a consistent trend with the pressure drop, which first increased slightly and then decreased significantly. According to SY/T 6581-2012 Technical Specification for Testing Technology of High-Pressure Oil and Gas Wells, different throttling pressures are divided into a ultra-high-pressure section (70~100 MPa), a high-pressure section (35~70 MPa), and a low pressure section (0~35 MPa). Combining this division, the characteristics of the throttling temperature drop can also be seen in Figure 2. In the ultra-high-pressure section, the throttling temperature increases as the pressure decreases; in the high-pressure section, the throttling temperature increases first and then decreases as the pressure decreases; in the low-pressure section, the throttling temperature decreases as the pressure decreases. This characteristic of throttling temperature is attributed to the Joule–Thomson heating and cooling effects of high-pressure sour natural gas at different throttling and depressurization stages. This also implies that the distribution of throttling pressure difference should take full advantage of the temperature rise at the outlet of the throttle valve in the high-pressure and ultra-high-pressure sections, to avoid the use of heat tracing equipment or reduce the energy consumption as much as possible.

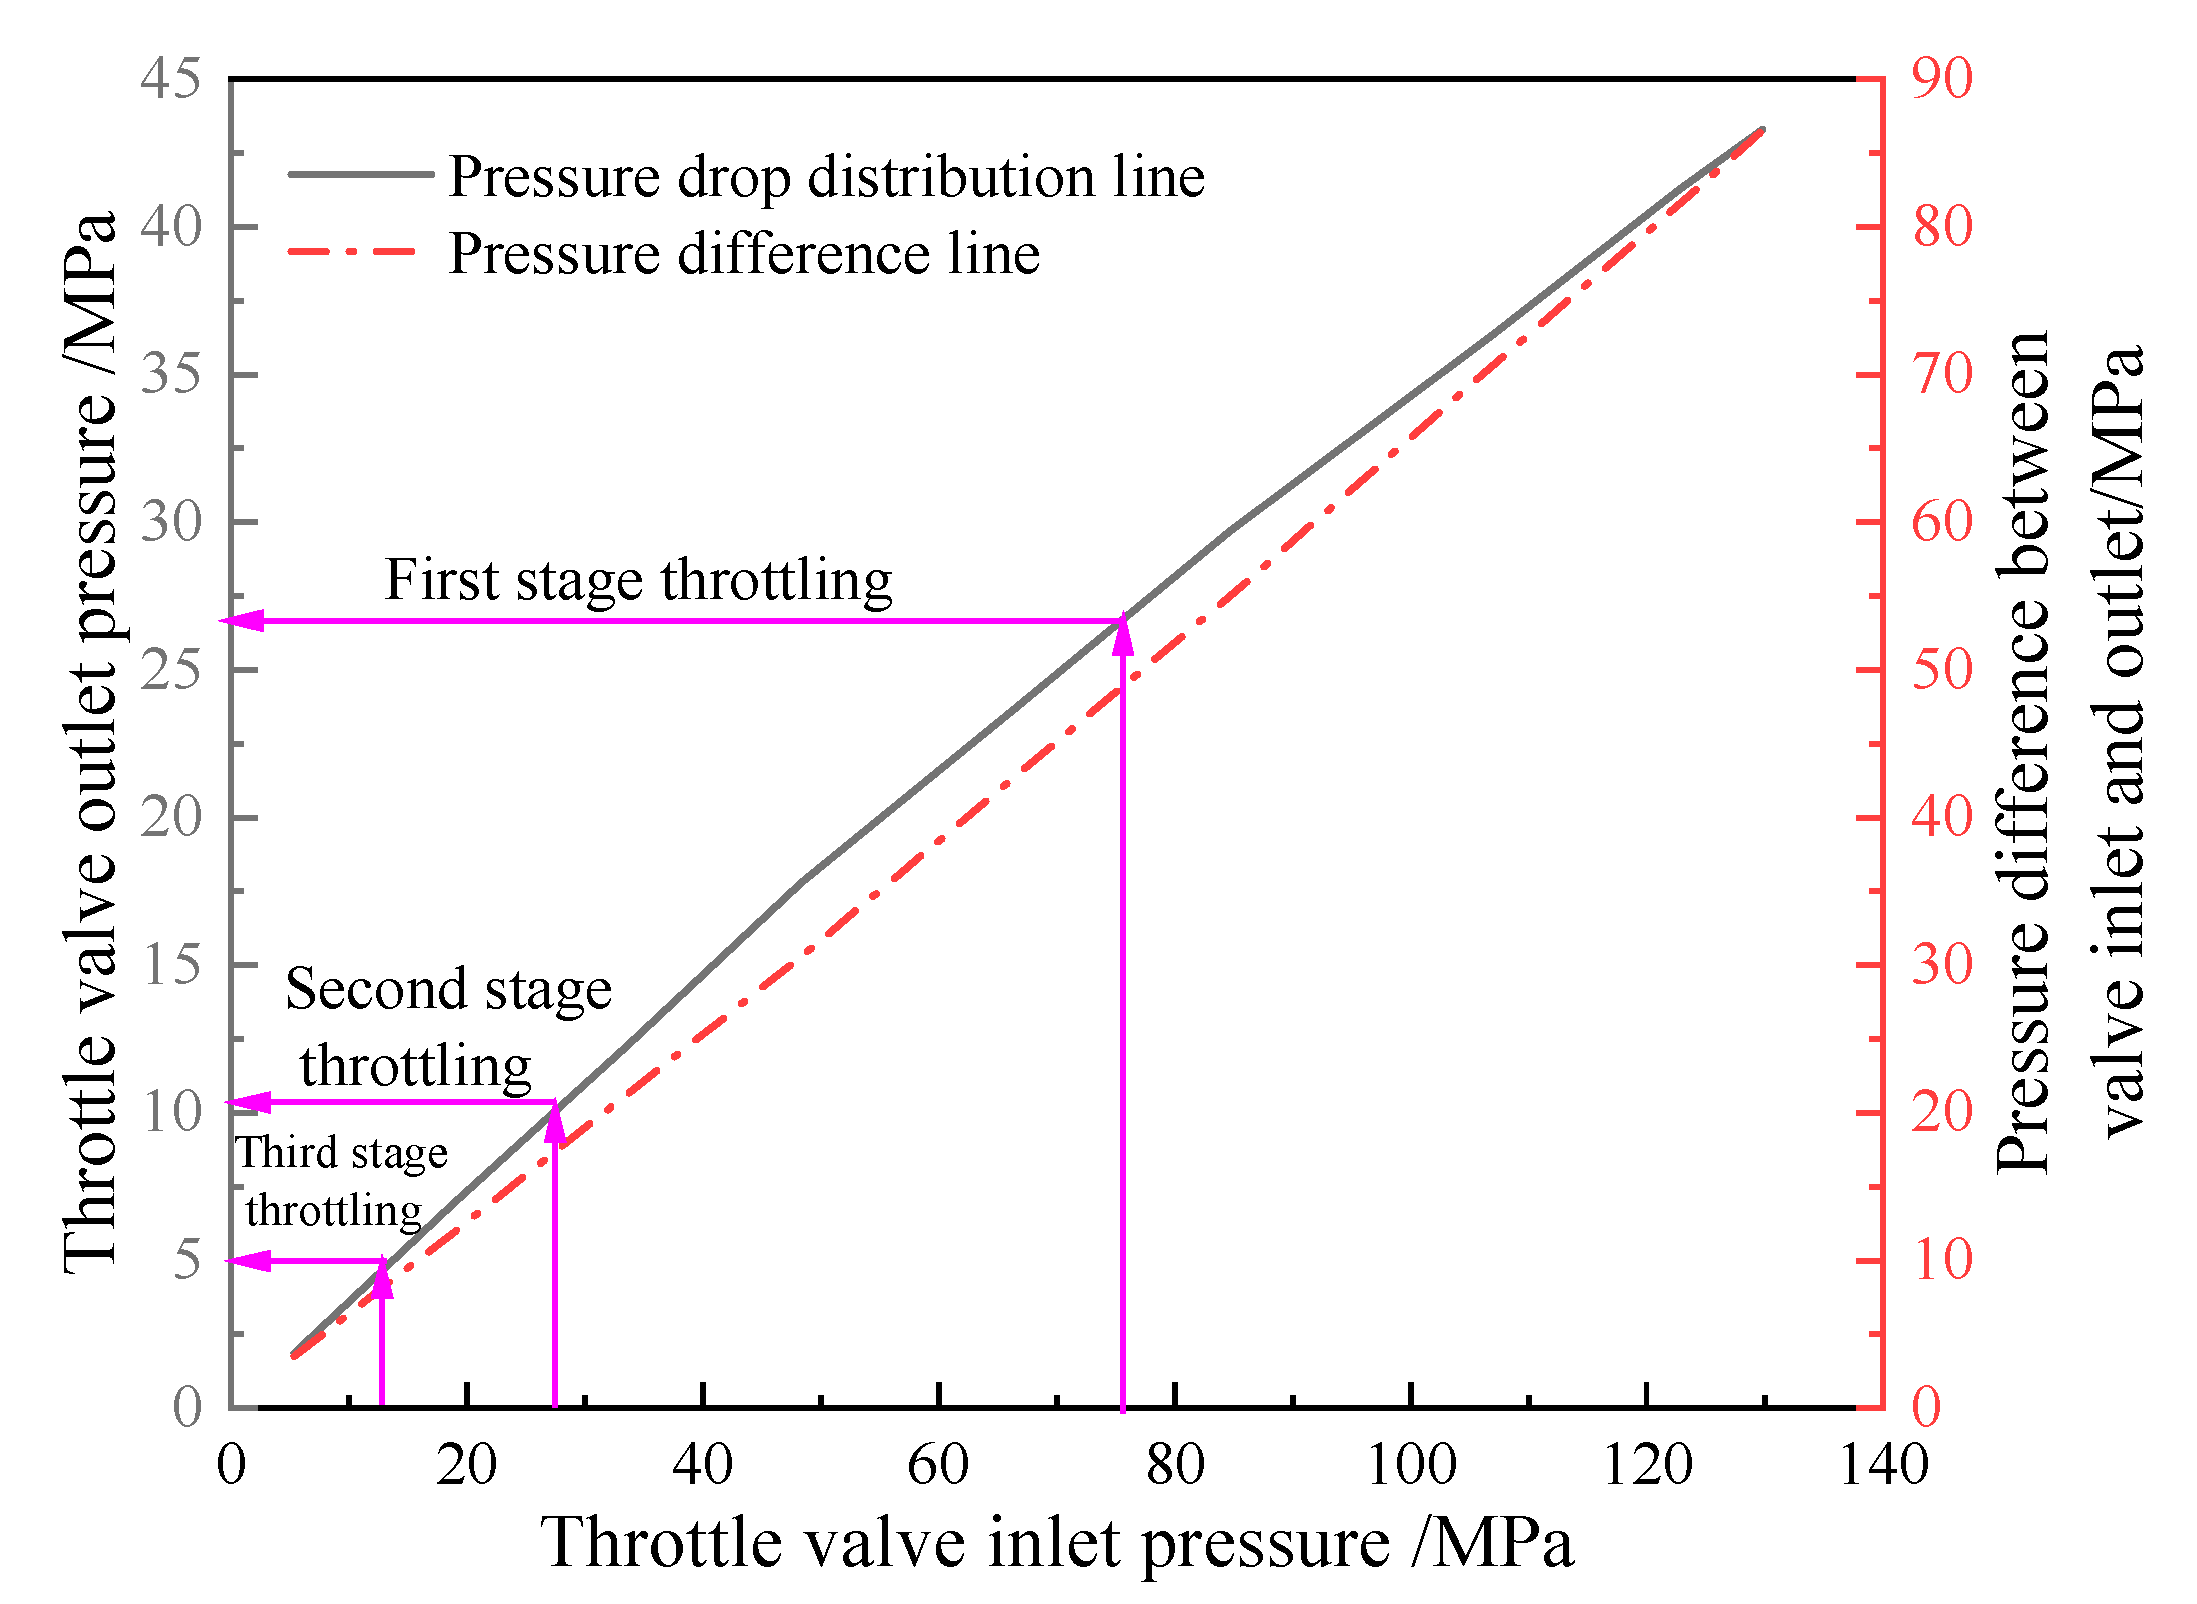
3.3. Calculation Method of Throttling Pressure Difference

The pressure of natural gas will decrease continuously after flowing through the throttle valve, and the lowest pressure at the outlet can only be reduced to the critical flow pressure. In this case, the pressure difference between the inlet and outlet of the throttle valve is the maximum throttle pressure difference of natural gas. Since the HNE-DS model does not apply to multicomponent mixed fluid in calculating the critical flow pressure, the author here describes the method of replacing the Clausius Clapeyron equation in the original HNE-DS model with the PR EoS in the previous literature [30]. An expression of nonequilibrium compressibility ωcnew for multicomponents is presented there. When the inlet pressure and temperature of the throttle valve are stable, the minimum pressure at the outlet of the throttle valve can be calculated by the improved HNE-DS model.

4. Distribution of Throttling Pressure Difference in Ultra-High-Pressure Sour Gas Wells

In this section, the pressure difference redistribution method of the throttling process is explored by using the prediction model proposed and the discovered throttling temperature variation characteristics. Two ultra-high-pressure sour gas wells—L004-X1 and L016-H1—were selected for case illustration.

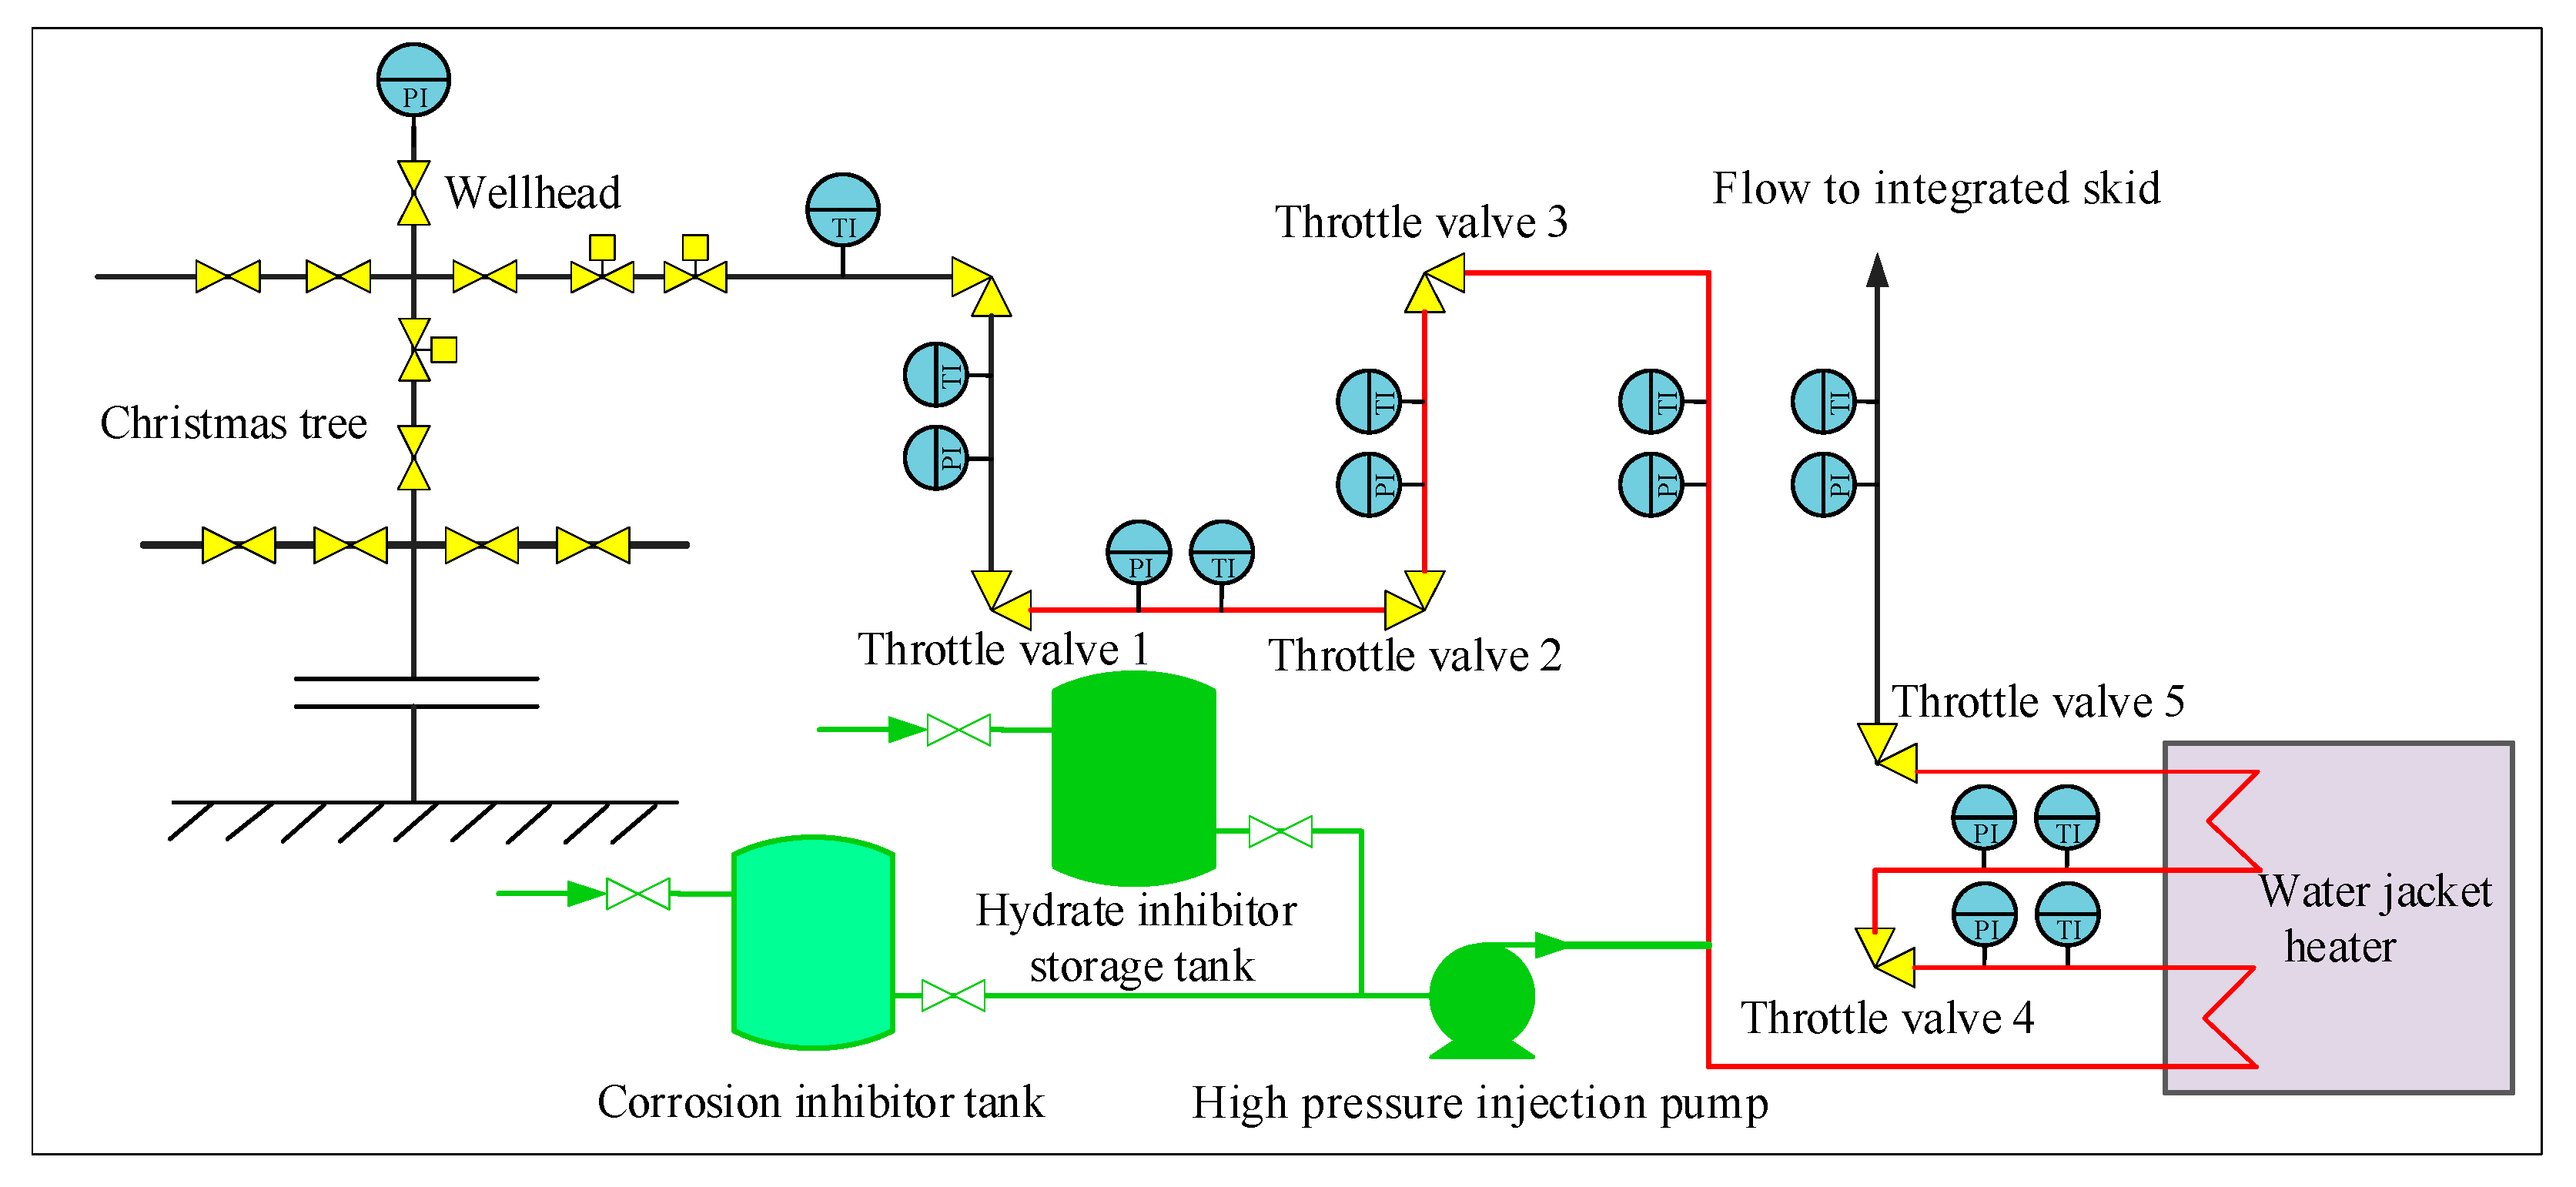
4.1. Traditional Throttling Technology for Ultra-High-Pressure Gas Wells in Northwestern Sichuan

The deep marine gas reservoirs in Northwestern Sichuan have high formation pressure and their composition contains acid gas. In the early stages of gas field development, there was a lack of suitable surface throttling technology. To ensure the safety of gas well trial production and avoid gas hydrate blockages caused by the low temperature during the throttling process, a group of ultra-high-pressure sour gas wells, such as L004-X1 and L016-H1, adopted the complex five-stage throttling technology with small pressure differences, in which a water jacket heater is placed upstream of the end two-stage throttle value to prevent hydrate formation. Table 7 shows the operating parameters of the throttling process and the hydrate formation temperature at the initial stage of trial production in wells L004-X1 and L016-H1. The initial process flow of well L004-X1 is shown in Figure 3.

4.2. Optimization of Throttling Technology for Ultra-High-Pressure Sour Gas Wells

For the distribution of the throttling pressure difference and process optimization, the hydrate formation temperature and throttling temperature should be first determined in the depressurization process to judge whether hydrate is formed under the throttling pressure. Taking the temperature and pressure at the wellhead for gas well L004-X1 as the initial conditions for the inlet of the first throttle valve, the throttle temperature drops and hydrate formation condition curves under different wellhead pressures were predicted as shown in Figure 4. When the throttling temperature drop curve is higher than the hydrate formation curve, the hydrate will not be generated during the throttling process; otherwise, it may be formed. Based on this, it can be judged from Figure 4 that, when the wellhead pressure of gas well L004-X1 is throttled to more than 10 MPa, hydrate will not be generated in the throttling facility. For gas well L016-H1, it can also be confirmed that hydrate will not be generated when the outlet pressure of the throttle valve is above 15 MPa.
In addition to the constraints of hydrate formation conditions, the maximum throttle pressure difference is restricted by the critical flow pressure. Therefore, the second important task is to maximize the throttling pressure difference at each stage under the restriction of hydrate and critical flow. This will allow hydrate control measures such as heating or injecting inhibitors to be implemented safely at low pressures. Figure 5 shows the minimum throttling pressure (critical flow pressure) that can be achieved at the outlet of the throttle valve, and the pressure difference curve between the inlet and outlet of the throttle valve. It should be noted that, when the outlet pressure of each stage of the throttle valve is determined, the inlet pressure of the next stage of the throttle valve is also determined. Further, using the proposed model, the corresponding throttling temperatures of each stage can be predicted. The parameters of the entire multistage throttling process are listed in Table 8. According to Figure 5 and Table 8, the minimum outlet pressure of the first-stage throttle valve in well L004-X1 can be reduced to 26.5 MPa, and the throttle temperature is 308.10 K. After second-stage throttling, it can be reduced to 10.5 MPa, and the throttle temperature is 276.26 K. After third-stage throttling, it is reduced to 5 MPa, which meets the requirements of gathering and transportation. Similarly, with three-stage throttling and water-jacket furnace heating, well L016-H1 can achieve throttling and depressurization in ultra-high-pressure sections. The throttling parameters are also shown in Table 8.
The prediction results of gas wells L004-X1 and L016-H1 show that it is feasible to adopt a three-stage throttling process for high-pressure and ultra-high-pressure sour gas wells. The experiment of ultra-high-pressure throttling technology based on the fixed throttle valve with a large pressure drop was innovatively applied in two trial wells (as shown in Figure 6) in Northwestern Sichuan. After process optimization and the reconstruction of the two gas wells, the trial production operation was stable. Moreover, no hydrate was formed in the ultra-high-pressure and high-pressure sections. The optimized throttling process has the advantages of requiring fewer throttling stages and less equipment, and higher process gathering efficiency, compared with the traditional process (as shown in Figure 3) with five-stage throttling and two-stage heating at the end. The successful application of this technology in the field supports the predevelopment evaluation of deep marine carbonate gas reservoirs in the Northwestern Sichuan Basin and provides experience for the production and safety management of similar gas reservoirs. In addition, the proposed method also has certain reference significance for other industrial scenarios where the high-pressure throttling process and hydrate prevention and control are applied, such as the injection and production process of depleted gas fields with H2 storage and CO2 sequestration [32].

5. Conclusions and Recommendations

(1)
This work presents an accurate method for predicting hydrate formation conditions of ultra-high-pressure sour gas. The prediction model is constructed based on the vdW-P model and CPA EoS and considers the influence of the intermolecular association between acid gases (H2S, CO2) and H2O. In a wide range of pressures (1.02–178 MPa), the average absolute deviation of the predicted hydrate formation temperature is less than 1 K, and its calculation accuracy is superior to those of the vdW-P model and PR/SRK EoSs;
(2)
Based on the Lee–Kesler EoS and the isenthalpic throttling principle, the prediction model for throttling temperature of ultra-high-pressure sour natural gas is proposed. This paper puts forward a method of process simplification that involves making full use of the advantages of temperature rise after throttling in the high-pressure and ultra-high-pressure throttling sections, thus reasonably distributing the throttling pressure difference to simplify the surface throttling series and equipment;
(3)
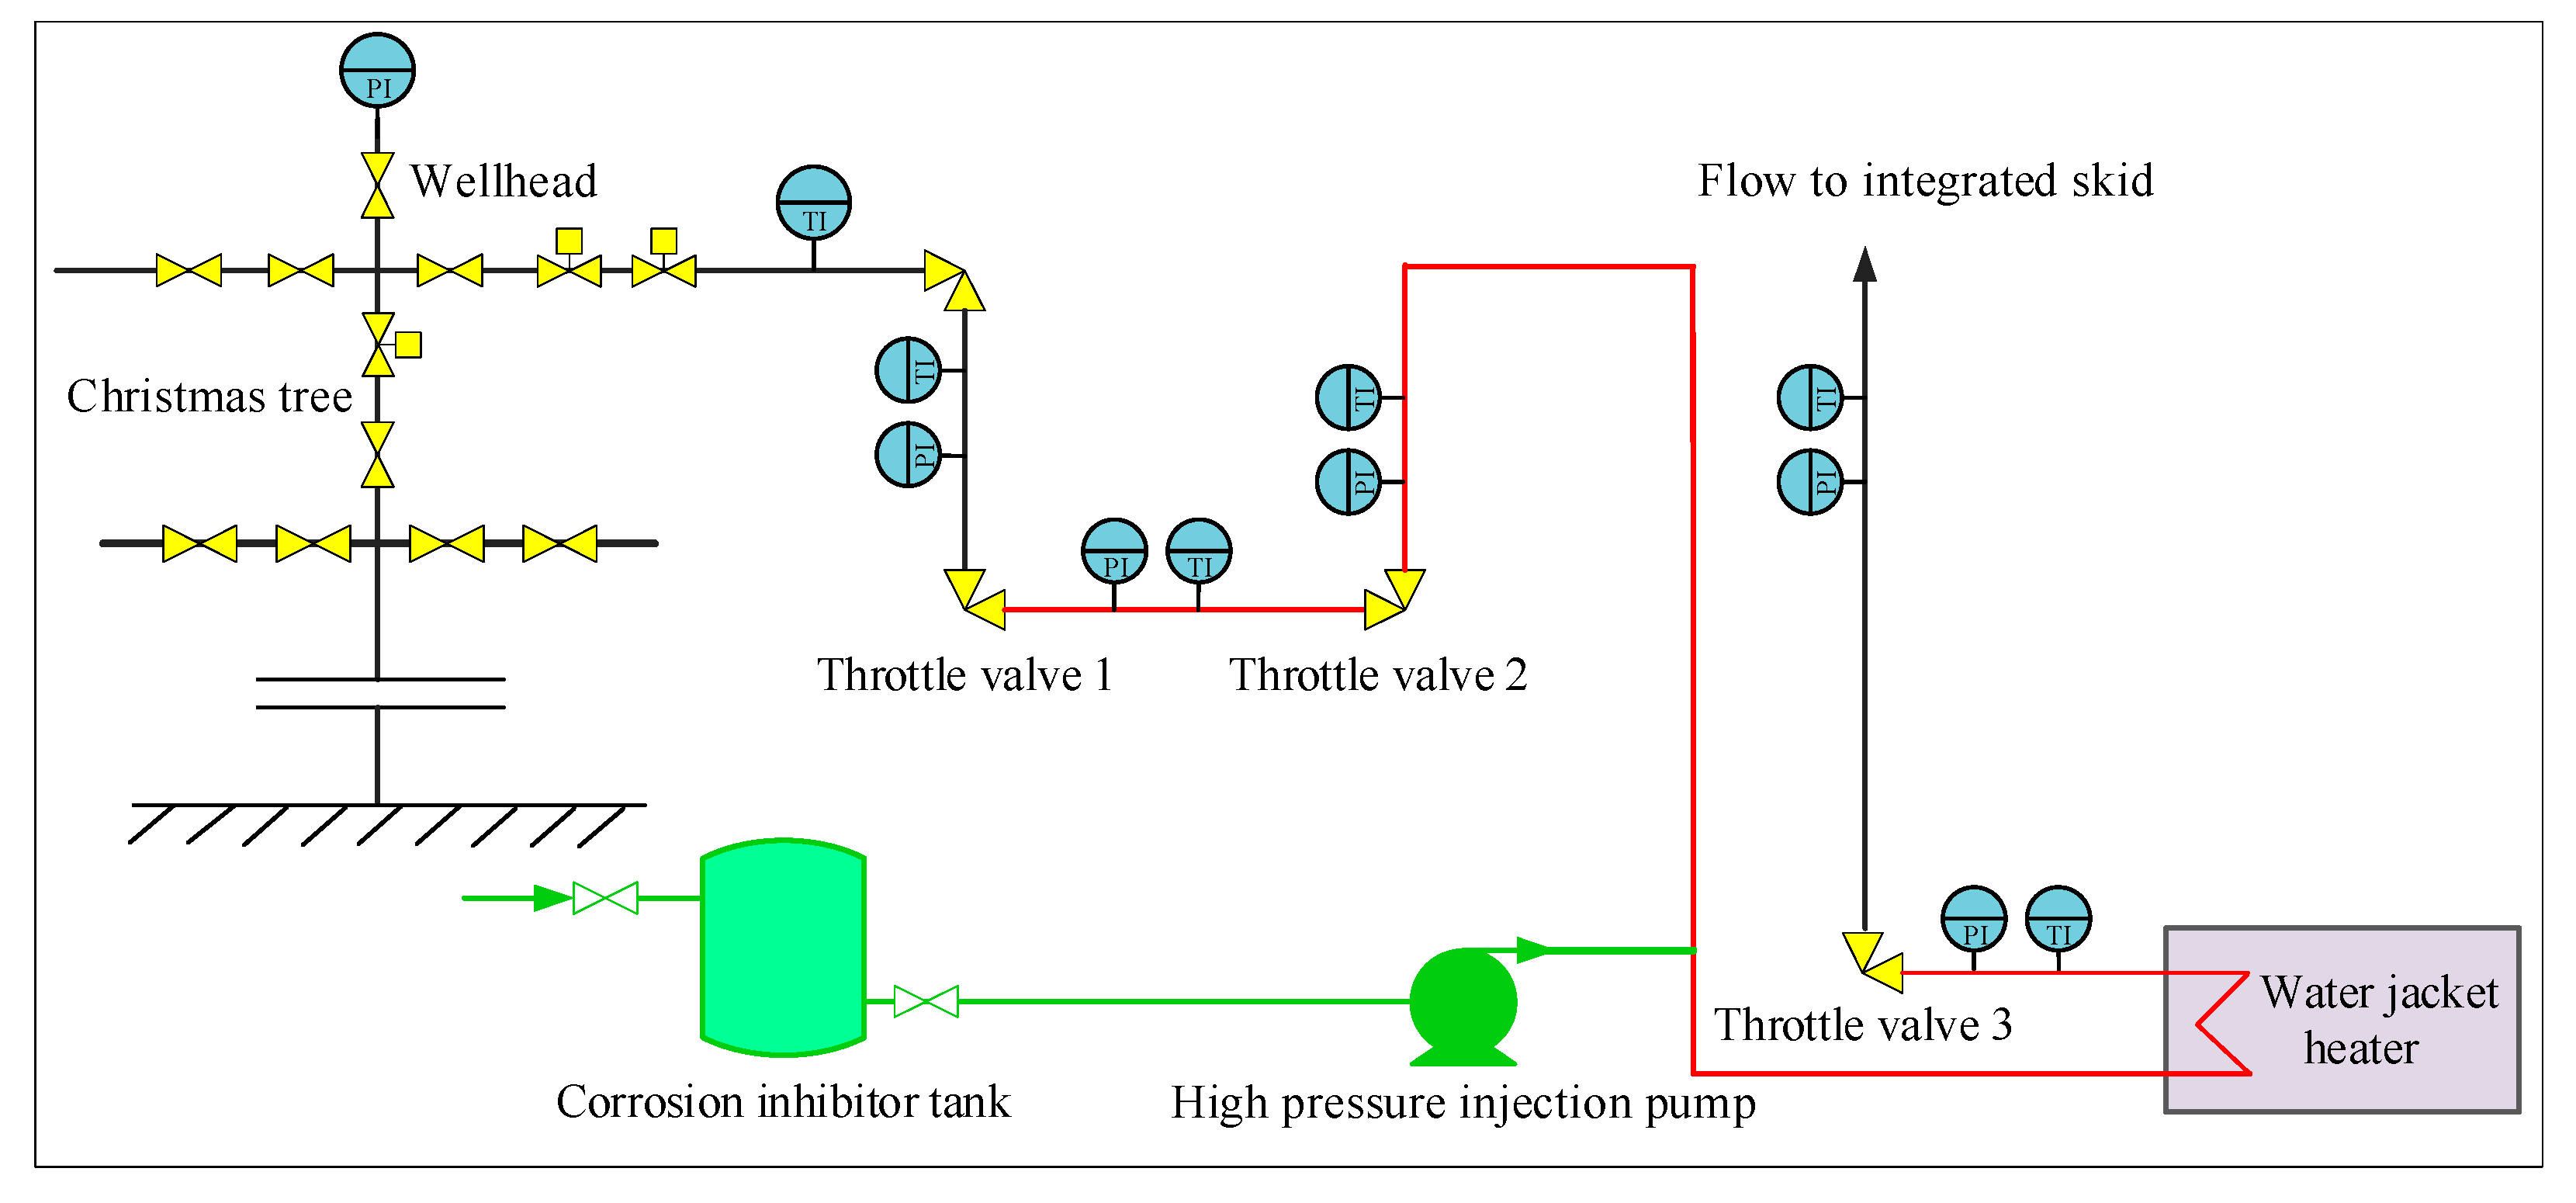
Based on the field test and application of gas wells L004-X1 and L016-H1, the feasibility of selecting a three-stage throttling process for high-pressure and ultra-high-pressure sour natural gas wells was confirmed. The innovatively adopted ultra-high-pressure throttling technology based on the fixed throttle valve with a large pressure difference has fewer throttling stages and requires less equipment compared with the traditional five-stage throttling process;
(4)
The exploration and practice of large pressure difference throttling technology provide a solution to the surface hydrate plugging problem in the process of trial production and the development of ultra-high-pressure sour gas. However, the influence of sour media on throttling valve erosion and the reliability of fixed throttling valve application, under conditions of a large pressure difference and high flow rate, need to be further studied. The proposed method can also be further extended to similar industrial processes, such as the injection–production process for depleted gas fields with H2 storage and CO2 sequestration, for hydrate prevention and throttling process optimization.

Author Contributions

Conceptualization, Z.L. (Zhaoqian Luo); methodology, Q.L.; validation, Q.L. and F.Y.; formal analysis, H.W.; investigation, B.W. and Z.P.; writing—original draft preparation, Z.L. (Zhaoqian Luo); writing—review and editing, Z.L. (Ziyuan Li); review and editing, W.J. All authors have read and agreed to the published version of the manuscript.

Funding

This research received no external funding.

Institutional Review Board Statement

Not applicable.

Informed Consent Statement

Not applicable.

Data Availability Statement

All data are presented in the paper.

Conflicts of Interest

The authors declare no conflict of interest.

References

  1. Yang, Y.; Chen, C.; Wen, L.; Chen, X.; Liang, H.; Liu, R.; Guan, X.; Luo, B.; Xie, C. Characteristics of buried structures in northern Longmenshan mountains and its significance to oil and gas exploration in the Sichuan Basin. Nat. Gas Ind. B 2019, 6, 175–182. [Google Scholar] [CrossRef]
  2. Zhang, B.; Xie, J.; Yin, H.; Hu, X.; Wang, Y.; Yang, X.; Pei, S. Characteristics and exploration direction of the Middle Permian carbonate reservoirs in the Longmenshan mountain areas, western Sichuan Basin. Nat. Gas Ind. 2018, 38, 33–42. [Google Scholar]
  3. Liu, Q.; Tang, Y.; Luo, Z.; Tian, Z.; Xiao, Z.; Zhou, G. The surface gathering and transportation technology suitable for ultrahigh pressure sulfur gas wells in the northwestern Sichuan Basin. Nat. Gas Ind. 2017, 37, 101–107. [Google Scholar]
  4. Jia, W.; Yang, F.; Wu, X.; Li, C.; Wang, Y. Predictions on temperatures of high-pressure gas/water/MEG mixtures flowing through wellhead chokes. J. Nat. Gas Sci. Eng. 2020, 74, 103108. [Google Scholar] [CrossRef]
  5. Vasheghani Farahani, M.; Jahanpeyma, Y.; Taghikhani, V. Dynamic Modeling and Numerical Simulation of Gas Lift Performance in Deviated Oil Well Using the Two-Fluid Model. In Proceedings of the 80th EAGE Conference and Exhibition 2018, Copenhagen, Denmark, 11–14 June 2018; Volume 2018, pp. 1–5. [Google Scholar]
  6. Zeng, T.; Li, C.; Jia, W. Surface Throttling Process of Abnormally High Pressure Jiulongshan Gas Field. Oil-Gas Field Surf. Eng. 2016, 35, 59–61. [Google Scholar]
  7. Platteeuw, J.C.; van der Waals, J.H. Thermodynamic properties of gas hydrates. Mol. Phys. 1958, 1, 91–96. [Google Scholar] [CrossRef]
  8. Ng, H.J.; Robinson, D.B. The measurement and prediction of hydrate formation in liquid hydrocarbon-water systems. Ind. Eng. Chem. Fundam. 1976, 15, 293–298. [Google Scholar] [CrossRef]
  9. Valiollahi, S.; Kavianpour, B.; Raeissi, S.; Moshfeghian, M. A new Peng-Robinson modification to enhance dew point estimations of natural gases. J. Nat. Gas Sci. Eng. 2016, 34, 1137–1147. [Google Scholar] [CrossRef]
  10. Epelle, E.I.; Bennett, J.; Abbas, H.; Schmidt, K.A.G.; Vesovic, V. Correlation of binary interaction coefficients for hydrate inhibition using the Soave-Redlich-Kwong Equation of State and the Huron-Vidal mixing rule. J. Nat. Gas Sci. Eng. 2020, 77, 103259. [Google Scholar] [CrossRef]
  11. Jia, W.L.; Yang, F.; Li, C.J.; Huang, T.; Song, S.S. A unified thermodynamic framework to compute the hydrate formation conditions of acidic gas/water/alcohol/electrolyte mixtures up to 186.2 MPa. Energy 2021, 230, 120735. [Google Scholar] [CrossRef]
  12. Kontogeorgis, G.M.; Folas, G.K. Thermodynamic Models for Industrial Applications; John Wiley & Sons: New York, NY, USA, 2009. [Google Scholar]
  13. Hassanpouryouzband, A.; Farahani, M.V.; Yang, J.; Tohidi, B.; Chuvilin, E.; Istomin, V.; Bukhanov, B. Solubility of Flue Gas or Carbon Dioxide-Nitrogen Gas Mixtures in Water and Aqueous Solutions of Salts: Experimental Measurement and Thermodynamic Modeling. Ind. Eng. Chem. Res. 2019, 58, 3377–3394. [Google Scholar] [CrossRef]
  14. Lee, B.I.; Kesler, M.G. A generalized thermodynamic correlation based on three-parameter corresponding states. AIChE J. 1975, 21, 510–527. [Google Scholar] [CrossRef]
  15. Li, C.; Jia, W.; Wu, X. Temperature Prediction for High Pressure High Temperature Condensate Gas Flow Through Chokes. Energies 2012, 5, 670–682. [Google Scholar] [CrossRef]
  16. Leung, J.C. A generalized correlation for one-component homogeneous equilibrium flashing choked flow. AIChE J. 1986, 32, 1743–1746. [Google Scholar] [CrossRef]
  17. Henry, R.E.; Fauske, H.K. The Two-Phase Critical Flow of One-Component Mixtures in Nozzles, Orifices, and Short Tubes. J. Heat Transf. 1971, 93, 179–187. [Google Scholar] [CrossRef]
  18. Schmidt, J.; Claramunt, S. Sizing of rupture disks for two-phase gas/liquid flow according to HNE-CSE-model. J. Loss Prev. Process Ind. 2016, 41, 419–432. [Google Scholar] [CrossRef]
  19. Avlonitis, D. The determination of kihara potential parameters from gas hydrate data. Chem. Eng. Sci. 1994, 49, 1161–1173. [Google Scholar] [CrossRef]
  20. Sloan, E.D., Jr.; Koh, C.A.; Koh, C.A. Clathrate Hydrates of Natural Gases; CRC Press: Boca Raton, FL, USA, 2007. [Google Scholar]
  21. Voutsas, E.C.; Kontogeorgis, G.M.; Yakoumis, I.V.; Tassios, D.P. Correlation of liquid-liquid equilibria for alcoholhydrocarbon mixtures using the CPA equation of state. Fluid Phase Equilibria 1997, 132, 61–75. [Google Scholar] [CrossRef]
  22. Tsivintzelis, I.; Kontogeorgis, G.M.; Michelsen, M.L.; Stenby, E.H. Modeling phase equilibria for acid gas mixtures using the CPA equation of state. Part II: Binary mixtures with CO2. Fluid Phase Equilibria 2011, 306, 38–56. [Google Scholar] [CrossRef]
  23. Tsivintzelis, I.; Kontogeorgis, G.M.; Michelsen, M.L.; Stenby, E.H. Modeling phase equilibria for acid gas mixtures using the CPA equation of state. I. Mixtures with H2S. AIChE J. 2010, 56, 2965–2982. [Google Scholar] [CrossRef]
  24. Nakano, S.; Moritoki, M.; Ohgaki, K. High-Pressure Phase Equilibrium and Raman Microprobe Spectroscopic Studies on the Methane Hydrate System. J. Chem. Eng. Data 1999, 44, 254–257. [Google Scholar] [CrossRef]
  25. Nakano, S.; Moritoki, M.; Ohgaki, K. High-Pressure Phase Equilibrium and Raman Microprobe Spectroscopic Studies on the CO2 Hydrate System. J. Chem. Eng. Data 1998, 43, 807–810. [Google Scholar] [CrossRef]
  26. Selleck, F.T.; Carmichael, L.T.; Sage, B.H. Phase behavior in the hydrogen sulfide-water system. Ind. Eng. Chem. 1952, 44, 2219–2226. [Google Scholar] [CrossRef]
  27. Aghajanloo, M.; Taheri, Z.; Behbahani, T.J.; Mohammadi, A.H.; Ehsani, M.R.; Heydarian, H. Experimental determination and thermodynamic modeling of clathrate hydrate stability conditions in methane + hydrogen sulfide + water system. J. Nat. Gas Sci. Eng. 2020, 83, 103549. [Google Scholar] [CrossRef]
  28. Huang, Q.; Sun, C.; Chen, G.; Yang, L. Hydrate formation conditions of (CH4+CO2+H2S) ternary sour natural gases. CIESC J. 2005, 48, 1159–1163. [Google Scholar]
  29. Teng, L.; Zhang, D.; Li, Y.; Wang, W.; Wang, L.; Hu, Q.; Ye, X.; Bian, J.; Teng, W. Multiphase mixture model to predict temperature drop in highly choked conditions in CO2 enhanced oil recovery. Appl. Therm. Eng. 2016, 108, 670–679. [Google Scholar] [CrossRef] [Green Version]
  30. Jia, W.L. Basic Theory and Simulation for High Temperature and High Pressure Condensate Gas Choke Process. Master’s Thesis, Southwest Petroleum University, Chengdu, China, 2011. [Google Scholar]
  31. API. American Petroleum Institute Data Book, 7th ed.; EPCON International: Houston, TX, USA, 2005. [Google Scholar]
  32. Hassanpouryouzband, A.; Joonaki, E.; Edlmann, K.; Haszeldine, R.S. Offshore Geological Storage of Hydrogen: Is This Our Best Option to Achieve Net-Zero? ACS Energy Lett. 2021, 6, 2181–2186. [Google Scholar] [CrossRef]
Figure 1. Comparison of hydrate formation conditions predicted based on different models and experimental values for: (a) CH4-water system; (b) CO2-water system; (c) H2S-water system; (d) multicomponent systems (0.05 mol% H2S); (e) multicomponent systems (4.95 mol% H2S); (f) multicomponent systems (14.98 mol% H2S).
Energies 15 08641 g001aEnergies 15 08641 g001b
Figure 2. Prediction of surface throttling temperature drop curve.
Energies 15 08641 g002
Figure 3. The initial process flow diagram of well L004-X1.
Energies 15 08641 g003
Figure 4. Throttle temperature drop curve and hydrate formation condition curve under different wellhead pressures.
Energies 15 08641 g004
Figure 5. Throttle outlet pressure and pressure difference under different throttle inlet pressure conditions.
Energies 15 08641 g005
Figure 6. Process flow diagram of well L004-X1 after wellhead throttling optimization.
Energies 15 08641 g006
Table 1. Binary interaction parameters kij between methane, hydrogen sulfide, carbon dioxide, and water molecules [24].
Gas ComponentsH2OCH4H2SCO2
H2O0.0000−0.03980.0816−0.0559
CH4−0.03980.00000.08880.0956
H2S0.08160.08880.00000.1150
CO2−0.05590.09560.11500.0000
Table 2. Association parameters between acidic gas molecules and water molecules.
Molecular AMolecular BAssociation SchemeβABεAB (Pa∙m3mol−1)Reference
H2OH2O4C0.069216.6550[12]
H2SH2O3B0.23293.7810[23]
CO2H2OSolvation0.18368.3275[21]
Table 3. Mole fraction of natural gas in different systems.
ComponentMole Fraction (mol%)
NG1NG2NG3NG4NG5NG6
CH4100.000.000.0099.5087.6577.71
CO20.00100.000.000.007.407.31
H2S0.000.00100.000.504.9514.98
Table 4. Experimental range of gas hydrate formation conditions.
NG1 [24]NG2 [25]NG3 [26]NG4 [27]NG5 [28]NG6 [29]
Temperature (K)305.08~311.64289.73~292.64302.80~305.40282.10~288.30282.20~297.20276.20~291.20
Pressure (MPa)98.00–178.00104.00~177.003.45~35.075.63~12.190.95~8.681.11~8.02
Table 5. Deviation analysis from different models for the hydrate formation temperature in systems NG1~NG6.
Experimental SystemNumber of Data PointsPressure Range (MPa)AAD (K)
vdW-P -PR EoSvdW-P -SRK EoSvdW-P -CPA EoS
NG1598.00–178.001.520.660.20
NG25104.00~177.003.363.770.37
NG3123.45~35.071.641.540.05
NG485.63~12.190.770.230.14
NG591.04~8.221.591.050.74
NG681.02~7.911.320.970.54
Table 6. Comparison between predicted and measured throttling temperature 1.
Well NumberInlet of the Throttle ValveOutlet of the Throttle ValveDeviation (K)
Measured Pressure (MPa)Measured Temperature (K)Measured Pressure (MPa)Measured Temperature (K)Predicted Temperature (K)
L004-X188.50305.6075.70311.20310.46−0.74
75.70311.2049.50315.70316.420.72
49.50315.7022.30306.80303.35−3.45
22.30306.8020.70301.00301.210.21
21.00320.80.212.10300.02302.052.03
12.00320.40 25.00296.61297.600.99
L016-H175.10323.8134.20325.00325.170.17
34.20325.0012.50298.20296.06−2.14
12.50298.2010.21289.59291.251.66
10.21289.5910.07289.84289.29−0.55
ST1104.00321.8479.00329.12332.243.15
79.00329.1254.00331.94334.472.80
54.00331.9429.00323.58325.431.85
29.00323.5812.00296.10294.96−1.14
SYX13147.94346.4232.82344.31343.13−1.18
32.82344.3122.67339.86337.24−2.62
SY13248.57310.6741.25310.15310.380.23
41.25310.1519.05297.71296.62−1.09
SY001-X347.78318.8431.07315.92316.030.11
31.07315.9217.69304.42304.670.25
ST1246.31325.8031.83320.34322.211.87
31.83320.3417.80306.95306.63−0.32
ST10768.44320.1637.54321.66321.65−0.01
37.54321.6617.59303.72305.421.70
Average absolute deviation1.29
1 The data were measured according to the order of gas flow into the multistage throttle valve, and the outlet temperature and pressure of each stage throttle valve are considered to be the same as the inlet parameters of the next stage throttle valve. 2 Heated by the heat exchanger.
Table 7. Throttling process operation parameters and the hydrate formation temperature of wells L004-X1 and L016-H1 during the trial production period.
Well NumberL004-X1L016-H1
LocationPressure (MPa)Temperature (K)Hydrate Formation Temperature (K)Pressure (MPa)Temperature (K)Hydrate Formation Temperature (K)
Wellhead75.70310.3303.077.49324.6302.7
Outlet of throttle valve 149.50312.8299.434.40319.0295.7
Outlet of throttle valve 2 22.30298.8293.412.50297.0287.8
Outlet of throttle valve 320.70296.5292.910.20289.2286.0
Outlet of throttle valve 412.10300.0288.910.10289.5286.0
Outlet of throttle valve 5 (unheated)5.00273.3281.44.70267.5278.9
Table 8. Optimized throttling process parameters and hydrate formation temperature for wells L004-X1 and L016-H1.
Well NumberL004-X1L016-H1
LocationPressure (MPa)Temperature (K)Hydrate Formation Temperature (K)Pressure (MPa)Temperature (K)Hydrate Formation Temperature (K)
Wellhead75.7310.3303.077.5324.6302.7
Outlet of throttle valve 126.5308.1294.628.1322.5294.1
Outlet of throttle valve 2 10.5276.3287.810.5291.4286.3
Outlet of throttle valve 3 15.0251.2281.45.0269.2279.5
1 The outlet temperature of throttle valve 3 is not heated.
Publisher’s Note: MDPI stays neutral with regard to jurisdictional claims in published maps and institutional affiliations.

