Article

Numerical Analysis for Coal Gasification Performance in a Lab-Scale Gasifier: Effects of the Wall Temperature and Oxygen/Coal Ratio

State Key Laboratory of Clean Energy Utilization, Zhejiang University, Hangzhou 310027, China
*
Author to whom correspondence should be addressed.
Energies 2022, 15(22), 8645; https://doi.org/10.3390/en15228645
Submission received: 23 September 2022 / Revised: 25 October 2022 / Accepted: 28 October 2022 / Published: 17 November 2022
(This article belongs to the Special Issue CO2 Reduction and H2 Promotion Techniques in Energies)

Abstract

:
The optimization of multiple factors for gasification performance using a 3D CFD model with advanced sub-models for single-stage drop tube coal gasification was compared with experimental results. A single-stage down-drop gasifier with multiple coal injectors and a single oxygen injector at the top of the gasifier was investigated at different temperatures and O2/coal ratios. A finite rate/eddy dissipation (FR/ED) model was employed to define the chemical reactions. Kinetic data for the various reactions were taken from previous work. The realizable k–ε turbulent model and Euler–Lagrangian framework were adopted to solve the turbulence equations and solid–gas interaction. First, various preliminary reactions were simulated to validate the reaction model with experimental data. Furthermore, various cases were simulated at various O/C ratios and wall temperatures to analyze the syngas species, temperature profile in the whole gasifier, exit temperature, carbon conversion, turbulent intensity, and velocity profile. The maximum CO was found to be 75.06% with an oxygen/coal ratio of 0.9 at 1800 °C. The minimum and maximum carbon conversions were found to be 97.5% and 99.8% at O/C 0.9 at 1200 °C and O/C 1.1 at 1800 °C, respectively.

1. Introduction

Coal gasification is one of the cleanest methods of coal utilization to produce syngas, electricity, and additional chemical products [1]. The enormous contribution of oil is helping to satisfy the rising demand for electricity over time. However, in the last few decades, scarcities of oil reservoirs and the accessibility of coal in China shifted the research toward the use of coal [2]. The maximum energy conversion into electricity can be achieved through gasification technology with minimal hazardous effects. The researchers’ primary objective is to produce cutting-edge gasifiers with advanced performance and lower pollutant releases [3,4,5,6]. The efficient conversion of coal into gas has been widely investigated in terms of the chemical and physical variations that take place during the gasification process. Besides the experimental work, CFD simulation is a cost-effective approach used to investigate the different parameters, such as the rate of reaction, temperature distribution, oxygen and coal ratio, turbulent intensity, and residence time of the coal. However, CFD simulations of coal gasification require a different mathematical model to interpret the complex turbulence, temperature distribution, reaction rate, etc., to achieve valuable results.
Various researchers recently conducted CFD simulation research for an entrained flow coal gasifier [7,8,9,10,11,12,13,14]. Shaohua et al. [15] studied the numerical simulation of the co-gasification of mixing PET with coal in a fluidized bed and found that a larger particle size reduces heat transfer. Kim et al. [16] performed a numerical simulation for a 300 MW IGCC and found that a 0.7 oxygen/coal ratio is optimal for coal gasification. Diba et al. [17] studied the effect of calcination on coal gasification in fluidized bed furnaces. They found that a 17 kg/h airflow has the highest char conversion and the CO2 composition increased due to calcination. Some researchers investigated mixing gasification agents with syngas and measured the temperature up to 1550 °C using numerical methods [18]. Wang et al. [19] studied the numerical simulation for heat recovery from molten slug and syngas using the discrete-phase and solidification models. Some other researchers used the Euler–Euler method to elaborate the gas and solid flow [20,21], but some studies used Euler–Lagrangian methods to define the interaction of the gas–solid phase [9,22,23,24]. Generally, FR/ED and a probability density function (PDF) were used for the chemistry of the gasification reaction. Researchers used various gasification media, such as air/steam and air [25,26,27]. Some other researchers investigated different parameters through CFD simulation, such as particle size, nozzle design, and gasification reaction [12,28,29,30,31,32]. Imran et al. [33] investigated a two-stage coal gasifier for multi-opposite burners at different oxygen and coal ratios and the result revealed that hydrogen was up to 28%, and CO was 52%; furthermore, it was revealed that pure oxygen produced higher temperatures and maximum carbon conversion efficiencies.
This study used CFD simulations to investigate the influence of different O/C ratios and wall temperatures on parameters such as the temperature distribution, syngas composition, heat generation, and turbulence. First, we investigated different grid densities to determine the grid sensitivity. Having perceptually recognized the independence of the grid sensitivity, we analyzed the effect of the O/C ratio (0.9, 1.0, and 1.1) at different temperatures (1200 °C, 1500 °C, and 1800 °C).

2. Computational Model

2.1. Design and Mesh of the Gasifier

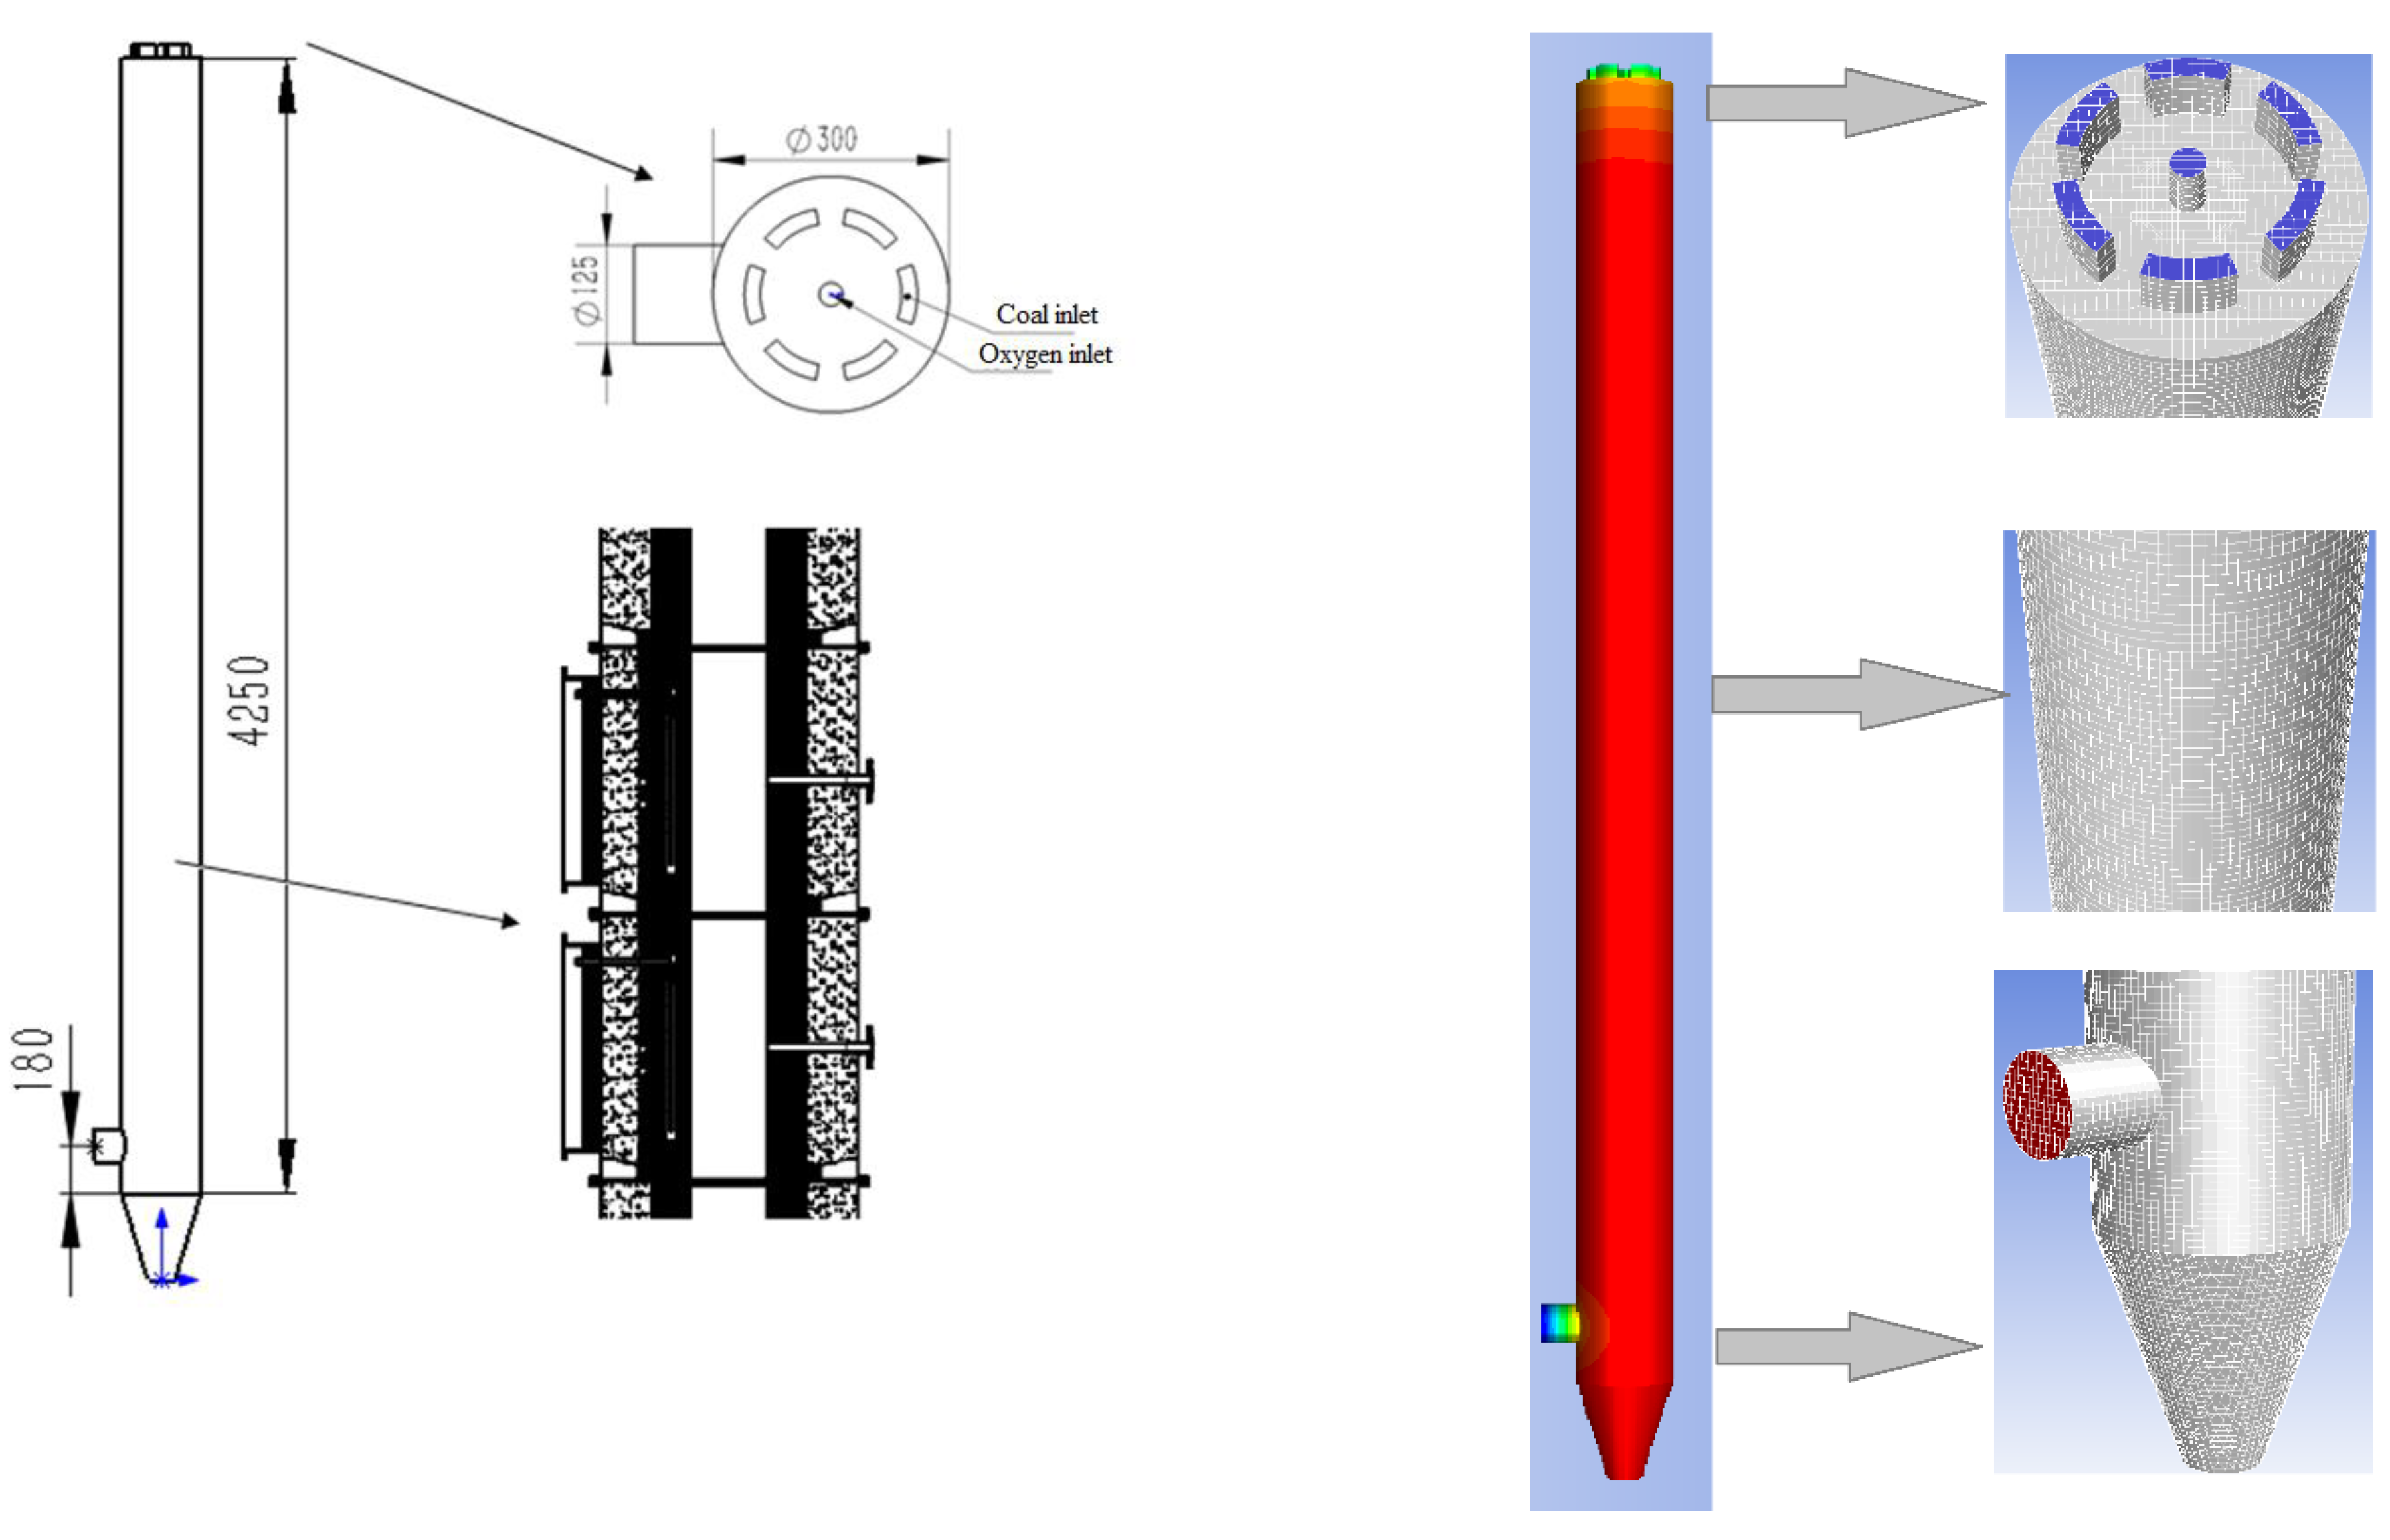
The schematic diagram of the lab-scale gasifier is shown in Figure 1. The height and internal diameter of the gasifier were 4.25 m and 0.3 m, respectively. Pulverized coal and oxygen were inserted into the top of the gasifier, oxygen was inserted into the top of the center, and coal was inserted through six consecutive injectors, as shown in Figure 2. The coal feeder rate was 75 kg/h from the top of the gasifier, and oxygen was injected at various rates. The gasifier was divided into two parts: a combustion zone (upper part) and a reduction zone (lower part). The alternate pattern of coal and oxygen was designed to allow for maximum oxygen utilization in the combustor region and produce a significant amount of heat. The gasifier was a down-drop reactor that consisted of syngas and slug released from the bottom of the furnace. The ultimate and proximate analysis of coal is listed in Table 1. The injection properties were set as a Rosin–Rammler distribution that was appropriate for the particle size (max diameter: 125 µm, min diameter: 4 µm, and average diameter: 45.6 µm). The total amount of coal and oxygen was injected from the top of the gasifier. The CFD simulations were conducted using the Ansys Fluent platform.

2.2. Governing Equation

In the current work, the numerical study included a three-dimensional design, homogenous and heterogeneous reactions, and a steady flow with incompressible turbulence. Therefore, the species, energy, mass momentum, and time-averaged steady-state pressure-based Navier–Stokes equations were solved. The governing equations for the simulation are given below [13]:
x i ( ρ u i j ) = S m
x i ( ρ u i u j ) = ρ g ¯ j P x i + x i ( τ i j ρ u i u j _ _ _ _ _ ) + S j
x i ( ρ c p u i T ) = x i ( λ T x i ρ c p u i T _ _ _ _ _ ) + μ Φ + S h
x i ( ρ u i C j ) = x i ( ρ D i C j x i ρ u i C j _ _ _ _ _ ) + S j
where the symmetric stress tensor is represented by τ i j and the Reynolds stress is represented by ρ u i u j _ _ _ _ _ . The turbulent flow was solved by using the realizable k–ε turbulence equation, while the kinematic turbulence viscosity was determined from the following equation:
µt = ρCµ k2/ε
where the viscosity constant is Cµ, and ƙ and ε represent the turbulence kinetic energy and rate of dissipation, respectively, which can be obtained from the subsequent standard ƙε transport equations [34]:
x i ( ρ u i k ) = x i [ ( μ + μ t σ k ) k x i ] + G k ρ ε
x i ( ρ u i ε ) = x i [ ( μ + μ t σ ε ) ε x i ] + C 1 ε G k ε k + C 2 ε G k ε 2 k
In the given model, Gƙ shows the turbulence kinetic energy as a result of the mean velocity gradients. The turbulent Prandtl numbers for ƙ and ε are represented by σƙ and σε, respectively. The constants C1ε = 1.44, Cµ = 0.009, σƙ = 1.0, C2ε = 1.92, and σε = 1.3 in Launder and Spalding’s work [35] were used in Equations (6) and (7). The diffusion coefficient (D) and turbulence heat conductivity (λ) in Equations (3) and (4) are given by
ρ C p u i ¯ T ¯ = λ T x i = C p μ t P r t T x i
ρ u i ¯ C j ¯ = ρ D i C j x i = μ t S c t C j x i
Prt (=0.85) and Sct (=0.7) represent the turbulence Prandtl number and the Schmidt number, respectively.
The discrete phase model (DPM) was used to calculate the motion of the particles in the Lagrangian method. According to the Lagrangian reference frame, the integrated balance force on the coal estimated the discrete phase particle trajectory. The balanced force compares the inertia of coal with the forces as a substitute for the coal and can be represented as follows [36]:
d u p d t = F D ( u u p ) + g x ρ p ρ ρ p + F x   ( for   x - direction   in   Cartesian   coordinates )  
The governing equations consider the mass loss and heat of particles as a source term and consider the interaction between continuous and discrete phases.
The P-1 equation determines the radiation interaction between gas and other particles. In the P-1 equation, the radiation intensity is found using the following model [14]:
q r = a G 4 a G σ T 4
where
q r = 1 3 ( a + σ s ) C σ s G
where σs, a, σ, C, and G represent the scattering coefficient, absorption coefficient, Stefan–Boltzmann constant, linear anisotropic phase function coefficient, and incident radiation, respectively.

2.3. Main Reaction of Gasification

The species transport equation (Equation (4)) can be utilized for kinetic parameters and chemical reactions inside the gasifier, but due to the high temperature in the gasifier, coal converts into char, volatiles, and ash [37]. The following equation shows the released composition from the coal [38]:
Coal →α1 volatiles + α2 H2O + α3 char + α4 Ash
Due to the high temperature near the coal particles, coal inserted from the top in a high heating zone will cause various chemical and physical changes [30]. The main reactions include char gasification, combustion of unburned char and volatiles, and coal devolatilization. In the current work, the volatile species were combined into a single volatile species C1.45H4.64O0.44 and determined from the ultimate and proximate analysis of coal in Table 1. The two-step devolatilization model [39] was used to describe the released volatiles and is given as follows:
Coal k l ( 1 Y l ) × Char l + Y l × Volatile
Coal k h ( 1 Y h ) × Char h + Y h × Volatile
where Y represents the stoichiometric coefficient. Equation (14) shows the lower temperature and Equation (15) denotes a higher reaction rate at higher temperatures. The kinetic reaction model is represented as
d V d t = ( k l Y 1 + k h Y h ) Coal
k l = A l exp ( E l / R T p )
k h = A h exp ( E h / R T p )
V, A, k, TP, and E represent the volatile mass fraction, pre-exponential factor, rate constant of reaction, coal particle temperature, and reaction activation energy, respectively. The kl, Yl, kh, Yh, Eh, and El values were obtained from earlier studies [33,34] and are shown in Table 2. The coal devolatilization resulted in char production; therefore, char gasification was the source of CO and H2 production. Researchers selected different reactions to define the gasification reaction mechanisms [9,13,14,20,22,23,24,40]. Different preliminary reactions were selected to discover the optimized reaction mechanism between various reactions in the present work; different cases are presented in Table 3.
The different reactions consisted of various chemical volatile species to represent different reaction mechanisms: O2, C(s), CO, N2, H2O, H2, and CO2. The species transport model was chosen with the particle surface, volumetric reaction, and turbulence–chemistry interaction defined by the FR/ED model employed to determine the rate of formation of each species and update the source term Sr in Equation (4) as given below:
S r = M j j = 1 N w j , r
w j , r = ( v j , r v j , r ) k f ( i = 1 N r [ C ] η 1 K e q i = 1 N r [ C ] η )
k f = A T B e ( E a / R T )
where kf, B, Ea, and A represent the rate constant for forward reaction (based on the Arrhenius law), temperature exponent, the activation energy of reaction, and pre-exponential factor, respectively. The Ea, A, and B values in various reactions were obtained from earlier work [13,32,41] and are listed in Table 2.

2.4. Simulation Method

The boundary conditions for the input and outlet stream were set as mass flow inlets and pressure outlets, respectively. The coal composition is given in Table 1. The coal feeding rate was constant at 75 kg/h for all case studies. The stationary wall with the no-slip state (zero velocity) at a constant roughness of 0.5 reflected a normal type of wall and the tangent DPM was polynomial. To control the outflow of syngas, the syngas outlet was set as the pressure outlet condition. The energy and momentum equations were decoupled by the implicit pressure, and the steady-state simulation was carried out. The SIMPLE algorithm was employed for coupling the pressure and velocity. Due to the large grid size, parallel processing was used in the numerical calculation. Temperature is the most influential factor in the gasification process, which is why it was chosen for the grid sensitivity analysis. Figure 2 shows the mesh geometry and a close view of the top nozzles and outlet. First, cold flow simulations were selected for four various grids. Furthermore, temperature contours for all the grid sensitivity analyses are shown in Figure 3. The grid analysis for 490,539 and 747,185 showed a similar temperature around the center of the gasifier. Further simulation results were independent of the grid; therefore, a 917,374 grid size was chosen for other simulations at various O2/coal ratios (0.9, 1, and 1.1) and different wall temperatures (1200, 1500, and 1800 °C), as shown in Table 4.

3. Results and Discussion

3.1. Various Grid Sensitivity for Validation of the Model

The temperature was the most influential factor in the gasification, and thus, various mesh sizes were employed for the grid sensitivity study. Figure 2 shows the top nozzle (coal and oxygen inlet) and the gasifier outlet. The numerical simulation’s cold flow (no reaction) was carried out at various grid sizes (490,539, 747,185, 917,374, and 1,229,646 meshes). Figure 3 shows the temperature contours around the center of the gasifier at various grid sizes. Figure 4a shows the temperature profile of the gasifier along with a close view of the temperature for the 3D fluid domain of the upper and lower parts of the gasifier. Figure 4b shows the temperature at different heights of the experimental gasifier. It is clear from Figure 3 that the fluid domain temperature increased as the gasifier decreased in height, but the temperature at the opposite side of the syngas out was higher than the other side of the gasifier. The gasifier’s temperature trend and the gasifier’s height were almost the same, and thus, it can be concluded that the result was independent of the grid; therefore, the 917,374 grids were selected for further simulation.

3.2. Selection of the Reaction Mechanism for Further Simulations

The syngas composition was the best parameter for a comparative study between various reaction mechanisms and experimental results. Figure 5 shows the mol % of CO, H2, and CO2 for various preliminary reactions and experimental results at a constant O/C = 1. Figure 5 shows that the maximum CO mol % was 70.51, and the minimum CO was found in the D case at 46.54%, but the CO mol % was 60.4% in the experimental results. LiJun et al. [39] also investigated reaction mechanisms and found that the CO mol % was less than 65%. Compared with the simulation results, the H2 mol % was higher in the experimental results; indeed, case C had the maximum mol % among the other simulated cases, but the maximum H2 % in the experimental result was 31.39% and case C had 23.09%, while the minimum mol % was found in case D, which was 18.85%. The CO2 composition was unsatisfactory in cases A, B, and D, which were 33.39, 22.72, and 34.60%, respectively, but the minimum CO2 was found to be 6.35% and 8.23% in case C and the experimental results, respectively. Therefore, it is clear from the above discussion that case C showed the best syngas composition regarding the experimental analysis. An ideal reaction mechanism was found in case C, which neglected the oxidation of CO and the proper gasification of char and volatiles was found. Therefore, case C was selected for further simulations.

3.3. Influence of the O/C Ratio and Wall Temperature on the Syngas Production

The temperature and O/C ratio were the key parameters that influenced the gasifier performance because the oxygen-blown drop tube furnace strongly depended on the oxygen concentration. Due to the combustion reaction, CO2 was produced, along with heat released as an endothermic reaction as a result of CO and H2 formation. This study simulated nine cases at various O/C values (0.9, 1, and 1.1) and various temperatures (1200, 1500, and 1800 °C), as shown in Table 4. Figure 6 shows the effect of O/C and temperature on the syngas composition. Figure 6a shows the effect of an O/C ratio = 0.9 at different temperatures. It is clear from Figure 6a that as the temperature increased from 1200 °C to 1800 °C, the CO mol % also increased from 52.03% to 75.06%, the H2 % decreased from 29.57% to 5.95% as the temperature increased, and the CO2 % decreased from 18.39% to 16.76% from 1200 to 1500 °C and then increased slightly up to 18.98% at 1800 °C. Furthermore, Figure 6b,c show the same trend of CO % as in Figure 6a, but the H2 and CO2 trends were quite different. In Figure 6b,c, H2 % was stable at 19% to 20%, but CO2 % decreased with temperature. In general, CO2 % increased the O/C ratio because of the water shift reaction, but as the temperature increased, the CO2 % decreased because a high temperature was not favorable for the water–gas shift reaction. Figure 6b,c show that the temperature and O/C ratio did not have a great impact on the H2 % yield; the reason for this was the non-availability of steam for the water–gas shift reaction because all the simulations occurred in pure oxygen.

3.4. Effect on the Coal Gas Exit Temperature and Carbon Conversion

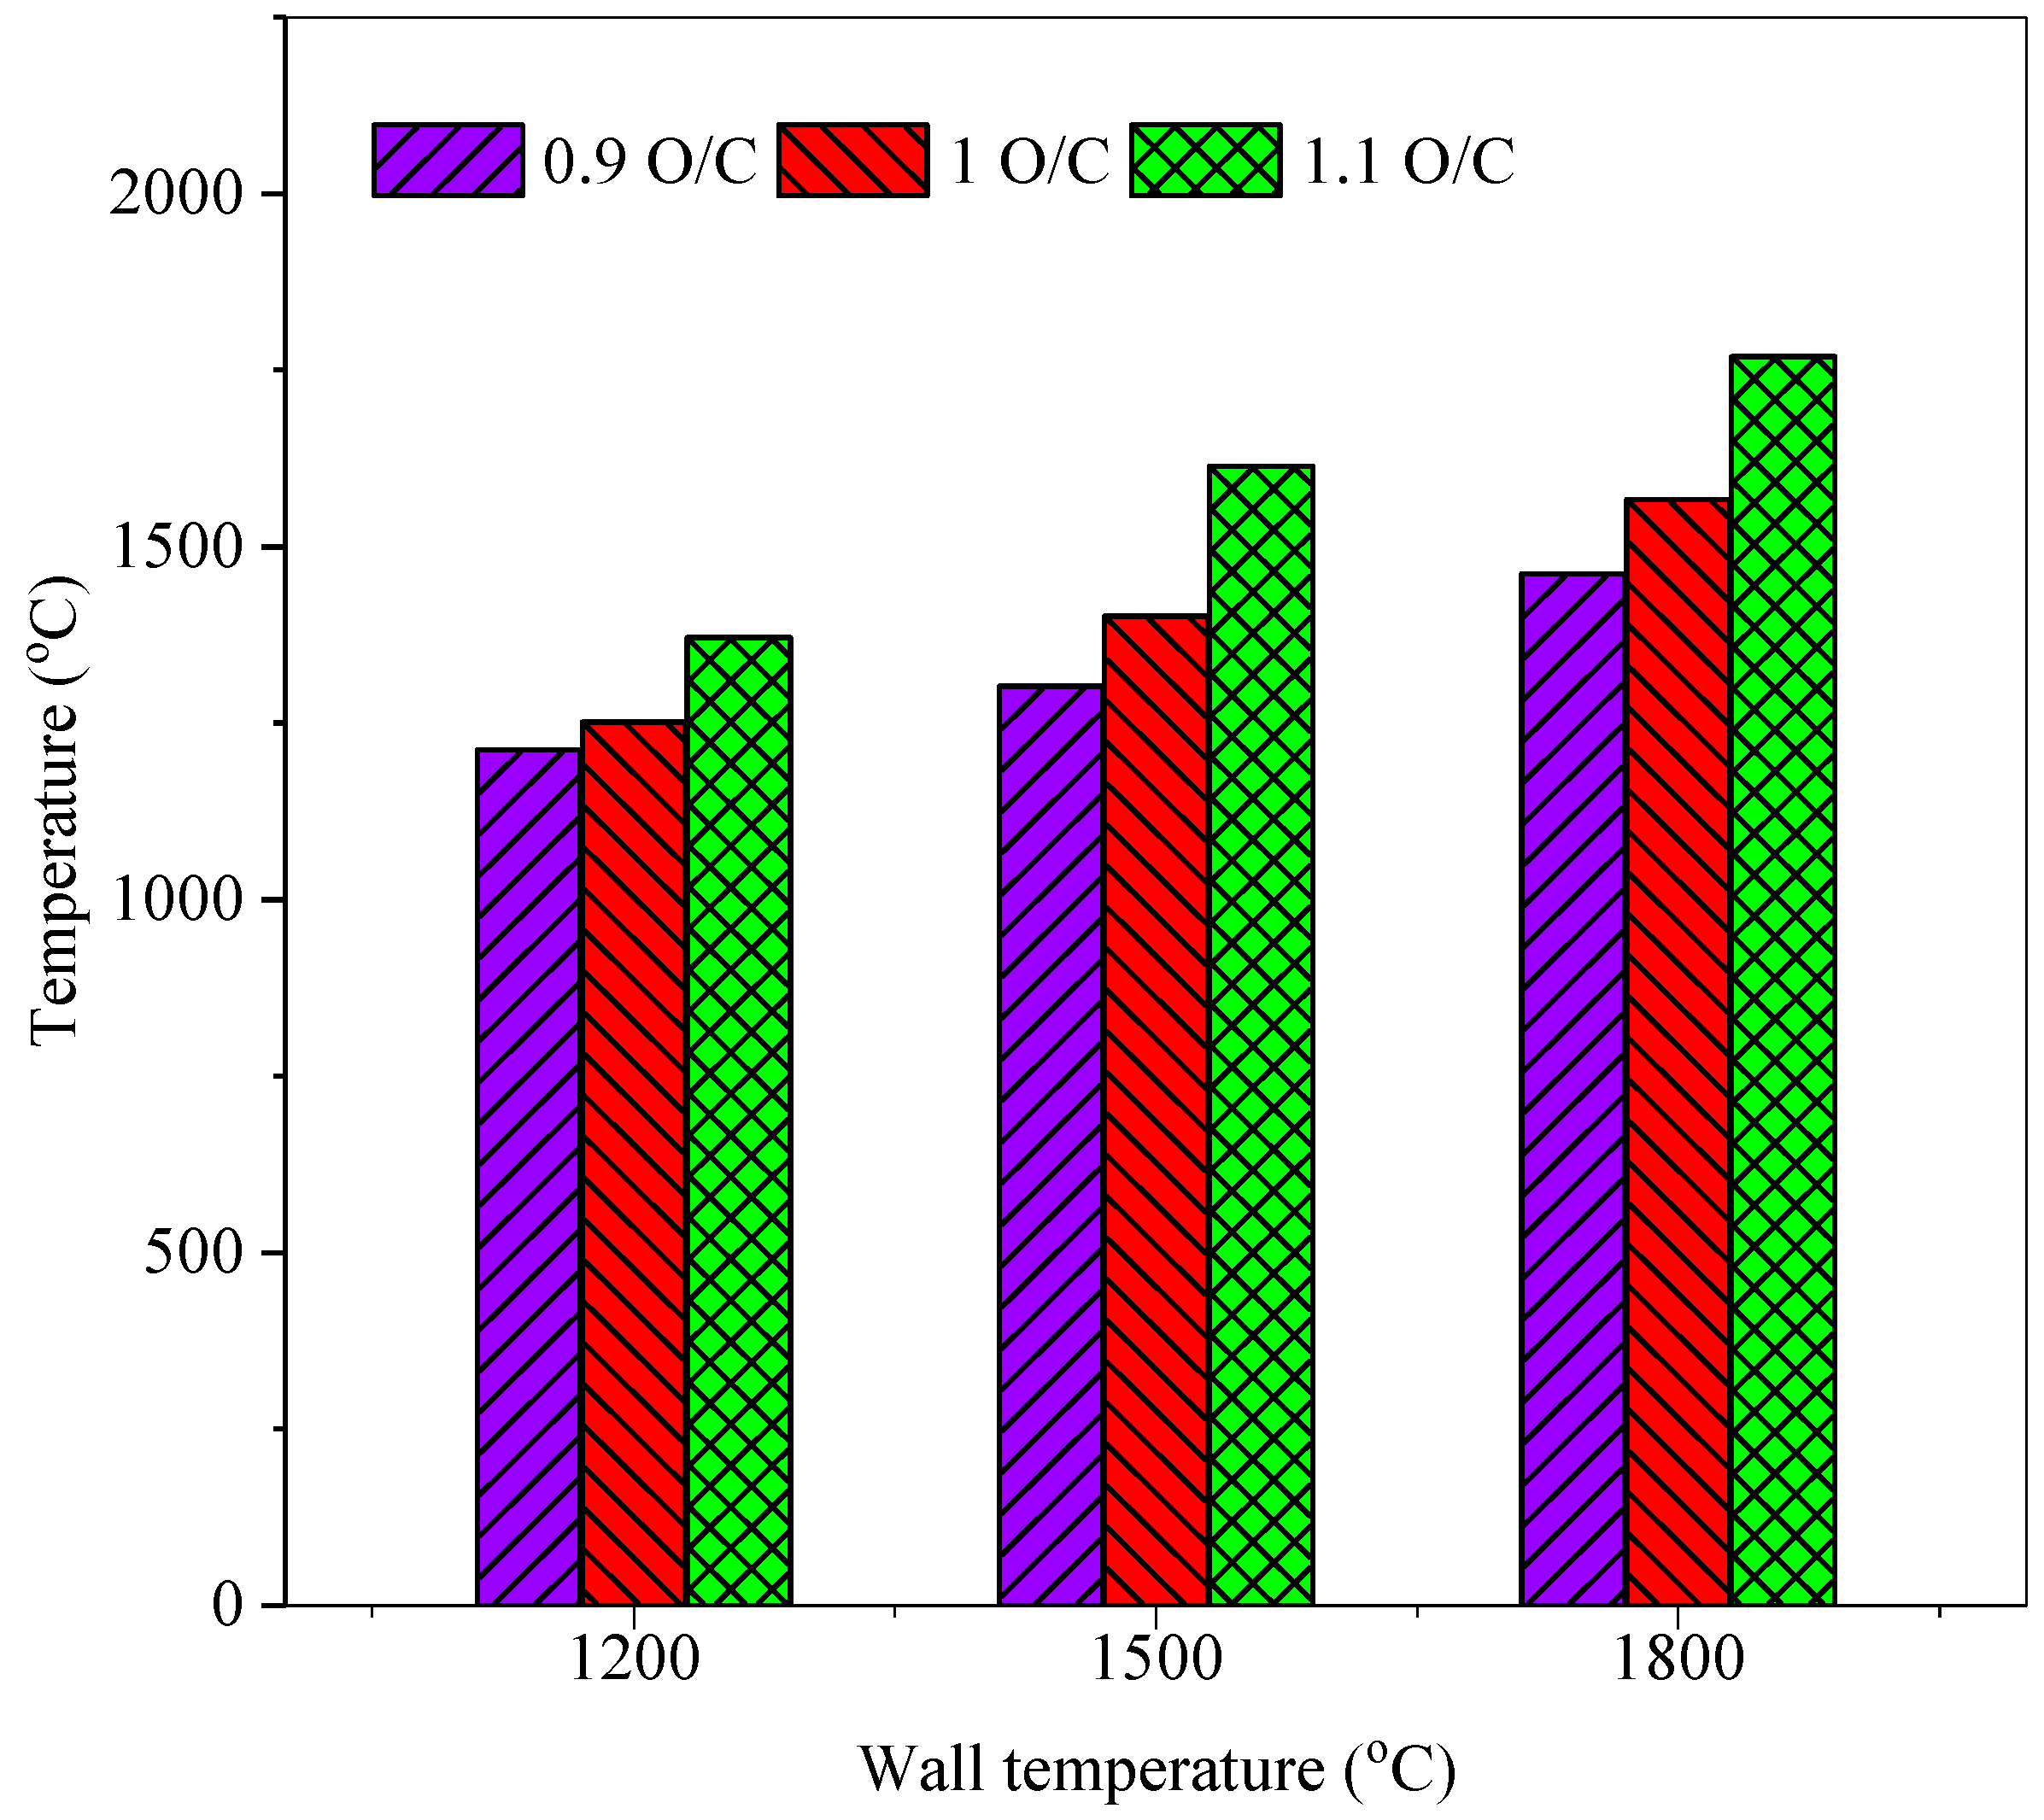
The temperature parameter was one of the critical parameters in the gasification/combustion reaction, and increasing the oxygen concentration also raised the temperature profile in an upper section of the gasifier. Figure 7 shows the temperature at the exit of the furnace; it is clearly shown that the temperature at the exit of the furnace increased as the wall temperature and O/C ratio increased. The maximum and minimum temperatures were found at 1770 °C and 1212 °C for cases 1 and 9, respectively. Further, Figure 8 shows the overall temperature profile in the upper part of the gasifier with increasing wall temperature and O/C. The maximum temperature of 2200 K was observed because a high oxygen concentration resulted in exothermic reactions in the upper part of the gasifier.
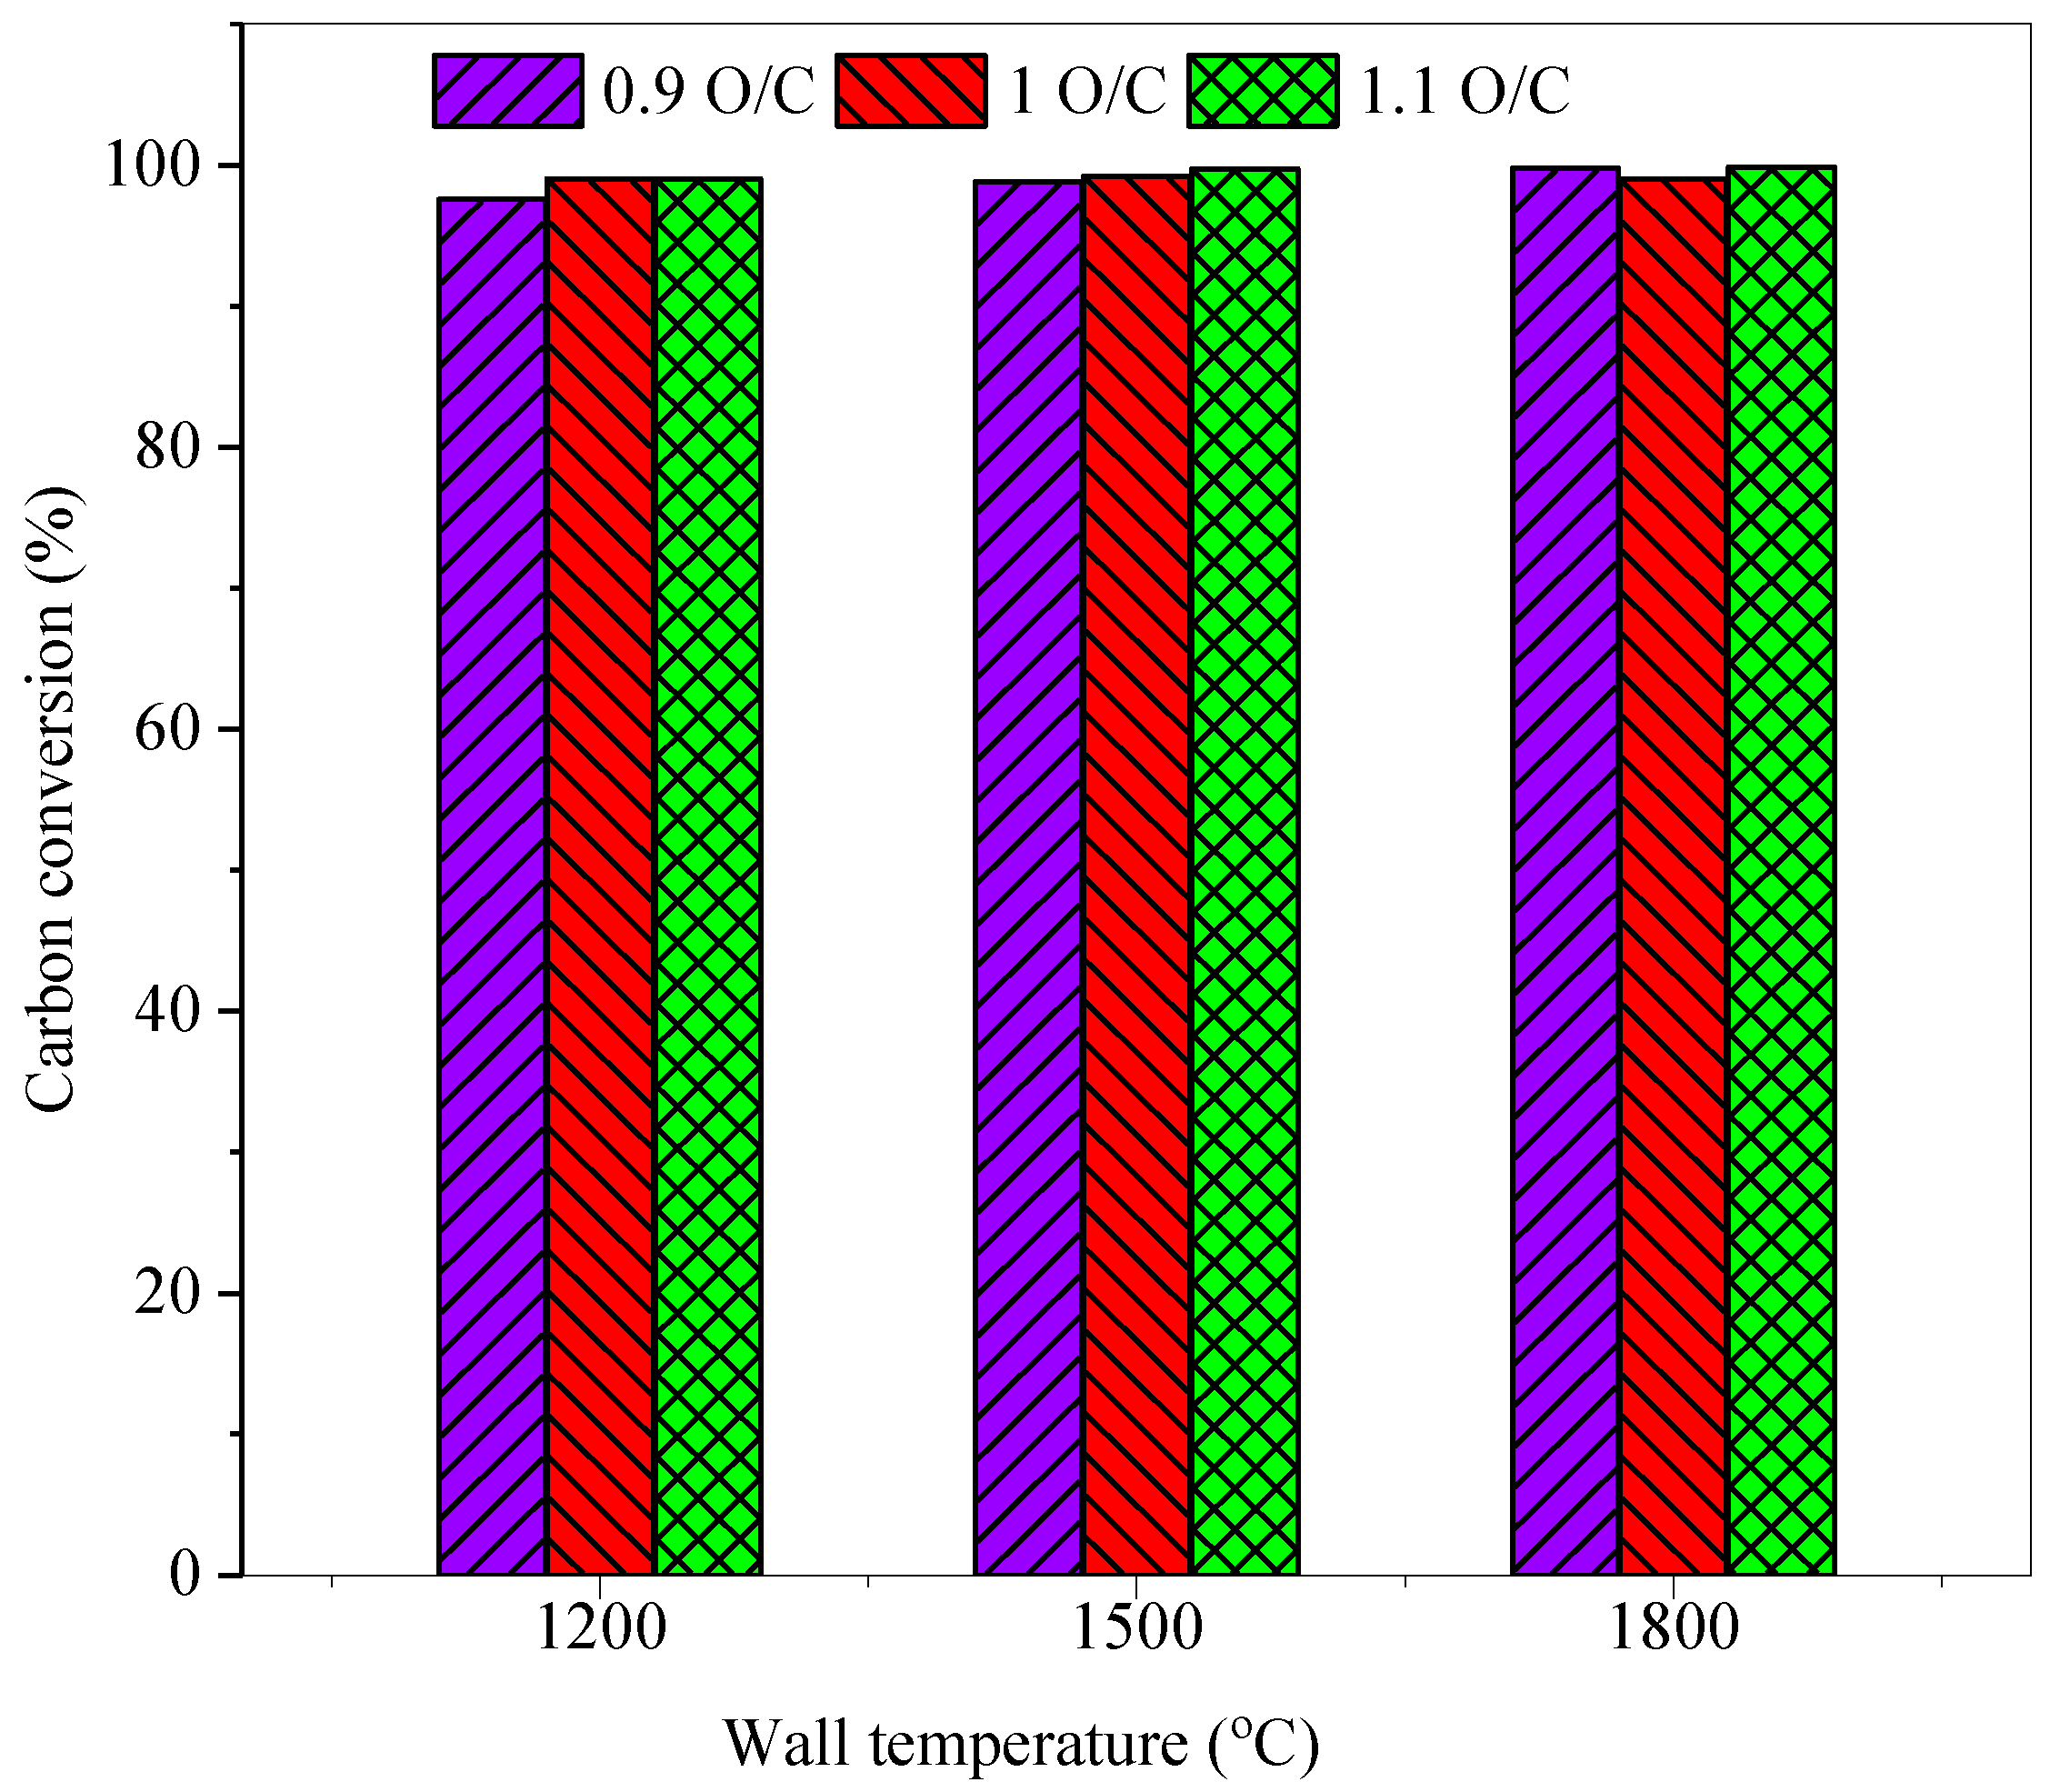
The overall variation in the carbon conversion rate shown in Figure 9 was between 97 and 99.8%. It is clear from Figure 9 that the carbon conversion increased with increased wall temperature and O/C ratio. The minimum and maximum carbon conversions were found to be 97.5% and 99.8% in case 1 and case 9, respectively.

3.5. Turbulent Intensity and Velocity Profile for Selected Cases

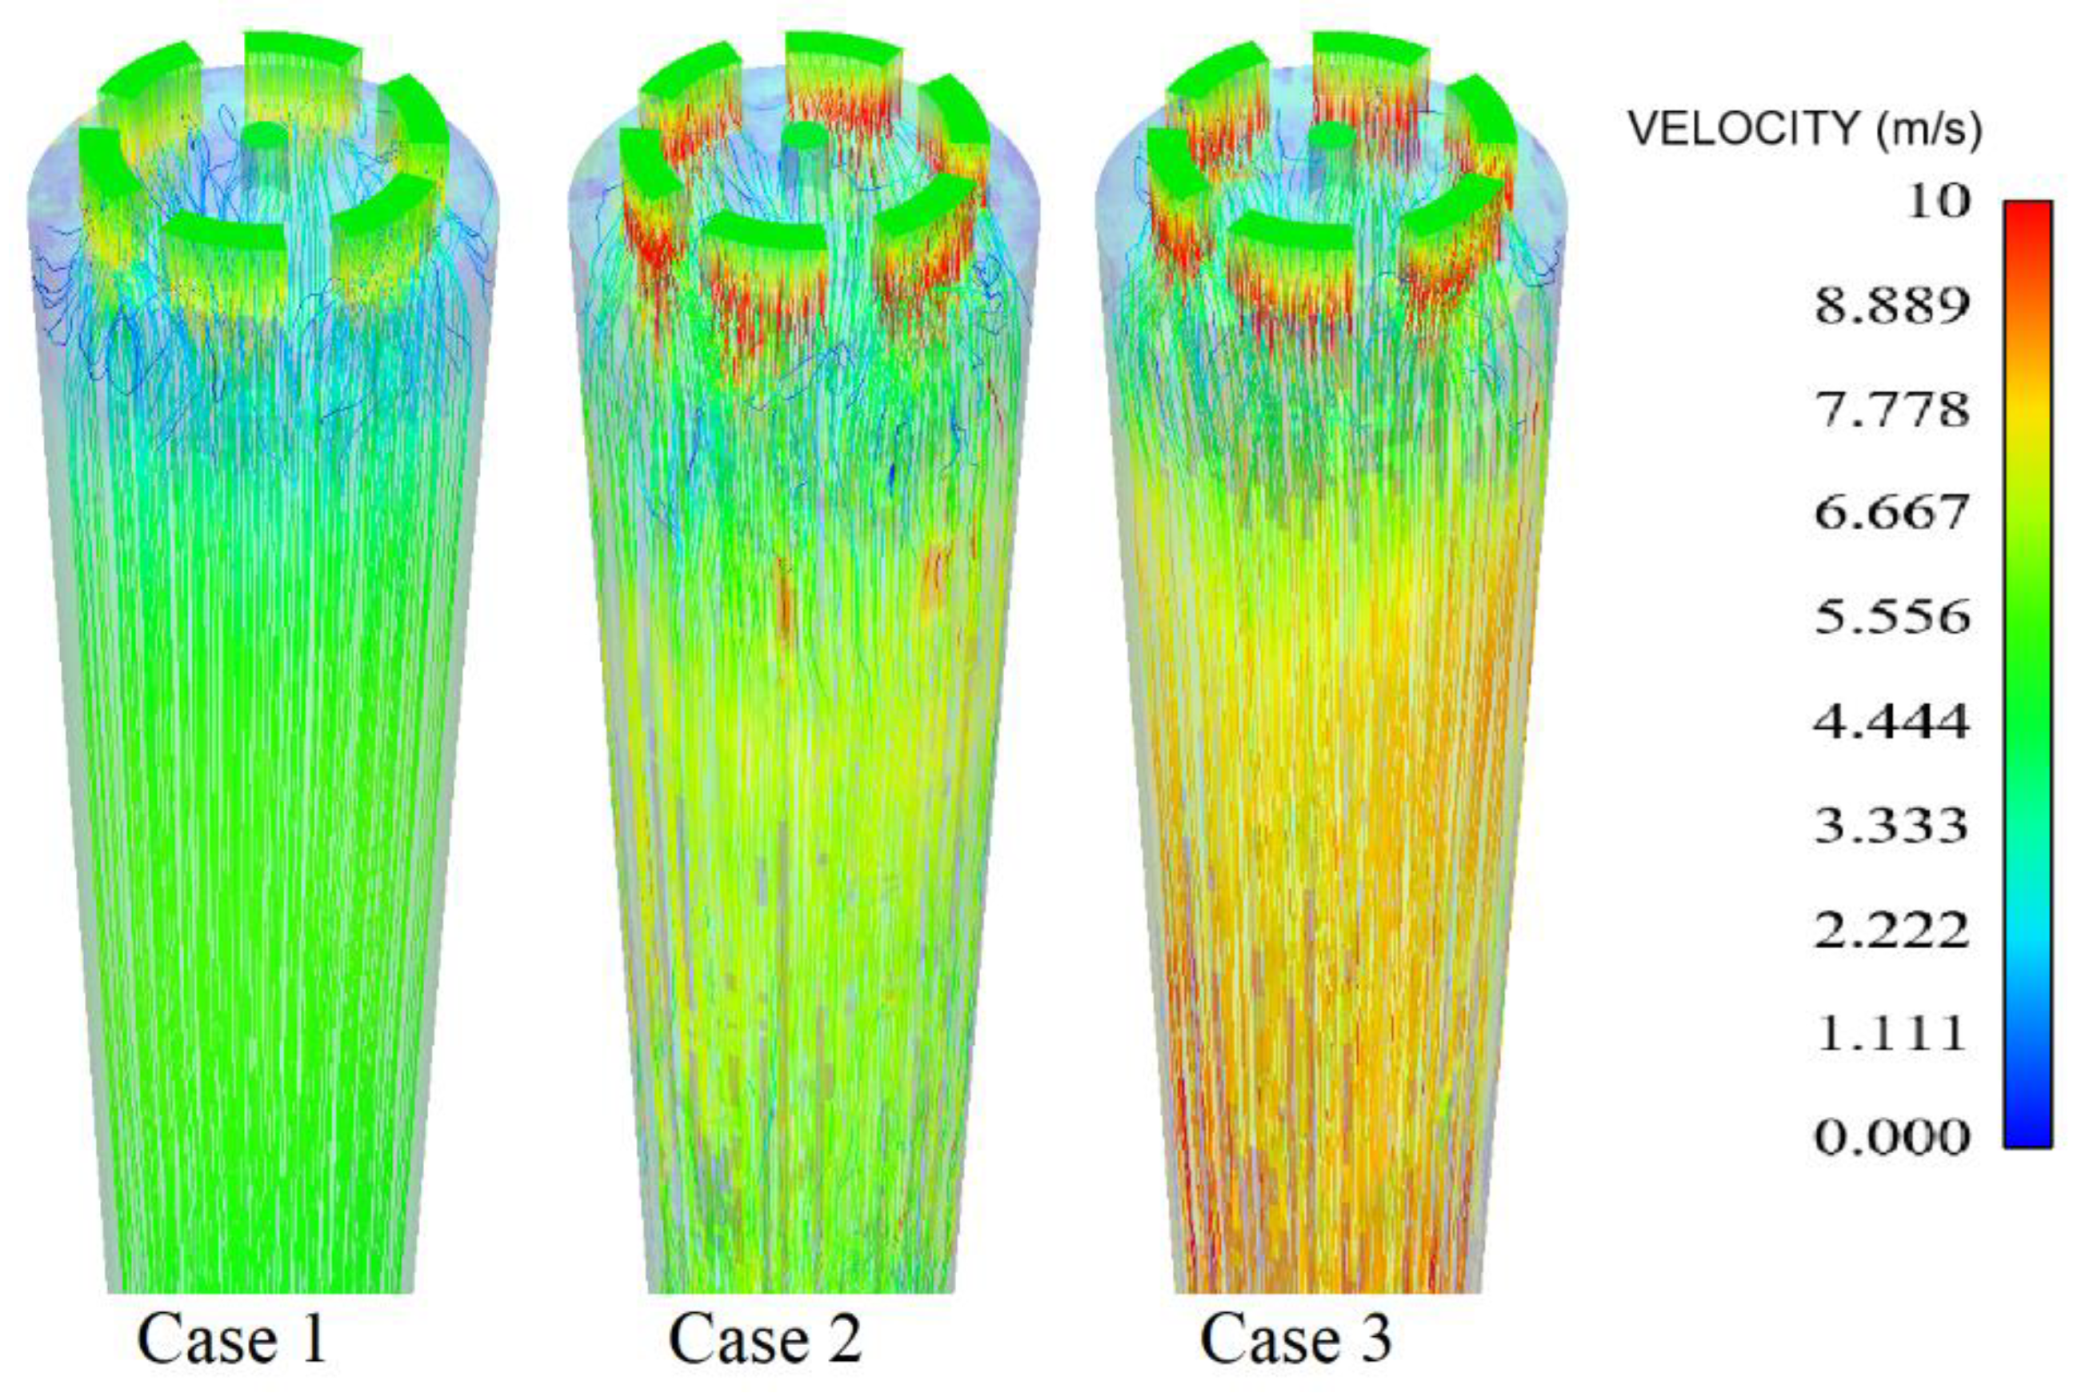
The effect of the turbulence intensity and velocity are shown in Figure 10 and Figure 11. The turbulence intensity was predicted by solving the equation of the reliable kε model from Equations (5)–(9). The upper part of the gasifier showed the maximum turbulent intensity range observed at 300–400% because the gasifier’s upper part was the main combustion reaction zone. Therefore, it was ensured that a higher mixing rate occurred in the upper part of the gasifier. Furthermore, Figure 11 shows a close view of the velocity profile. The velocity of the particle increased as the temperature and O/C ratio increased. The maximum velocity was observed at 10 m/s and the velocity increased as the height of the gasifier decreased.

4. Conclusions

The aim of this work was to investigate multiple factors for a drop tube coal gasifier. First, various preliminary reactions were simulated to validate the reaction model with experimental data. Furthermore, various cases were simulated at various O/C ratios and wall temperatures to analyze the syngas species, temperature profile in the whole gasifier, exit temperature, carbon conversion, turbulent intensity, and velocity profile. The syngas composition was the best parameter for a comparative study between the various reaction mechanisms and the experimental results. The maximum CO mol % was 70.51%, and the minimum CO was found in case D at 46.54%, but the CO mol % was 60.4% in the experimental results. Furthermore, the H2 mol % was higher in the experimental results at 31.39%, and the maximum mol % was found at 23.09% in case C among the simulated cases. Therefore, case C was selected for further simulations. The various O/C values and wall temperatures have a significant effect on reaction mechanisms. The maximum CO % was found to be 75.06%, with an oxygen/coal ratio of 0.9 at 1800 °C. The maximum H2 % was found at 1200 °C with an O/C ratio of 0.9, but the trend showed that increasing the wall temperature caused a reduction in the H2 mol %. The minimum and maximum carbon conversions were found to be 97.5% and 99.8% at an O/C of 0.9 at 1200 °C and an O/C of 1.1 at 1800 °C, respectively. The overall optimized results were found in case C in the preliminary reaction. Furthermore, the best syngas result was obtained in the sixth case. It can be concluded from the results that O/C and the wall temperature had a significant influence on the syngas composition.

Author Contributions

Methodology, Y.Z.; Software, Y.H.; Validation, K.C.; Writing—original draft, S.K.; Project administration, Z.W. All authors have read and agreed to the published version of the manuscript.

Funding

This work was supported by the National Natural Science Foundation of China (52125605) and the Fundamental Research Funds for the Central Universities (2021FZZX001-11).

Conflicts of Interest

The authors declare no conflict of interest.

Nomenclature

u, upVelocity, velocity of particles (m/s)
ρ, ρpDensity, density of particles (kg/m3)
Sm, Sj, Sh, SrSource terms for mass, momentum, energy, and species
cpSpecific heat at constant pressure (J/kg K)
τ i j Symmetric stress tensor
TTemperature (K)
λ Turbulent thermal conductivity (W/m K)
CjMole fraction of species j
DiDiffusivity (m2/s)
FDDrag force (kg m/s)
µDynamic viscosity (N S/m2)
ƙKinetic energy of turbulence (m2/s2)
εDissipation rate of turbulence (m2/s3)
µtTurbulence viscosity
CµViscosity constant
GƙMean velocity gradients
DtDiffusion coefficient for turbulence (m2/s)
PrtPrandtl number for turbulence
SctSchmidt number for turbulence
qrHeat flux for radiation heat (J/m2 s)
GIncident radiation
CCoefficient of function for linear anisotropic phase
αAbsorption coefficient
σsScattering coefficient (m−1)
σStefan–Boltzmann constant
ƐWEmissivity
Wj,rNet production rate of species i via chemical reactions (K mol/m3 S)
MjMolecular weight of species j
ʋj,rStoichiometric coefficient for product j in reaction r
ʋi,rStoichiometric coefficient for reactant i in reaction r
[C]Molar concentration of species (K mol/m3)
ηRate exponent for product species
ηRate exponent for product reactant species
ƙfForward reaction rate constant
APre-exponential factor (consistent units)
BTemperature constant (dimensionless)
EaActivation energy for reaction (J/K mol)

References

  1. Yamauchi, Y.; Akiyama, K. Innovative Zero-emission Coal Gasification Power Generation Project. Enrgy Proced 2013, 37, 6579–6586. [Google Scholar] [CrossRef] [Green Version]
  2. Wang, Q.; Li, R. Journey to burning half of global coal: Trajectory and drivers of China׳s coal use. Renew. Sustain. Energy Rev. 2016, 58, 341–346. [Google Scholar] [CrossRef]
  3. Taniguchi, M.; Yamamoto, K.; Kobayashi, H.; Kiyama, K. A reduced NOx reaction model for pulverized coal combustion under fuel-rich conditions. Fuel 2002, 81, 363–371. [Google Scholar] [CrossRef]
  4. Taniguchi, M.; Kamikawa, Y.; Okazaki, T.; Yamamoto, K.; Orita, H. A role of hydrocarbon reaction for NOx formation and reduction in fuel-rich pulverized coal combustion. Combust. Flame 2010, 157, 1456–1466. [Google Scholar] [CrossRef]
  5. Molina, A.; Murphy, J.J.; Winter, F.; Haynes, B.S.; Blevins, L.G.; Shaddix, C.R. Pathways for conversion of char nitrogen to nitric oxide during pulverized coal combustion. Combust. Flame 2009, 156, 574–587. [Google Scholar] [CrossRef]
  6. Ampah, J.D.; Jin, C.; Agyekum, E.B.; Afrane, S.; Geng, Z.; Adun, H.; Yusuf, A.A.; Liu, H.; Bamisile, O. Performance analysis and socio-enviro-economic feasibility study of a new hybrid energy system-based decarbonization approach for coal mine sites. Sci. Total Environ. 2023, 854, 158820. [Google Scholar] [CrossRef]
  7. Xu, S.; Ren, Y.; Wang, B.; Xu, Y.; Chen, L.; Wang, X.; Xiao, T. Development of a novel 2-stage entrained flow coal dry powder gasifier. Appl. Energy 2014, 113, 318–323. [Google Scholar] [CrossRef]
  8. Qin, S.; Chang, S.; Yao, Q. Modeling, thermodynamic and techno-economic analysis of coal-to-liquids process with different entrained flow coal gasifiers. Appl. Energy 2018, 229, 413–432. [Google Scholar] [CrossRef]
  9. Fletcher, D.F.; Haynes, B.S.; Christo, F.C.; Joseph, S.D. A CFD based combustion model of an entrained flow biomass gasifier. Appl. Math. Model. 2000, 24, 165–182. [Google Scholar] [CrossRef]
  10. Gharebaghi, M.; Irons, R.M.; Pourkashanian, M.; Williams, A. An investigation into a carbon burnout kinetic model for oxy–coal combustion. Fuel Process. Technol. 2011, 92, 2455–2464. [Google Scholar] [CrossRef]
  11. Jeong, H.J.; Seo, D.K.; Hwang, J. CFD modeling for coal size effect on coal gasification in a two-stage commercial entrained-bed gasifier with an improved char gasification model. Appl. Energy 2014, 123, 29–36. [Google Scholar] [CrossRef]
  12. Slezak, A.; Kuhlman, J.M.; Shadle, L.J.; Spenik, J.; Shi, S. CFD simulation of entrained-flow coal gasification: Coal particle density/sizefraction effects. Powder Technol. 2010, 203, 98–108. [Google Scholar] [CrossRef]
  13. Silaen, A.; Wang, T. Effect of turbulence and devolatilization models on coal gasification simulation in an entrained-flow gasifier. Int. J. Heat Mass Transf. 2010, 53, 2074–2091. [Google Scholar] [CrossRef]
  14. Gerun, L.; Paraschiv, M.; Vîjeu, R.; Bellettre, J.; Tazerout, M.; Gøbel, B.; Henriksen, U. Numerical investigation of the partial oxidation in a two-stage downdraft gasifier. Fuel 2008, 87, 1383–1393. [Google Scholar] [CrossRef]
  15. Du, S.H.; Yuan, S.Z.; Zhou, Q. Numerical investigation of co-gasification of coal and PET in a fluidized bed reactor. Renew. Energ 2021, 172, 424–439. [Google Scholar] [CrossRef]
  16. Kim, M.; Sohn, G.; Ye, I.; Ryu, C.; Kim, B.; Lee, J. Numerical analysis on the performance of a 300 MW IGCC coal gasifier under various operating conditions. Fuel 2019, 257, 116063. [Google Scholar] [CrossRef]
  17. Diba, M.F.; Karim, M.R.; Naser, J. CFD modelling of coal gasification in a fluidized bed with the effects of calcination under different operating conditions. Energy 2022, 239, 122284. [Google Scholar] [CrossRef]
  18. Fang, N.; Lu, Y.; Li, Z.Q.; Lu, Y.; Chen, Z.C. Improving mixing and gasification characteristics in an industrial-scale entrained flow gasifier with a novel burner. J. Clean Prod. 2022, 362, 132157. [Google Scholar] [CrossRef]
  19. Wang, B.; Qiu, J.Y.; Guo, Q.H.; Gong, Y.; Xu, J.L.; Yu, G.S. Numerical Simulations of Solidification Characteristics of Molten Slag Droplets in Radiant Syngas Coolers for Entrained-Flow Coal Gasification. Acs Omega 2021, 6, 20388–20397. [Google Scholar] [CrossRef]
  20. Vicente, W.; Ochoa, S.; Aguillón, J.; Barrios, E. An Eulerian model for the simulation of an entrained flow coal gasifier. Appl. Eng. 2003, 23, 1993–2008. [Google Scholar] [CrossRef]
  21. Álvarez, L.; Gharebaghi, M.; Jones, J.M.; Pourkashanian, M.; Williams, A.; Riaza, J.; Pevida, C.; Pis, J.J.; Rubiera, F. Numerical investigation of NO emissions from an entrained flow reactor under oxy-coal conditions. Fuel Process. Technol. 2012, 93, 53–64. [Google Scholar] [CrossRef]
  22. Choi, Y.C.; Li, X.Y.; Park, T.J.; Kim, J.H.; Lee, J.G. Numerical study on the coal gasification characteristics in an entrained flow coal gasifier. Fuel 2001, 80, 2193–2201. [Google Scholar] [CrossRef]
  23. Watanabe, H.; Otaka, M. Numerical simulation of coal gasification in entrained flow coal gasifier. Fuel 2006, 85, 1935–1943. [Google Scholar] [CrossRef]
  24. Ajilkumar, A.; Sundararajan, T.; Shet, U.S.P. Numerical modeling of a steam-assisted tubular coal gasifier. Int. J. Therm. Sci. 2009, 48, 308–321. [Google Scholar] [CrossRef]
  25. Huynh, C.V.; Kong, S.-C. Performance characteristics of a pilot-scale biomass gasifier using oxygen-enriched air and steam. Fuel 2013, 103, 987–996. [Google Scholar] [CrossRef]
  26. Hongtao, L.; Feng, C.; Xia, P.; Kai, Y.; Shuqin, L. Method of oxygen-enriched two-stage underground coal gasification. Min. Sci. Technol. 2011, 21, 191–196. [Google Scholar] [CrossRef]
  27. Silva, V.B.; Rouboa, A. Using a two-stage equilibrium model to simulate oxygen air enriched gasification of pine biomass residues. Fuel Process. Technol. 2013, 109, 111–117. [Google Scholar] [CrossRef]
  28. Kong, X.; Zhong, W.; Du, W.; Qian, F. Compartment modeling of coal gasification in an entrained flow gasifier: A study on the influence of operating conditions. Energy Convers. Manag. 2014, 82, 202–211. [Google Scholar] [CrossRef]
  29. Seo, H.-K.; Park, S.; Lee, J.; Kim, M.; Chung, S.-W.; Chung, J.-H.; Kim, K. Effects of operating factors in the coal gasification reaction. Korean J. Chem. Eng. 2011, 28, 1851. [Google Scholar] [CrossRef]
  30. Du, S.-W.; Chen, W.-H.; Lucas, J. Performances of pulverized coal injection in blowpipe and tuyere at various operational conditions. Energy Convers. Manag. 2007, 48, 2069–2076. [Google Scholar] [CrossRef]
  31. Singer, S.; Chen, L.; Ghoniem, A.F. The influence of gasification reactions on char consumption under oxy-combustion conditions: Effects of particle trajectory and conversion. Proc. Combust. Inst. 2013, 34, 3471–3478. [Google Scholar] [CrossRef]
  32. Chen, C.-J.; Hung, C.-I.; Chen, W.-H. Numerical investigation on performance of coal gasification under various injection patterns in an entrained flow gasifier. Appl. Energy 2012, 100, 218–228. [Google Scholar] [CrossRef]
  33. Unar, I.N.; Wang, L.J.; Pathan, A.G.; Mahar, R.B.; Li, R.D.; Uqaili, M.A. Numerical simulations for the coal/oxidant distribution effects between two-stages for multi opposite burners (MOB) gasifier. Energ Convers Manag. 2014, 86, 670–682. [Google Scholar] [CrossRef]
  34. Jones, W.P.; Launder, B.E. The prediction of laminarization with a two-equation model of turbulence. Int. J. Heat Mass Transf. 1972, 15, 301–314. [Google Scholar] [CrossRef]
  35. Launder, B.E.; Spalding, D.B. The numerical computation of turbulent flows. Comput. Methods Appl. Mech. Eng. 1974, 3, 269–289. [Google Scholar] [CrossRef]
  36. Gonzalo-Tirado, C.; Jiménez, S.; Ballester, J. Gasification of a pulverized sub-bituminous coal in CO2 at atmospheric pressure in an entrained flow reactor. Combust. Flame 2012, 159, 385–395. [Google Scholar] [CrossRef]
  37. Chen, W.-H.; Du, S.-W.; Yang, T.-H. Volatile release and particle formation characteristics of injected pulverized coal in blast furnaces. Energy Convers. Manag. 2007, 48, 2025–2033. [Google Scholar] [CrossRef]
  38. Wen, C.Y.; Chaung, T.Z. Entrainment coal gasification modeling. Ind. Eng. Chem. Process Des. Dev. 1979, 18, 684–695. [Google Scholar] [CrossRef]
  39. Wang, L.; Jia, Y.; Kumar, S.; Li, R.; Mahar, R.B.; Ali, M.; Unar, I.N.; Sultan, U.; Memon, K. Numerical analysis on the influential factors of coal gasification performance in two-stage entrained flow gasifier. Appl. Therm. Eng. 2017, 112, 1601–1611. [Google Scholar] [CrossRef]
  40. Chui, E.H.; Majeski, A.J.; Lu, D.Y.; Hughes, R.; Gao, H.; McCalden, D.J.; Anthony, E.J. Simulation of entrained flow coal gasification. Energy Procedia 2009, 1, 503–509. [Google Scholar] [CrossRef]
  41. Ubhayakar, S.K.; Stickler, D.B.; Von Rosenberg, C.W.; Gannon, R.E. Rapid devolatilization of pulverized coal in hot combustion gases. Symp. (Int.) Combust. 1977, 16, 427–436. [Google Scholar] [CrossRef]
Figure 1. Schematic diagram of the drop tube gasifier.
Energies 15 08645 g001
Figure 2. The schematic diagram for the meshed geometry shows a closer view of the inlet and outlet injection.
Energies 15 08645 g002
Figure 3. Temperature (K) distribution w.r.t height (m) for the grid sensitivity analysis (four grid sizes).
Energies 15 08645 g003
Figure 4. Temperature profiles of the furnace along with a closer view: (a) temperature profile for simulation and (b) temperature profile for experimental gasifier at different heights as a function of time (min).
Energies 15 08645 g004
Figure 5. The evaluation of various preliminary reaction results for H2, CO2, and CO mol percentages in coal at O/C = 1.
Energies 15 08645 g005
Figure 6. Influence of the wall temperature on the coal gas composition (a) at O/C = 0.9, (b) at O/C = 1, and (c) at O/C = 1.1.
Energies 15 08645 g006
Figure 7. Syngas temperature for numerous cases at the exit of the furnace.
Energies 15 08645 g007
Figure 8. Syngas temperature for various cases at the exit of the gasifier.
Energies 15 08645 g008
Figure 9. Carbon conversion for various cases.
Energies 15 08645 g009
Figure 10. Turbulent intensity for selected cases.
Energies 15 08645 g010
Figure 11. Velocity profile for selected cases.
Energies 15 08645 g011
Table 1. Proximate and ultimate analyses of coal samples.
Proximate Analysis (% ad)Qnet,ad (J/g)Ultimate Analysis (% ad)
MAVFC CHNSO
13.8410.3028.7747.0924,23762.033.270.700.379.49
Note: FC, fixed carbon; M, moisture content; ad, air-dry basis; V, volatile content; A, ash content; Qnet,ad, lower heating value.
Table 2. The kinetic factors for combustion/gasification and devolatilization reactions.
Devolatization
Yh 1
Yl 0.3
kh (s−1) 1.3 × 10⁷
kl (s−1) 2 × 10⁵
Eh (kJ mol−1) 167.4
El (kJ mol−1) 104.6
Gasification or Combustion ReactionsABEa (J Kmol−1)
Solid–Gas Phase (Heterogeneous Reactions)
C(s) + CO2 → 2CO24202.75 × 108
C(s) + 0.5O2 → CO0.05206.1 × 107
C(s) + O2 → CO20.00207.9 × 107
C(s) + H2O → CO + H242603.16 × 108
Gas Phase (Homogeneous Reaction)
H2 + 0.5O2 → H2O6.8 × 101501.68 × 108
CO + H2O ↔ CO2 + H2 (1) f2.75 × 101008.38 × 107
b2.65 × 10−203.96 × 10³
CO + 0.5O2 → CO22.239 × 101201.7 × 108
C1.37H4.58O0.44 (volatile) + 2.29O2 → 1.37CO2 + 2.29H2O (2)2.119 × 101102.119 × 1011
C1.37H4.58O0.44 (volatile) + 1.61O2 → 1.37CO + 2.29H2O(3)2.119 × 101102.027 × 108
Note: 1—WGS reaction, 2—volatile complete combustion, 3—volatile partial combustion.
Table 3. Numerous preliminary models for the evaluation of the best reaction.
ReactionSimulation Cases
ABCDEF
H2 + 0.5O2 → H2O (1)γγγγγγ
CO + H2O ↔ CO2 + H2 (2)γγγγγγ
C(s) + O2 → CO2 (3) γγγ
C(s) + 0.5O2 → CO (4)γγγ γ
C(s) + O2 → CO2 (5)γ
C(s) + H2O → CO + H2 (6)γγγγγγ
C(s) + CO2 → 2CO (7)γγγγγγ
Vol + 1.61O2 → 1.37CO + 2.29H2O (8) γ γ
Vol + 2.29O2 → 1.37CO2 + 2.29H2O (9) γγ γγ
Reactions: 1—combustion; 2—water gas shift reaction; 3—char complete combustion; 4—char partial combustion; 5—CO combustion; 6—gasification; 7—gasification, Boudouard reaction; 8—volatile partial combustion; 9—volatile complete combustion.
Table 4. Simulation case for various oxygen/coal ratios and wall temperatures.
CaseO/Coal RatioWall Temperature (K)
10.91200
20.91500
30.91800
411200
511500
611800
71.11200
81.11500
91.11800
Publisher’s Note: MDPI stays neutral with regard to jurisdictional claims in published maps and institutional affiliations.