Article

Analysis of the Exhaust Emissions of Hybrid Vehicles for the Current and Future RDE Driving Cycle

Faculty of Civil and Transport Engineering, Poznan University of Technology, Pl. M. Sklodowskiej-Curie 5, 60-965 Poznan, Poland
*
Author to whom correspondence should be addressed.
Energies 2022, 15(22), 8691; https://doi.org/10.3390/en15228691
Submission received: 14 October 2022 / Revised: 14 November 2022 / Accepted: 15 November 2022 / Published: 19 November 2022
(This article belongs to the Special Issue Combustion Engine In-Cylinder Flow)

Abstract

:
Hybrid vehicles account for the largest share of new motor vehicle sales in Europe. These are vehicles that are expected to bridge the technological gap between vehicles with internal combustion engines and electric vehicles. Such a solution also makes it possible to meet the limits of motor vehicle emissions, at a time when it is particularly important to test them under actual traffic conditions. This article analyzes the impact of the length of the test routes in relation to current, but also future regulations of approval standards. Three routes of post-phase composition (urban, rural, motorway) with lengths of about 30, 16 and 8 km were selected for the study. Measurements of the main emission components were made using portable emission measurement systems (PEMS), and exhaust emissions were determined using the moving average window (MAW) method. Analysis of the obtained results led to the conclusion that the current requirements for the RDE test (in particular, the duration of the test) enforce a length of each part of 32 km. Reducing the test to 60–90 min causes the individual phases to last 16 km, and the main advantage of such a solution is the very strong influence of the cold start phase on the emission results in the urban phase. Future declarations by lawmakers to drastically reduce the length of the test phases to 8 km will force hybrid vehicles to be tested largely using the internal combustion engine. This will be the right thing to do, especially in the urban phase, as now in addition to a significant reduction in the engine warm-up phase, manufacturers will have to take into account that such an engine thermal condition can also occur in the rural phase.

1. Introduction

The deteriorating state of the environment is negatively affecting the health of the population. The World Health Organization (WHO) has been issuing air quality guidelines for human health since 1987 [1]. In a 2021 report, the same organization provided guidelines on the serious human risk from particulate matter and nitrogen oxides [2]. In addition, the European Commission, in a report issued by the Joint Research Centre (JRC) [3], states that it is targeted to reduce air pollution by 2030, resulting in a 55% reduction in premature deaths. Meanwhile, by 2050, a plan has been undertaken to reduce, among other things, air pollution to levels that are no longer considered exhaustive to health [4].
With regard to automotive transportation, European Union legislation for 2021–2025 has reduced CO2 emissions to 95 g/km for new vehicles [5,6]. This limit is planned to be reduced by 15% from 2025 and by 37.5% from 2030 [7]. In order to reduce vehicle emissions, the Euro 6 standard was introduced starting in 2019 [8,9], and the homologation test NEDC (New European Driving Cycle) [10] was replaced by the WLTC (Worldwide harmonized Light-duty vehicles Test Cycle) [11]. The WLTC test was intended to more reliably replicate real-world conditions for passenger cars. However, this change did not reduce the differences in emission results obtained in homologation tests and road traffic. An example of this is the higher emission values for nitrogen oxides, particulate matter and carbon monoxide for diesel-powered vehicles [12,13,14,15]. This is primarily due to road conditions, road behavior, environmental conditions and the contribution of the different phases of the route [16,17]. To take into account the differences between type approval tests and road conditions, a procedure for testing under real driving emissions (RDE) has been introduced since 2017. Limit values were based on the conformity factor (CF) [18], which for NOx was 1.5 (Euro 6d-temp) [19], and in the next standard (Euro 6d) is CFNOx = 1.43 and CFPN = 1.5 [20]. At a meeting on July 5, 2022, the European Commission’s Technical Committee on Motor Vehicles (TCMV) approved amendments to Regulation (EU) 2017/1151 [11] regarding type approval of motor vehicles with respect to emissions from passenger cars [21]. A new Euro 6e step will be added effective September 2023 that introduces revisions to the RDE test procedure. The new regulation redefines conformity factors. The values are reduced in line with the 2021 JRC report on conformity factors [22]. The Euro 6e step includes a revised CFNOx = 1.10 (down from 1.43) and a reduced CFPN = 1.43 (down from 1.5). This is in response to the repeated addressing of the topic of the need to reduce conformity factors by various authors [23,24] and organizations [25,26].

2. Literature Review

The reduction in vehicle emissions observed in recent years is of interest to a great many researchers. Some analyze engine design changes (e.g., for diesel engines [27]) and, based on this, predict percentage changes in vehicle emissions (e.g., [28,29]). Other authors, e.g., Winkler et al. [30], ask the question: to what level can exhaust emissions be reduced? The authors conclude that reducing emissions from sources other than transportation, such as power generation, home heating, offroad equipment, etc., will have a greater impact on air quality than reducing vehicle emissions.
Motor vehicle emissions tests have been carried out in various countries using a variety of equipment. They were performed under different atmospheric conditions and at the same time on different test routes. Determination of the final values of exhaust emissions also took place variously: some authors used the direct method (emission = mass/distance), and others used the MAW (moving averaging window) method [31]. Examples of tests of vehicles in real traffic conditions by various authors dealing with this topic using the PEMS apparatus will be given below. At the same time, at the end of these considerations, a tabular summary has been made with reference to the legal requirements of RDE testing regulations.
Wang et al. [32] tested 39 vehicles (18—emission class China-5, 21—emission class China-6, including 6 hybrid vehicles), mainly in terms of exhaust emissions depending on the dynamic conditions of the tests (RPA and 95th percentile of the product of speed and positive acceleration). Calculations were made using the MAW algorithm, and the conformity factor results obtained for nitrogen oxide emissions and particle number (CF < 2.1) demonstrate that the environmental requirements of the tested vehicles were met. A proportional correlation was found between on-road NOx and PN emissions and relative positive acceleration and the 95th percentile of the product of speed and positive acceleration.
Suarez-Bertoa et al. [33] tested 19 vehicles for emissions with different powertrains (diesel, gasoline and compressed natural gas) on four test routes (Italy), and only two of them were RDE-compliant. In conclusion, the authors found that diesel vehicles (Euro 6d-temp) showed significantly lower NOx emissions than earlier diesel vehicles (Euro 6) in RDE-compliant tests and in some non-RDE compliant tests. It was noted that the significantly higher emission values in dynamic tests (also for gasoline engines) indicate that there is potential for reduction.
In the study by Prati et al. [34], the test object was a hybrid vehicle (with a gasoline engine), in which exhaust emissions and electricity consumption were studied under real traffic conditions (Italy). The tests were conducted for different degrees of battery charge and with air conditioning on and off (five combinations, repeated twice). Two test routes were used (RDE-compliant and urban route only). Only half of the tests during the test met the requirements relating to the dynamic conditions of the test (95th percentile of speed per positive acceleration). It was found that depending on the degree of battery charge (SOC = 15–80%), maximum differences in exhaust emissions and energy consumption values ranging from 35% to 40% are obtained. Switching on air conditioning results in increased fuel consumption in hybrid mode (by 28%).
Pignatta and Balazadeh [35] used six cars (Euro 4) on four test routes in their study under real traffic conditions. However, it seems that the results obtained apply only to the characteristics of the test routes selected by the authors. The routes of 2.2 and 6.9 km do not allow for comparing the results of exhaust emissions, and at the same time, the authors compared only the period of hot engine operation. The obtained results and their scatter on different routes in the case of nitrogen oxide emissions was as much as 300%, and the measurement accuracy was ±30% of the obtained values.
A study by Sarkan et al. [36] confirms increased exhaust emissions in older vehicles (Euro 4), while also indicating significantly higher NOx emissions when switching from gasoline to LPG (liquefied petroleum gas) power systems. The results reported by the authors show a more than three-fold increase in NOx emissions in the RDE test when running on LPG. On-road emissions of other exhaust components were similar when running on gasoline and LPG.
Valverde et al. [37] performed on-road emissions tests in real traffic conditions of 11 cars (gasoline, diesel) on 22 RDE-compliant routes and 41 non-RDE-compliant routes. The NOx and PN road emission results obtained were similar to each other (with an error of 10%) regardless of the type of drive and road test. However, considering only the cold start of the engine highlights the large discrepancies: for the diesel engine, the particulate number variation is a range of 2 × 10⁹–5 × 10¹¹ #/km, and the NOx variation range is 400–650 mg/km. For a gasoline-powered engine under an RDE test that takes into account a cold start, the PN variability range is 5 × 10¹²–10 × 1012 #/km, and NOx is 20–80 mg/km. The highest values are for the non-RDE-compliant tests; however, the authors do not provide details of these tests.
Gebisa et al. [38], in a review article, identified the main factors that affect the inaccuracy of developed tests in real traffic conditions. They analyzed data from dozens of authors on emission tests in various laboratory and road tests. They found that the main factors influencing the significant differences in emissions between the results in the WLTC test and those obtained in real-world conditions were:
  • characteristics of local research routes;
  • small sample of research data collected from a small population of cars;
  • too little difference between the different phases of the research route.
In most cases, emission values in road tests exceeded those obtained on the chassis dynamometer, and the main factors identified were:
  • low ambient temperature;
  • varied slope of the road;
  • similarity of phase contribution in the test;
  • diverse dynamic conditions;
  • using other computational algorithms (MAW, raw data);
  • measurement uncertainty of the instruments used (drift of the analyzer over time and exhaust flow rate).
In the report “Real Driving Emission and Fuel Consumption”, Winther et al. [39] describes vehicle emission tests performed between 2010 and 2019 on a group of several hundred passenger cars (powered by different fuels). The studies were performed under laboratory conditions in research tests, but also, comparatively, under actual traffic conditions. The conclusion of the article is that the key is the correct choice of a research test that reflects real driving behavior. The test route in real traffic conditions should be designed to reflect the actual behavior of the vehicle. Emission tests conducted under real-world conditions help ensure that vehicles are in line with target assumptions throughout the range of operation.
Giechaskiel et al. [25] points out that new cars in RDE tests meet emission requirements; however, under conditions that differ little from those required, they can emit significantly more exhaust compounds. This is especially true for cold starts at low ambient temperatures, especially in urban conditions. Lowering the outside temperature in a short RDE test results in a 50% increase in NOx emissions, a two-fold increase in CO emissions, and a ten-fold increase in NMHC (non-methane hydrocarbons) emissions. Ehrenberger et al. [40] dealt with a similar topic by testing a hybrid-powered vehicle at different ambient temperatures in RDE and WLTC tests. He found that on-road CO emissions at −7 °C were two to three times higher in the WLTC test relative to 23 °C. NOx emissions at low ambient temperatures are two times higher, and particle number emissions are about four times higher. The results reported are for a vehicle with SOC = 100%, while for SOC = 0%, the results were comparable (only for CO die they differ by five times). The authors indirectly inferred the changes in exhaust emissions with respect to the RDE tests, since they adopted the principle of comparison between WLTC tests (23 and −7 °C), assuming the similarity of changes in the RDE tests, which were performed only at 23 °C.
Lujan et al. [41] used the RDE procedure to test engines on a dynamic engine dynamometer. They generated six RDE tests (with different vehicle-equivalent assumptions) as required, which differed in dynamic conditions. The largest differences were observed in nitrogen oxide emissions: 17% in the urban phase, 31% in the rural phase and 27% in the motorway phase. The study shows that the differences for the single test facility used in the research tests (which meet RDE requirements) can vary by several tens of percent.
Some researchers use the RDE procedure only to compare the emission results obtained, without enforcing the acceptable dynamic conditions of such measurements. Such a situation occurs in the case of multi-vehicle comparison, such as in NEDC tests and on-road conditions with equal fuels. In the study by the team of Lejda et al. [42], there is no reference to any RDE procedure, which is probably due to the testing of a vehicle with an emission class of Euro 3. However, the conditions for the division of the test route are included, and it is questionable that the test phases are not clearly separated into urban, rural and motorway.
Suarez-Berota et al. [43] used the RDE procedure to analyze unregulated exhaust pollutants such as NH3, N2O and CH4. The test subjects were gasoline-, diesel- and CNG-powered vehicles. Increased NH3 emissions were shown especially from CNG (62–66 mg/km) and gasoline (23–48 mg/km) vehicles; for a diesel vehicle, the value was 2–17 mg/km. N2O emissions were observed only in diesel vehicles and were 5–27 mg/km.
Future developments regarding RDE test execution procedures [28] can be summarized as follows (using on the basis of a short literature review—Table 1):
  • introduction of limits for other pollutants (NH3, N2O, CH4, PN D < 23 nm) [43];
  • use of RDE route generators (locally), enabling greater discretization of vehicle operating conditions [44];
  • short urban driving limits [45];
  • reduced conformity factor for all compounds [46];
  • reducing the conformity factor for NOx to a value of 1.1 [22];
  • inclusion of the cold start phase of the engine in the emission limits [14,47];
  • the vehicle should be zero or near zero emissions in urban areas, and this should be guaranteed via a combination of RDE and OBD [9];
  • the ability to compare fuel and energy consumption for conventional, hybrid and electric vehicles [48,49,50];
  • inclusion of the first engine start in the motorway phase for vehicles PHEV;
  • developing the RDE+ concept (a virtual tool combining environmental conditions, test equipment and the ability to test a vehicle under dynamometer conditions) [44].
Table 1. Characteristics of research routes used in the research of various authors.
ReferencesVehicleEuro ClassTestDistance(km)Time (min)UrbanRuralMotorway
(km)(%)(km)(%)(km)(%)
Lejda et al. [42]gasoline, CNGEuro 3Non-RDE32.939.91133.410.130.711.835.8
Šarkan et al. [36]gasoline, LPGEuro 4RDE69.49521.53126.53821.431
Pignatta et al. [35]gasolineEuro 4Urban2.24.72.2
Du et al. [47]gasolineEuro 4RDE75.4 24.632.624.432.426.435
Akard et al. [51]gasolineEuro 4Non-RDE37.4–39.9
Bodisco and Zare [52]gasolineEuro 6RDE88.6 26.830.325.128.336.741.4
Kadijk et al. [53]dieselEuro 5bRDE71.9105.6
dieselEuro 6RDE70.3–75.296.6–108.1
dieselEuro 6bRDE69.1–69.893.6–107.6
Yang et al. [17]gasoline, dieselEuro 6bNon-RDE59.6 19.13222.729.317.729.7
Winther et al. [39]gasoline, dieselEuro 6bRDE84.79632.939323819.823
dieselEuro 6RDE85 42 31 27
dieselEuro 6City40 90 10
dieselEuro 6Motorway104 17 53 30
diesel, gasolineEuro 6RDE9090–120
gasoline, hybridEuro 6RDE96101 34.5 35.5 30
gasoline, hybridEuro 6Non-RDE3841 35.7 34.2 30
Ziółkowski et al. [10]hybridEuro 6cRDE70.39129.742.517.724.922.932.6
Prati et al. [34]plug-in hybridEuro 6RDE57.9–66.492.2–105.519.1–22.430.7–36.219.2–21.930.5–35.517.8–22.929.3–38.7
plug-in hybridEuro 6Urban25.1–26.777.7–85.225.1–26.7100
Sokolnicka et al. [54]gasolineEuro 6RDE79.2109.634.2 19.5 25.5
Suarez-Bertoa et al. [24]gasoline, dieselEuro 6b–Euro 6d -tempRDE79–9498–11232–37 25–27 22–30
Giechaskiel et al. [25]gasolineEuro 6d -temp-EvapRDE96–99111–11426.5–27.823.8–24.3
gasolineEuro 6d -temp-EvapRDE short506012.825.6
gasolineEuro 6d -temp-EvapRDE10011838.538.5
Suarez-Berota et al. [42]gasoline, diesel, CNGEuro 6–Euro 6d -tempRDE79–10494–11431–41 25–29 23–34
Suarez-Bertoa et al. [33]gasoline, diesel, CNGEuro 6–Euro 6d -tempRDE79–9498–11232–3733–4025–2729–3222–3028–32
gasoline, diesel, CNGEuro 6–Euro 6d -tempNon-RDE79–9494–10431–3436–3925–2827–3223–3229–34
gasoline, diesel, CNGEuro 6–Euro 6d -tempMotorway139136443218138058
gasoline, diesel, CNGEuro 6–Euro 6d -tempHill6110661100
Luján et al. [40]dieselEuro 6RDE
(engine test bench)
90.9–94.9 21.6–25.932.9–36.422.3–27.933.9–39.217.4–20.539.2–37.0
Selleri et al. [55]dieselEuro 6d-ISCRDE91.110335.53929.13226.529
dieselEuro 6d-ISCMotorway187.711715.0818.19.6154.682.4
dieselEuro 6d-ISCCity129.211633.926.212.59.682.964.2
Soo Yu et al. [56]dieselEuro 6d -tempRDE73.9103.126.536.019.726.827.437.2
Pielecha et al. [50]gasolineEuro 6d -tempRDE99.7–100.2101.7–105.332.1–35.432.0–34.831.9–34.632.0–34.633.1–33.332.5–33.4
hybridEuro 6d -tempRDE96.6–97.4101.3–109.231.2–33.932.3–34.930.8–32.131.6–33.232.3–34.433.3–35.3
electricEuro 6d -tempRDE96.1–98.5103.3–10632.4–34.533.7–35.031.2–31.431.7–32.732.2–32.833.3–33.6
Skobiej and Pielecha [49]plug-in hybridEuro 6d -tempRDE91.9–97.4104.5–107.832.2–33.733.1–36.725.6–31.627.5–32.732.0–34.433.2–35.8
Wang et al. [57]gasoline, hybridChina-6RDE76.695.4–11523.9–24.9 24.0–24.6 27.1–28.7

3. Purpose of Article

A consistent feature of the literature review presented is the finding that the latest Euro 6d-temp vehicles meet the emission requirements of the Real Driving Environment (RDE-Compliant) tests. The situation is different in the case of tests that do not meet the requirements of RDE, that is, those in which the impact of extreme dynamic conditions or detailed tests on, for example, the impact of terrain topography were studied. Under such test conditions, mainly nitrogen oxide emissions are exceeded several times. This fact applies to diesel-powered vehicles, but also to gasoline-powered ones.
However, there is a lack of comparisons of test routes, where RDE tests would be carried out according to the requirements of the standard, but also one that would give an answer to the question: whether the future requirements for shortening the length of test routes (or choosing scalable tests) provide emission information similar to that obtained today.
Meeting the requirements for RDE tests, in particular their duration, primarily results in individual test phase lengths of about 30 km. It is not practically possible for the RDE test phases to be 16 km each while also meeting the average driving speeds and driving dynamics.
The main research objective set in the article was to determine whether changing the length of the tests significantly alters emissions. Another research question was to determine the effect of the cold start phase on exhaust emissions in different RDE tests.

4. Research Methodology

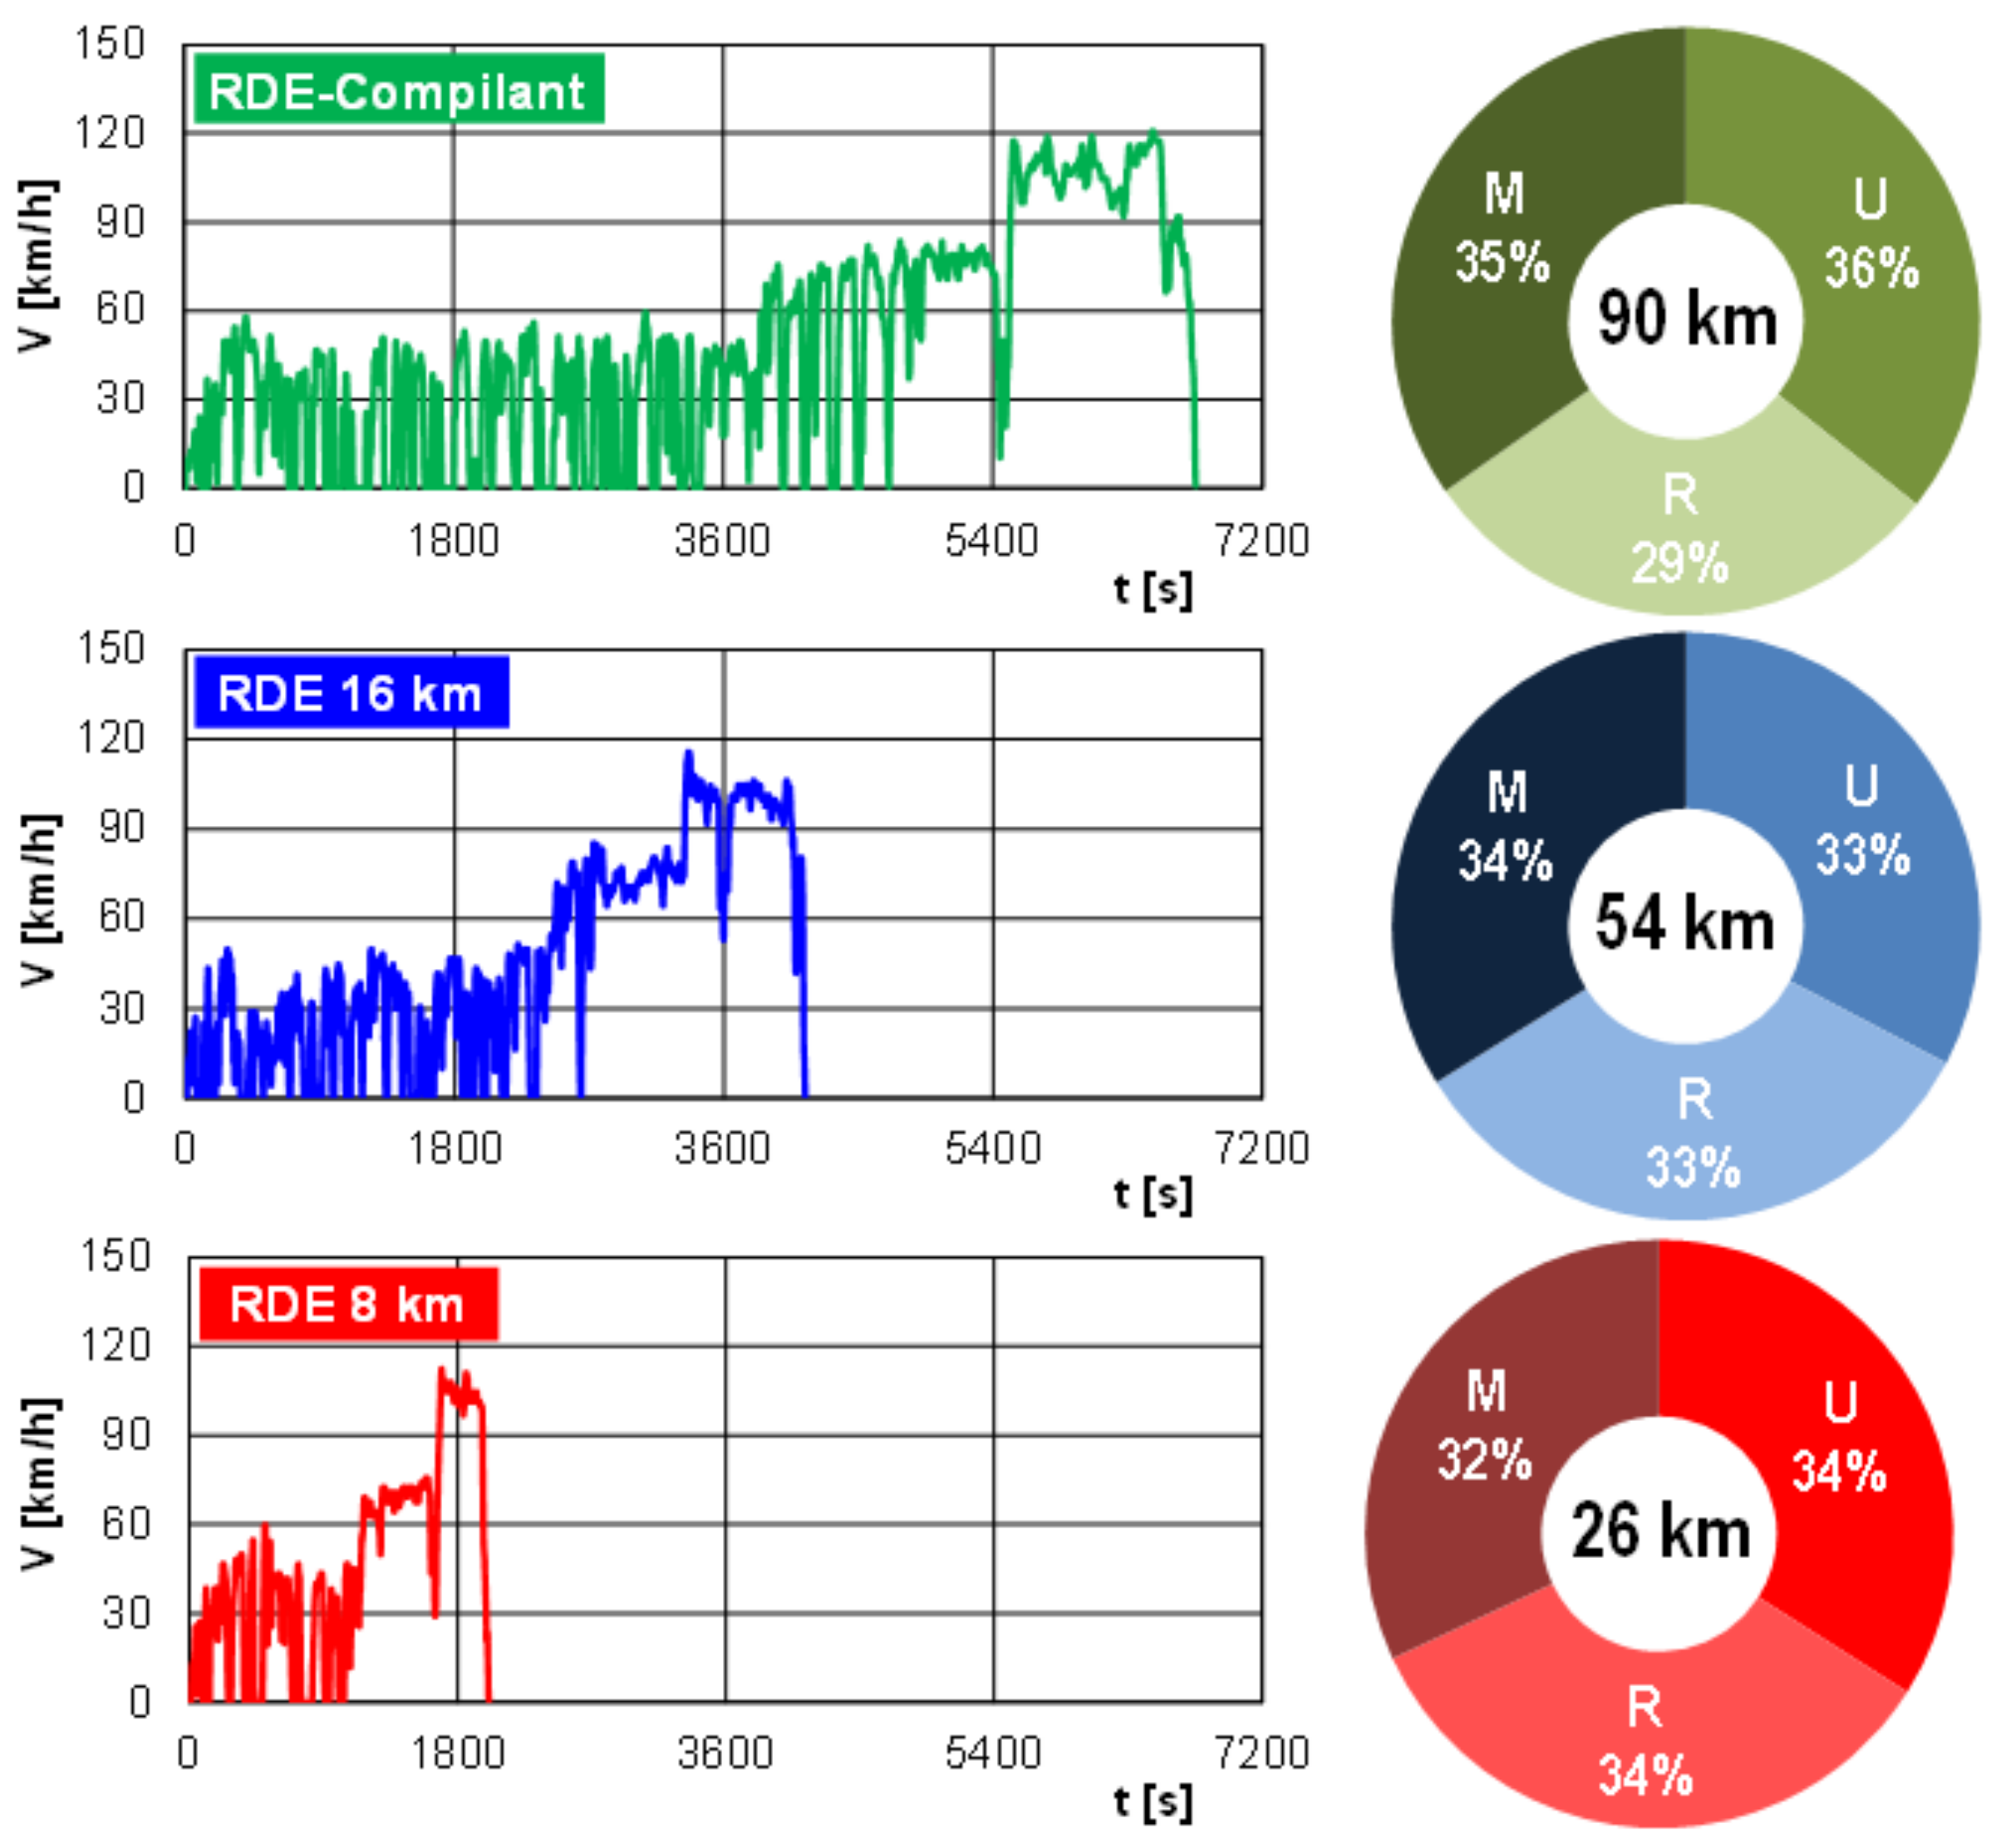
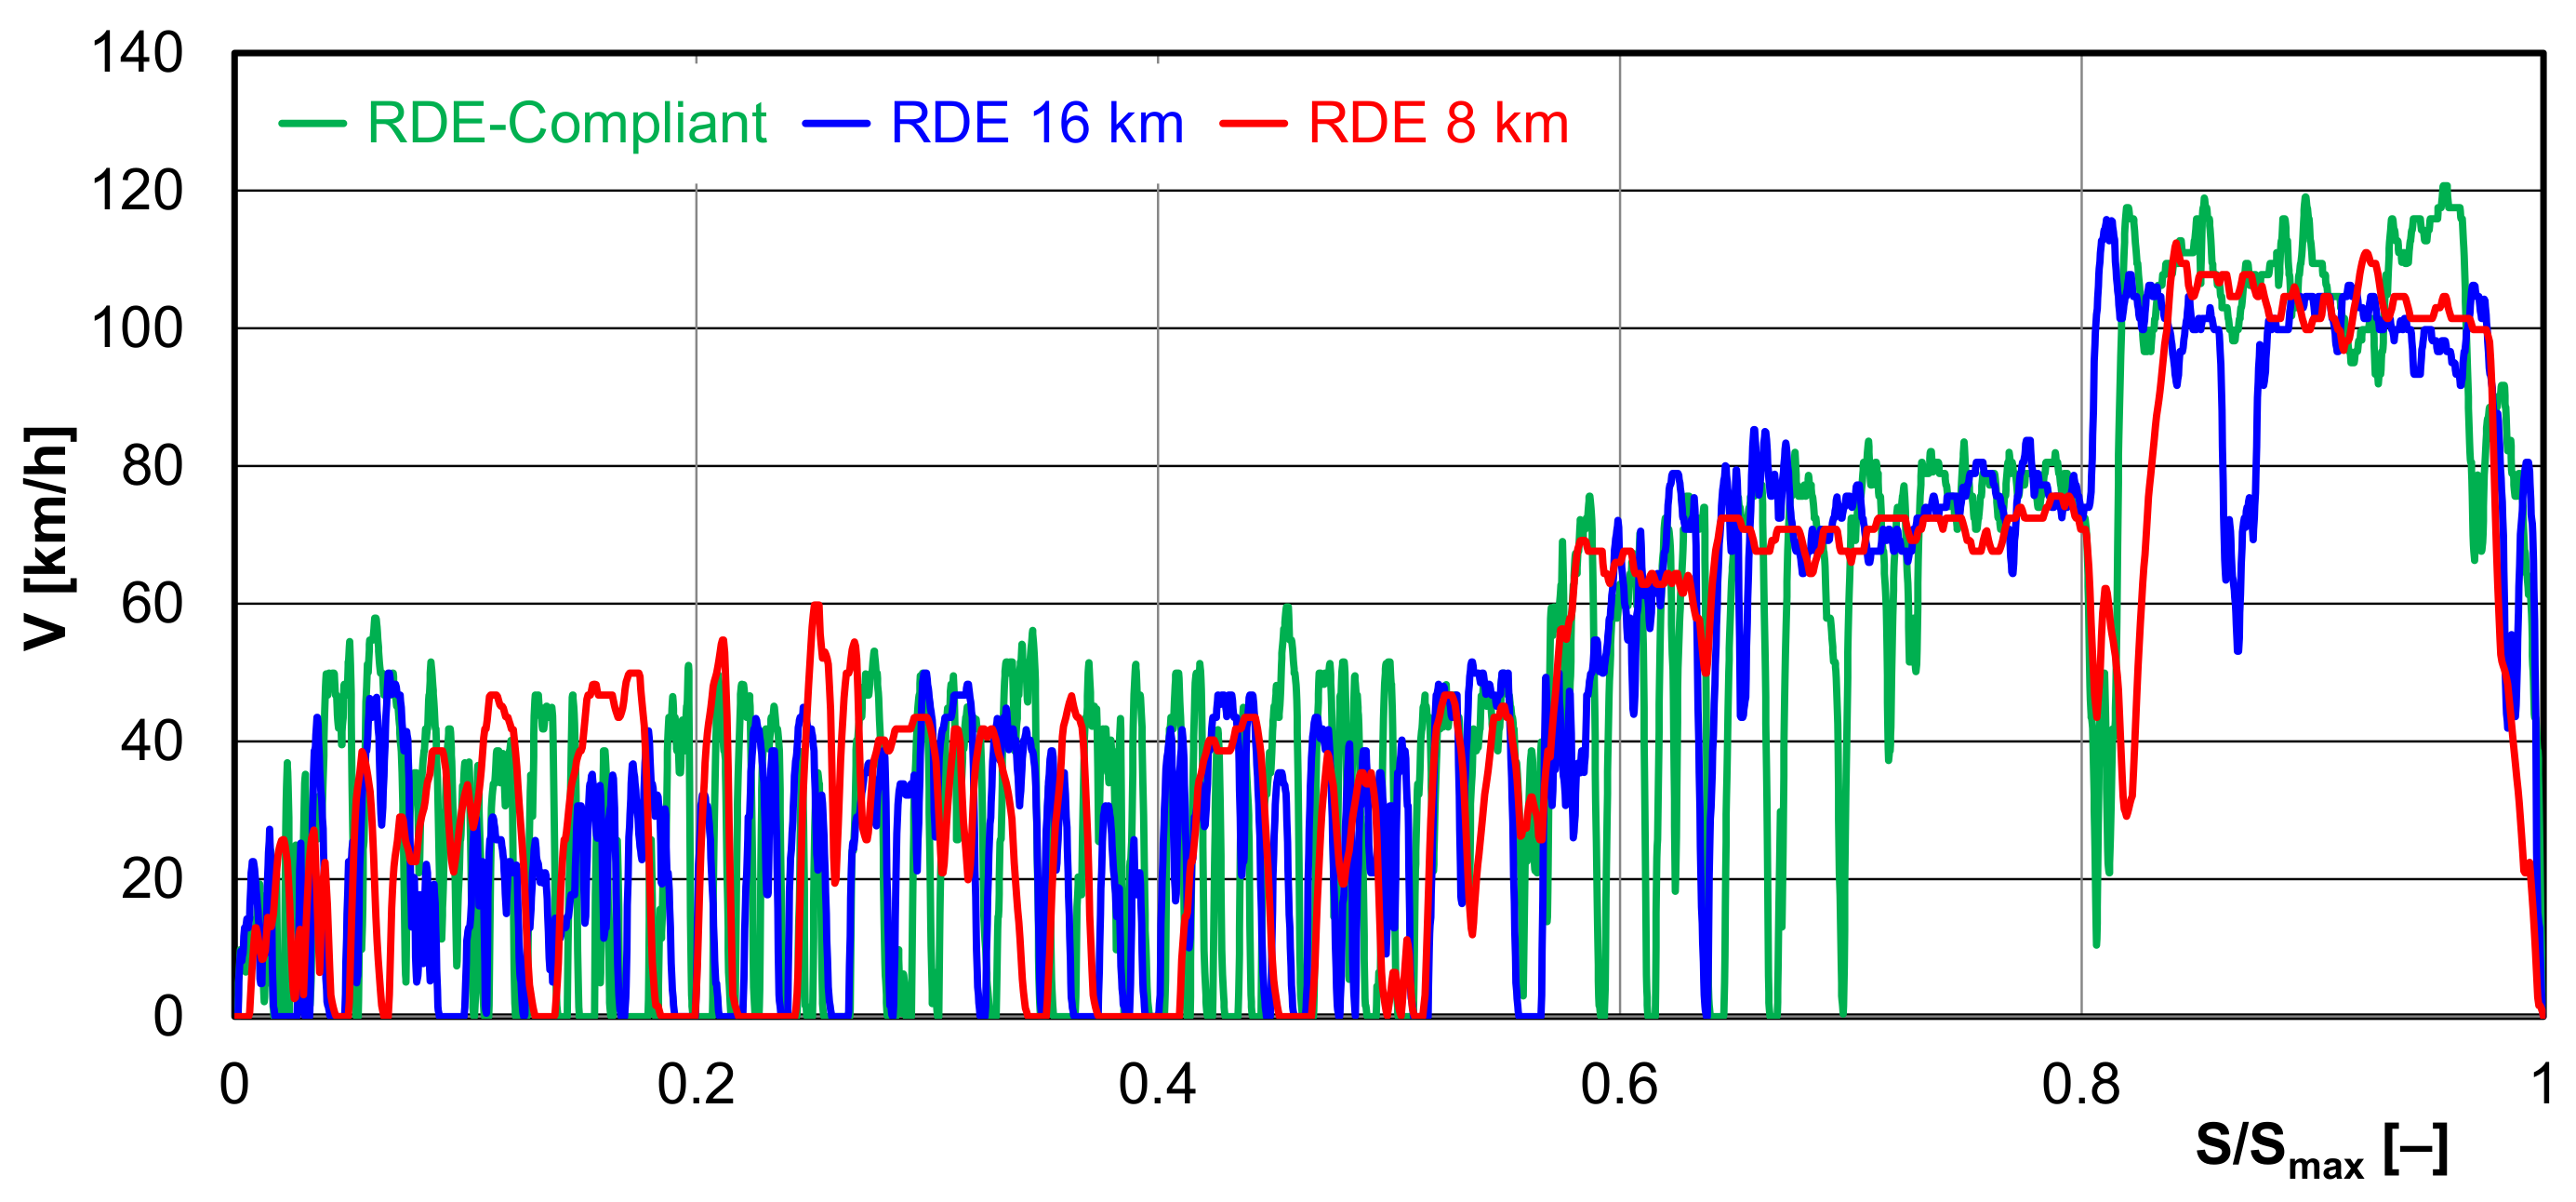
4.1. Research Routes

The main scientific objective of the article is to evaluate the exhaust emissions of road tests that meet (or partially meet) the criteria of RDE tests and differ primarily in test length (and duration). In order to fulfill the stated purpose of the article, exhaust emissions were compared in three different test routes:
  • RDE compliant (as RDE-Compliant);
  • Non-RDE compliant, length 16 km (as RDE 16 km);
  • Non-RDE compliant, length 8 km (as RDE 8 km)
which mainly differed in their total length and duration.
Road tests were carried out in and around Poznań (Poland); a common feature of the research tests was their consistent division into three parts: urban, rural and motorway, which had similar weight shares. Other parameters regarding speed ranges and dynamic conditions, among others, remained unchanged. The basic characteristics of the research tests are shown in Table 2.
The selected test routes were chosen to meet the requirements of the RDE regulations, but they varied in length (and therefore in duration). Variation in the length of the tests did not affect the proportion of each phase (urban, rural, motorway): the average values were (Figure 1):
  • the share of the urban phase varied by 33–36%;
  • the share of the rural phase varied by 29–34%;
  • the share of the motorway phase varied by 32–35%.
Figure 1. Velocity profile for each research test: RDE-Compliant, RDE 16 km and RDE 8 km, along with the percentages of each part in the entire test; U—Urban, R—Rural, M—Motorway.
Energies 15 08691 g001
The selected tests met the requirements of the RDE test procedure. The tests were carried out on working days in the forenoon. The ambient temperature was 23–25 °C, and the relative humidity was in the range of 47–55%.
A comparison of the tests (RDE-Compliant, RDE 16 km, RDE 8 km) as a function of time-dependent V = f(t) indicates differences, the largest of which is test duration (Figure 1). However, a comparison of the tests as a function of V = f(S/Smax) indicates that the road tests performed are significantly similar and consistent (Figure 2). This property makes it possible to compare road tests in terms of relative length, and the results obtained will be representative of individual road tests.
All road tests (as well as exhaust emissions measurements) were repeated three times, and the values presented in the graphs (unless a range of variation in the data or deviation of the results from the average is given) are representative of a given test (e.g., driving speed profile). Exhaust emissions calculations were performed according to the MAW (moving average windows) procedure, and the test results are presented as on-road emissions of specific exhaust compounds. The only inconsistent parameter across all tests was the number of measurement windows, which for the 8 km tests (RDE 8 km) did not comply with the standard for RDE tests (insufficient number of measurement windows).

4.2. Research Object

The research object was a full-hybrid vehicle. The choice of the vehicle was dictated by the very high popularity and the largest (40%) share of sales of this type of vehicle in Poland, as well as in the world. A vehicle was selected for testing, the characteristics of which are given in Table 3. Before the test, the vehicle was conditioned for a period of 24 h, and the test was performed by the same driver. The fuel used for testing was standard palium with 5% ethanol added. A cold start was performed for a coolant temperature of 23 °C, and hot start for a coolant temperature of 80–90 °C.

4.3. Research Equipment

The Semtech mobile measurement system from Sensors Inc. was used to test emissions of exhaust compounds. The system makes it possible to measure the concentration of basic exhaust compounds in exhaust gases, and together with the use of an exhaust gas flow meter, it allows for the determination of their emission intensity values. The system meets the requirements of the standard for testing in real traffic conditions. The number of particulates was determined using a TSI mass spectrometer. The device allowed the number of particulates to be determined while maintaining exhaust gas conditioning. The distance traveled was recorded due to the vehicle’s diagnostic system, and measurements of the external conditions (temperature, pressure and humidity) made it possible to correct the nitrogen oxide emission levels. Before each measurement, the system was calibrated with reference gases and zeroed with ambient air. The weight of the test system, consisting of a mobile exhaust gas analyzer and a particle number measurement system together with a power generator, was 75 kg. Detailed technical parameters and measurement accuracies have been shown in Table 4.

5. Results and Discussion

5.1. Assessment of Dynamic Conditions

In order to be able to compare exhaust emissions in the tests performed, it is most important to verify them in terms of meeting RDE requirements and meeting driving dynamics criteria. The length of the tests and their duration did not comply with the regulations (which was the intention of the authors), but the other static parameters were within the ranges of compliance. This mainly refers to the speed ranges in the different parts of the tests, the proportion of the different phases, and their composition. Detailed results of the test comparison and their compliance with the requirements are presented in Appendix A (Table A1).
If, on the other hand, dynamic conditions are considered, two parameters are shown in the subanalysis: 95th percentile of the product of velocity and positive acceleration (Figure 3a) and relative positive acceleration (Figure 3b). These figures show the obtained average values in the considered measurement tests, and the dashed line indicates the variation of these values for all the performed data. The values of the 95th percentile of the product of velocity and positive acceleration were (Figure 3a):
  • for the urban part: 10.5 ± 2.5 m2/s3;
  • for the rural part: 13 ± 4 m2/s3;
  • for the motorway part: 13 ± 2 m2/s3.
  • at different values of average speed in a given phase.
Figure 3. Dynamic conditions (mean values) in each test: RDE-Compliant, RDE 16 km and RDE 8 km: (a) 95th percentile of the product of velocity and positive acceleration; (b) relative positive acceleration. Dashed lines indicate the range of variation in speed and dynamic indices for all test repetitions performed.
Energies 15 08691 g003
The values of the relative positive acceleration in the tests considered were (Figure 3b):
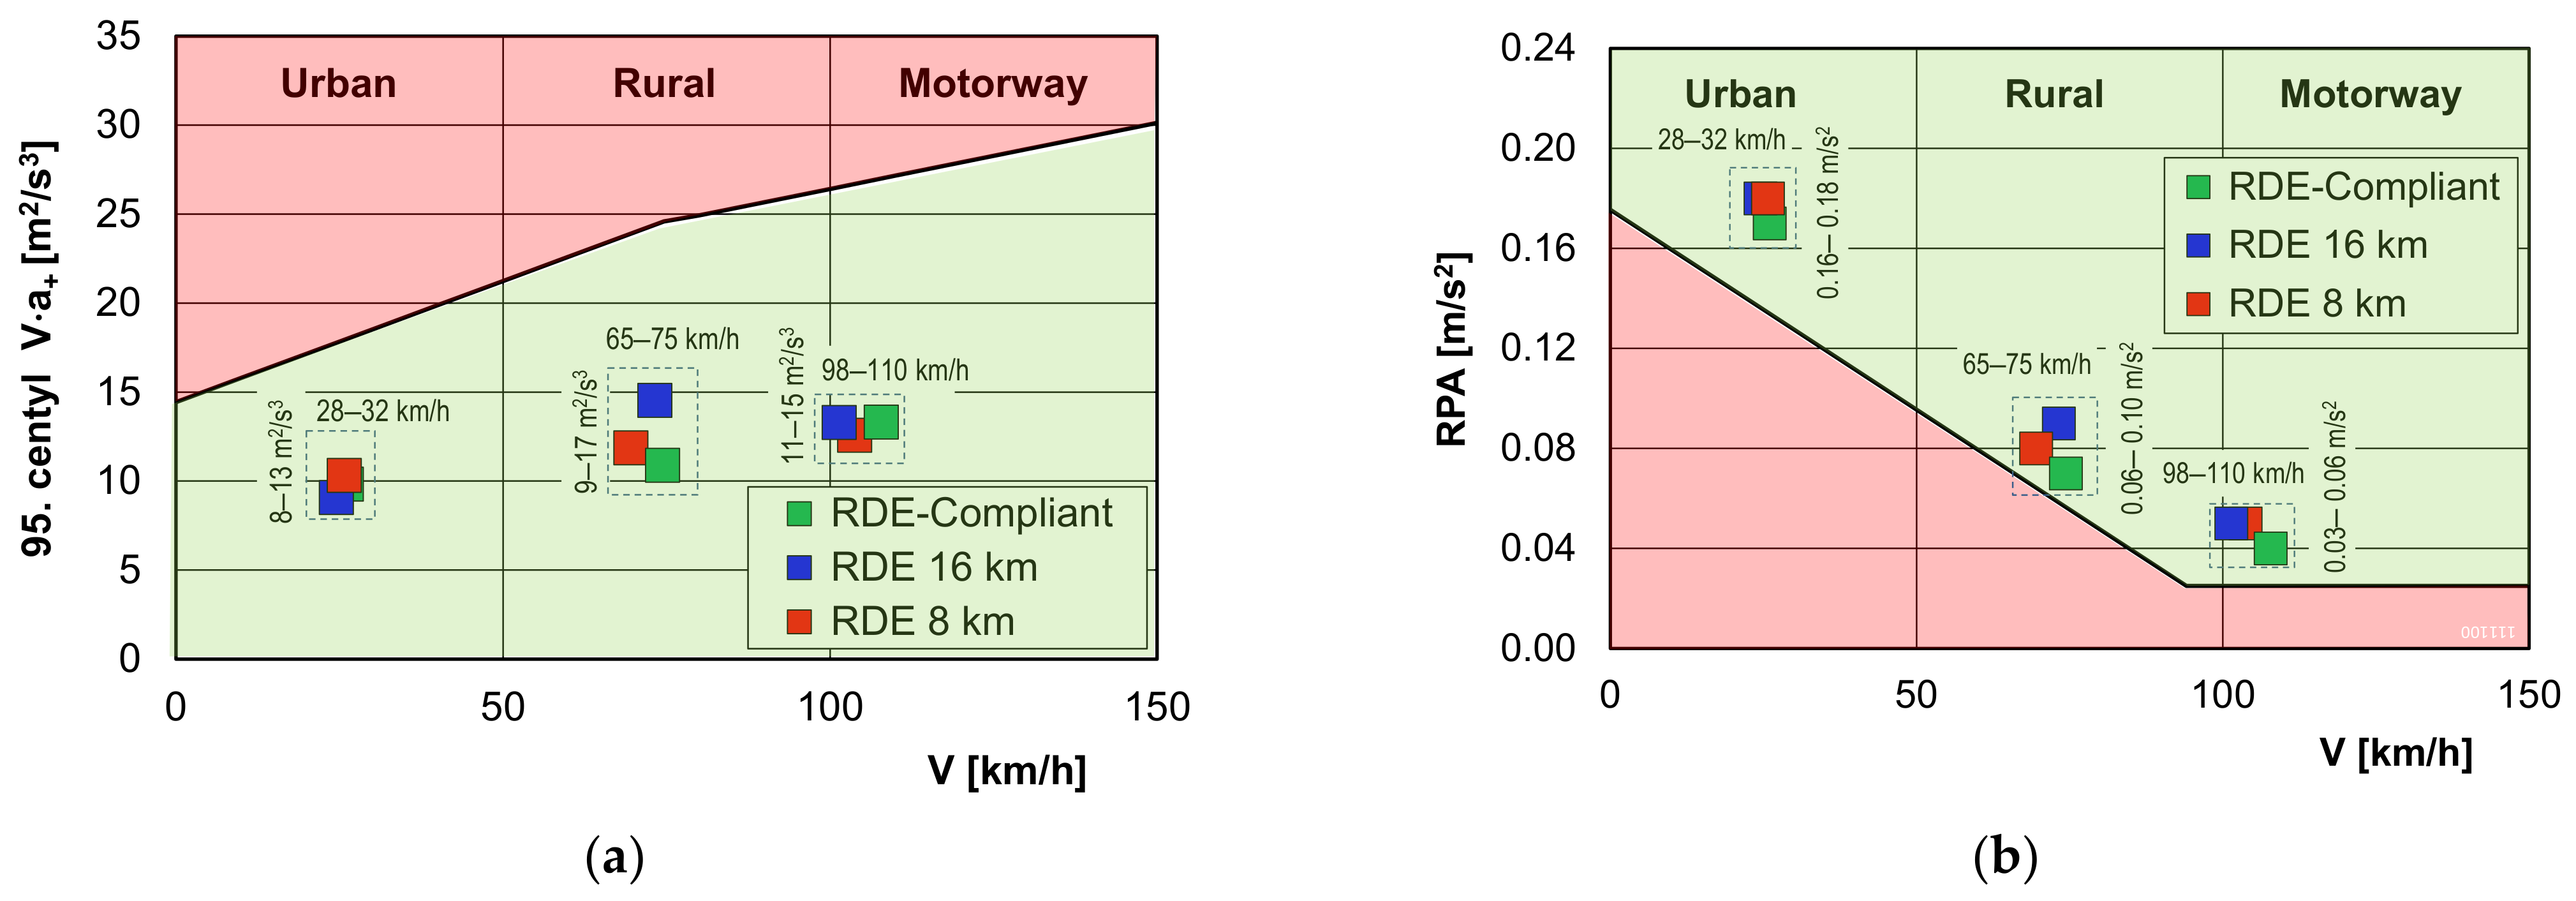
  • for the urban part: 0.17 ± 0.1 m/s2;
  • for the rural part: 0.08 ± 0.2 m/s2;
  • for the motorway part: 0.045 ± 0.015 m/s2.
All the values obtained are within the permissible limits of variability: the values of the 95th percentile of the product of speed and positive acceleration are less than the maximum permissible values for each speed range (Figure 3a), while at the same time, all the recorded values of relative positive acceleration are greater than the permissible minimum. This means that the road tests carried out meet the requirements for dynamic conditions, which allow them to be evaluated against each other in terms of emissions.

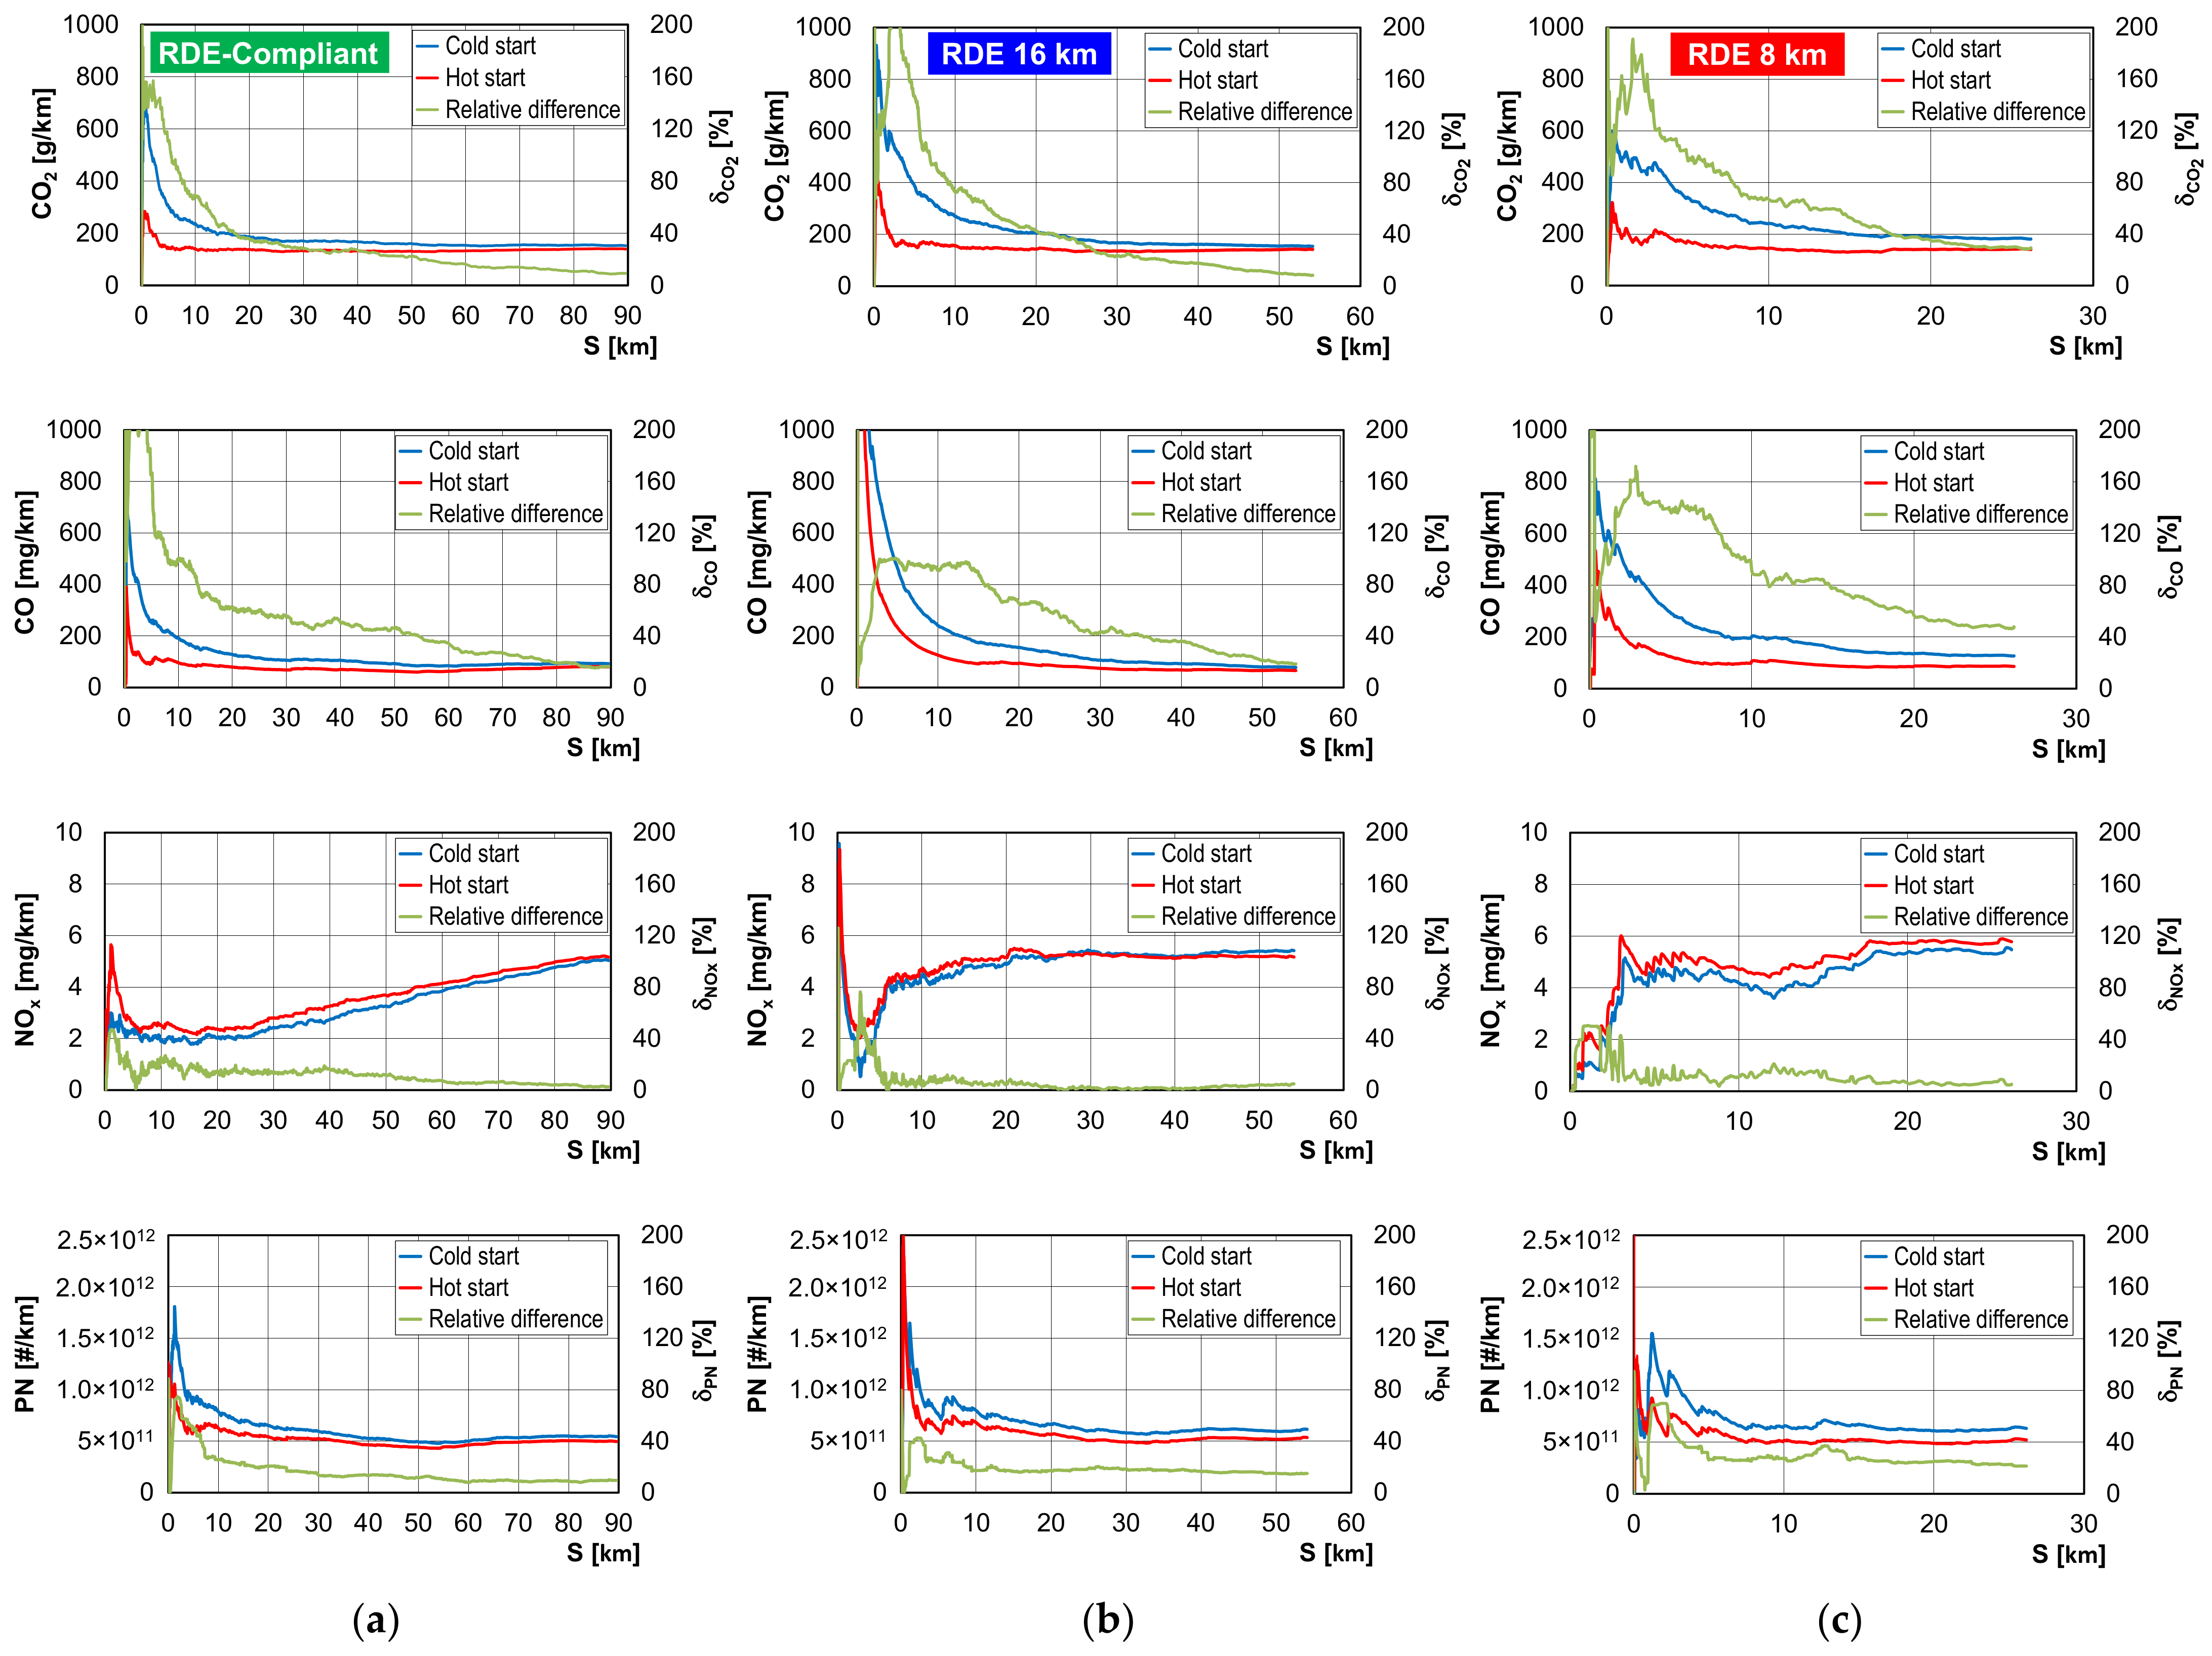
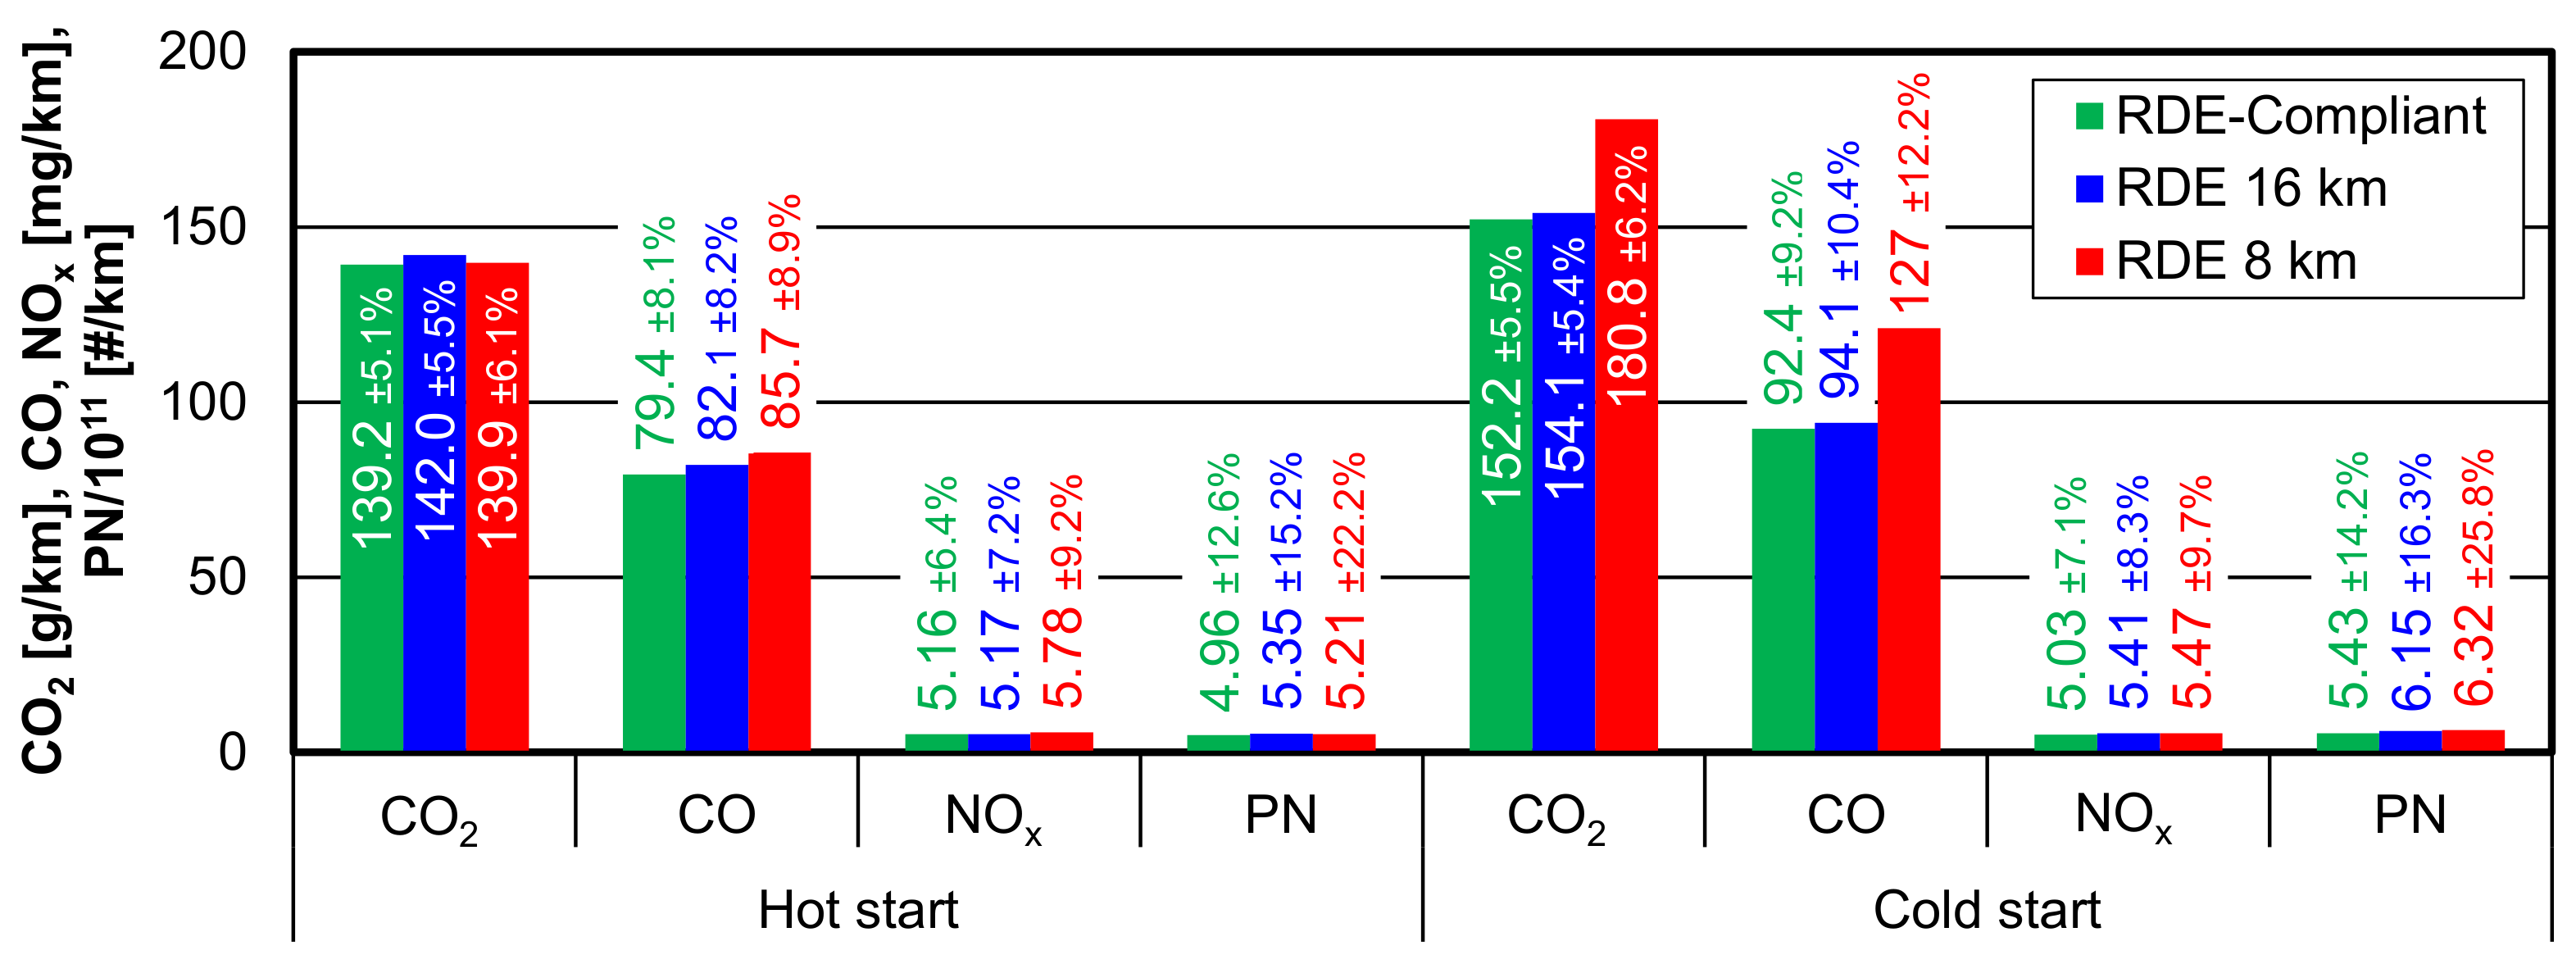
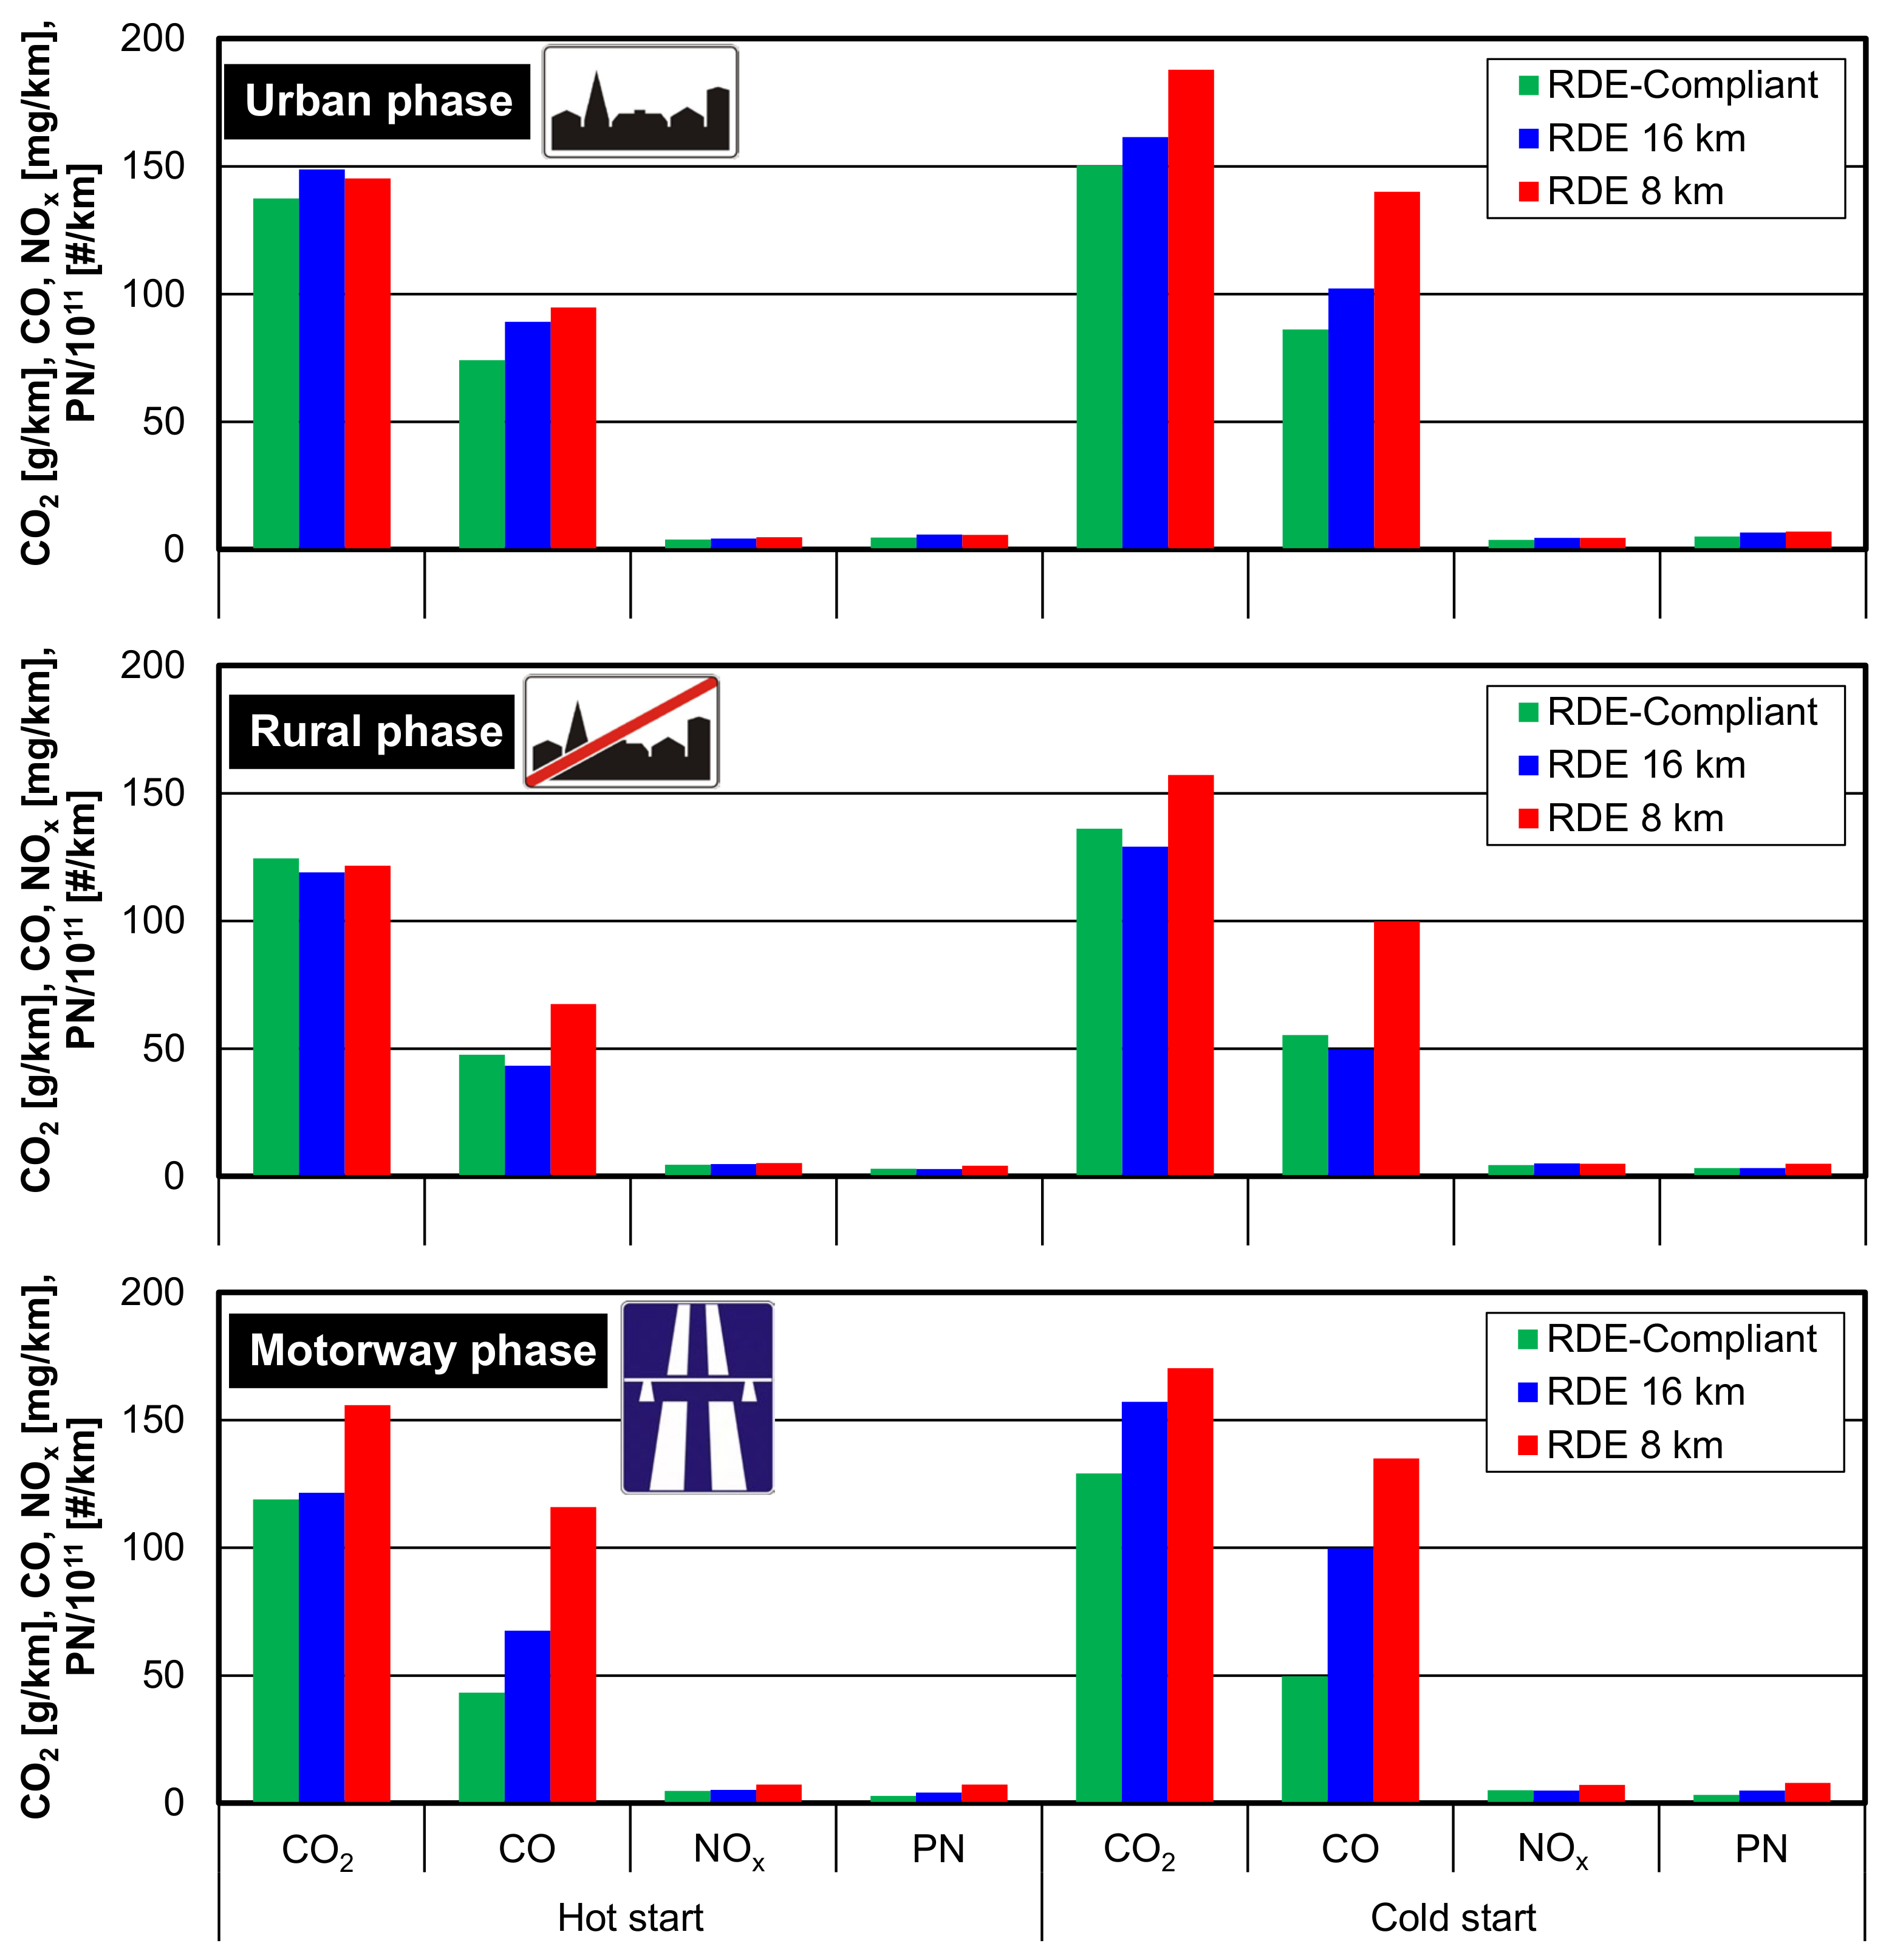
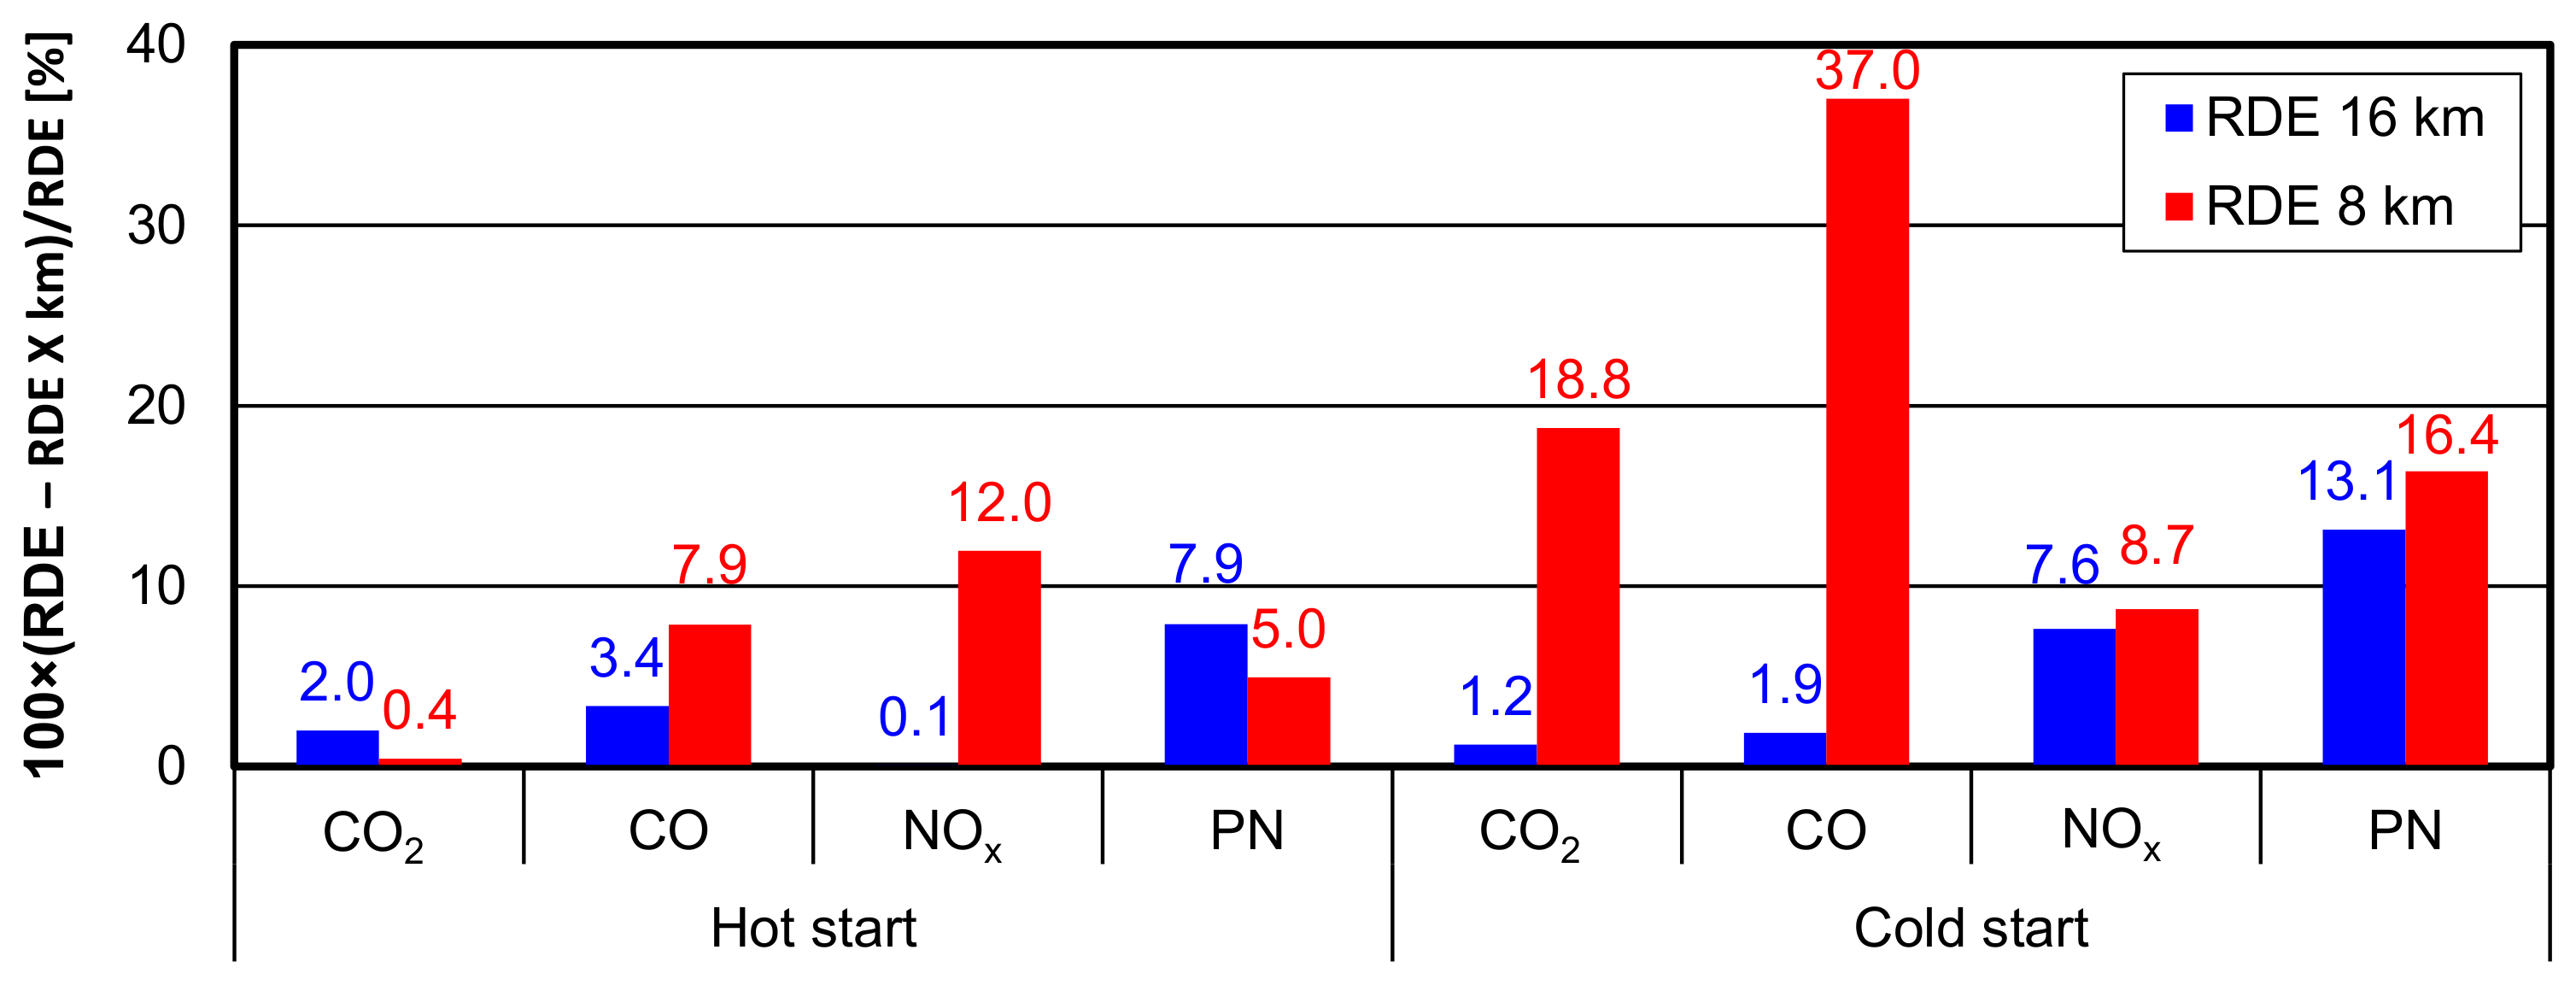
5.2. Comparison of Exhaust Emissions

To determine the road emissions of individual exhaust compounds according to the MAW procedure, knowledge of the road emissions of carbon dioxide in the WLTC test is required. For the test vehicle, the values of road CO2 emissions in the different phases of the WLTC test were 158, 118, 97, and 125 g/km, in the 1st, 2nd, 3rd, and 4th phases of the homolog test, respectively (highlighted in red in Figure 4). As can be seen from the represented graphs of CO2 values in the measurement windows, 92% of measurement windows (5010 out of 5464 windows) determined in the RDE-Compliant test are within the permissible limit, in which the weight share of the CO2 value window is 1. For the RDE 16 km test, the number of measurement windows was smaller (3386 short test time) and the share of measurement windows that are within the permissible limits was 96% (3248 out of 3386 windows). In the RDE 8 km test, the number of measurement windows within the tolerances was 1326 out of 1462 total windows, or 91%. The proportion of normal windows in each part of the tests performed was as follows (a proportion greater than 50% is required):
  • for the test RDE-Compliant: 100% (Urban), 74.0% (Rural) and 100% (Motorway);
  • for the test RDE 16 km: 100% (Urban), 85.4% (Rural) and 100% (Motorway);
  • for the test RDE 8 km: 100% (Urban), 93.2% (Rural) and 64.3% (Motorway).
Figure 4. CO2 road emission values in the measurement windows against the values in the different parts of the WLTC test (solid red dots) and acceptable tolerances (green dashed line): (a) RDE-Compliant; (b) RDE 16 km; (c) RDE 8 km.
Energies 15 08691 g004
Comparing the obtained values of road CO2 emissions raises the question of the adequacy of individual measurements in relation to the averaged values from all tests of such measurement. Such a comparison shows the best correlation of the averaged CO2 emission values (R2 = 0.67) with the values obtained in the shortest road test RDE 8 km (Figure 5). The comparison of CO2 road emission values in the RDE 16 km test compared with the average values is characterized by a lower correlation coefficient of 0.62. The lowest correlation values (0.52) were obtained comparing the RDE-Compliant test with the average values. The rationale for this is that averaging a longer test (RDE-Compliant) with a test with a small number of data (RDE 8 km test) will always give a higher probability of obtaining similar results compared to a shorter test. The presented characteristic property of the compared research tests proves that the RDE 8 km test route was correctly chosen, the characteristics of which coincide with the CO2 correct test. What is noticeable, however, is the density of measurement points (road CO2 emissions) in the intervals of the CO2 = f(CO2 avg) relationship of (120–140 g/km; 110–120 g/km), which results in a greater slope of the simple regression for the RDE 8 km test. This is a result of the short test distance and the smaller number of recorded measurement windows.

6. Results and Discussion

The obtained values of road emissions of individual exhaust compounds, determined in the form of the relationship EE = f(S), where EE (exhaust emission) = (CO2, CO, NOx, PN), depended on the thermal state of the engine at the beginning of the test. Tests were performed for two options: cold and hot engine start (Figure 6).
Considering the road emissions of carbon dioxide as a function of the distance traveled CO2 = f(S), the similar nature of its variability for all the tests performed should be noted. CO2 road emissions from a cold start after 10 km of distance traveled decreased from a value of 600 g/km to a value of about 200 g/km. For a hot start, the values were about 10% lower compared to a cold start (170–180 g/km). The final values of on-road CO2 emissions were the smallest for the RDE-Compliant test and the largest for the RDE 8 km test. The relative difference between the emission values for cold and hot start was also determined for each test. This is characterized by a value of about 80% after the first 10 km and 40% after 20 km. This is tantamount to increased fuel consumption after a cold start, which on short distances (up to 10 km) of city driving can be twice the fuel consumption for a hot start. For RDE-Compliant (Figure 6a) and RDE 16 km (Figure 6b) tests, the value of the relative difference decreased, reaching values of 10–15% at the end of the test. Therefore, the short RDE tests (Figure 6c) would be more reliable and the CO2 emission values (indirectly fuel consumption) would be close to those of the users.
In the case of on-road CO emissions for the various research tests, the nature of the changes was similar to those recorded for CO2 emissions. The significant difference, however, was in the values of these emissions representing 1/1000th of the value of CO2 emissions. The values of road emissions decreased the fastest over a distance of 10 km and were (for cold and hot starts, respectively): 200 and 100 mg/km (in the RDE-Compliant test, Figure 6a), 210 and 130 mg/km (in the RDE 16 km test, Figure 6b), and 200 and 100 mg/km (in the RDE 8 km test, Figure 6c). At the end of each test, the on-road CO values were close to each other at around 100 mg/km. The final CO emission values for the test starting with a cold start were higher than for the test starting with a hot start. The relative difference in CO for cold and hot start after the first 10 km was: about 100% for the RDE-Compliant test, about 90% for the RDE 16 km test and 85% for the RDE 8 km test. After another 10 km, CO decreased to 60% regardless of the test performed. The final CO value was highest for the RDE 8 km short test at more than 40%, and for the RDE-Compliant and RDE 16 km tests, it was about 20%.
A different character of changes in on-road emissions was observed when measuring nitrogen oxides. In this case, the value of NOx = f(S) emissions in the RDE-Compliant test (Figure 6a) just after the start of the test reached a maximum value (amounting to about 6 mg/km), and then decreased and remained fairly stable over a period of several kilometers (about 2 mg/km). After the start of the off-road phase, road emissions of nitrogen oxides increased at a rate of 1 mg/km for every 10 km of road traveled. This trend also continued during motorway driving. The relative difference for hot start and cold start NOx post-measurements was 20% up to 40 km of road, and then disappeared. For the RDE 16 km test (Figure 6b), on-road NOx emissions decreased for the first 2–3 km and then increased to values of 4–5 mg/km after the urban phase (0–18 km). In the rural phase (18–35 km), nitrogen oxide emissions stabilized at 5.5 mg/km, and this result also persisted in the motorway phase. The relative difference for these measurements was several percent in the urban phase and disappeared in the rural and motorway phases. The largest changes in on-road NOx emissions were observed in the RDE 8 km test (Figure 6c), in which in the urban phase (0–8 km), the initial on-road emissions were small probably due to the use of the hybrid vehicle’s electric motor (thanks to favorable conditions). On the other hand, after about 3 km, NOx on-road emissions rose sharply to a value of about 6 mg/km and then remained in the range of 4–5 mg/km (regardless of the thermal state of the internal combustion engine). In the off-road phase, road emissions increased to 6 mg/km, and this result was maintained until the end of the test. The relative difference in emissions for hot and cold start for this test was about 30–40% in the urban phase, about 20% in the rural phase and less than 10% in the motorway phase. In the tests conducted, the on-road emissions of nitrogen oxides from hot start were for the most part greater than those from cold start.
The nature of the changes in the number of particulates was most similar to the changes in road emissions of carbon monoxide, which is due to the basic laws of formation of these compounds (from local oxygen deficiency in the engine cylinder). Regardless of the test performed, an increase in the number of particulates to a value of 1.5–2.0 × 10¹² #/km (during cold start) was observed immediately after start-up, followed by a decrease in the number of particulates to a value of 1.0 × 10¹² #/km after about 5 km. After another 10 km of testing, the values stabilized at around 5.0 × 10¹¹ #/km. The difference between the particle number emission values for cold and hot start was largest for the short test (RDE 8 km, Figure 6c) and smallest for the RDE-Compliant test (Figure 6a).
The final values of the emissions of individual exhaust compounds for all tests are shown in Figure 7. The standard deviation values for each test by cold and hot start of the engine are also given. As can be seen from the data presented, performing tests from a cold start results in higher emissions of all exhaust compounds, especially for short tests (RDE 8 km). The increase in emission values for the test started from a cold start is mainly due to the fact that the thermal steady state of the engine was not achieved during the urban phase. The distance of the RDE 8 km test is practically contained in the length of the urban phase of the RDE-Compliant test. A disadvantageous feature is the burdening of the result with a larger standard deviation, resulting from the smaller number of measurement windows.
The data presented above should be considered additionally in the different parts of the road test in the urban, rural and motorway phases. The greatest differences in values between the RDE-Compliant, RDE 16 km and RDE 8 km tests become apparent when the test begins with a cold start of the engine (Figure 8).
In the urban phase, the largest changes in on-road emissions were observed for carbon dioxide (180 and 150 g/km) and carbon monoxide (140 and 90 mg/km) for the RDE 8 km and RDE-Compliant tests, respectively. In the rural phase, differences in road emissions of carbon dioxide were smaller (165 and 130 g/km), while differences in road emissions of carbon monoxide became apparent (100 and 55 mg/km). In the motorway phase—due to the thermal stabilization of exhaust aftertreatment systems—significant differences in carbon monoxide road emissions occurred for both hot start (115 and 45 mg/km) and cold start (140 and 55 mg/km) tests. Generalizing the data obtained, it can be concluded that performing short road tests results in increased road emissions of all components regardless of the thermal conditions under which the engine start-up for such a test takes place.
When considering the relative difference in exhaust emissions in the RDE 16 km and RDE 8 km tests compared to the RDE-Compliant test, the equation was used:
(RDE-Compliant − RDE X km)/RDE-Compliant × 100%
where RDE X km denotes the road emission of a given exhaust compound in the RDE 16 km or RDE 8 km test.
According to Equation (1), a comparison was made for all the exhaust compounds, and the results are presented in Figure 9. It shows that for the hot start test, the largest relative differences (emission increases) between the RDE-Compliant test and the other tests are for the road emissions of nitrogen oxides (by 12% for RDE 8 km), carbon monoxide (by 7.9% for RDE 8 km) and particulate matter (by 7.9% for RDE 16 km and by 5% for RDE 8 km). Considering the tests starting with a cold start of the engine, the emission results of the RDE 8 km short road test are characterized by higher values of: carbon dioxide by 18.8%, carbon monoxide by 37%, nitrogen oxides by 8.7%, particle number emissions by 16.4% compared to the RDE-Compliant test.
All the analyses presented on emissions in road tests cannot be analyzed in isolation from the nature of the test object, which was a full hybrid car. The operating characteristics of the vehicle do not allow for a choice of propulsion options (internal combustion/hybrid/electric) but are only based on the strategy of using the electric motor to assist or partially replace the internal combustion engine. In the system used, reducing emissions (reducing fuel consumption) can only be achieved by applying ecodriving principles. However, the performance of road tests by a single driver and the possibility of maintaining the requirements of the dynamic criteria of the RDE tests precluded this possibility. The proportion of internal combustion engine and electric engine work was the result of the engine control strategy only. As Figure 10 shows, the highest share of electric engine operation occurred for the urban phase during tests starting from a hot start and was 44%, 48% and 52% for RDE-Compliant, RDE 16 km and RDE 8 km tests, respectively. For tests starting from a cold start, the share of electric engine operation in the urban phase was a few percent lower. The situation was also similar in the rural phase, where the use of the electric motor decreased to a range of 17–23% (hot start) and 16–17% for cold start. The motorway phase was characterized by very low use of the electric motor, which is mainly due to high driving speeds and a small share of engine braking. In contrast, it is characteristic, regardless of the test phase and hot or cold start, that the longer the distance of the driving phase, the shorter the share of electric motor operation. In the RDE 8 km test, the electric motor was used on average 10% more than during the RDE-Compliant long test (48% versus 36%; urban part, cold start).

7. Conclusions

The research results presented here concern the comparison of exhaust emissions from full hybrid vehicles in road tests that comply with current requirements (RDE-Compliant) and future requirements (RDE 16 km and RDE 8 km). The authors proposed two tests (that can be used in the future) that meet the reported demands for shortening road tests. These tests are largely based on the principles set forth in the RDE regulations (driving speeds, test composition, division of phases, participation), and the differences are mainly due to the characteristics of these tests (length, duration).
The results of the comparison indicate that the use of short road tests (with a length of each phase of about 8 km) to assess exhaust emissions affect less thermal stabilization of the internal combustion engine and exhaust aftertreatment system. This results in increased road emissions of all exhaust components: carbon dioxide (by 19%), carbon monoxide (by 37%), nitrogen oxides (by 9%) and particulate matter (by 16%). At the same time, emissions of exhaust compounds in all phases of the road test are increased, which has a positive effect on the accuracy of measurements, given the very small concentration values recorded by analyzers.
The influence of the cold start on the exhaust emission values in the same tests is significant for carbon monoxide and particle number, especially in the urban phase. Under these conditions, a two-fold increase in the emissions of the compounds in question was observed.
The next stage of the work should be the study of other groups of conventional and plug-in hybrid vehicles. It would also be necessary to solve the problem of the state of charge (SOC) of such vehicles. Such vehicles starting a road test with fully charged batteries could not use the combustion engine in any phase of such a test.

Author Contributions

Conceptualization, K.S. and J.P.; methodology, K.S. and J.P.; software, K.S. and J.P.; validation, K.S. and J.P.; formal analysis, K.S. and J.P.; investigation, K.S. and J.P.; resources, K.S. and J.P.; data curation, K.S. and J.P.; writing—original draft preparation, K.S. and J.P.; writing—review and editing, K.S. and J.P.; visualization, K.S. and J.P.; supervision, K.S. and J.P.; project administration, K.S. and J.P. All authors have read and agreed to the published version of the manuscript.

Funding

This research received no external funding.

Data Availability Statement

Not applicable.

Conflicts of Interest

The authors declare no conflict of interest.

Abbreviations

aacceleration vehicle
CFconformity factor
CNGcompressed natural gas
EEexhaust emission
HEVhybrid electric vehicle
ICEinternal combustion engines
JRCJoint Research Centre
LPGliquefied petroleum gas
Mmotorway
MAWmoving average window
NEDCNew European Driving Cycle
NMHCnon-methane hydrocarbons
OBDon-board diagnostic
PEMSportable emission measurement system
PHEVplug-in hybrid electric vehicle
PNparticle number
Rrural
RDEreal driving emissions
RPArelative positive acceleration
Sdistance
SOCstate of charge
ttime
TCMVTechnical Committee on Motor Vehicles
ushare
Uurban
Vvehicle speed
WHOWorld Health Organization
WLTCWorldwide harmonized Light-duty vehicles Test Cycle
WLTPWorldwide harmonized Light-duty vehicles Test Procedure

Appendix A

Table A1. Detailed data on RDE-Compliant, RDE 16 km and RDE 8 km tests (average values from 3 repetitions).
ParameterRDE RequirementsRDE-CompliantRDE 16 kmRDE 8 km
Distance
 Urban>16 km31.95 km17.70 km8.90 km
 Rural>16 km26.49 km18.08 km8.92 km
 Motorway>16 km31.15 km18.34 km8.36 km
Trip composition
 Urban29–44%35.66%32.71%34.02%
 Rural23–43%29.57%33.41%34.06%
 Motorway23–43%34.77%33.89%31.95%
 Average urban speed15–40 km/h26.00 km/h24.53 km/h25.73 km/h
Average rural speed 74.39 km/h73.28 km/h69.51 km/h
Average motorway speed 107.82 km/h101.4 km/h103.73 km/h
Average test speed 47.81 km/h47.10 km/h47.17 km/h
Stop (urban driving time)6–30%21.99%18.79%20.48%
Dynamics
 95th percentile v·a+
  Urban 9.83 m2/s39.08 m2/s310.32 m2/s3
  Rural 10.89 m2/s314.54 m2/s311.87 m2/s3
  Motorway 13.32 m2/s313.29 m2/s312.58 m2/s3
 Relative positive acceleration
  Urban 0.17 m/s20.18 m/s20.18 m/s2
  Rural 0.07 m/s20.09 m/s20.08 m/s2
  Motorway 0.04 m/s20.05 m/s20.05 m/s2
Total trip duration90–120 min112.43 min68.93 min33.27 min

References

  1. World Health Organization; Regional Office for Europe. Air Quality Guidelines for Europe; WHO Regional Office for Europe: Copenhagen, Denmark, 1987; p. 23. Available online: https://apps.who.int/iris/handle/10665/107364 (accessed on 25 June 2022).
  2. WHO Global Air Quality Guidelines. Particulate Matter (PM2.5 and PM10), Ozone, Nitrogen Dioxide, Sulfur Dioxide and Carbon Monoxide; WHO Regional Office for Europe: Bonn, Germany, 2021. Available online: https://apps.who.int/iris/handle/10665/345329 (accessed on 27 June 2022).
  3. Monforti-Ferrario, F.; Borowiak, A.; Putaud, J.P.; Perez Ballesta, P.; Cavalli, F.; Manca, G. Air Pollutants of Emerging Concern. Potential Air Pollutants and How They Could Be Monitored under Future Air Quality Directives; Joint Research Centre, Publications Office of the European Union: Luxembourg, 2022. [CrossRef]
  4. European Commission. Communication from the Commission to the European Parliament, the Council, the European Economic and Social Committee and the Committee of the Regions. Pathway to a Healthy Planet for All. EU Action Plan: Towards Zero Pollution for Air, Water and Soil. Brussels. 2021. Available online: https://ec.europa.eu/environment/pdf/zero-pollution-action-plan/communication_en.pdf (accessed on 25 June 2022).
  5. Lodi, C.; Serra, S.; Currò, D.; Gil-Sayas, S.; Marotta, A.; Bonnel, P.; Riemersma, I. Eco-Innovative Technologies Reducing CO2 Emissions of Light-Duty Vehicles: Evaluation of Interactions; Joint Research Centre, Publications Office of the European Union: Luxembourg, 2022. [CrossRef]
  6. Ktistakis, M.A.; Pavlovic, J.; Fontaras, G. Sampling Approaches for Road Vehicle Fuel Consumption Monitoring; European Commission, Joint Research Centre: Luxembourg, 2021. [CrossRef]
  7. European Union. Regulation (EU) 2019/631 of the European Parliament and of the Council of 17 April 2019 setting CO2 emission performance standards for new passenger cars and for new light commercial vehicles, and repealing Regulations (EC) No 443/2009 and (EU) No 510/2011. Off. J. Eur. Union 2019, L111. Available online: http://data.europa.eu/eli/reg/2019/631/oj (accessed on 20 January 2022).
  8. Rodríguez Quintero, R.; Vidal-Abarca Garrido, C. Revision of the EU Green Public Procurement Criteria for Road Transport: Technical Report and Criteria Proposal; Joint Research Centre, Publications Office of the European Union: Luxembourg, 2022. [CrossRef]
  9. Samaras, Z. Study on Post-EURO 6/VI Emission Standards in Europe (Part A). Update on the Draft Deliverables. Presentation to the Advisory Group on Vehicle Emission Standards (AGVES). Brussels. 2020. Available online: https://circabc.europa.eu/sd/a/a108e064-c487-4bf6-bb46-7faac76f8205/Post-EURO%206%20WT2.2_AGVES_2019_10_18%20V4.pdf (accessed on 25 May 2022).
  10. Ziolkowski, A.; Daszkiewicz, P.; Rymaniak, L.; Fuc, P.; Ukleja, P. Analysis of the Exhaust Emissions from Hybrid Vehicle during RDE Test. MATEC Web Conf. 2019, 294, 02002. [Google Scholar] [CrossRef]
  11. European Union. Commission Regulation (EU) 2017/1151 of 1 June 2017 Supplementing Regulation (EC) No 715/2007 of the European Parliament and of the Council on Type-Approval of Motor Vehicles with Respect to Emissions from Light Passenger and Commercial Vehicles (Euro 5 and Euro 6) and on Access to Vehicle Repair and Maintenance Information, Amending Directive 2007/46/EC of the European Parliament and of the Council, Commission Regulation (EC) No 692/2008 and Commission Regulation (EU) No 1230/2012 and Repealing Commission Regulation (EC) No 692/2008. Off. J. Eur. Union 2017, L175. Available online: http://data.europa.eu/eli/reg/2017/1151/oj (accessed on 12 May 2022).
  12. Zardini, A.; Bonnel, P. Real Driving Emissions Regulation: European Methodology to Fine Tune the EU Real Driving Emissions Data Evaluation Method; Joint Research Centre, Publications Office of the European Union: Luxembourg, 2020. [CrossRef]
  13. Gis, M. Assessment of Exhaust Emissions from Vehicles in Real Traffic Conditions. IOP Conf. Ser. Earth Environ. 2019, 214, 012035. [Google Scholar] [CrossRef]
  14. Du, B.; Zhang, L.; Geng, Y.; Zhang, Y.; Xu, H.; Xiang, G. Testing and Evaluation of Cold-Start Emissions in a Real Driving Emissions Test. Transp. Res. D Transp. Environ. 2020, 86, 102447. [Google Scholar] [CrossRef]
  15. Gioria, R.; Martini, G.; Perujo Mateos Del Parque, A.; Giechaskiel, B.; Carriero, M.; Zappia, A.; Cadario, M.; Forloni, F.; Lähde, T.; Selleri, T.; et al. Assessment of On-Road Emissions of Refuse Collection Vehicles: Diesel and Compressed Natural Gas; Joint Research Centre, Publications Office of the European Union: Luxembourg, 2020. [CrossRef]
  16. Bernard, Y. Current Situation and Perspectives on Vehicles Real-World Emissions. Bruxelles Environnement—Colloque de Présentation de La Fin de La Consultation Sur La Sortie Des Moteurs Thermiques. The International Council on Clean transportation. 2019. Available online: https://environnement.brussels/sites/default/files/user_files/pres_20190423_colloquesortiethermique_icct.pdf (accessed on 15 June 2022).
  17. Yang, Z.; Liu, Y.; Wu, L.; Martinet, S.; Zhang, Y.; Andre, M.; Mao, H. Real-World Gaseous Emission Characteristics of Euro 6b Light-Duty Gasoline- and Diesel-Fueled Vehicles. Transp. Res. D Transp. Environ. 2020, 78, 102215. [Google Scholar] [CrossRef]
  18. European Union. Commission Regulation (EU) 2016/427 of 10 March 2016 amending Regulation (EC) No 692/2008 as regards emissions from light passenger and commercial vehicles (Euro 6). Off. J. Eur. Union 2016, L82. Available online: http://data.europa.eu/eli/reg/2016/427/oj (accessed on 17 May 2022).
  19. European Union. Commission Regulation (EU) 2016/646 of 20 April 2016 amending Regulation (EC) No 692/2008 as regards emissions from light passenger and commercial vehicles (Euro 6). Off. J. Eur. Union 2016, L109. Available online: http://data.europa.eu/eli/reg/2016/646/oj (accessed on 19 May 2022).
  20. European Union. Commission Regulation (EU) 2018/1832 of 5 November 2018 amending Directive 2007/46/EC of the European Parliament and of the Council, Commission Regulation (EC) No 692/2008 and Commission Regulation (EU) 2017/1151 for the purpose of improving the emission type approval tests and procedures for light passenger and commercial vehicles, including those for in-service conformity and real-driving emissions and introducing devices for monitoring the consumption of fuel and electric energy. Off. J. Eur. Union 2018, L301. Available online: http://data.europa.eu/eli/reg/2018/1832/oj (accessed on 25 May 2022).
  21. EU TCMV Approves Euro 6e Amendments. DieselNet.com. Available online: https://dieselnet.com/news/2022/08tcmv.php (accessed on 25 August 2022).
  22. Giechaskiel, B.; Valverde, V.; Clairotte, M. Real Driving Emissions (RDE): 2020 Assessment of Portable Emissions Measurement Systems (PEMS) Measurement Uncertainty; Joint Research Centre, Publications Office of the European Union: Luxembourg, 2021. [CrossRef]
  23. Bonnel, P.; Clairotte, M.; Cotogno, G.; Gruening, C.; Loos, R.; Manara, D.; Melas, A.; Selleri, T.; Tutuianu, M.; Valverde, V.; et al. European Market Surveillance of Motor Vehicles. Results of the 2020-2021 European Commission Vehicle Emissions Testing Programme; Joint Research Centre, Publications Office of the European Union: Luxembourg, 2022. [CrossRef]
  24. Suarez-Bertoa, R.; Astorga, C.; Franco, V.; Kregar, Z.; Valverde, V.; Clairotte, M.; Pavlovic, J.; Giechaskiel, B. On-Road Vehicle Emissions beyond RDE Conditions: Experimental Assessment Addressing EU Real-Driving Emission (RDE); Joint Research Centre, Publications Office of the European Union: Luxembourg, 2019. [CrossRef]
  25. Giechaskiel, B.; Valverde, V.; Kontses, A.; Suarez-Bertoa, R.; Selleri, T.; Melas, A.; Otura, M.; Ferrarese, C.; Martini, G.; Balazs, A.; et al. Effect of Extreme Temperatures and Driving Conditions on Gaseous Pollutants of a Euro 6d-Temp Gasoline Vehicle. Atmosphere 2021, 12, 1011. [Google Scholar] [CrossRef]
  26. Alonso Raposo, M.; Mourtzouchou, A.; Garus, A.; Brinkhoff-Button, N.; Kert, K.; Ciuffo, B. JRC Future Mobility Solutions Living Lab (FMS-Lab): Conceptual Framework, State of Play and Way Forward; Joint Research Centre, Publications Office of the European Union: Luxembourg, 2021. [CrossRef]
  27. Mera, Z.; Fonseca, N.; López, J.M.; Casanova, J. Analysis of the High Instantaneous NOx Emissions from Euro 6 Diesel Passenger Cars under Real Driving Conditions. Appl. Energy 2019, 242, 1074–1089. [Google Scholar] [CrossRef]
  28. Claßen, J.; Krysmon, S.; Dorscheidt, F.; Sterlepper, S.; Pischinger, S. Real Driving Emission Calibration—Review of Current Validation Methods against the Background of Future Emission Legislation. Appl. Sci. 2021, 11, 5429. [Google Scholar] [CrossRef]
  29. Demuynck, J. Advanced Emission Controls and Renewable Fuels for Low Pollutants and Lifecycle CO2 Emissions. Sustainable Internal Combustion Engine Virtual ‘Live’, AECC Presentation. 2021, p. 210204. Available online: https://www.aecc.eu/wp-content/uploads/2021/02/210204-AECC-presentation-sustainable-ICE-conference-final.pdf (accessed on 20 August 2022).
  30. Winkler, S.L.; Anderson, J.E.; Garza, L.; Ruona, W.C.; Vogt, R.; Wallington, T.J. Vehicle Criteria Pollutant (PM, NOx, CO, HCs) Emissions: How Low Should We Go? Clim. Atmos. Sci. 2018, 1, 26. [Google Scholar] [CrossRef] [Green Version]
  31. Noralm, Z. Implementing a Method for Conducting Real Driving Emission (RDE). KTH Skolan För Industriell Teknik Och Management. Sverige. 2018. Available online: http://www.diva-portal.org/smash/get/diva2:1212016/FULLTEXT02 (accessed on 10 August 2022).
  32. Wang, X.; Thomas, D.; Ge, Y.; Yu, W.; Song, B.; Xu, X.; Zheng, S.; Yang, Z.; Su, S.; Gong, H.; et al. Proceedings of Real Driving Emission (RDE) Measurement in China. SAE Tech. Pap. 2018. [Google Scholar] [CrossRef]
  33. Suarez-Bertoa, R.; Valverde, V.; Clairotte, M.; Pavlovic, J.; Giechaskiel, B.; Franco, V.; Kregar, Z.; Astorga, C. On-Road Emissions of Passenger Cars beyond the Boundary Conditions of the Real-Driving Emissions Test. Environ. Res. 2019, 176, 108572. [Google Scholar] [CrossRef]
  34. Prati, M.V.; Costagliola, M.A.; Giuzio, R.; Corsetti, C.; Beatrice, C. Emissions and Energy Consumption of a Plug-in Hybrid Passenger Car in Real Driving Emission (RDE) Test. Transp. Eng. 2021, 4, 100069. [Google Scholar] [CrossRef]
  35. Pignatta, G.; Balazadeh, N. Hybrid Vehicles as a Transition for Full E-Mobility Achievement in Positive Energy Districts: A Comparative Assessment of Real-Driving Emissions. Energies 2022, 15, 2760. [Google Scholar] [CrossRef]
  36. Šarkan, B.; Jaśkiewicz, M.; Kubiak, P.; Tarnapowicz, D.; Loman, M. Exhaust Emissions Measurement of a Vehicle with Retrofitted LPG System. Energies 2022, 15, 1184. [Google Scholar] [CrossRef]
  37. Valverde, V.; Mora, B.A.; Clairotte, M.; Pavlovic, J.; Suarez-Bertoa, R.; Giechaskiel, B.; Astor, C.; Fontaras, G. Emission Factors Derived from 13 Euro 6b Light-Duty Vehicles Based on Laboratory and on-Road Measurements. Atmosphere 2019, 10, 243. [Google Scholar] [CrossRef] [Green Version]
  38. Gebisa, A.; Gebresenbet, G.; Gopal, R.; Nallamothu, R.B. Driving Cycles for Estimating Vehicle Emission Levels and Energy Consumption. Future Transp. 2021, 1, 615–638. [Google Scholar] [CrossRef]
  39. Rosenblatt, D.; Winther, K.; Petri, S.; Lindgren, M.; Bütler, T.; Czerwinski, J.; Duoba, M.; Wallner, T. A Report from the Advanced Motor Fuels Technology Collaboration Programme: Real Driving Emissions and Fuel Consumption. Technology Collaboration Programme on Advanced Motor Fuels. Available online: https://www.iea-amf.org/app/webroot/files/file/Annex%20Reports/AMF_Annex_55.pdf (accessed on 13 June 2022).
  40. Ehrenberger, S.I.; Qiao, J.; Konrad, M.; Philipps, F. Analysis of Tail-Pipe Emissions of a Plug-in Hybrid Vehicle and Its Average Emissions for Different Test Cycles. In Proceedings of the 22rd International Transport and Air Pollution Conference, Zürich, Switzerland, 15–16 November 2017; Available online: https://elib.dlr.de/116955/1/TAP2017_Ehrenberger.pdf (accessed on 11 May 2022).
  41. Luján, J.M.; Piqueras, P.; de la Morena, J.; Redondo, F. Experimental Characterization of Real Driving Cycles in a Light-Duty Diesel Engine under Different Dynamic Conditions. Appl. Sci. 2022, 12, 2472. [Google Scholar] [CrossRef]
  42. Lejda, K.; Jaworski, A.; Savostin-Kosiak, D.; Mądziel, M.; Balawender, K.; Ustrzycki, A. Assessment of Petrol and Natural Gas Vehicle Carbon Oxides Emissions in the Laboratory and On-Road Tests. Energies 2021, 14, 1631. [Google Scholar] [CrossRef]
  43. Suarez-Bertoa, R.; Pechout, M.; Vojtíšek, M.; Astorga, C. Regulated and Non-Regulated Emissions from Euro 6 Diesel, Gasoline and CNG Vehicles under Real-World Driving Conditions. Atmosphere 2020, 11, 204. [Google Scholar] [CrossRef] [Green Version]
  44. Roberts, P.J.; Mumby, R.; Mason, A.; Redford-Knight, L.; Kaur, P. RDE plus—the Development of a Road, Rig and Engine-in-the-Loop Test Methodology for Real Driving Emissions Compliance. SAE Tech. Pap. 2019. [Google Scholar] [CrossRef]
  45. Hopwood, P.; Shalders, B. Euro 7/VII–New Emissions Limits, The Challenges and Solutions. Delivering Excellence through Innovation & Technology. Ricardo. 2020. Available online: https://mobex.io/webinars/euro-7-vii-future-emissions-challenges-and-solutions/ (accessed on 15 June 2022).
  46. Kurtyka, K.; Pielecha, J. The Evaluation of Exhaust Emission in RDE Tests Including Dynamic Driving Conditions. Transp. Res. Procedia 2019, 40, 338–345. [Google Scholar] [CrossRef]
  47. Wang, Y.; Yin, H.; Wang, J.; Hao, C.; Xu, X.; Wang, Y.; Yang, Z.; Hao, L.; Tan, J.; Wang, X.; et al. China 6 Moving Average Window Method for Real Driving Emission Evaluation: Challenges, Causes, and Impacts. J. Environ. Manag. 2022, 319, 115737. [Google Scholar] [CrossRef] [PubMed]
  48. Suttakul, P.; Fongsamootr, T.; Wongsapai, W.; Mona, Y.; Poolsawat, K. Energy Consumptions and CO2 Emissions of Different Powertrains under Real-World Driving with Various Route Characteristics. Energy Rep. 2022, 8, 554–561. [Google Scholar] [CrossRef]
  49. Skobiej, K.; Pielecha, J. Plug-in Hybrid Ecological Category in Real Driving Emissions. Energies 2021, 14, 2340. [Google Scholar] [CrossRef]
  50. Pielecha, J.; Skobiej, K.; Kurtyka, K. Exhaust Emissions and Energy Consumption Analysis of Conventional, Hybrid, and Electric Vehicles in Real Driving Cycles. Energies 2020, 13, 6423. [Google Scholar] [CrossRef]
  51. Akard, M.; Gramlich, N.; Nevius, T.; Porter, S. Comparison of Real-World Urban Driving Route PEMS Fuel Economy with Chassis Dynamometer CVS Results. SAE Tech. Pap. 2019. [Google Scholar] [CrossRef]
  52. Bodisco, T.; Zare, A. Practicalities and Driving Dynamics of a Real Driving Emissions (RDE) Euro 6 Regulation Homologation Test. Energies 2019, 12, 2306. [Google Scholar] [CrossRef] [Green Version]
  53. Kadijk, G.; Vermeulen, R.; Buskermolen, E.; Elstgeest, M.; van Heesen, D.; Heijne, V.; Ligterink, N.; van der Mark, P. NOx Emissions of Eighteen Diesel Light Commercial Vehicles: Results of the Dutch Light-Duty Road Vehicle Emission Testing Programme 2017. TNO 2017, R11473. Available online: https://zoek.officielebekendmakingen.nl/blg-850339.pdf (accessed on 5 May 2022).
  54. Sokolnicka, B.; Fuć, P.; Szymlet, N.; Siedlecki, M.; Grzeszczyk, R. Harmful Exhaust Components and Particles Mass and Number Emission during the Actual Drive of a Passenger Car in Accordance with the RDE Procedure. Combust. Engines 2019, 178, 198–202. [Google Scholar] [CrossRef]
  55. Selleri, T.; Melas, A.; Ferrarese, C.; Franzetti, J.; Giechaskiel, B.; Suarez-Bertoa, R. Emissions from a Modern Euro 6d Diesel Plug-In Hybrid. Atmosphere 2022, 13, 1175. [Google Scholar] [CrossRef]
  56. Soo Yu, Y.; Soo Chon, M.; Cha, J. Evaluation of Real Driving Emissions with Acting Regulations (3rd and 4th RDE Packages) in Korea. Alex. Eng. J. 2022, 61, 9471–9484. [Google Scholar] [CrossRef]
  57. Wang, Y.; Hao, C.; Ge, Y.; Hao, L.; Tan, J.; Wang, X.; Zhang, P.; Wang, Y.; Tian, W.; Lin, Z.; et al. Fuel Consumption and Emission Performance from Light-Duty Conventional/Hybrid-Electric Vehicles over Different Cycles and Real Driving Tests. Fuel 2020, 278, 118340. [Google Scholar] [CrossRef]
Figure 2. Relative length (related to total length) of tests: RDE-Compliant (green line), RDE 16 km (blue line) and RDE 8 km (red line).
Energies 15 08691 g002
Figure 5. Comparison of road CO2 emissions in each road test (RDE-Compliant, RDE 16 km and RDE 8 km) according to the road emissions averaged from all tests CO2.
Energies 15 08691 g005
Figure 6. Comparison of on-road emissions by test road: (a) RDE-Compliant, (b) RDE 16 km, (c) RDE 8 km.
Energies 15 08691 g006
Figure 7. Road emission values (including standard deviation) for cold and hot start for tests RDE-Compliant, RDE 16 km and RDE 8 km.
Energies 15 08691 g007
Figure 8. Road emissions (average values) of pollutants for cold and hot start in the urban, rural and motorway parts of the RDE-Compliant, RDE 16 km and RDE 8 km tests.
Energies 15 08691 g008
Figure 9. Relative difference of emission values (average values) for cold and hot start during RDE 16 km and RDE 8 km tests compared to RDE-Compliant test (RDE X km stands for RDE 16 km or RDE 8 km test).
Energies 15 08691 g009
Figure 10. Share of electric/combustion engine operation in each part of RDE-Compliant, RDE 16 km and RDE 8 km tests for cold and hot startup.
Energies 15 08691 g010
Table 2. Main characteristics of the cycles and routes (bold changes from the RDE-Compliant test).
RequirementsRDE-CompliantRDE 16 kmRDE 8 km
Distance
 Urban>16 km (30 ± 5 km) 116 ± 3 km8 ± 2 km
 Rural>16 km (30 ± 5 km) 116 ± 3 km8 ± 2 km
 Motorway>16 km (30 ± 5 km) 116 ± 3 km8 ± 2 km
Trip composition
 Urban29–44%29–44%29–44%
 Rural23–43%23–43%23–43%
 Motorway23–43%23–43%23–43%
Average urban speed15–40 km/h15–40 km/h15–40 km/h
Stop (urban driving time)6–30%6–30%6–30%
Dynamics
 95th percentile v·a+95th percentile of the multiplication of the instant speed and positive acceleration signals as defined in [11]
 Relative positive acceleration (RPA)Relates to the relative positive acceleration as defined in [11]
Total trip duration90–120 min60–90 min30–60 min
1 Values most frequently observed.
Table 3. Technical parameters of the tested vehicles.
Technical ParametersHybrid Vehicle
Model year2021
EngineGasoline, Line 4, 16V
Engine displacement2.5 L
Aftertreatment systemthree-way catalyst
Maximum power130 kW (combustion engine) + 30 kW (electric engine)
Maximum torque220 Nm/3600–5200 rpm (combustion engine)
+ 30 Nm (electric engine)
Transmissionautomatic
Curb weight1590 kg
Average CO2 emissions132 g/km (WLTC)
Euro standardEuro 6d-temp
Mileage36,000 km
Battery11 kWh
Table 4. Technical parameters of the measurement equipment (SEMTECH DS).
DescriptionMeasurement MethodRangeAccuracy of the Measurement Range
CONDIR0–10%±3%
THCFID0–10,000 ppm±2.5%
NOx (NO + NO2)NDUVNO: 0–2500 ppm
NO2: 0–500 ppm
±3%
CO2NDIR0–20%±3%
O2Chemical analyzer0–22%±1%
Frequency1–4 Hz
Exhaust flowMass flow rate0–500 kg/h±1%
Publisher’s Note: MDPI stays neutral with regard to jurisdictional claims in published maps and institutional affiliations.

