Article

Resiliency-Sensitive Decision Making Mechanism for a Residential Community Enhanced with Bi-Directional Operation of Fuel Cell Electric Vehicles

1
Department of Electrical and Electronics Engineering, Faculty of Engineering and Architecture, Istanbul Gelisim University, Istanbul 34310, Turkey
2
Department of Electrical and Electronics Engineering, Faculty of Engineering, Trakya University, Edirne 22030, Turkey
3
Department of Electrical Engineering, Faculty of Electrical and Electronics, Yildiz Technical University, Istanbul 34220, Turkey
*
Author to whom correspondence should be addressed.
Energies 2022, 15(22), 8729; https://doi.org/10.3390/en15228729
Submission received: 2 November 2022 / Revised: 15 November 2022 / Accepted: 18 November 2022 / Published: 20 November 2022
(This article belongs to the Special Issue Smart Electric Vehicle Charging Approaches for Demand Response)

Abstract

:
The trend regarding providing more distributed solutions compared to a fully centralized operation has increased the research activities conducted on the improvement of active regional communities in the power system operation in the last decades. In this study, an energy management-oriented decision-making mechanism for residential end-users based local community is proposed in a mixed-integer linear programming context. The proposed concept normally includes inflexible resiliency-sensitive load–demand activated as flexible during abnormal operating conditions, fuel cell electric vehicles (FCEVs) fed via the hydrogen provided by an electrolyzer unit connected to the residential community and capable of acting in vehicle-to-grid (V2G) mode, common energy storage and photovoltaic (PV) based distributed generation units and dispersed PV based generating options at the end-user premises. The combination of the hydrogen–electricity chain with the V2G capability of FCEVs and the resiliency-sensitive loads together with common ESS and generation units provides the novelty the study brings to the existing literature. The concept was tested under different case studies also with different objective functions.

1. Introduction

1.1. Motivation and Background

The environmental issues have already necessitated many changes in electric power system operation from different points of view. On the one hand, the introduction of new types of electric loads, such as electric vehicles (EVs), and the integration of non-dispatchable renewable generation units in the last decades have improved the challenge of sustaining the demand–supply balance in different operating conditions. On the other hand, abnormal climatic events due to dramatically changing environmental conditions may also lead to serious additional challenges for electric power system operation. Hurricanes, earthquakes, heavy snow, etc., have shown high impacts on the physical structure of the electric power system of different regions in the world. Thus, considering the resiliency of electric power systems to such events is an operational challenge for electric power systems with increasing importance [1].
Many solutions have been proposed in this manner to enhance the power system operation under the impacts of environmental concerns driven by new technologies as well as environmental impacts based on new operating requirements. These solutions are generally considered within the context of smart grid technologies, ensuring additional possible benefits, especially for enabling a more flexible grid structure [2]. The vehicle-to-X operation option enables large amounts of EVs to act as a large-scale source during long-term outages, uneconomical operating periods, etc. [3]. Additionally, demand-side flexibility and different energy storage options can also further be active grid-edge technologies as vital parts of a more flexible electric power system structure [4,5].
The mentioned attempts to enable a smarter grid also have improved the utilization of more distributed solutions instead of a centrally operated structure. Therefore, for smaller communities, each with separate distributed generation, energy storage, multi-type energy utilization, flexible load, etc., options have been implemented even in real-world pilot examples in different regions of the world. Here, especially providing residential communities with or without grid connection enhanced by distributed energy management structures has drawn significant attention in the aforementioned applications.

1.2. Literature Overview

The literature in this manner consists of a vast number of studies dealing with specific or combined parts of the residential communities’ combined energy management problem. Coordinated management of residential end-users considering varying price signals as well as grid constraints was proposed in [6] with the opportunities of photovoltaic (PV) based distributed generation, an energy storage system (ESS) and load rescheduling based flexibility options at the end-user premises. A control strategy, also with the development of proper power electronics interfaces, was presented in [7] for a multi-household residential area, including sole battery-based EVs (SBEVs), PV and ESS units at each end-user’s premise. A residential microgrid with multiple renewable common generation options as well as conventional generation and ESS units was considered both from planning and operational points of view in [8]. A centralized operation scheme for a residential community composed of end-users, each equipped with PV, ESS, vehicle-to-grid (V2G) capable EVs and flexible loads, was proposed in [9].
The energy management of different residential end-users with varying operational possibilities such as distributed generation, ESS, EV, etc., availability was considered this time in a hierarchical and distributed manner consecutively in [10,11]. Another hierarchical study was given in [12] considering the flexibility of thermostatically controllable loads of end-users combined with common ESS (CESS) units. A combined centralized–decentralized management strategy for a residential neighborhood was presented in [13], where each household was equipped with PV, ESS and EVs, and the general management scheme also included the inclusion of a market operator. The study of Ancona et al. [14] considered the optimum design and operation problem for a residential community, including a PV-based common generation option together with the availability of a dual energy storage option based on a combined electrolyzer–hydrogen tank-fuel cell (FC) structure and a battery-based CESS. A game-theoretic approach-based energy management concept was proposed in [15] for multiple residential communities, including common PV and wind turbine-based generation and ESS units as well as flexible loads.
There are numerous more studies on the centralized or decentralized energy management of residential communities. In order to direct for more compact evaluations, a detailed review of community-level coordination of residential end-users considering demand-side flexibility options in a recent study in [16] can be referred to. Additionally, the role of optimization-based decision-making mechanisms for residential communities’ energy management problems was discussed in detail in another recent study [17].
The studies given in [6,7,8,9,10,11,12,13,14,15] and more cited in [16,17] neglected the simultaneous availability of CESS and distributed generation units as well as the vehicle-to-grid (V2G) supply of possible commonly connected EVs, while none of the mentioned studies considered the possibility of the resiliency-sensitive loads in the residential community.
The study in [18] considered the resiliency conditions as mimicking a grid-outage event for a residential community, including SBEVs, load flexibility and common PV unit. Another study in [19] considered a residential neighborhood operation in which each residential end-user was equipped with a PV-based distributed generation option, and the common area of the residential community was equipped with V2G capable common EV parking lot and a large-scale ESS unit. The study in [20] considered multiple types of storage options (heat and electricity) for a multi-energy community, including a common PV, common ESS and V2G enabled SBEVS, as well as demand side flexibility. However, the study in [18] did not consider a common ESS option, while the study in [19,20] neglected the flexibility from the demand side arising during resiliency-challenging operational conditions. Additionally, the studies in [18,19,20] did not consider the possible multi-energy flow options (electricity and hydrogen) in which FC-based EVs (FCEVs) could act in V2G mode instead of SBEVs ensuring a closed hydrogen chain from hydrogen production via an electrolyzer unit step to the last step of FCEVs acting also as a source. Even a more combined structure compared to [15,16,20] was proposed in [21], including common ESS and PV-based common generation units, pricing-based indirect demand flexibility, multiple types of EVs (FCEVs and SBEVs), and V2G availability for SBEVs. However, the resiliency-based conditions and the relevant energy management system behavior to utilize the relevant demand-side flexibility options via direct load control were not considered in [21].

1.3. Content and Contributions

In this study, a resiliency-sensitive decision-making tool for a residential community is proposed in a mixed-integer linear programming (MILP) framework. The mentioned residential community includes a common PV-based generation unit, a CESS, hydrogen production and storage-connected FC-based electrified transportation solutions in the common usage area. During outages caused by abnormal operating conditions, the normally inflexible residential loads become partially flexible by curtailment of defined resiliency-sensitive loads. Additionally, FCEVs may also act as generating units in both normal and abnormal operating conditions to enhance the supply capability and economic operation of the residential community.
The contributions of the proposed study are two-fold also compared to the detailed taxonomy given in Table 1:
  • The combination of dual-side FCEVs integration together with common distributed generation, CESS and multi-energy chain (hydrogen and electricity) availability is considered in such a structure;
  • The resiliency conditions are considered a sub-decision period by enabling a flexible portion in a normally inflexible residential load profile leading to a resiliency-sensitive decision-making mechanism.

1.4. Organization of the Paper

The rest of this paper is organized as follows. The methodology is described in Section 2. The obtained results are presented and discussed in Section 3. Finally, concluding remarks are presented in Section 4.

2. System Description and Methodology

In the proposed concept, the residential community includes a common PV-based generation unit and an electrolyzer system, as well as a common hydrogen storage option. Here, FCEVs of household owners are assumed to be parked in a common area in the community. The hydrogen needs of the mentioned FCEVs are supplied by the common hydrogen storage system. Additionally, each household in the residential community owns a PV-based distributed generation unit. Moreover, apart from the grid failure-based resiliency conditions, the load of each household is totally inflexible. However, only for abnormal operating conditions, each household has resiliency-sensitive loads to be curtailed if necessary. Moreover, FCEVs can also support the residential community power needs both in normal and abnormal operating conditions.
The objective function in Equation (1) consists of two parts that can be activated separately or simultaneously. The first part, defined as the cost, comprises the difference between the economic correspondence of the energy exchanges between the upstream grid and the residential community, as shown in (2). The second part, defined as the curtailment, represents the total energy value curtailed under abnormal operating conditions from the resiliency-sensitive loads of households, as depicted in (3).
min A C o s t + B C u r t a i l m e n t
C o s t = t ( P U G 2 R C , t Δ T τ b u y , t P R C 2 U G , t Δ T τ s e l l , t )
C u r t a i l m e n t = t n h ( ( P r s l o a d p r o f i l e , h , n , t P r s l o a d , h , n , t ) Δ T )
The power balance in (4) corresponds to the contributions of the total reverse power flow from the households to the residential community, the power drawn from the upstream grid by the residential community, the power production of common PV unit, discharging power of CESS unit and the total discharging based power contribution of FCEVs on the one hand, and the total power transfer to households from the residential community, the possible reverse power flow from the residential community to the upstream grid, charging power of CESS unit and the power directed to the electrolyzer unit for hydrogen production on the other hand.
P H 2 R C t o t , t + P U G 2 R C , t + P C P V U , t + P C E S S d i s c , t + P F C E V d i s c h t o t , t = P R C 2 H t o t , t + P R C 2 U G , t + P C E S S c h , t + P e l e c , t ,   t
The logical constraints in (5)–(12), respectively, hinder the simultaneous occurrence of the bidirectional power exchanges, respectively, for the upstream grid and residential community in CESS charging and discharging conditions, the households, residential community and the electrolyzer and FCEV discharging operation.
P U G 2 R C , t N u 1 , t u g r i d , t ,   t
P R C 2 U G , t N ( 1 u 1 , t ) u g r i d , t ,   t
P C E S S d i s c , t N u 2 , t ,   t
P C E S S c h , t N ( 1 u 2 , t ) ,   t
P H 2 R C t o t , t N u 3 , t ,   t
P R C 2 H t o t , t N ( 1 u 3 , t ) ,   t
P F C E V d i s c h t o t , t N u 4 , t ,   t
P e l e c , t N ( 1 u 4 , t ) ,   t
Equations (13)–(15) represent the model for the CESS unit. Here, the state-of-energy variation in the CESS is given by (13), considering the discharging and charging power variations as well as efficiencies and time granularity. Equation (14) initiates the state-of-energy value of the CESS at the starting time while the mentioned state-of-energy value is lower and upper bounded by (15).
S o E C E S S , t = S o E C E S S , t 1 + P C E S S c h , t Δ T C E P C E S S d i s c , t Δ T D E ,   t > 1
S o E C E S S , t = S o E C E S S i n i t ,   i f   t = 1
S o E C E S S m i n S o E C E S S , t S o E C E S S m a x ,   t
The local power balance in the residential community, together with the bi-directional power exchanges with the upstream grid, is ensured by (16). The power balance within each household is given in (17), while (18) presents the breakdown of the residential demands into totally inflexible and resiliency-sensitive loads. The mentioned resiliency-sensitive loads are also inflexible during normal operating conditions and are just activated during abnormal operating conditions. The change in power profile in such loads is represented by (19). The activation of these loads is only possible during abnormal operating conditions, ensured by (20).
P H 2 R C t o t , t + h P b u y , h , t = P R C 2 H t o t , t + h P s e l l , h , t ,   t
P P V , h , t + P b u y , h , t = P s e l l , h , t + P t o t a l l o a d , h , t ,   h , t
P t o t a l l o a d , h , t = P i n f l e x l o a d , h , t + n P r s l o a d , h , n , t ,   t
P r s l o a d , h , n , t = k h , n , t P r s l o a d p r o f i l e , h , n , t ,   h , n , t
k h , n , t u g r i d , t ,   h , n , t
The calculation of hydrogen amount produced by the power value directed to the electrolyzer unit is calculated by (21). The hydrogen amount variation within the main hydrogen tank of the residential community is represented in (22), considering the produced hydrogen and the hydrogen demand of the FCEVs. The hydrogen amount in the main tank is initiated as in (23) and bounded by lower and upper limits as in (24).
m H 2 C S p r o d , t = P e l e c , t a H 2 P ,   t
m H 2 C S , t = m H 2 C S , t 1 + m H 2 C S p r o d , t k m F C i n j , k , t ,   t > 1
m H 2 C S , t = m H 2 C S i n i t ,   i f   t = 1
m H 2 C S m i n m H 2 C S , t m H 2 C S m a x ,   t
The total discharging power gathered by FCEVs is calculated as in (25), while the hydrogen consumption at each FCEV regarding this discharging operation is presented as in (26). The supplied, as well as consumed (with VG2 operation), hydrogen values result in a hydrogen amount variation in each FCEV’s hydrogen tank depicted in (27). The hydrogen value at the hydrogen tank of each FCEV is initiated by (28) and lower-upper bounded by (29). Finally, each FCEV is ensured to leave the residential community with a hydrogen level greater than a predefined desired value as in (30).
P F C E V d i s c h t o t , t = k P F C E V d i s c h , k , t ,   t
m H 2 c o n s , k , t = P F C E V d i s c h , k , t a H 2 P ,   k , t
m H 2 , k , t = m H 2 , k , t 1 + m F C i n j , k , t m H 2 c o n s , k , t ,   k , t > T a , k
m H 2 , k , t = m H 2 i n i t , k ,   k , t = T a , k
m H 2 m i n , k m H 2 , k , t m H 2 m a x , k ,   t
m H 2 , k , t m H 2 d e s , k ,   k , t = T d , k

3. Test and Results

The problem of the resiliency-sensitive energy management strategy of a residential community with FCEVs is created through the MILP approach. The proposed structure is tested with the GAMS v.24.1.3 software and CPLEX v.12 solver. Input data and simulation results are presented in the subsections of this section, respectively.

3.1. Input Data

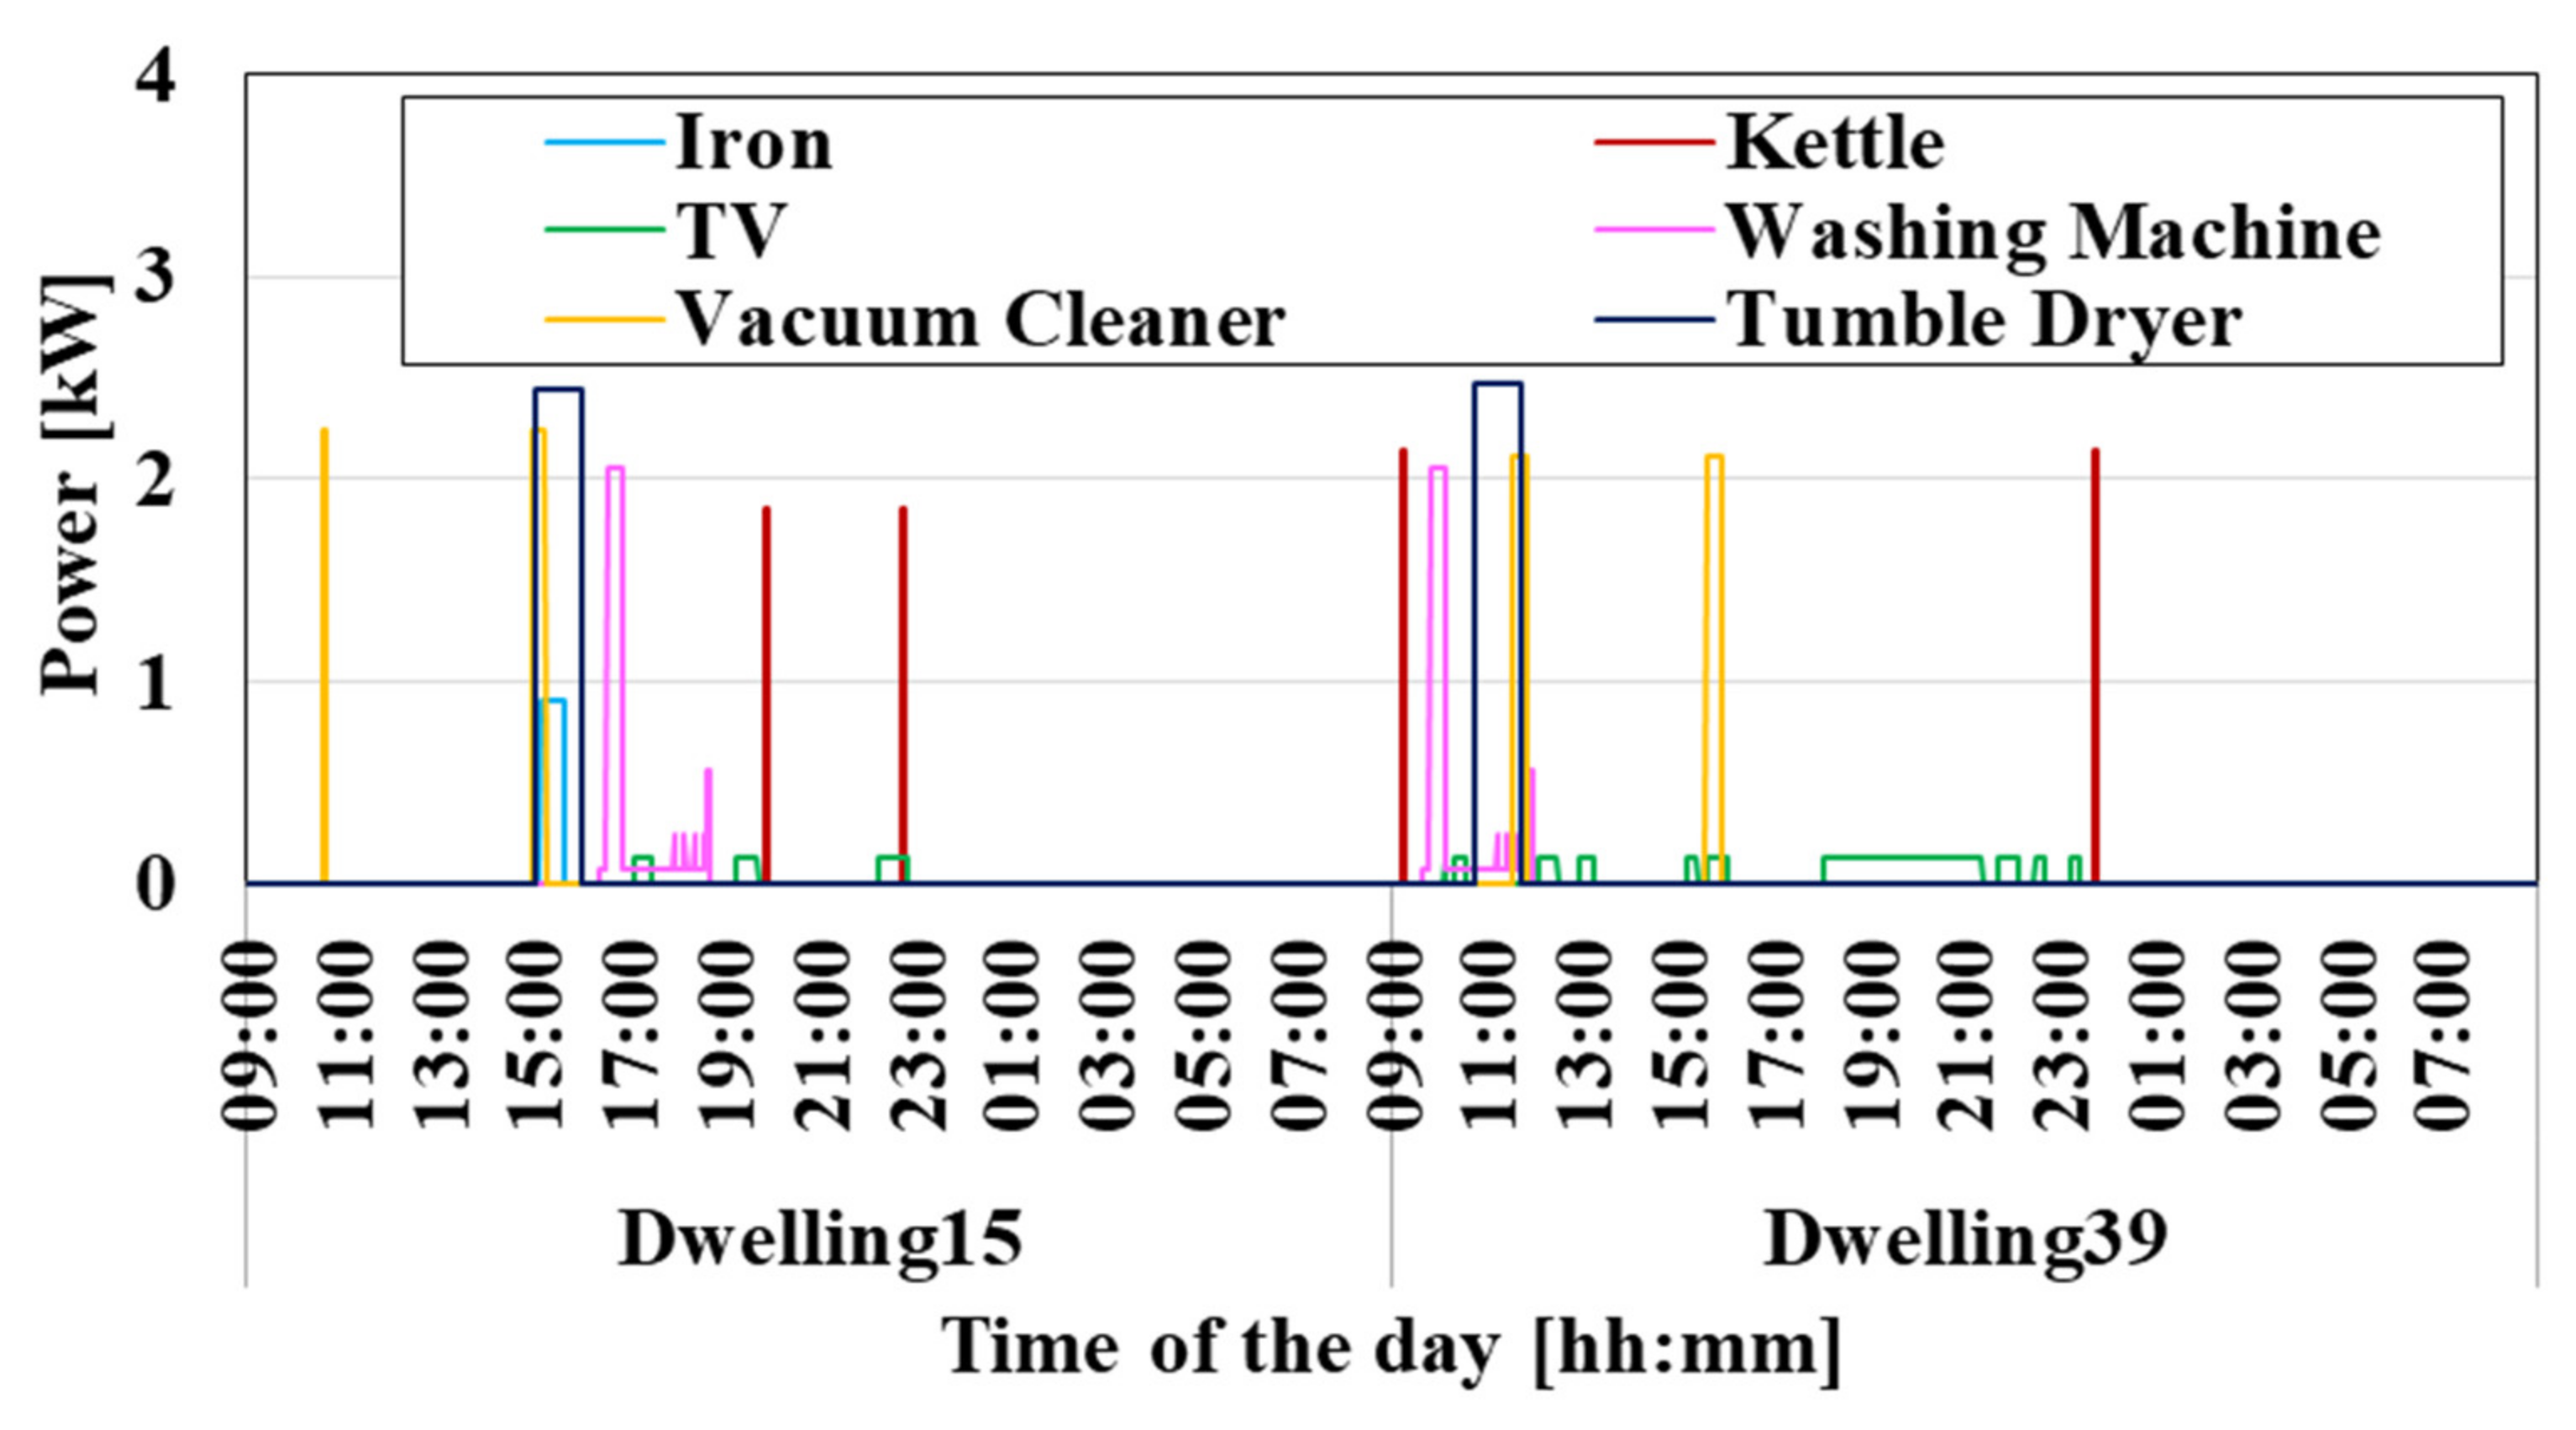
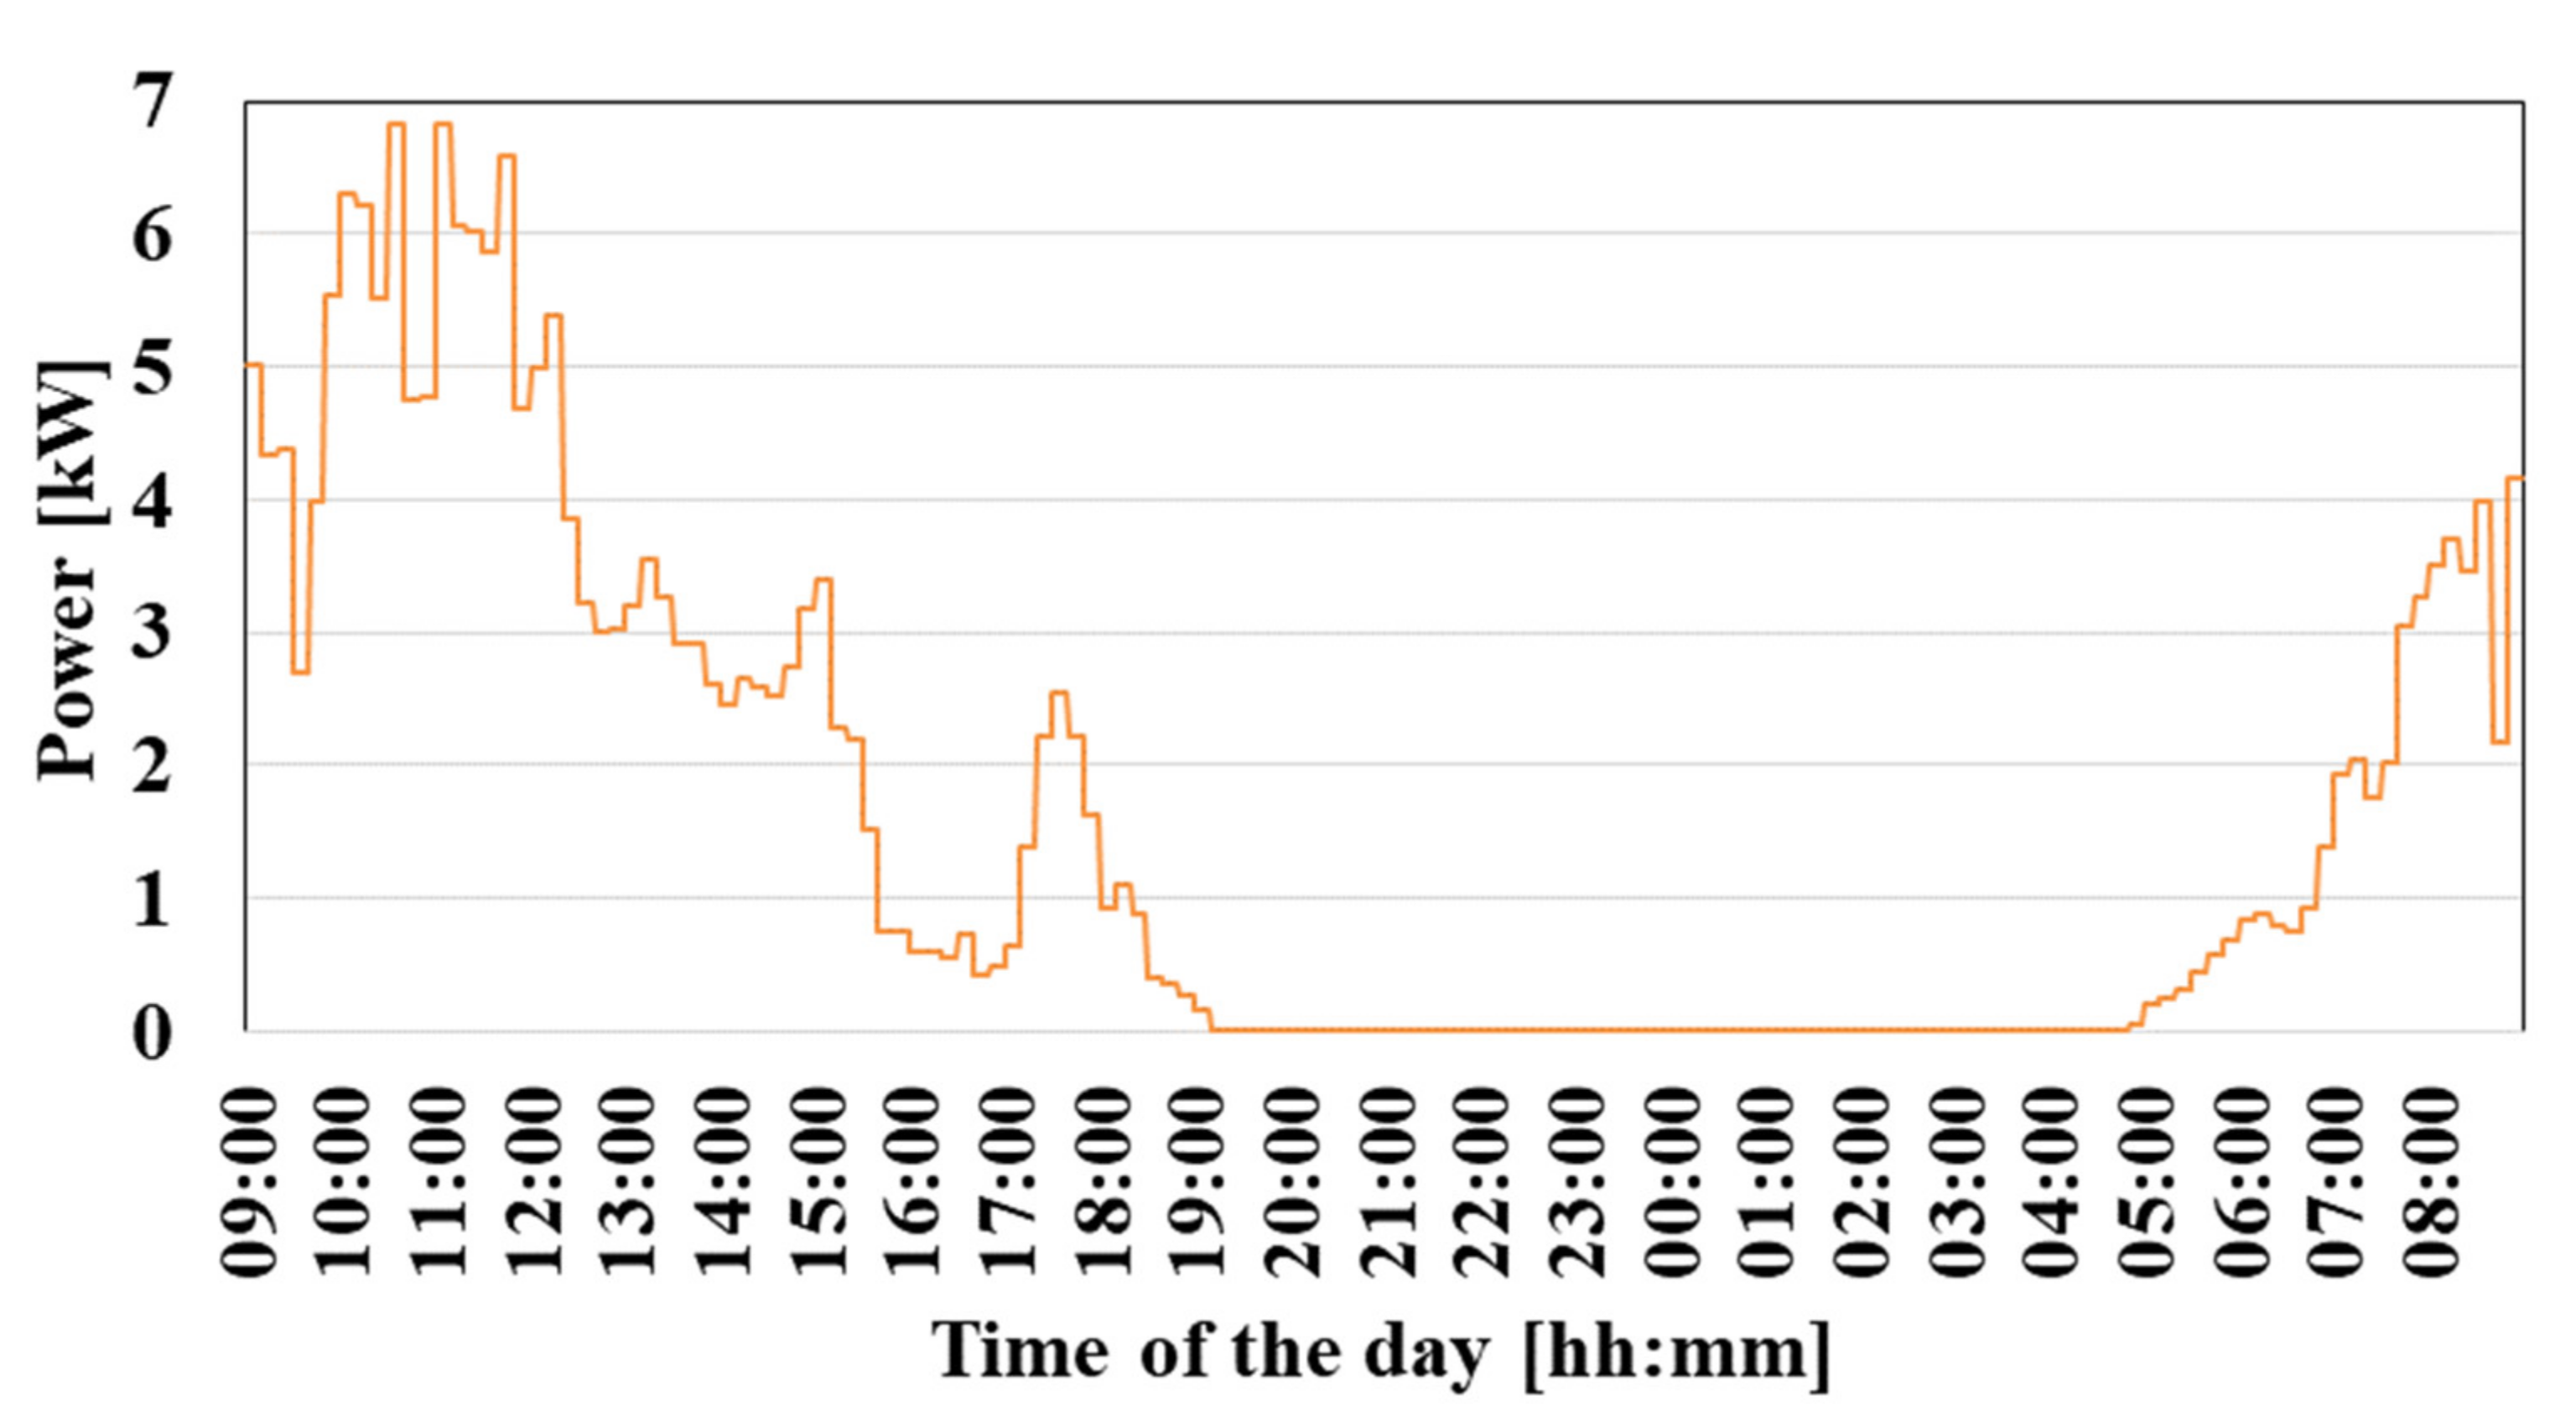
In this study, a community consisting of 40 individual dwellings with different numbers of residents was considered. It was assumed that only one person lives in 5 of these dwellings, 2 people live in 9 of the dwellings, 3 people live in 15 of the dwellings and 4 people live in 11 of the dwellings. It contains two group loads, inflexible and resiliency-sensitive in dwellings. While inelastic loads are priority loads that always need energy, flexible loads are in the category of interruptable loads. It should be underlined that the loads are different for each house. The inelastic load data for dwelling3 (single person), dwelling9 (two residents), dwelling24 (three residents) and dwelling39 (four residents) are presented in Figure 1. Resiliency-sensitive loads in dwellings are iron, kettle, TV, washing machine, vacuum cleaner and tumble dryer. Data on expected resiliency-sensitive load usage for some of the selected dwellings (dwelling15—3 residents and dwelling39—4 residents) are presented in Figure 2. In addition, the expected total load–demand data of the residential community are presented in Figure 3 when there is no power outage.
It is assumed that the residential community purchases energy from the electric power system and sells electrical energy to the grid. For electricity purchasing and electricity selling, the actual data of the Turkish electricity market dated 22 May 2022 in Figure 4 are used in Turkish Liras (TL)/kWh [22]. The community is considered to have a common PV power generation system. The power data produced using the real global radiation data of the same day are presented in Figure 5. When the power generation data were examined, it could be observed that the global radiation data belonged to a cloudy day. Additionally, in each house, there is a PV system that produces 1/25 of the common PV system.
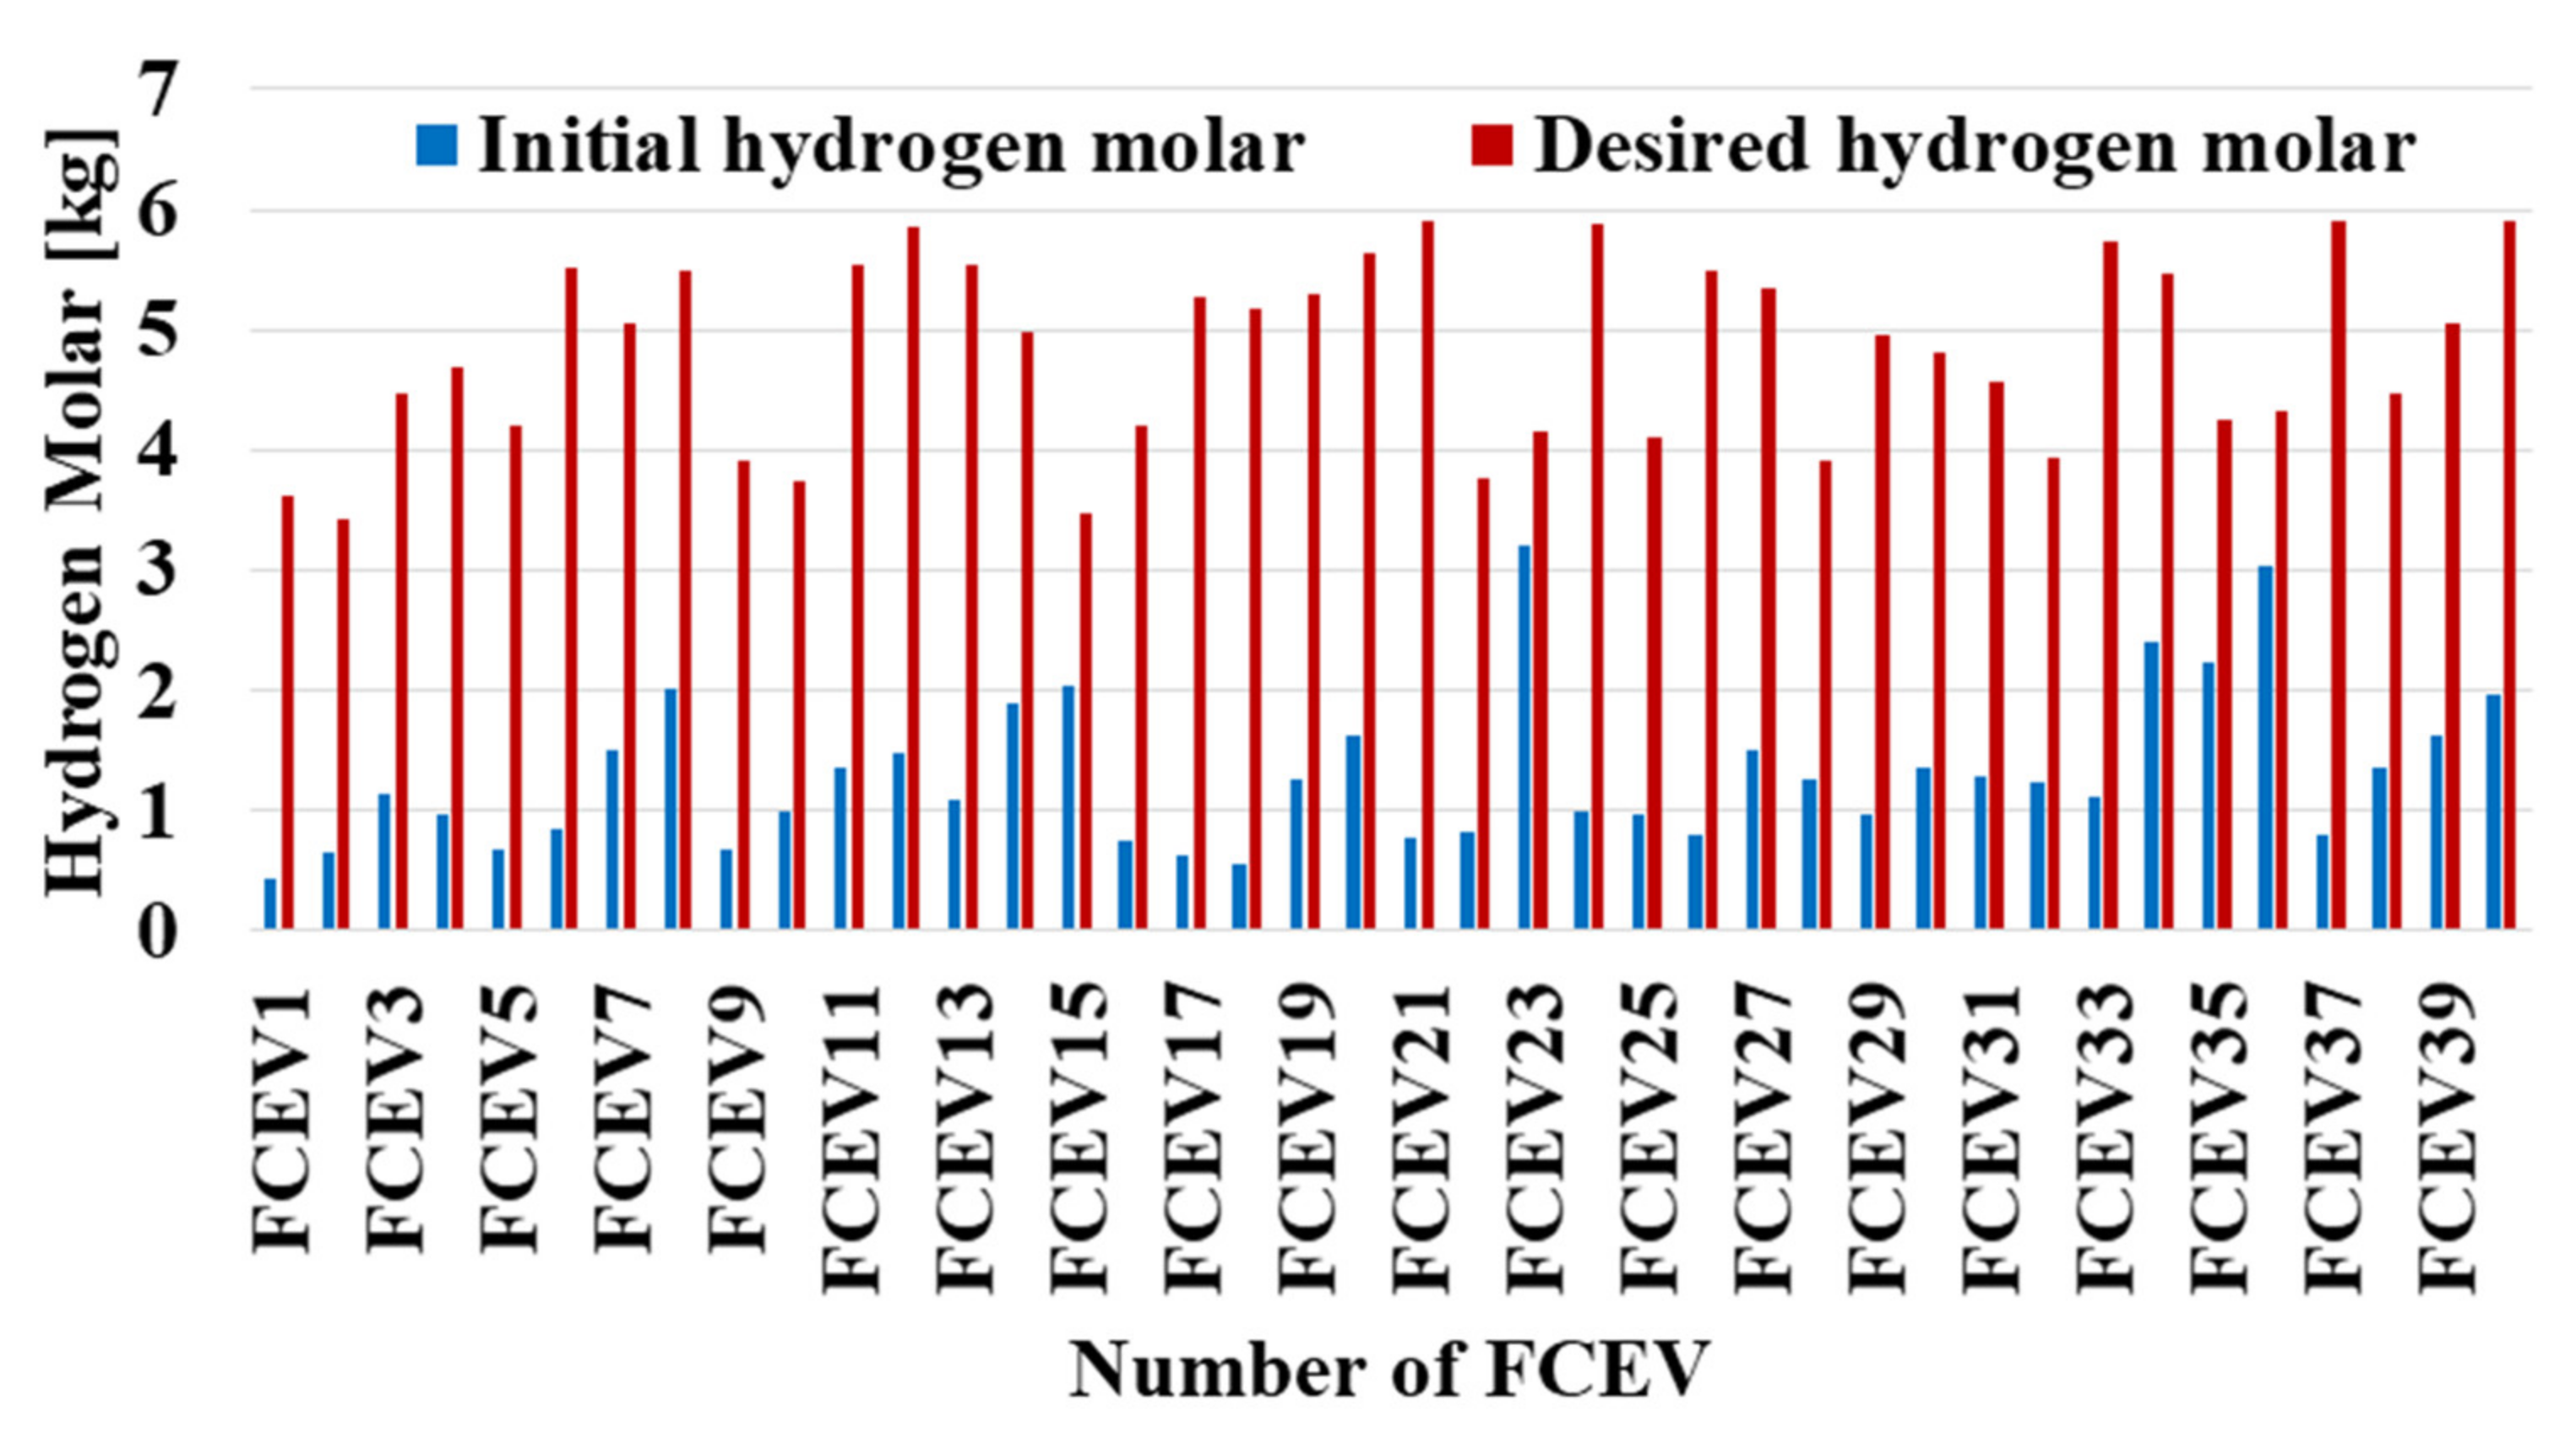
It is assumed that there are 40 FCEVs in the community. Data on the hydrogen molar amount in the hydrogen tanks at the time each FCEV arrives at the residential community and desired hydrogen molar amounts of FCEVs are shown in Figure 6. Additionally, it should be stated that the tank volume of FCEVs is 5.9 kg, while a H 2 P is taken as 1.25 × 10⁻⁴ (considering time resolution). The hydrogen molar amount for hydrogen exchange in FCEVs is determined as 2 kg for one minute period.
Data on the arrival and departure times of 40 FCEVs are presented in Table 2. Additionally, the technical characteristics of CESS owned by the community are presented in Table 3, while the features of the common hydrogen storage unit are given in Table 4. It should also be stated that the common hydrogen storage system is equal to its initial value in the final period. The maximum power consumption of the electrolyzer is 100 kW. The time period in the study is determined as one minute.

3.2. Simulation Results and Comparison

In order to demonstrate the effectiveness of the proposed optimization model, ten case studies were realized. The data relating to the test studies carried out are given in Table 5. These test studies are operated by changing the value of binary parameters A and B, availability of PV, CESS and from FCEVs to the residential community mode. It is thought that the power grid was not available between 17:30 and 19:30 in all test studies.
Results from the simulations realized are presented in Table 6. It should be stated that the costs incurred in Case-1, Case-3, Case-5, Case-7 and Case-9, which are carried out for cost minimization purposes, are increasing gradually from Case-1 to Case-9. The minus expression here means that the community is making a profit. In Case-7 and Case-9, a fee is paid for electrical energy taken from the power grid. If it is compared to Case-1 and Case-3, the gain is reduced by USD 179.46 without the support of FCEVs to the residential community mode. It should be stated that the cost is highest in the absence of CESS and PVs, but CESS has a great effect on this result. In this respect, CESS is a more effective tool than the FCEV V2G mode and PV system. In each case study, where the cost is minimized, 16,206 kWh interruptions occur in interruptable loads. In the curtailment minimization problem, it was concluded that there is an amount of interruption (4271 kWh) in the resiliency-sensitive loads when CESS is not included. Considering the low number of dwellings and the fact that the flexible loads are in operation or not during the hours of a power grid outage, this can be expressed as the reason for the low amount of interruption. In Case-2, Case-4, Case-6 and Case-8, where curtailment minimization is aimed, the community does not make a profit and makes a payment. By considering both cost and curtailment minimization, it should be underlined that the best results are obtained in the proposed structure. However, if no interruption in the load is desired, the community must make a payment in addition to making a profit.
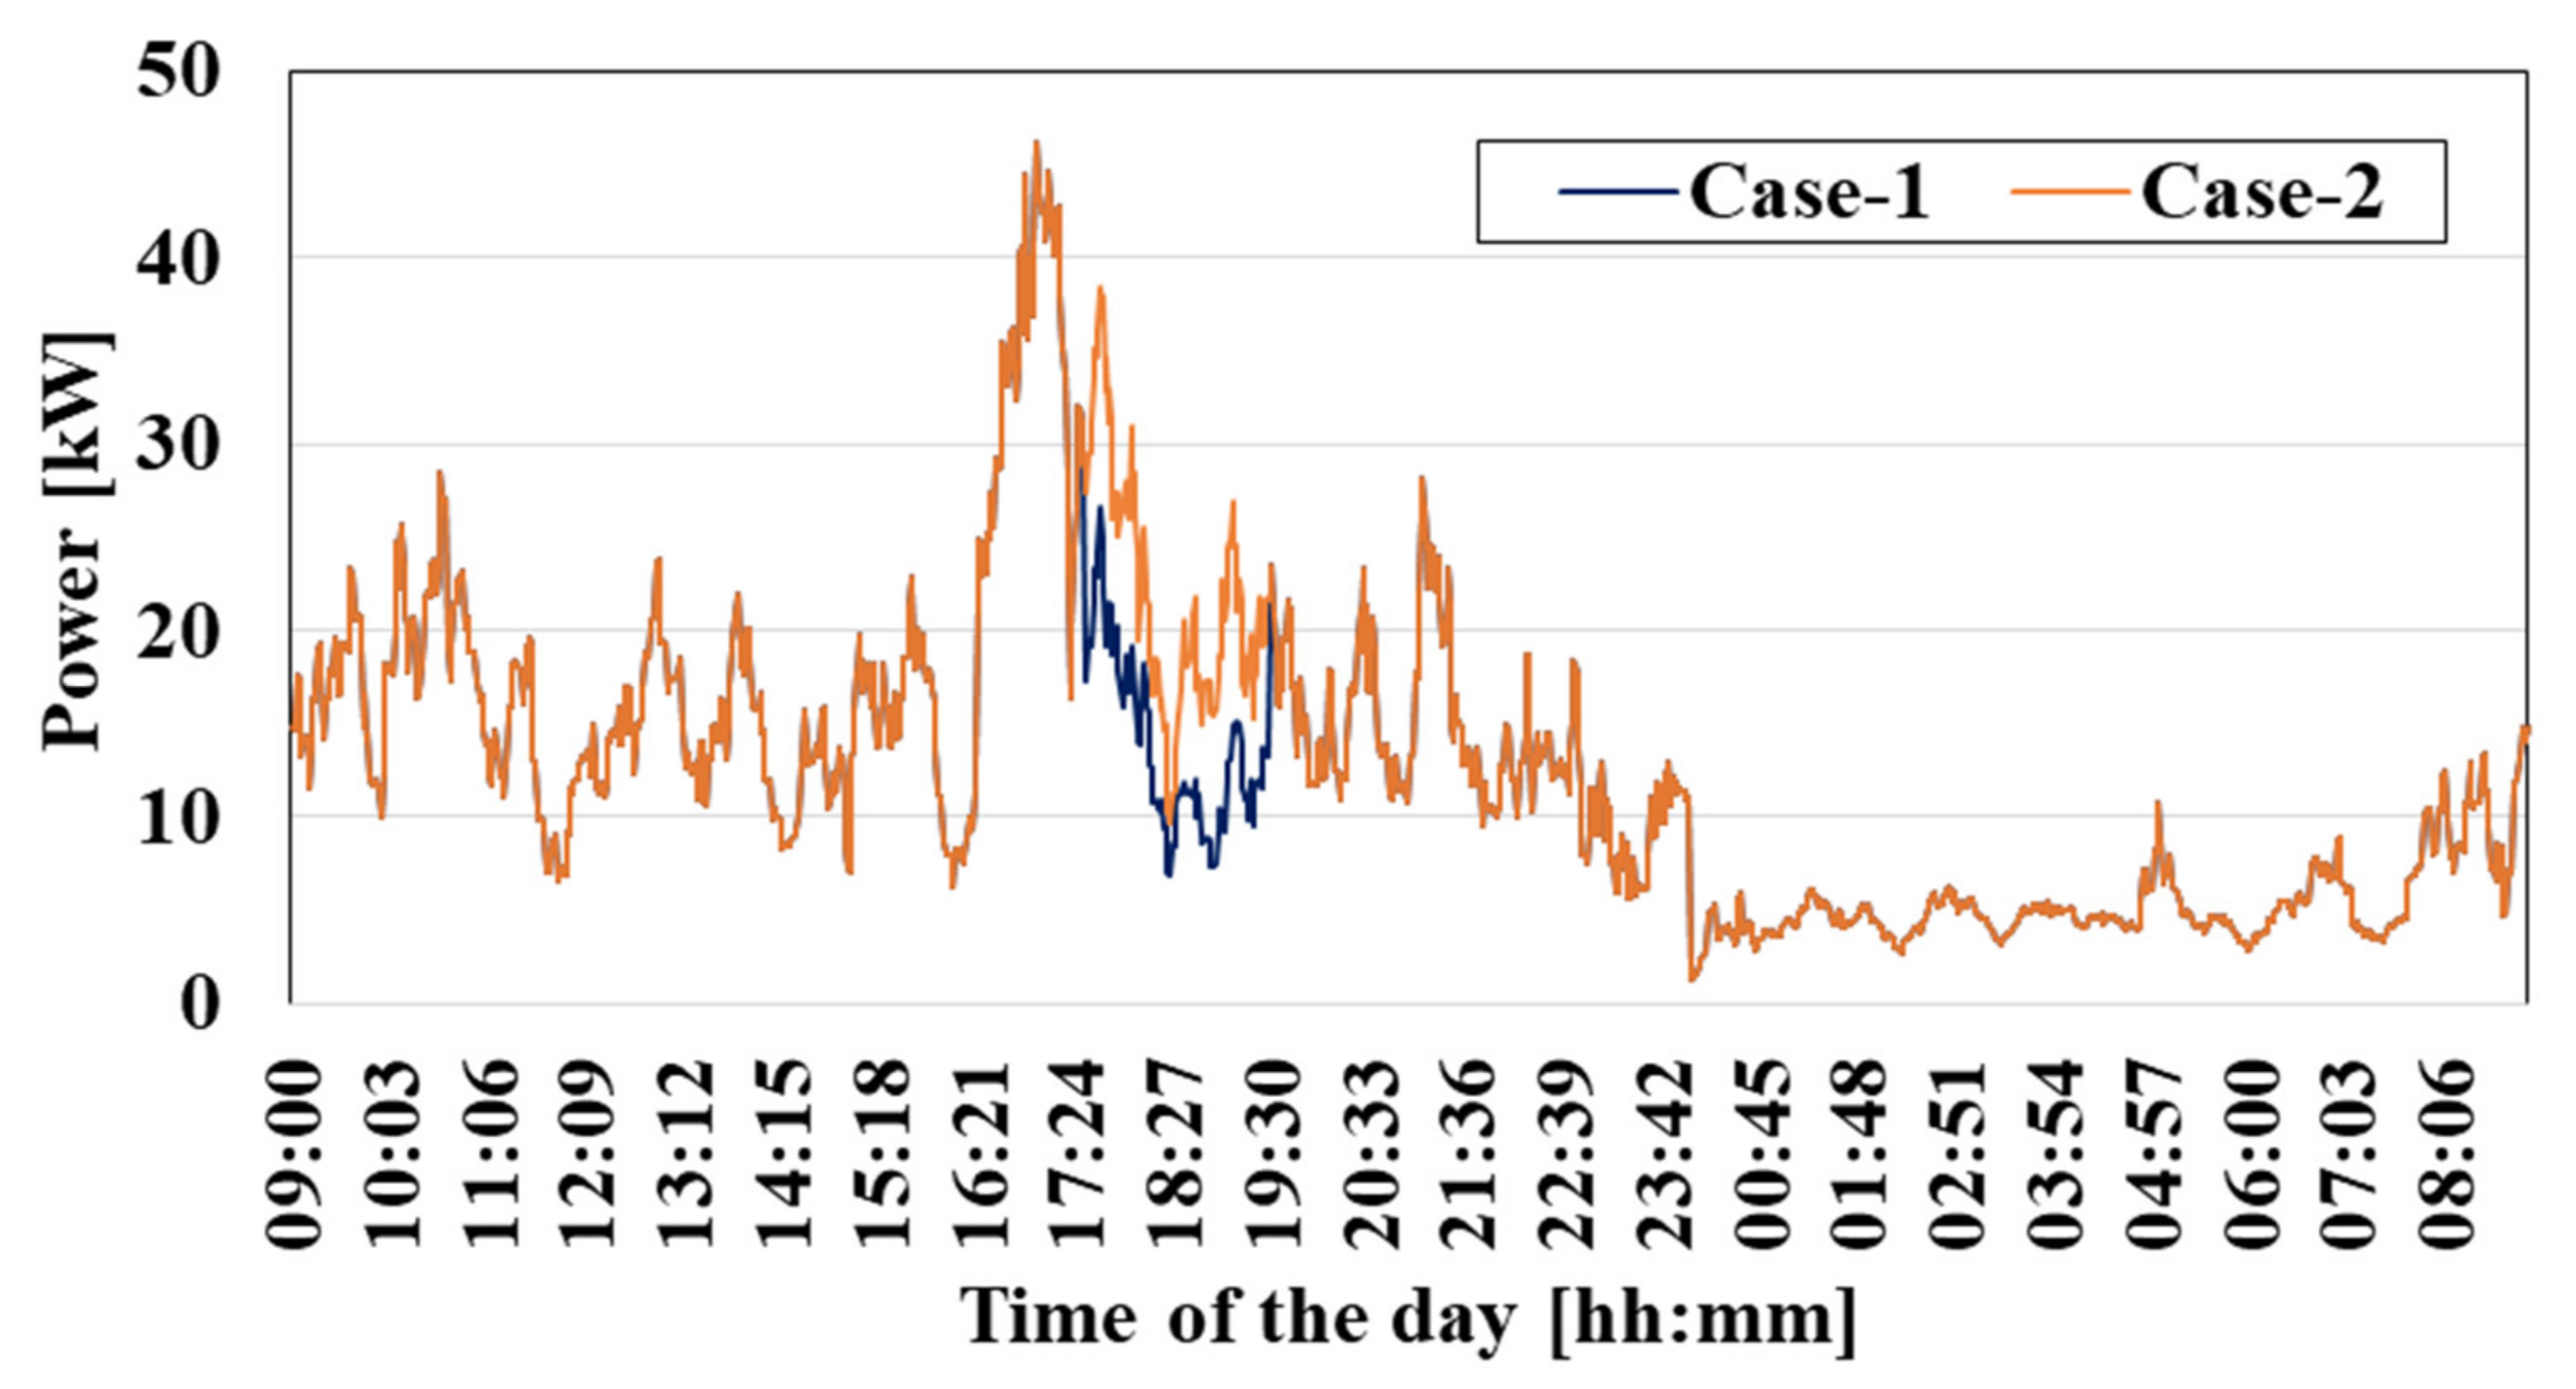
The total power consumption of 40 dwellings in Case-1 and Case-2 are presented in Figure 7. In Case-1, where the cost is minimized, the total amount of power purchased from the grid is reduced during the hours of a power outage, as resiliency-sensitive loads are cut in order to reduce the total cost. Here, power is supplied to the residential community from FCEVs. In Case-2, where the total amount of curtailment is minimized, the community is operated without any interruptions. Here, the power usage is the same as the expected power consumption. It should be stated that energy is provided by CESS and FCEVs in case there is no energy provided in the power grid. As a result, it is seen that resiliency-sensitive loads are de-energized in economic operation, while there is no curtailment in Case-2. It should be stated that approximately 16.21 kWh (all of the loads) of power outage occurred in Case-1. In order to save from such a value of the resiliency-sensitive load, as can be seen in Table 5, the community enters a position to pay while making a profit.
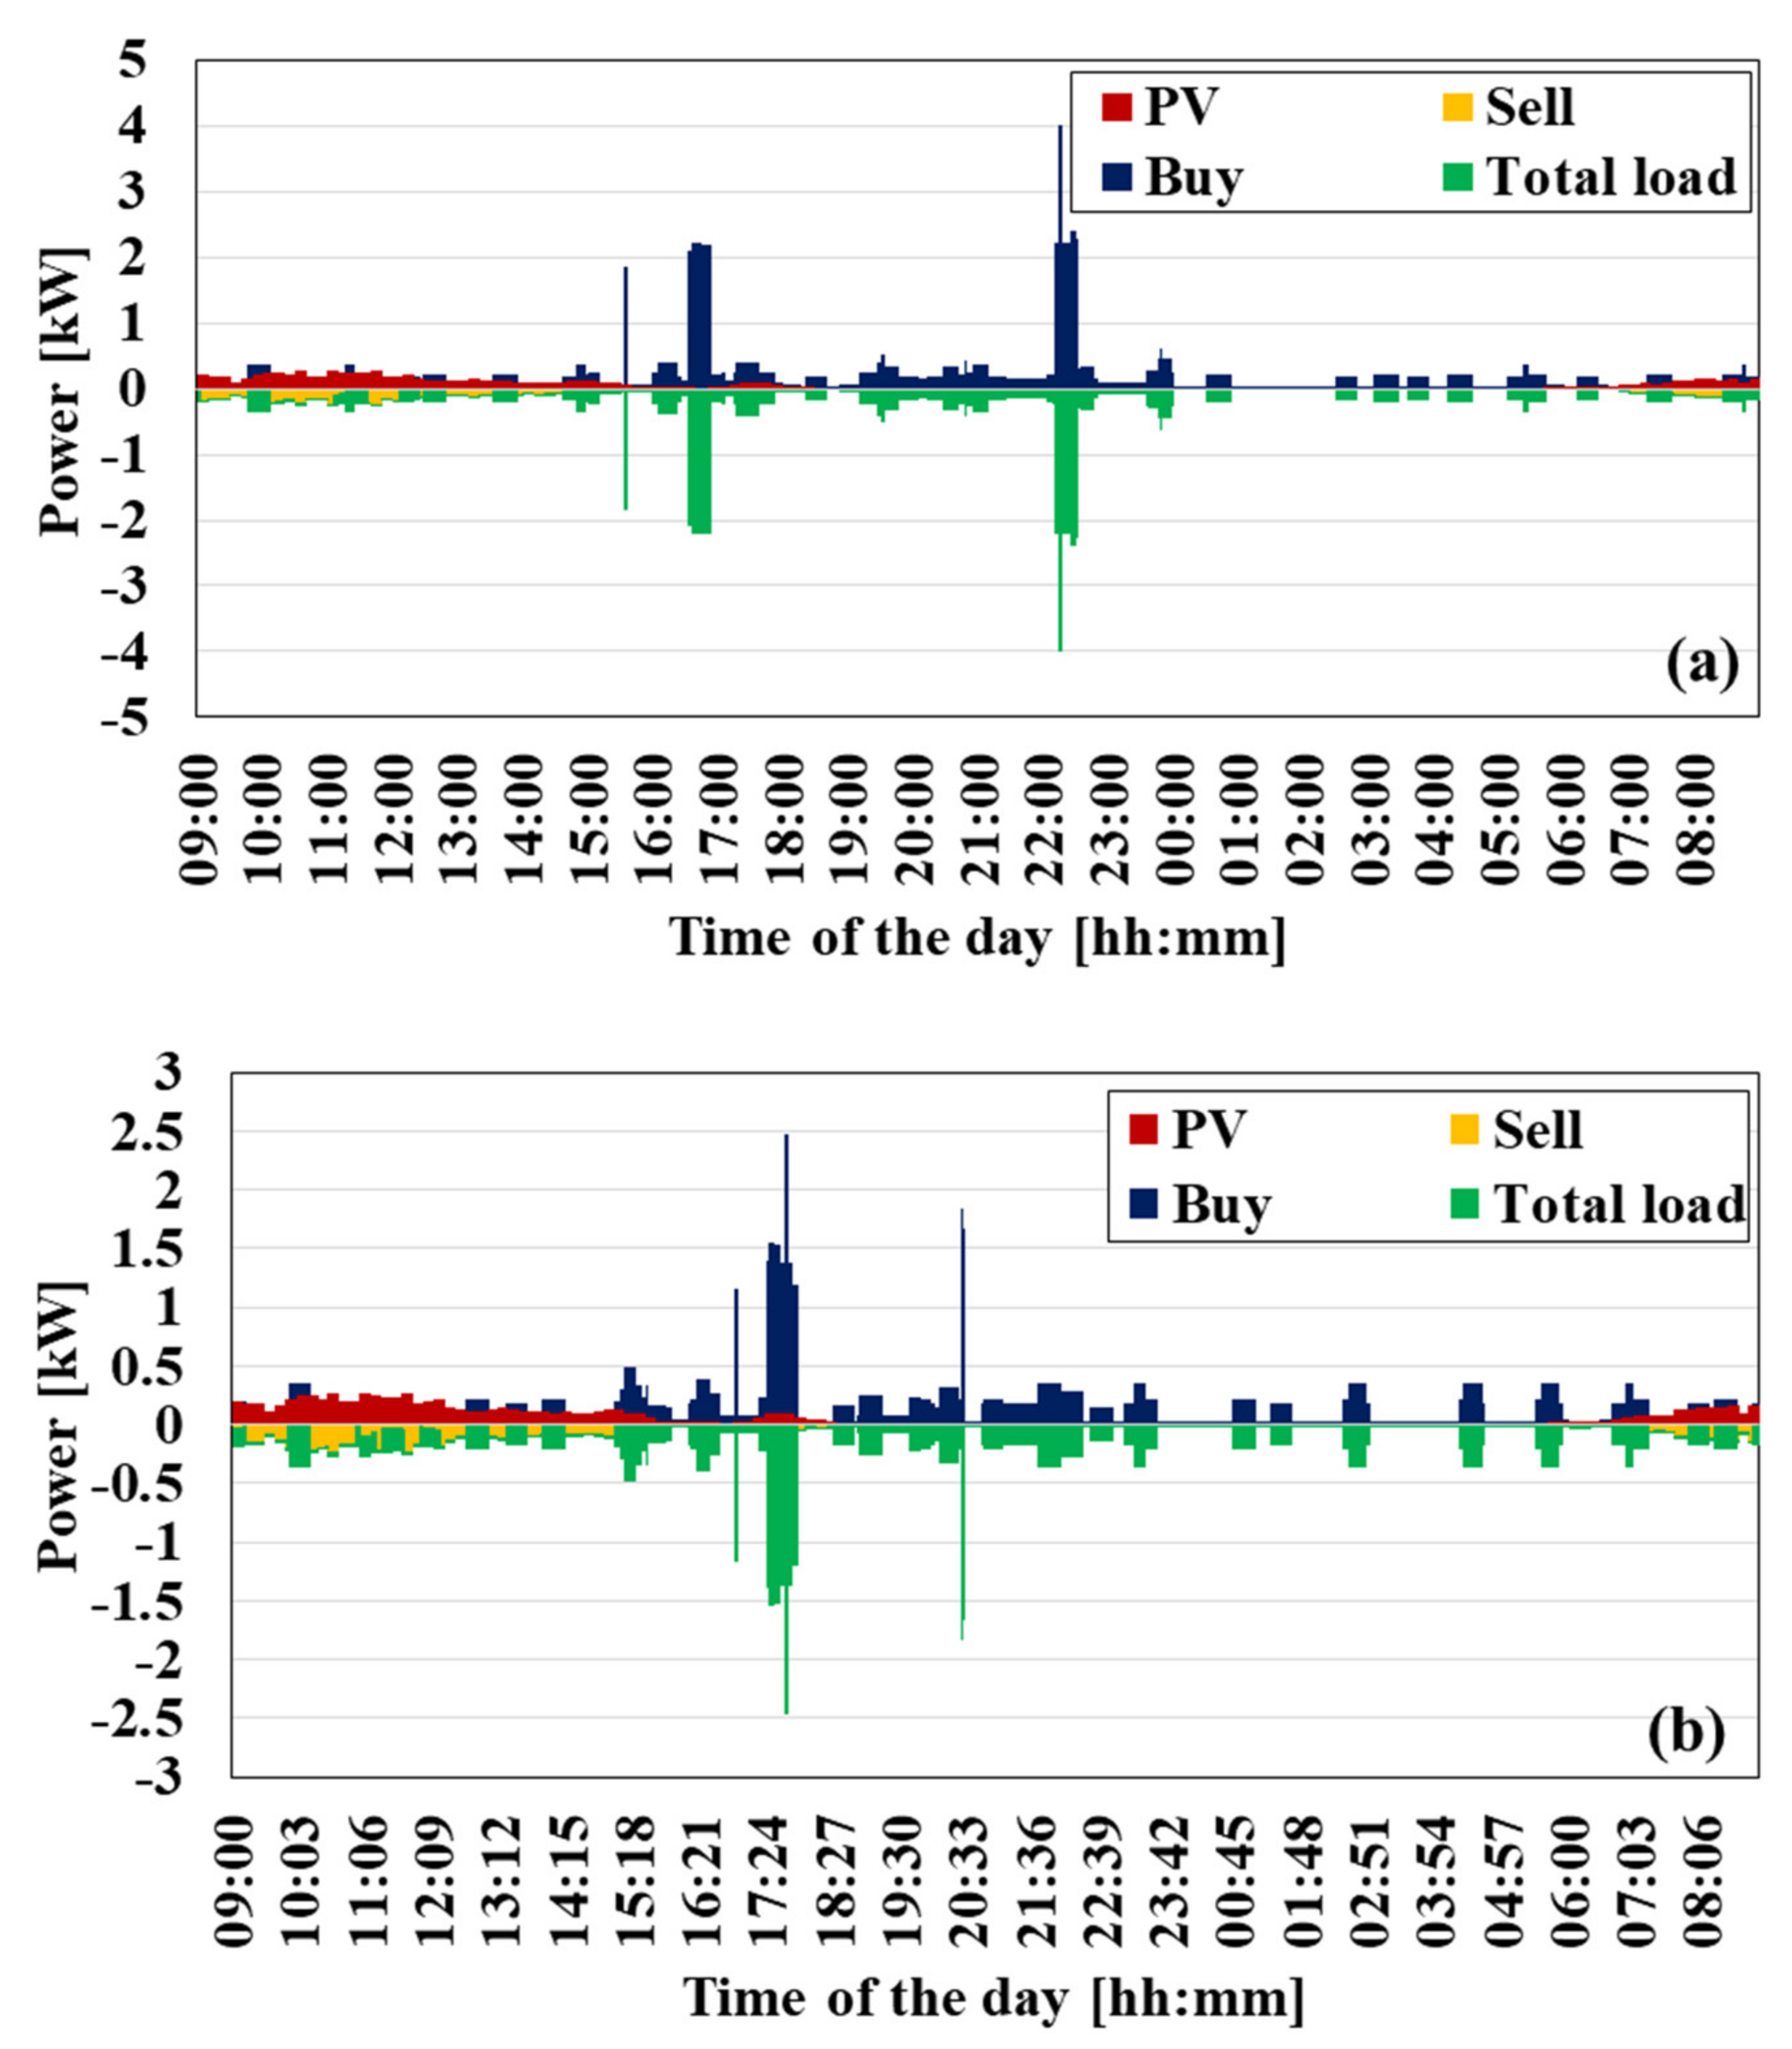
The power balance of dwelling25 and dwelling27 is given in Figure 8. Here, the PV productions are primarily evaluated at dwellings. Then, excess power is sold to the residential community. Due to the relatively small size of the PV capacity, approximately 1.51 kWh of energy is produced throughout the day. Dwelling25 and dwelling27 have an energy consumption of 5.05 and 4.04 kWh, respectively. During the day, 0.61 kWh and 0.56 kWh of energy are sold to the community, respectively, while 4.15 kWh and 3.08 kWh of energy are purchased from the community.
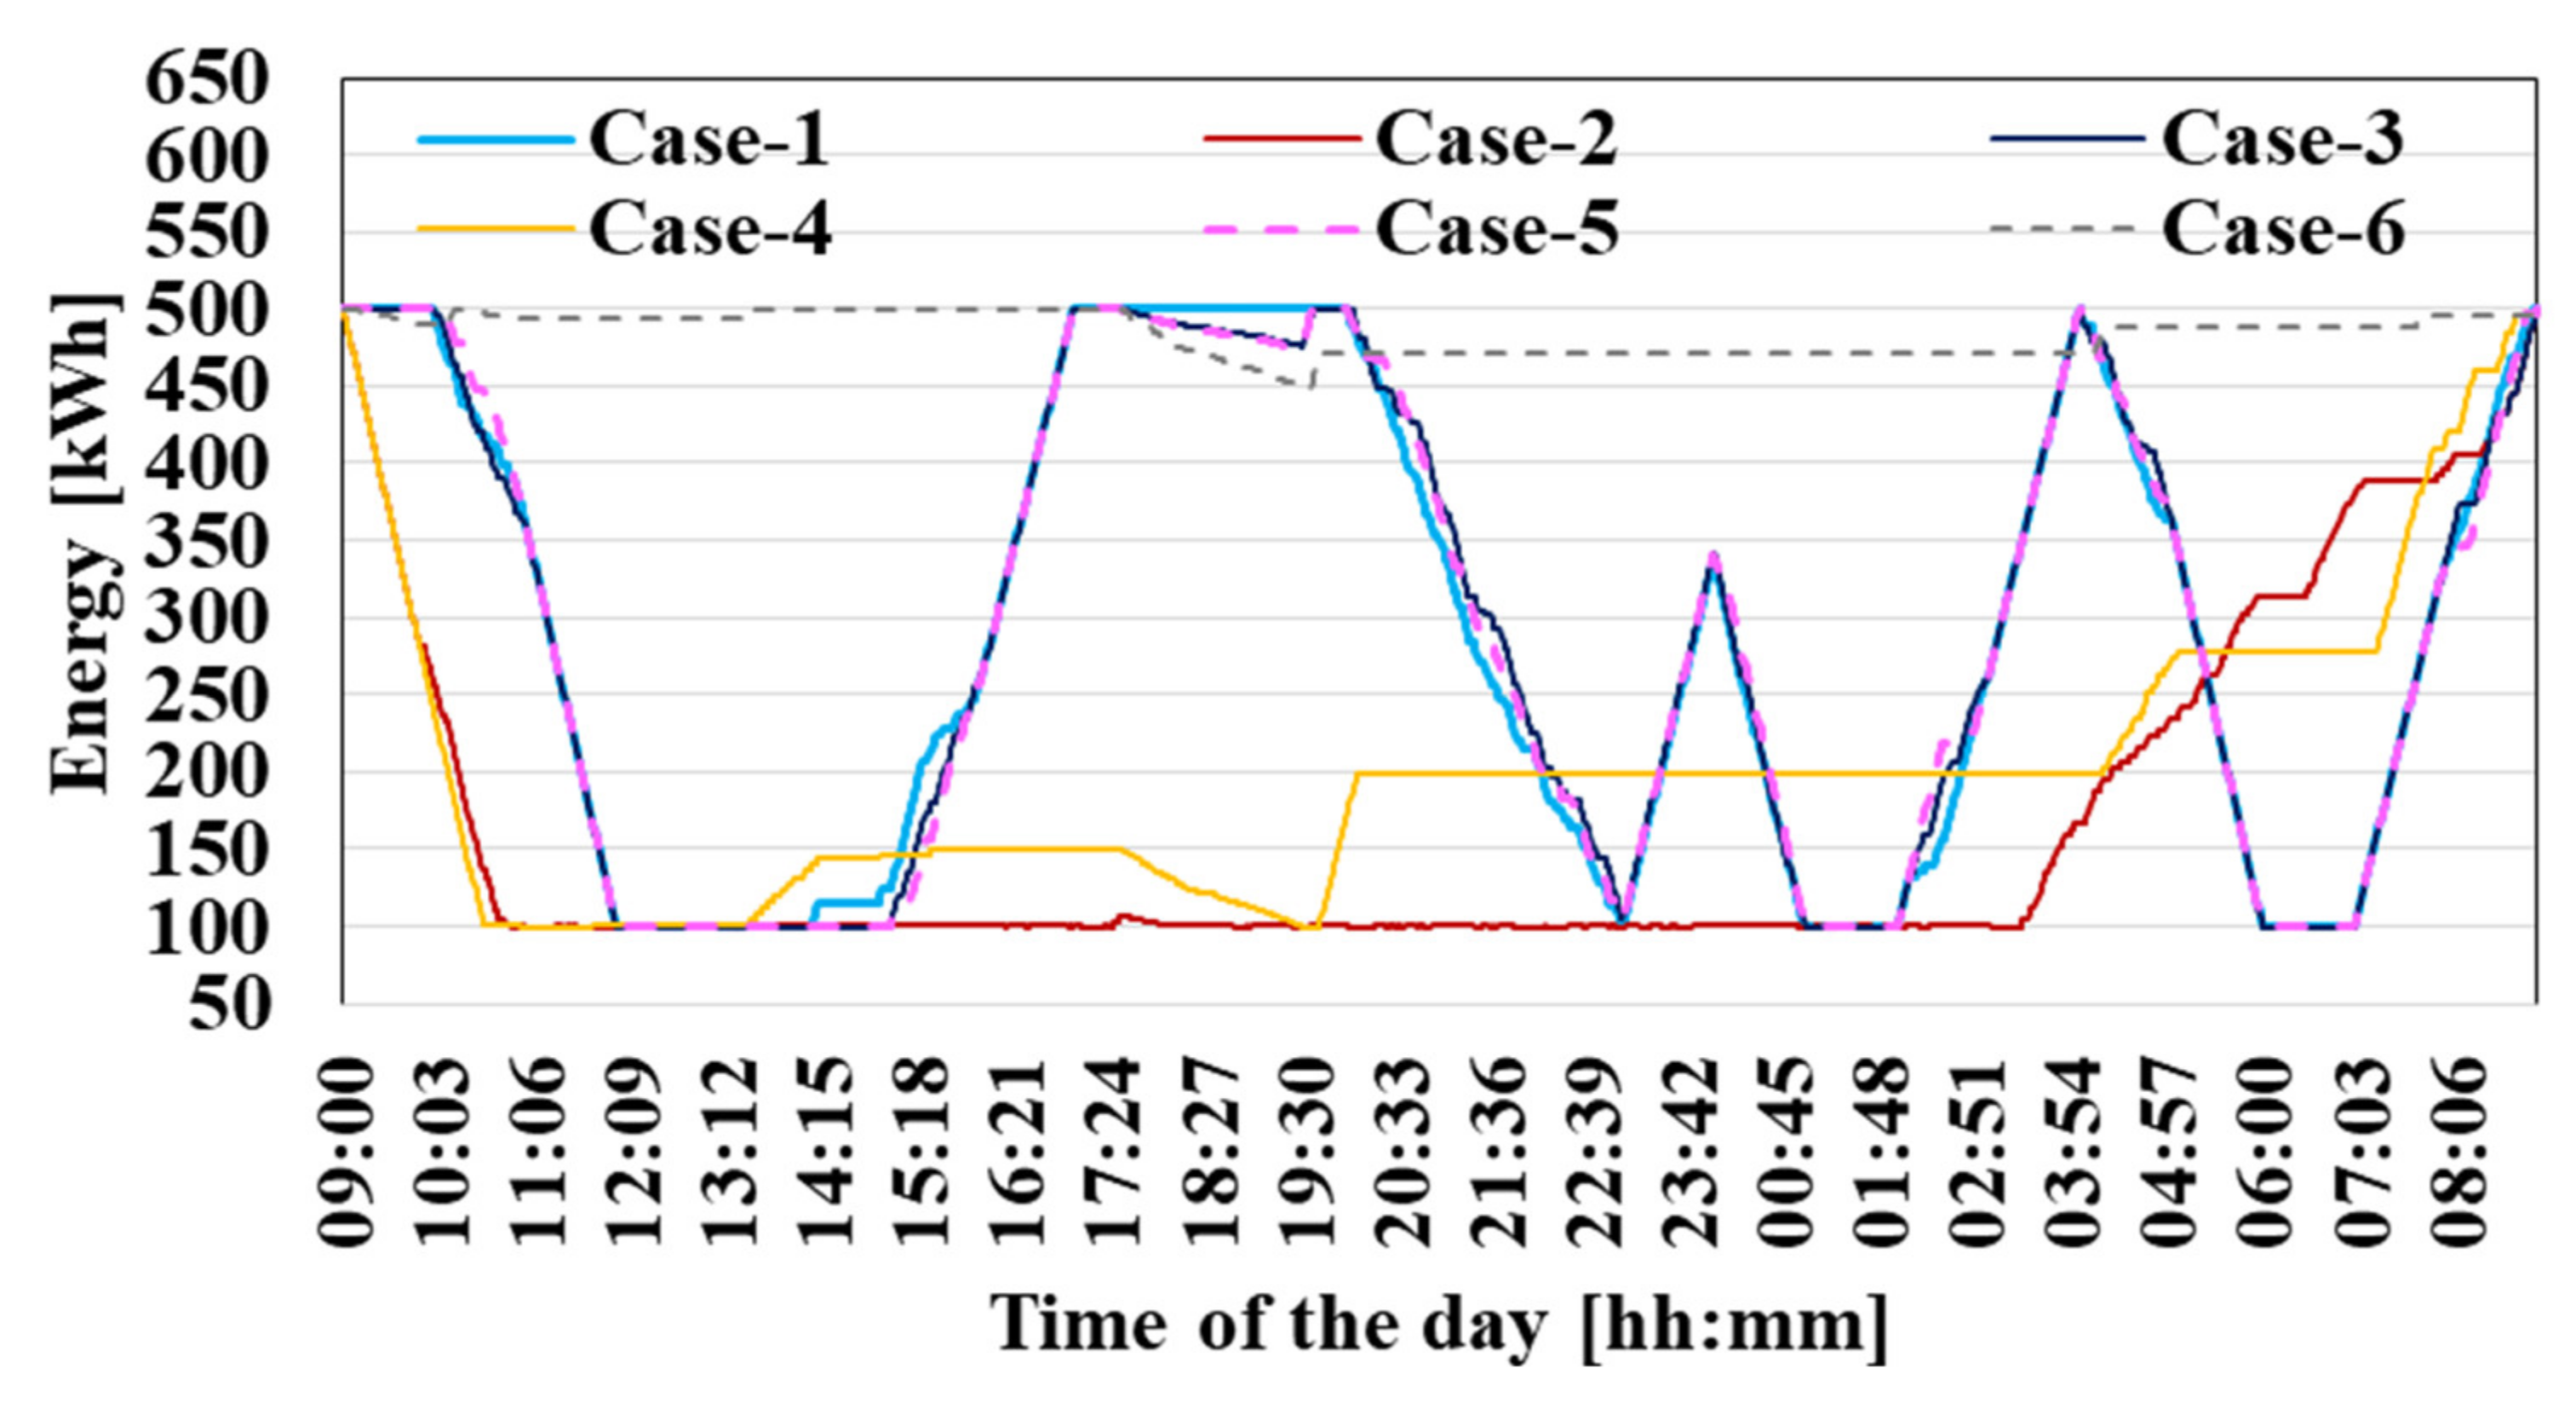
Figure 9 presents the energy change in the common CESS owned by the community throughout the day. All case studies involving CESS were reviewed here. While comparing Case-1 and Case-2, which have different objective functions, CESS is less evaluated in Case-2, where the aim is only to reduce curtailment. In Case-1, where economic operation is provided, CESS is used more effectively, reducing costs. Case-3 and Case-5, where there is no energy support from FCEVs and no PVs, are slightly different from Case-1. However, in Case-6, where the curtailment is minimized, and there is no PV system and FCEV support, the energy change in CESS takes place very little during the day. An interesting result here is that CESS is not evaluated much during the hours of a mains power outage.
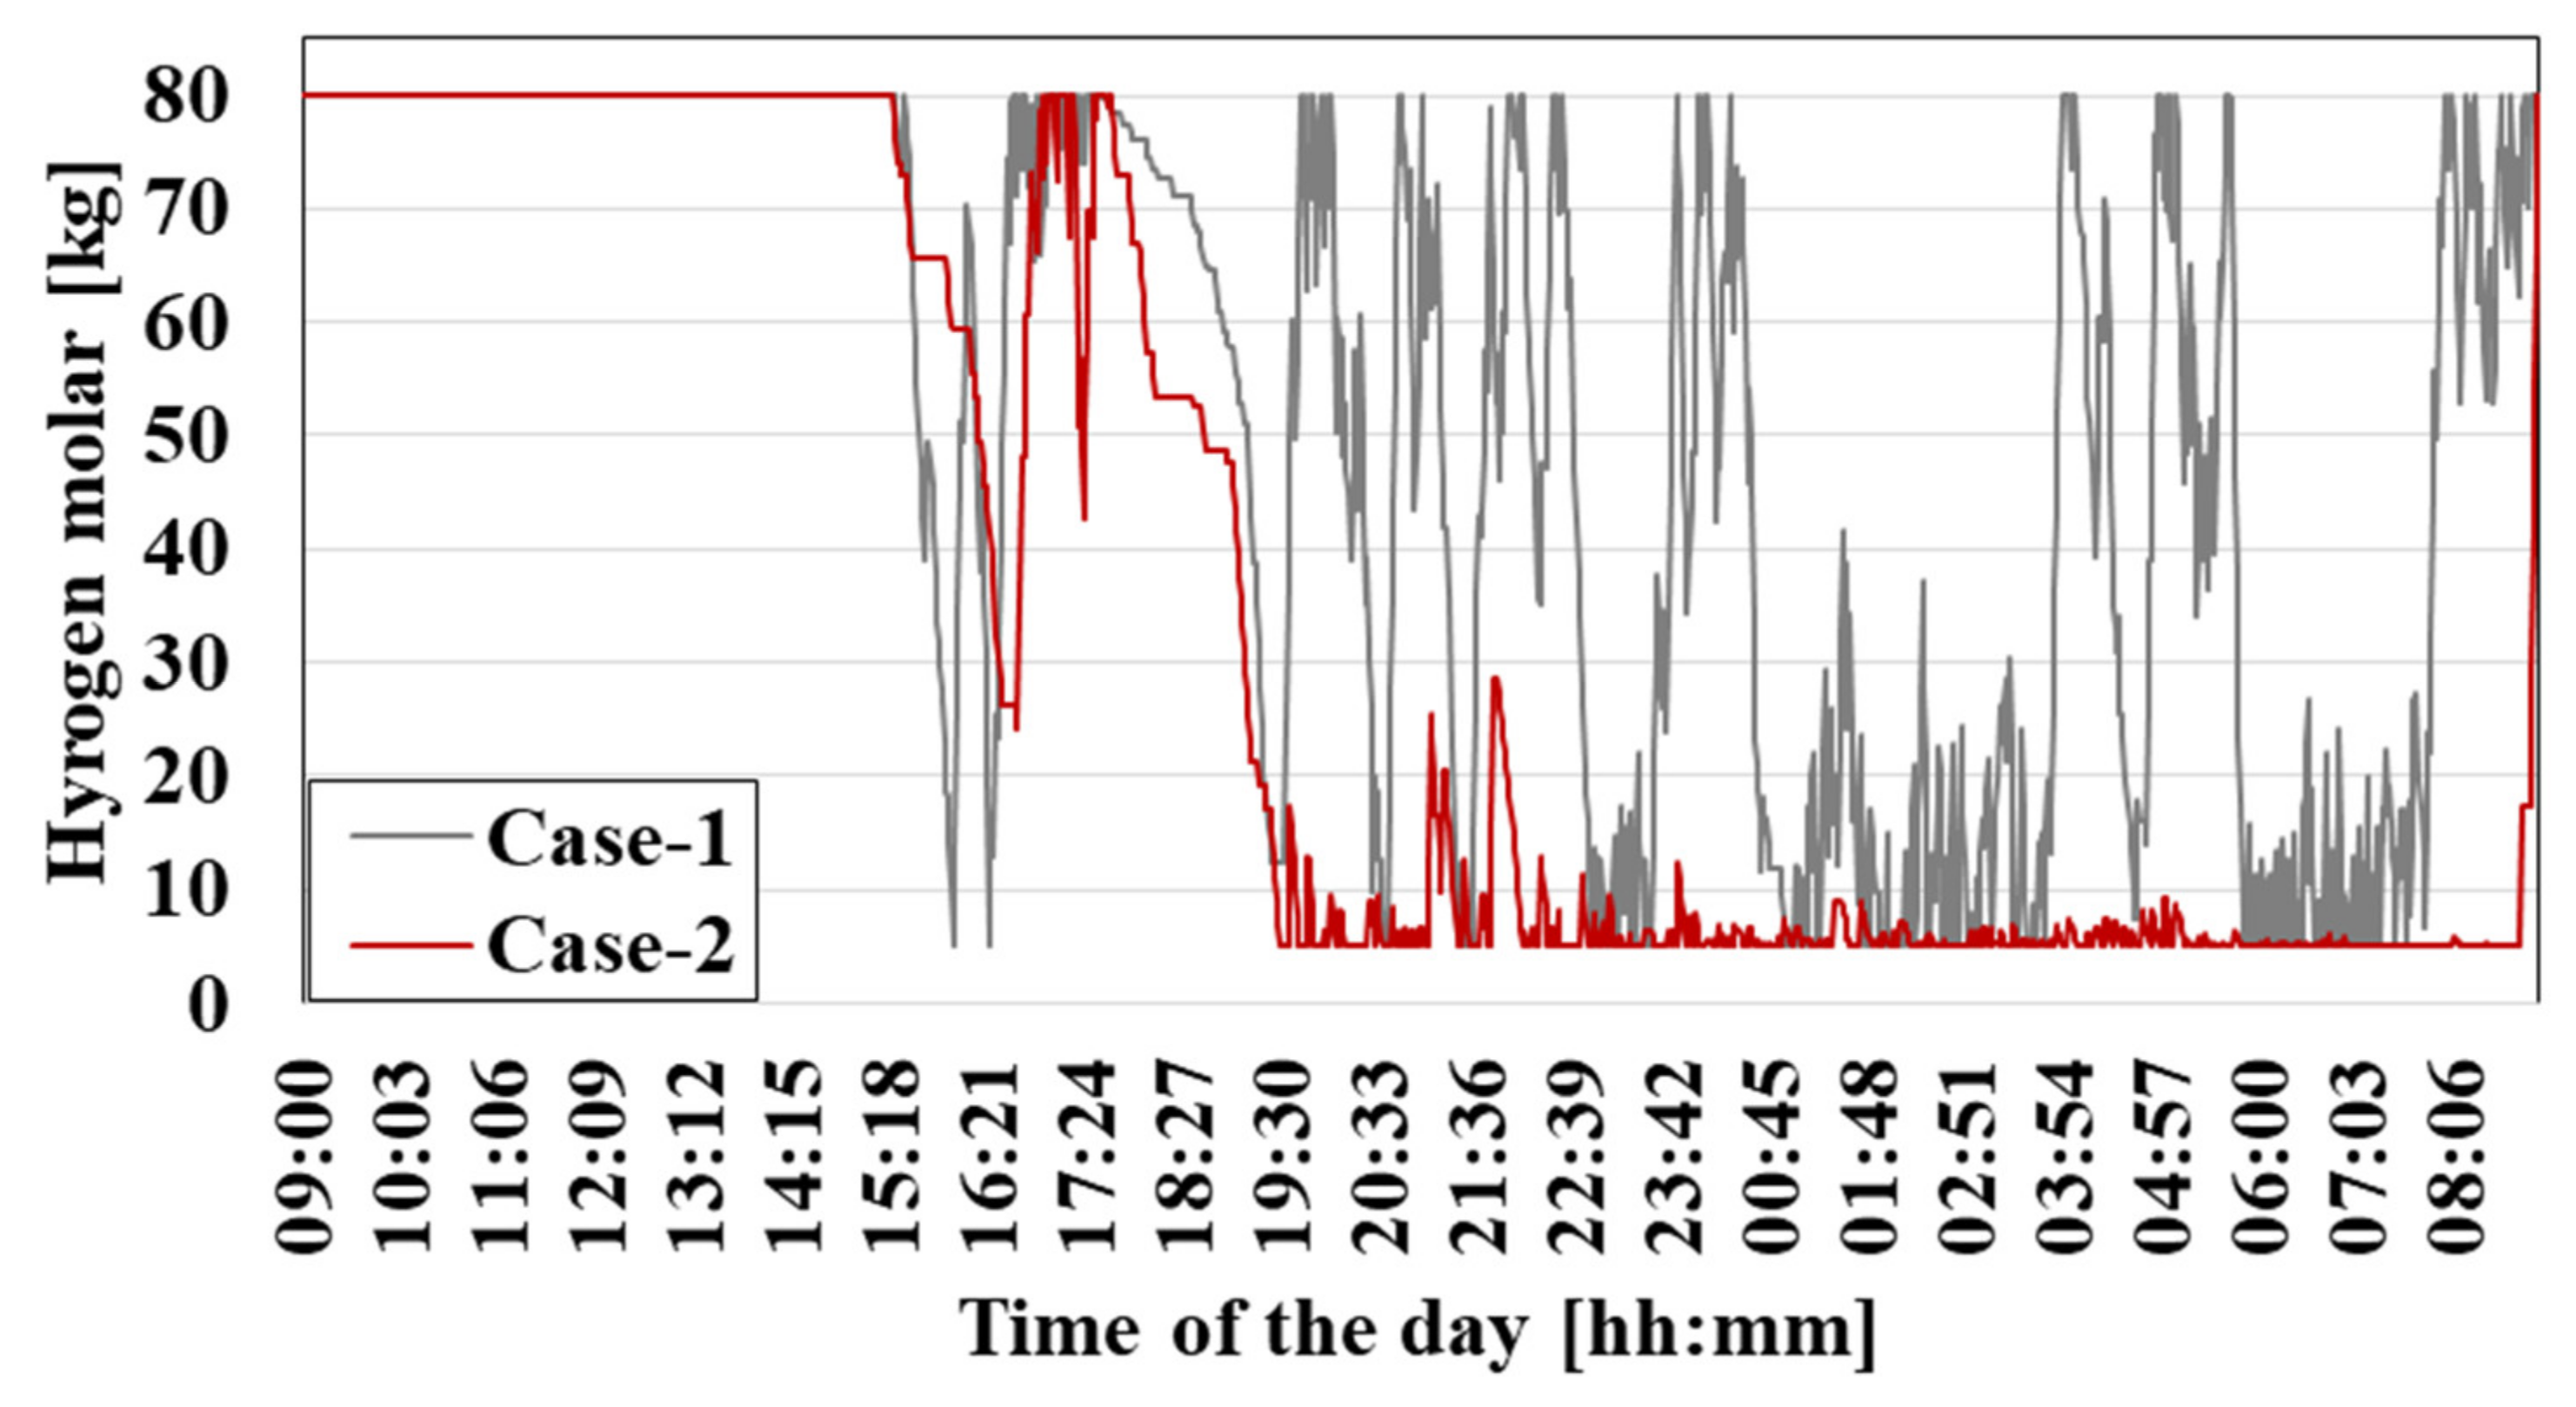
The variation in the hydrogen molar amount in the common hydrogen storage system is discussed in Figure 10. When Case-1 and Case-2 are compared, as in CESS, it can be said that hydrogen exchange is less in Case-2. Hydrogen refueling and releasing events occur more frequently in Case-1, where economical operation is performed. It should be noted here that FCEVs offer greater energy support to the residential community. In both case studies, it is concluded that the hydrogen molar amount decreases significantly during power outage times.
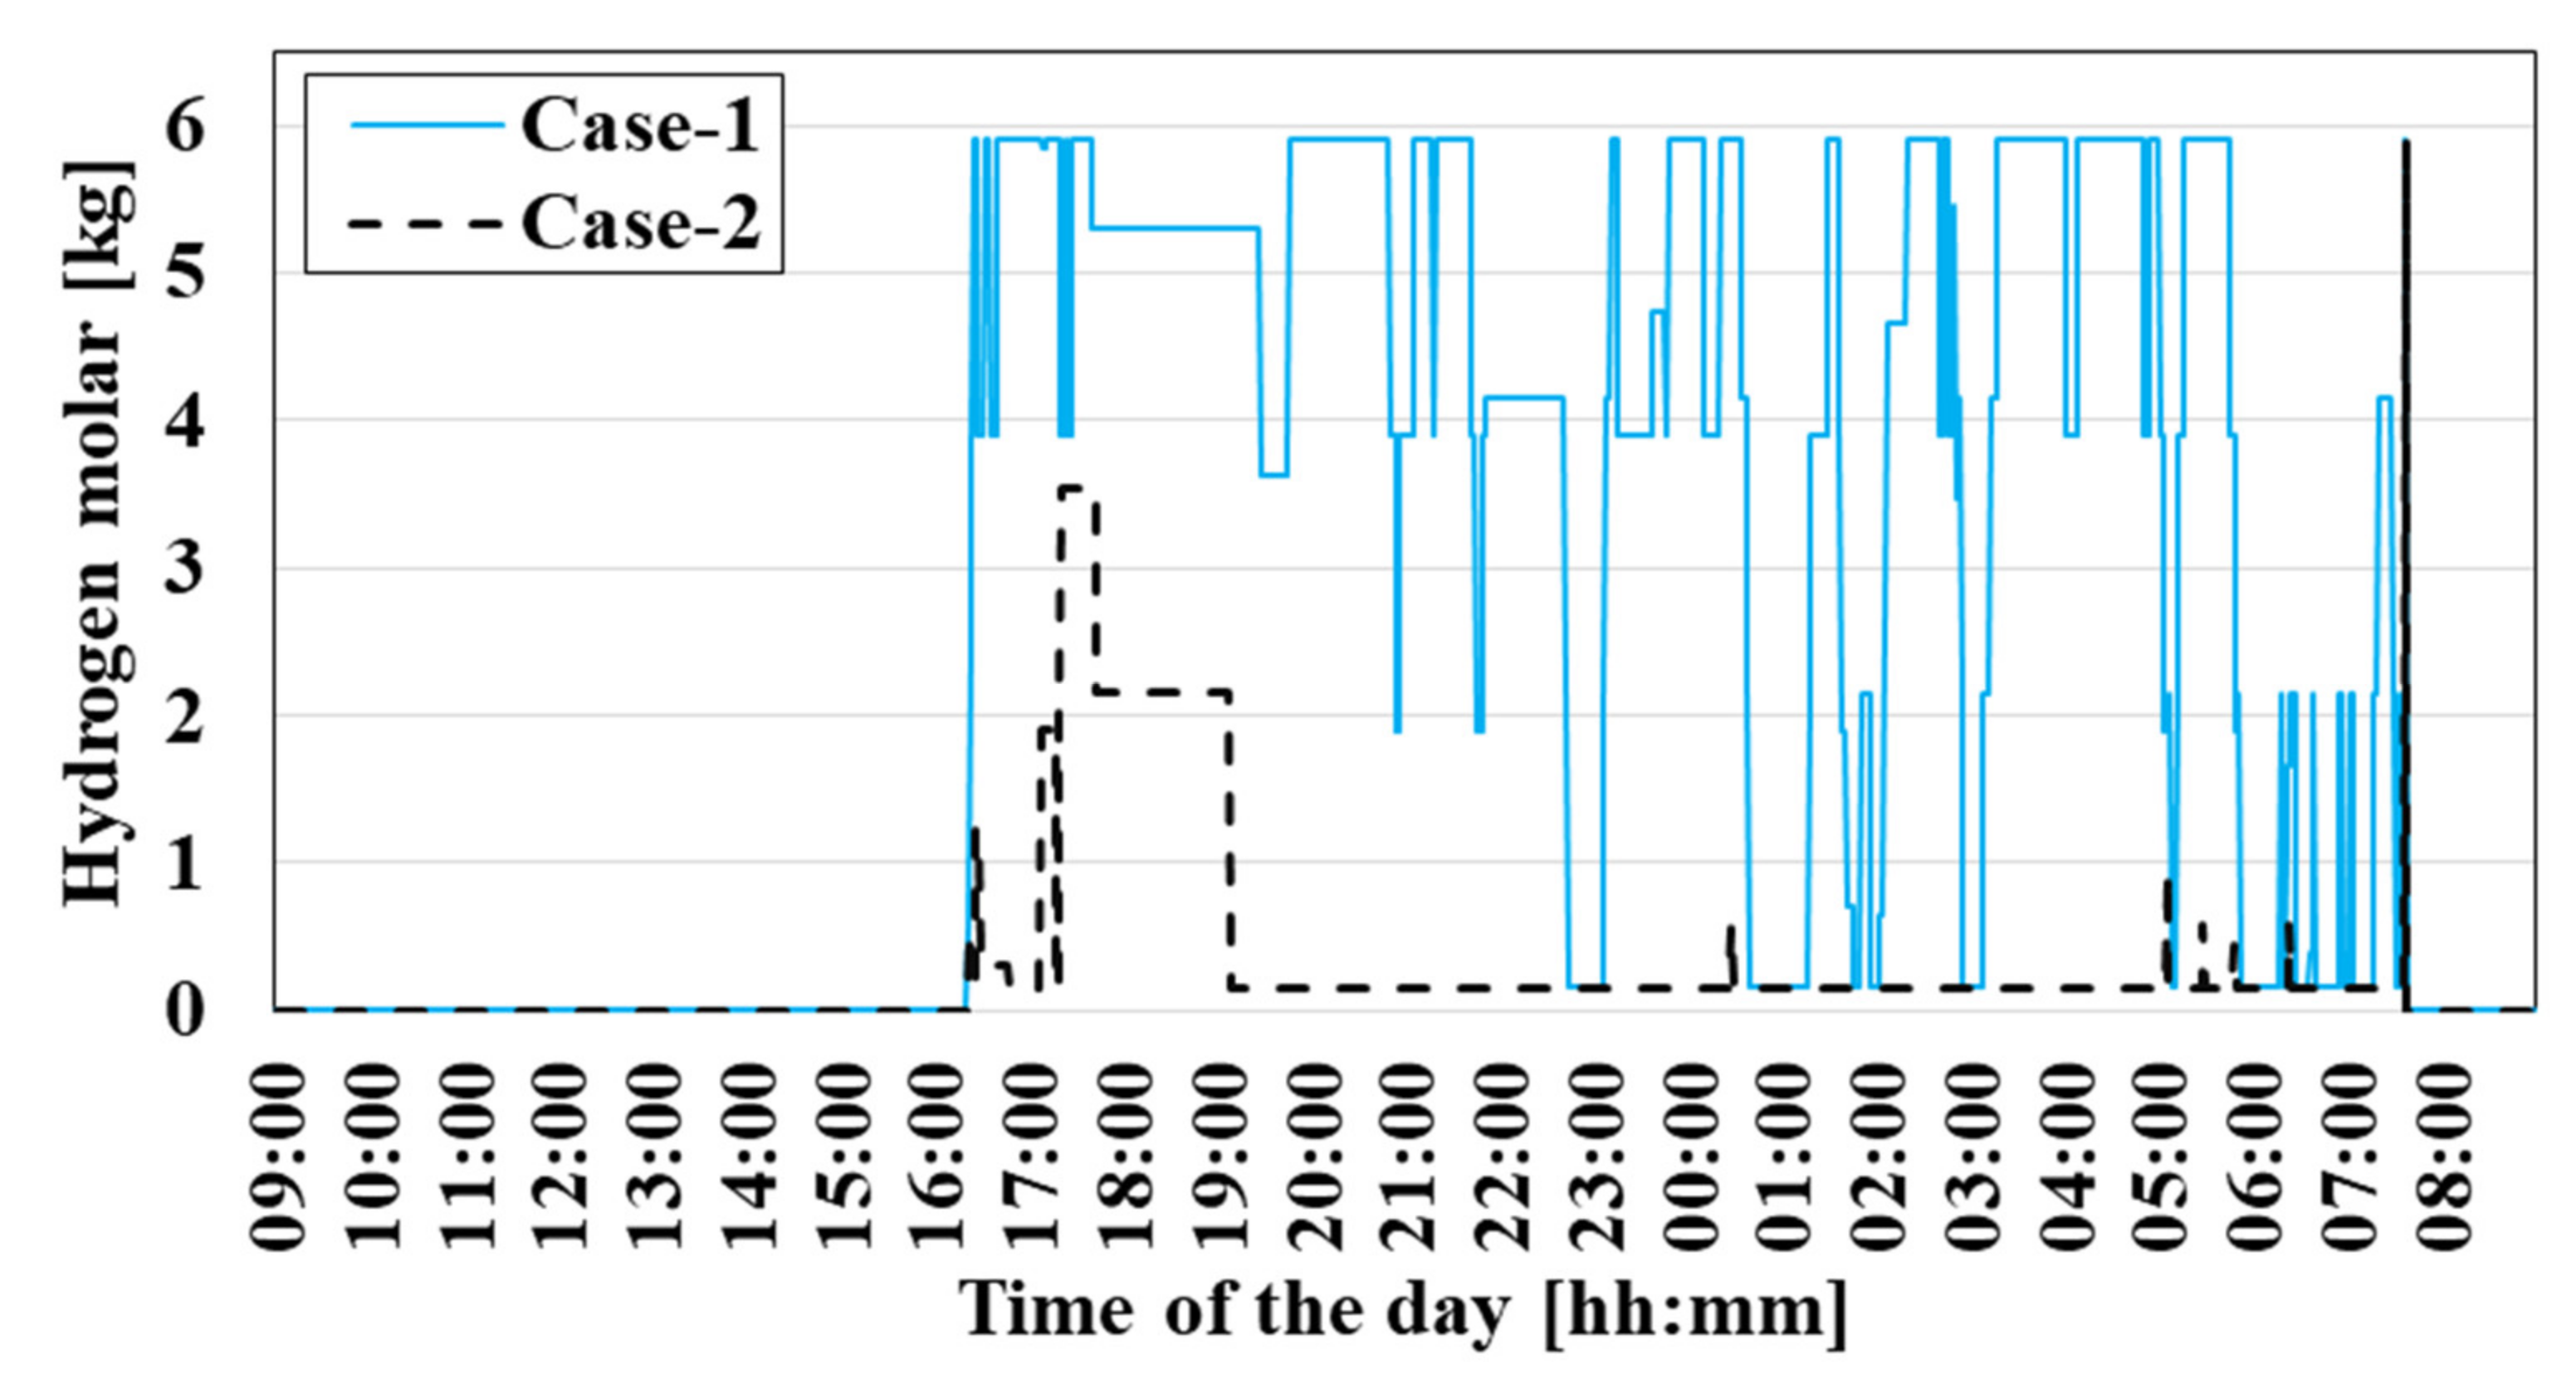
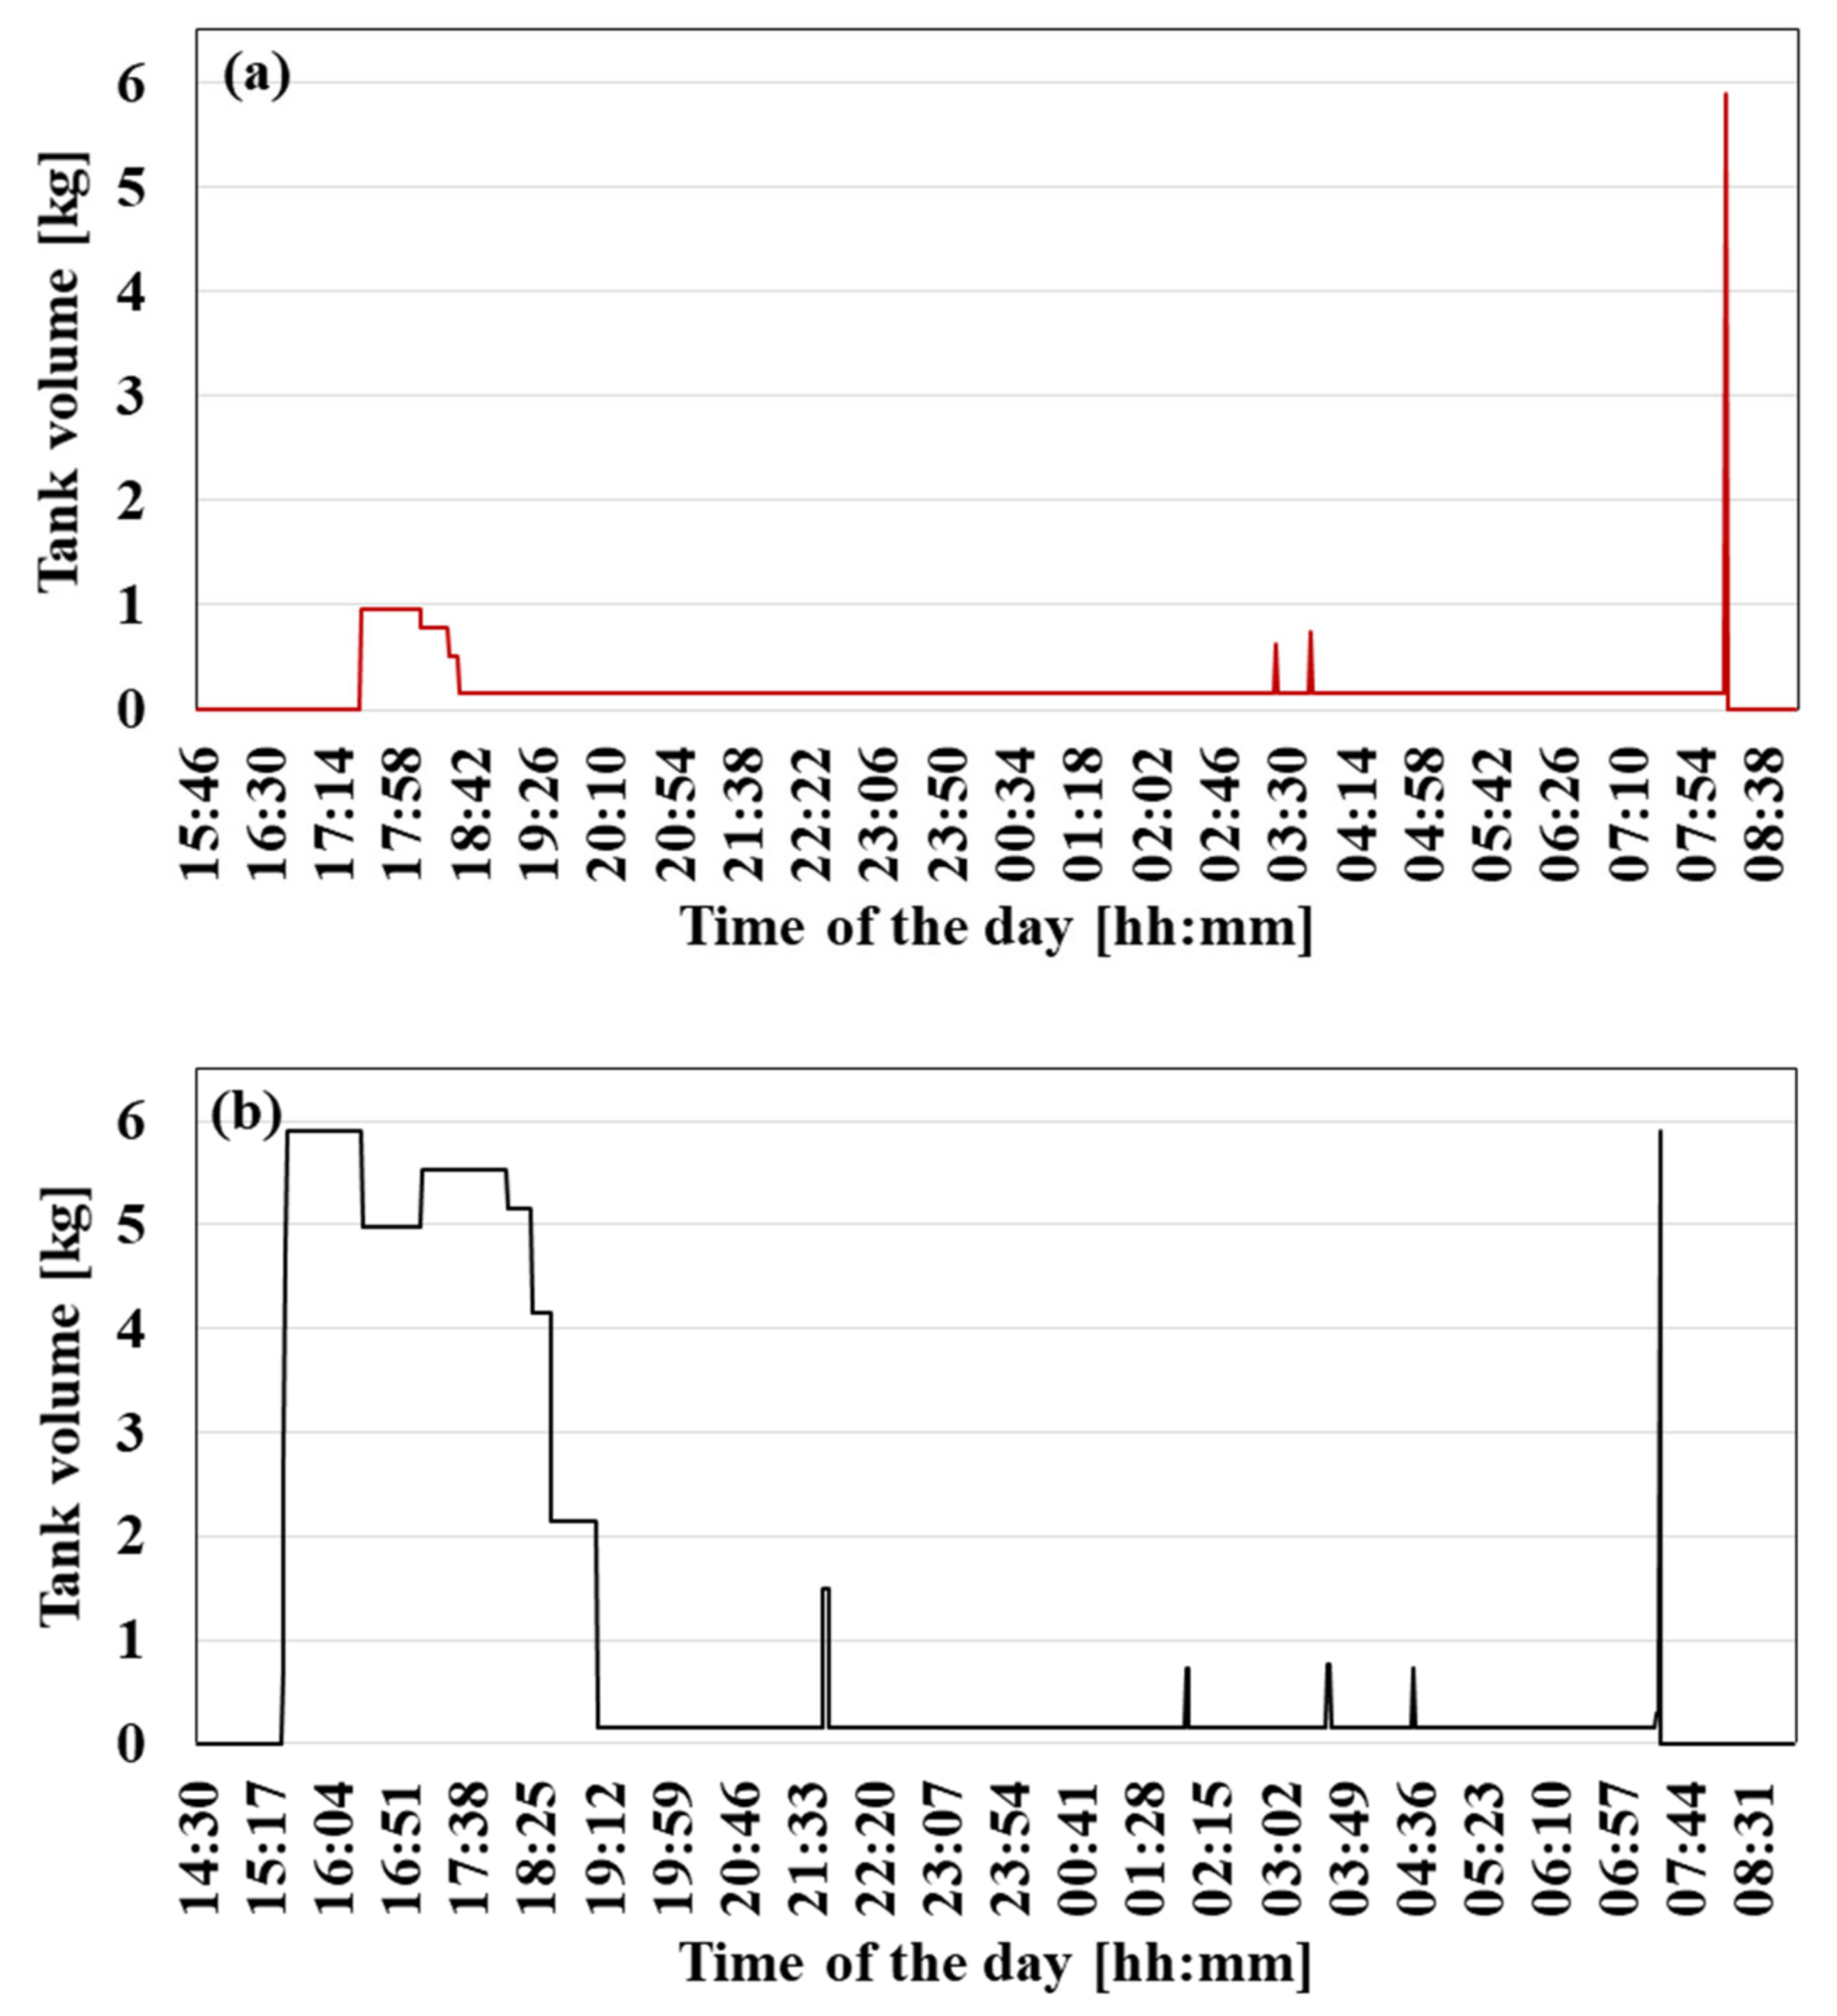
The molar change in the hydrogen tank of FCEV18 in Case-1 and Case-2 is given in Figure 11. It should be stated that there is more refueling and releasing event in order to increase the gain in Case-1, as in the CESS and common hydrogen storage system. While the vehicle has 0.54 kg of hydrogen in its tank when it comes to the community, it has 5.9 kg of hydrogen, which is the desired hydrogen level when the vehicle leaves the community. In Case-2, it is seen that the amount of hydrogen in the vehicle’s tank decreases when there is no energy support from the power grid.
In Case-2, hydrogen molar changes in hydrogen tanks of FCEV4 and FCEV16 are presented in Figure 12. Here FCEVs are considered to provide energy support to the residential community during power outages. FCEV16 provides more support, according to FCEV4. It should be stated that the hydrogen exchange in the tank is low according to Case-1 because the aim is to reduce the amount of interruption only during the power outage.
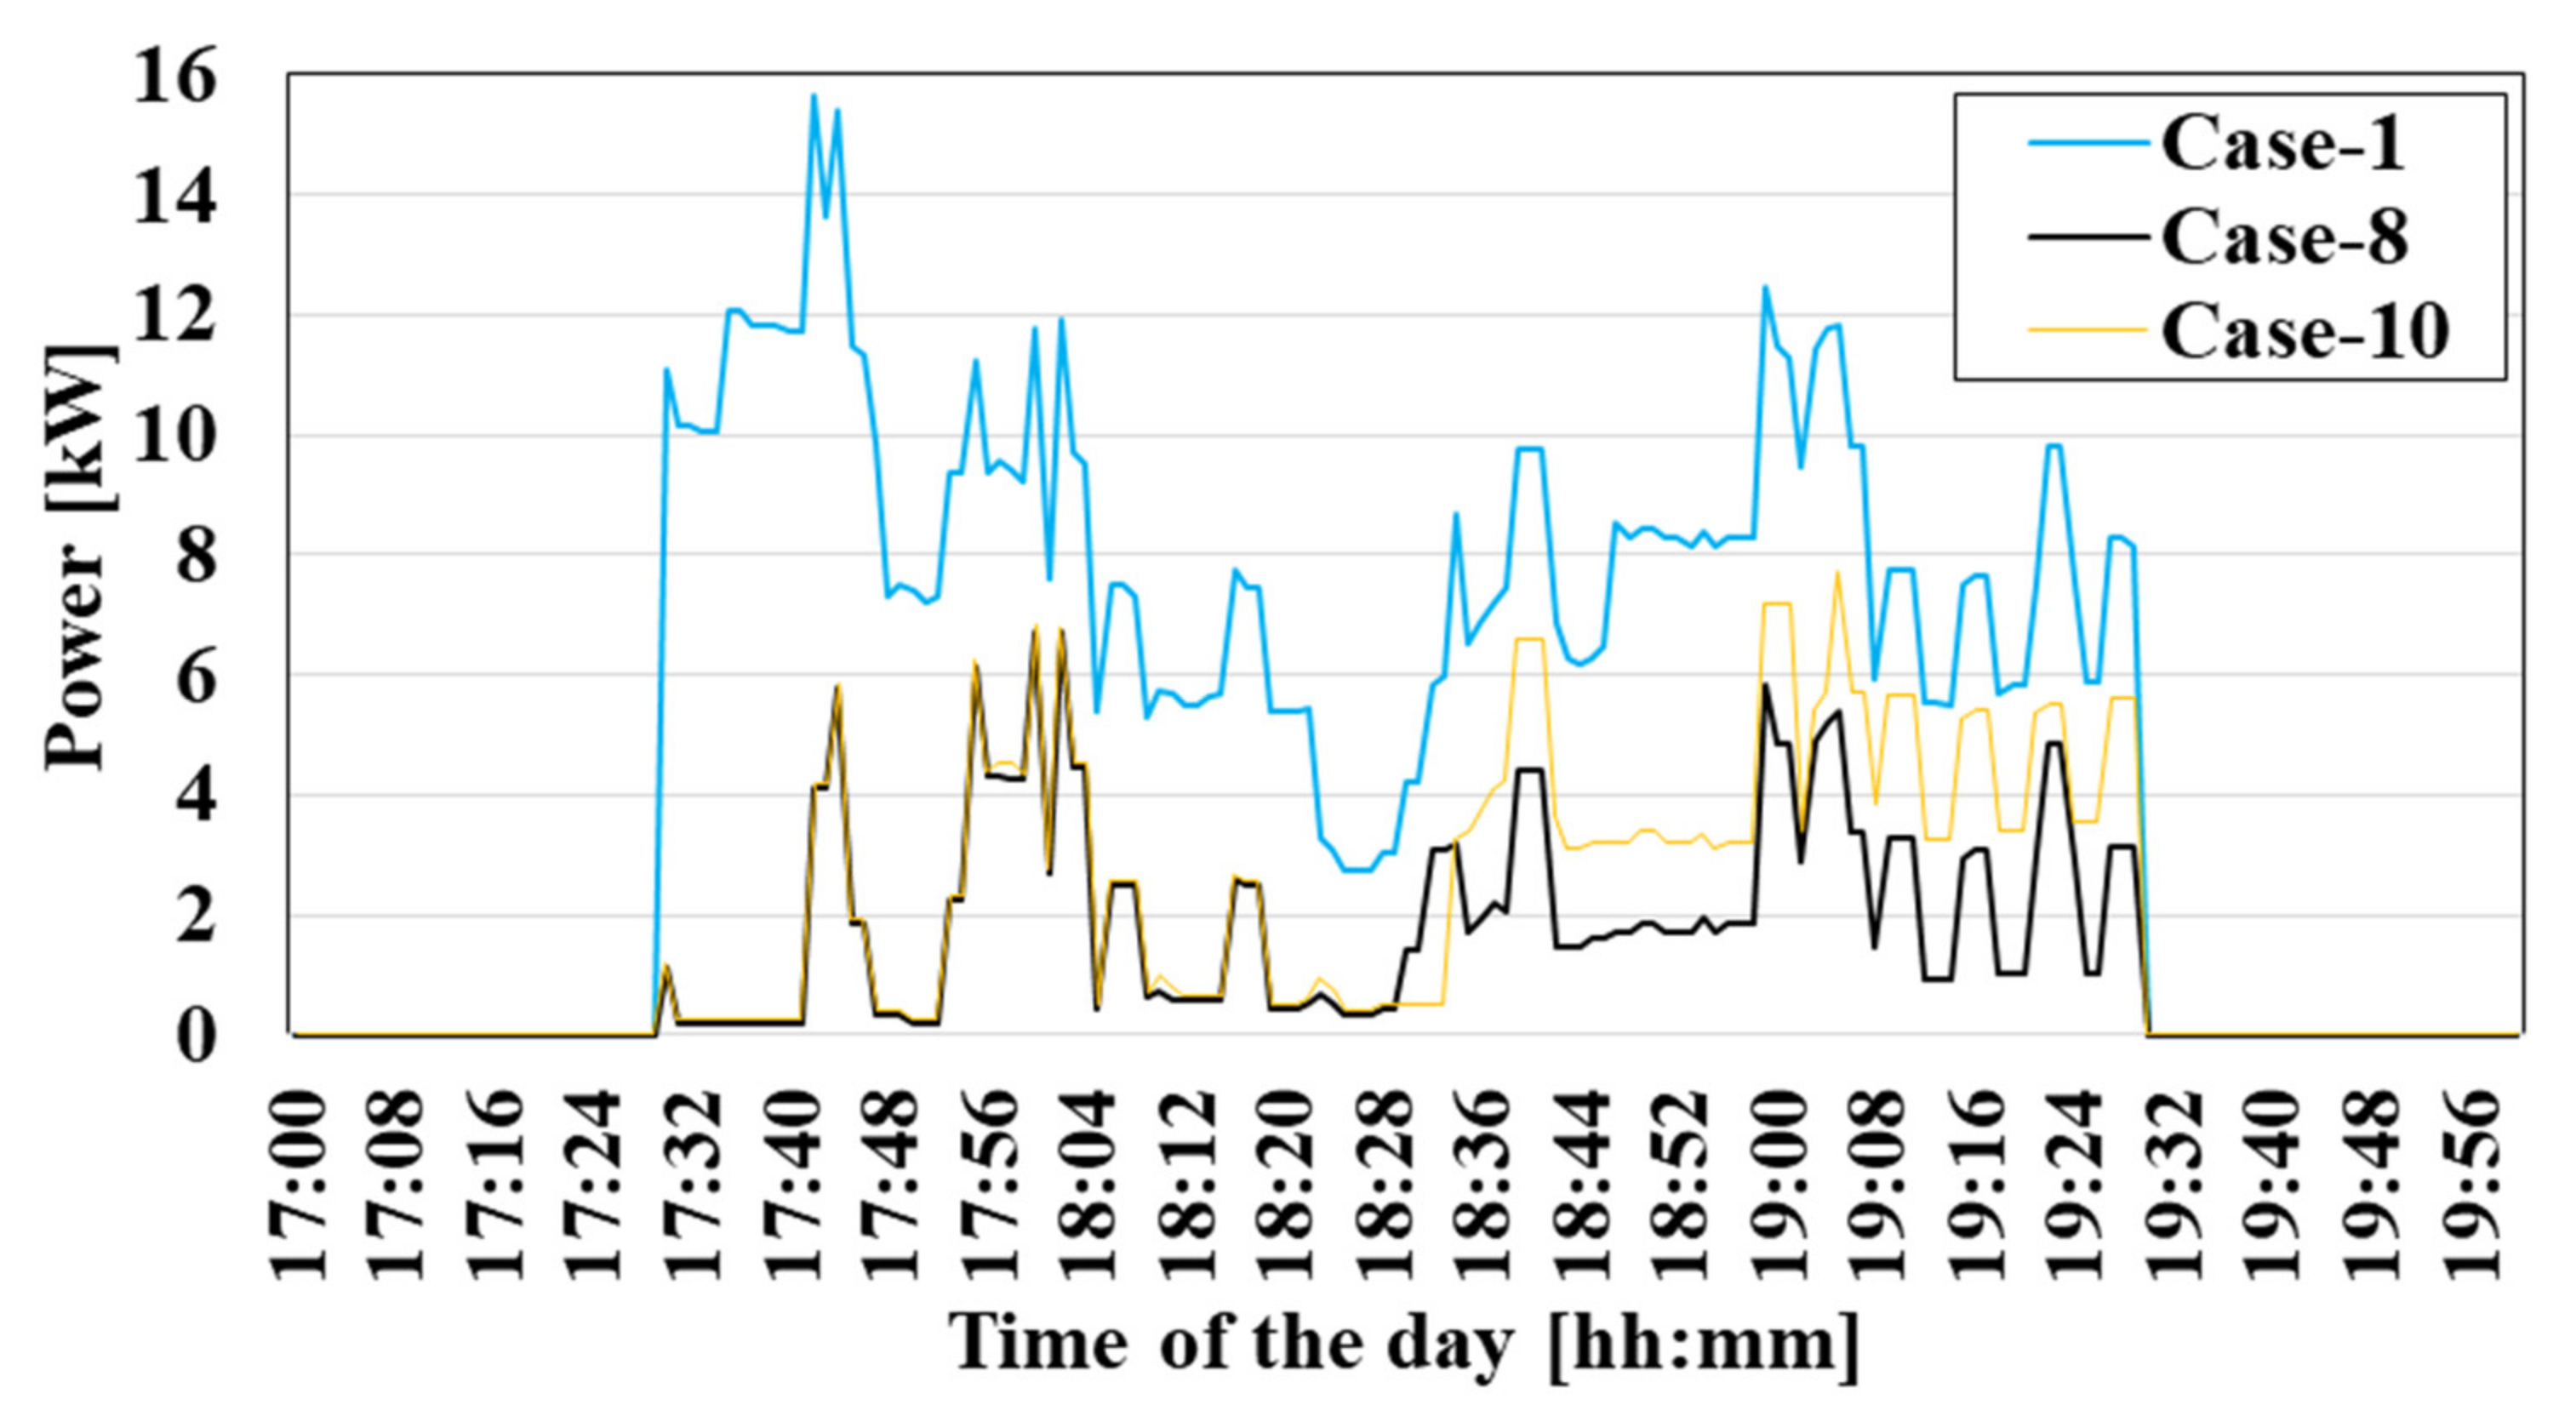
Data on the amount of power curtailment in the absence of the power system for Case-1, Case-8 and Case-10 are given in Figure 13. It should be said that all of the resiliency-sensitive loads are interrupted in Case-1, which is economically operated. On the other hand, in Case-8 without CESS and Case-10 without CESS and PV (the aim in both case studies is to minimize curtailment), the curtailment is realized as 4.27 kWh and 5.96 kWh, respectively. CESS has a greater impact than PV systems and FCEV energy support. In addition, in Case-2, which is the recommended structure and curtailment is minimized, the total amount of interruption is 0.
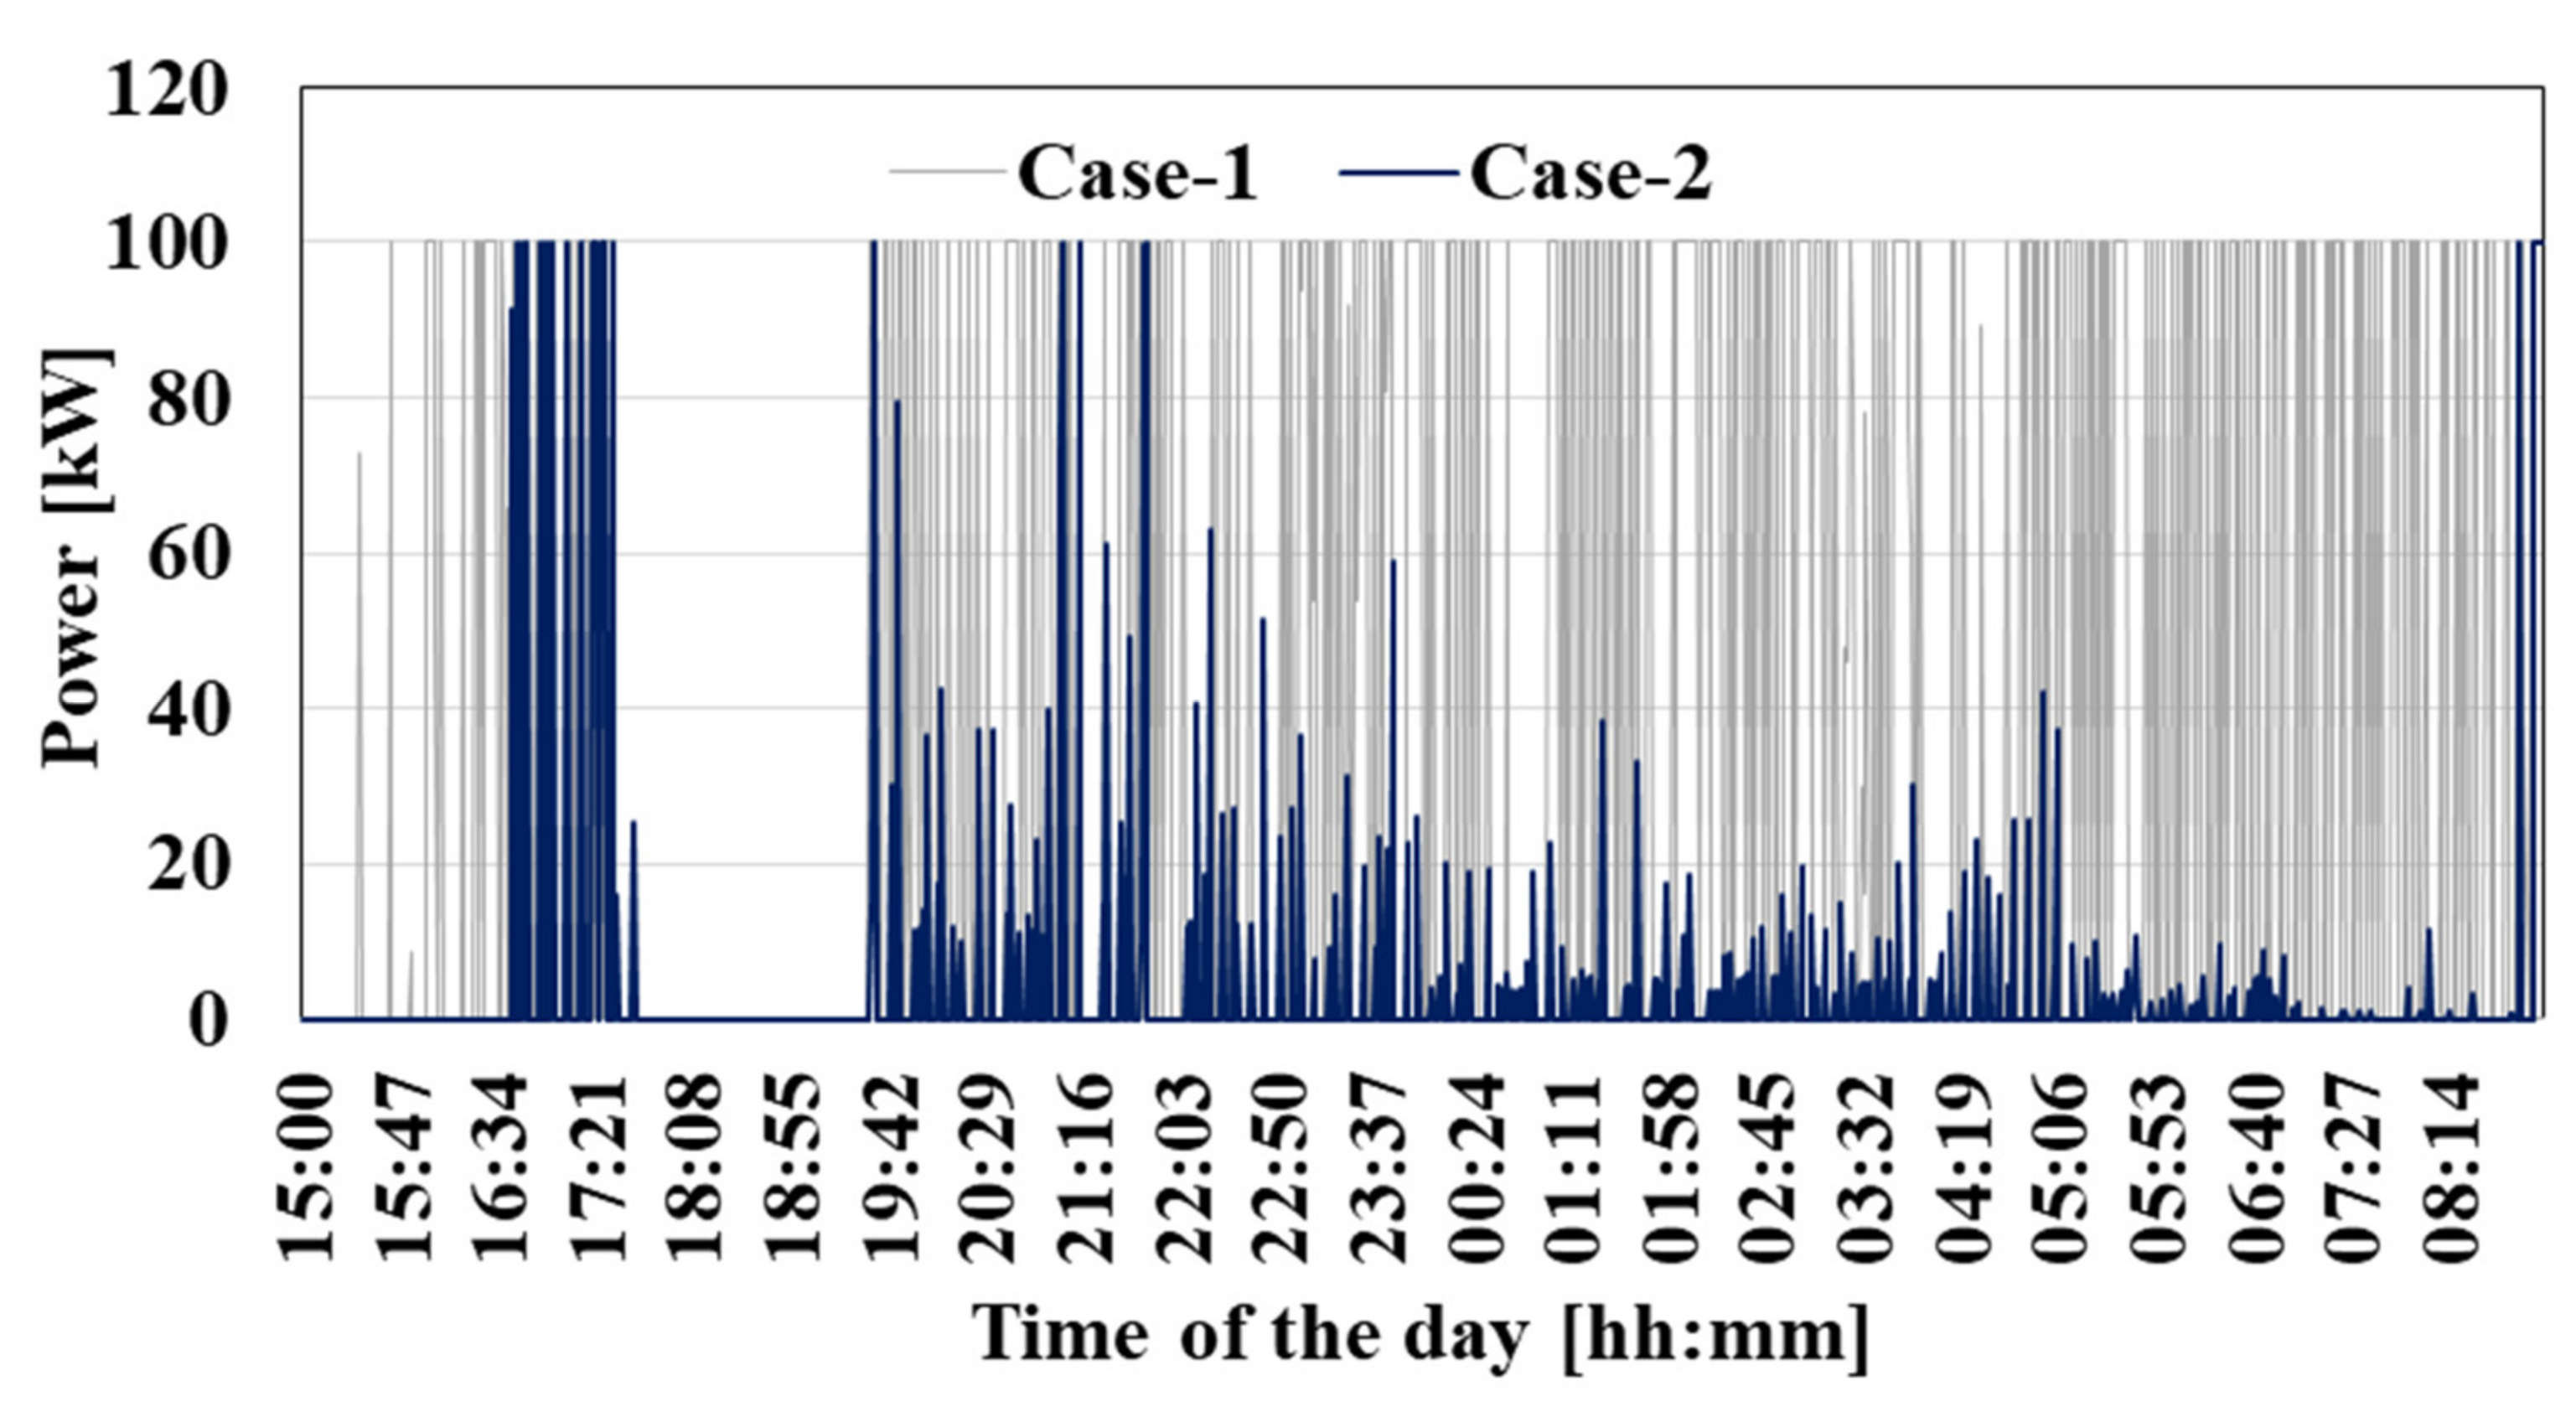
The total power consumption of the electrolyzer during the day in Case-1 and Case-2 is given in Figure 14. As can be seen from the behavior of the common hydrogen tank and FCEVs in Case-1 and Case-2, the electrolyzer is being further evaluated in order to minimize the total cost. In Case-2, on the other hand, there is only the aim of curtailment minimization. The electrolyzer consumes 651.86 kWh in Case-1 and 84.11 kWh in Case-2.
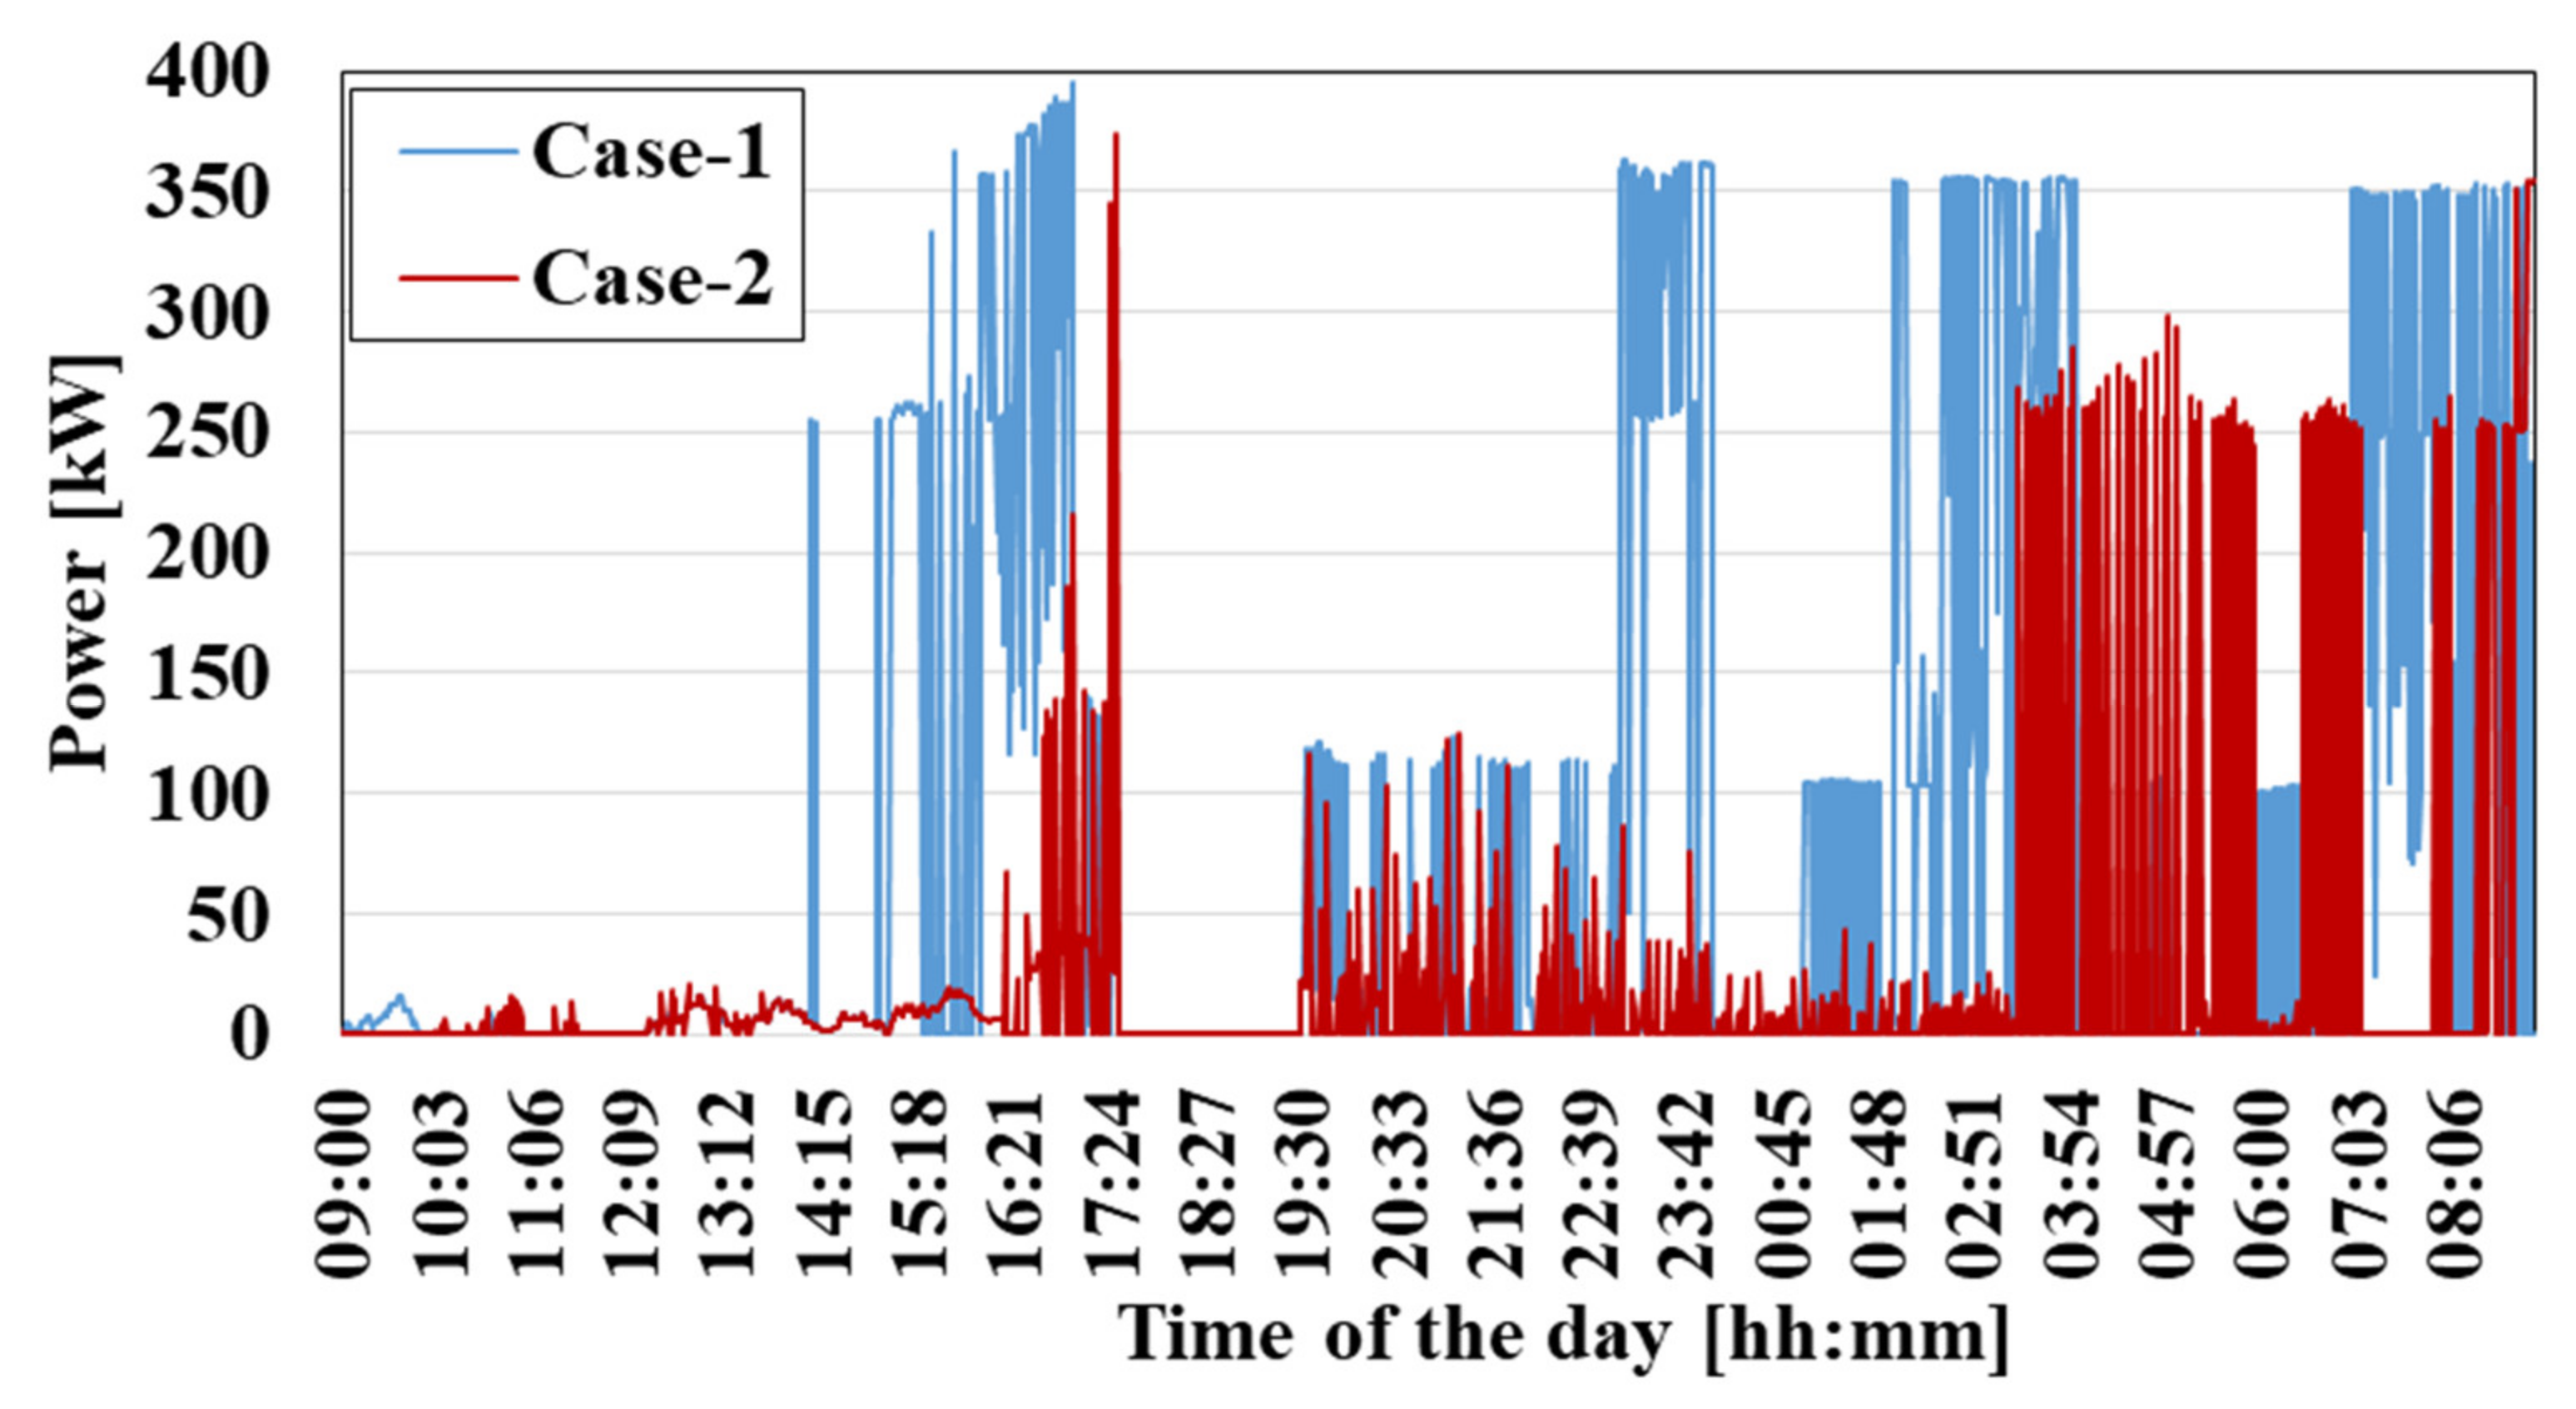
Figure 15 provides data on the total power consumption from the power grid throughout the day for all components of the residential community. It should be stated that no power is drawn from the grid during the power outage. Approximately 1.932 kWh of energy is purchased for Case-1 and 619 kWh for Case-2. It should be noted that CESS and electrolyzer-induced energy purchases increased in Case-1.
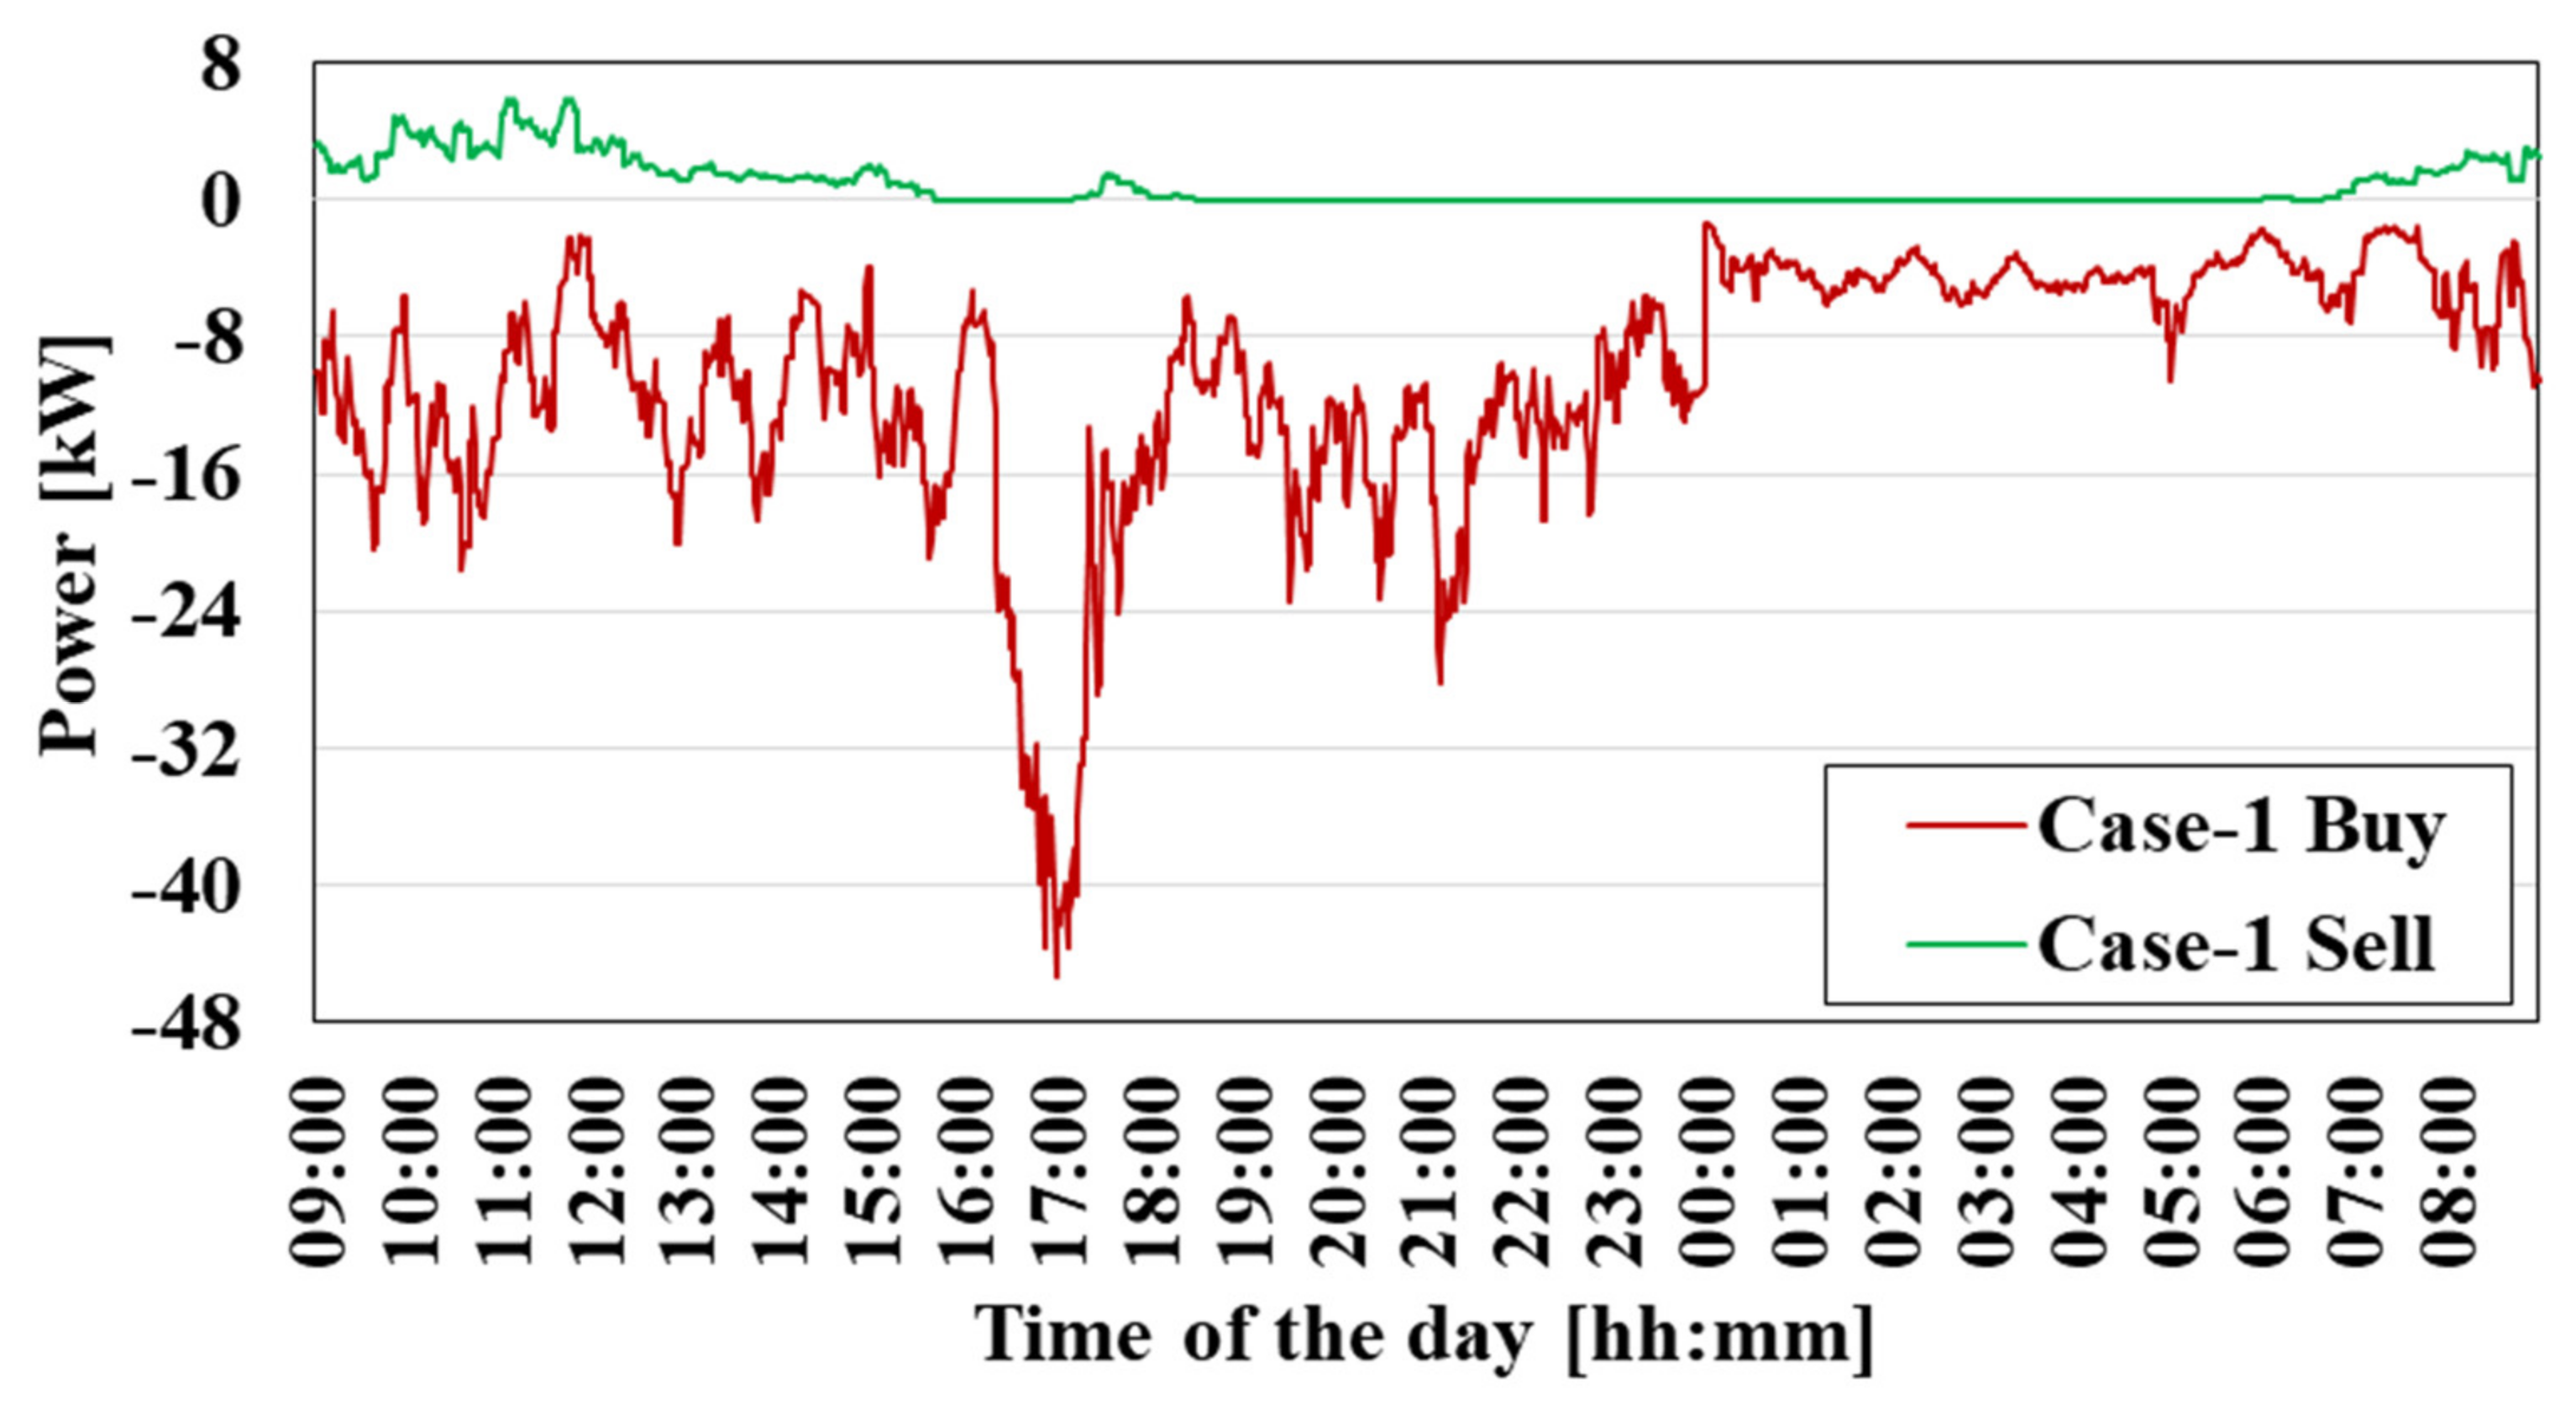
Moreover, for Case-1, data on the residential community and upstream grid power exchange are presented in Figure 16. While 1.932 kWh of energy is taken from the upstream grid throughout the day, 1.626 kWh of energy is sold to the upstream grid.
The total buying and selling power amounts of dwellings in Case-1 are given in Figure 17. It should be stated that some of the power produced in the PV system is sold, while a total of 20.2 kWh of energy is sold to the power grid. Dwellings have a net energy consumption of 227.89 kWh in total.

4. Conclusions

In this study, a MILP model of the resiliency-sensitive decision-making mechanism of a residential community with common PV and rooftop PVs, common hydrogen storage and an electrolyzer was presented. In the study, two different objective functions were determined, namely, cost minimization and curtailment minimization.
According to the results obtained from the study, while the proposed structure works with the least cost in the economic working condition, it can minimize the amount of curtailment in the flexible loads in the curtailment minimization condition. However, in this case, the resulting cost increases as no interruption in flexible loads is ensured. Even in the case of economic operation, while the community earns a profit, it has to make a payment if no curtailment is requested. When the results were examined, it was seen that the share of CESS on the results has the highest value for both objective functions. Moreover, the worst results occur in the condition where PVs, CESS and FCEV support are absent. With the proposed structure, it is concluded that even in the absence of energy from the grid, the community can be operated uninterruptedly, and even profit can be obtained with a very small amount of interruption.
The consideration of the uncertainties regarding the PV-based renewable generation, FCEV-related parameters (arrival and departure times, arrival hydrogen levels, etc.), together with the combination of different residential communities under a single decision-making entity together with energy market participation possibilities, can be given as a future study.

Author Contributions

Conceptualization, F.G.E.; methodology, F.G.E.; software, F.G.E. and A.Ç.; validation, F.G.E., A.Ç. and O.E.; investigation, F.G.E., A.Ç. and O.E.; resources, F.G.E. and A.Ç.; data curation, F.G.E. and A.Ç.; writing—original draft preparation, F.G.E., A.Ç. and O.E.; writing—review and editing, F.G.E., A.Ç. and O.E.; visualization, F.G.E. and A.Ç.; supervision, O.E.. All authors have read and agreed to the published version of the manuscript.

Funding

This research received no external funding.

Conflicts of Interest

The authors declare no conflict of interest.

Nomenclature

Sets
t Set of time periods.
h Set of households in the residential community.
k Set of FCEVs.
n Set of resiliency-sensitive loads.
Parameters
A ,   B Binary parameters to decide the structure of the objective function.
a H 2 P Hydrogen amount to electric power conversion constant [kg/kW].
C E Charging efficiency.
D E Discharging efficiency.
m H 2 d e s , k Desired hydrogen amount in FCEV k during departure time [kg].
m H 2 i n i t , k Initial hydrogen amount in FCEV k during arrival time [kg].
m H 2 m a x , k Maximum allowable hydrogen amount in FCEV k [kg].
m H 2 m i n , k Minimum allowable hydrogen amount in FCEV k [kg].
m H 2 C S i n i t Initial hydrogen amount in common hydrogen storage unit [kg].
m H 2 C S m a x Maximum allowable hydrogen amount in common hydrogen storage unit [kg].
m H 2 C S m i n Minimum allowable hydrogen amount in common hydrogen storage unit [kg].
N Sufficiently large positive constant.
P C P V U , t Power production of common PV unit in period t [kW].
P i n f l e x l o a d , h , t Inflexible load–demand of household h in period t [kW].
P P V , h , t PV power production of household h in period t [kW].
P r s l o a d p r o f i l e , h , n , t The expected load profile of resiliency-sensitive load n of household h in period t [kW].
S o E C E S S i n i t Initial state-of-energy of common energy storage unit [kWh].
S o E C E S S m a x Maximum allowable state-of-energy of common energy storage unit [kWh].
S o E C E S S m i n Minimum allowable state-of-energy of common energy storage unit [kWh].
T a , k Arrival time of FCEV k .
T d , k Departure time of FCEV k .
u g r i d , t Grid availability binary parameter in period t .
τ b u y , t Buying price of energy from the upstream grid in period t [€/kW].
τ s e l l , t Selling price of energy to the upstream grid in period t [€/kW].
Δ T Time granularity [h].
Variables
k h , n , t Binary variable regarding the decision to curtail the resiliency-sensitive load n of household h in period t .
m F C i n j , k , t Amount of hydrogen injected into the hydrogen tank of FCEV k from the common hydrogen storage unit in period t [kg].
m H 2 , k , t Hydrogen amount in the hydrogen tank of FCEV k in period t [kg].
m H 2 c o n s , k , t Hydrogen consumption of FCEV k during community support mode in period t [kg].
m H 2 C S , t Hydrogen amount in common hydrogen storage unit in period t [kg].
m H 2 C S p r o d , t Hydrogen amount produced by the electrolyzer unit in period t [kg].
P b u y , h , t Power procured by household h in period t [kW].
P C E S S c h , t Charging power of CESS unit in period t [kW].
P C E S S d i s c , t Discharging power of CESS unit in period t [kW].
P e l e c , t Electrolyzer power in period t [kW].
P F C E V d i s c h , k , t Discharging power of FCEV k in period t [kW].
P F C E V d i s c h t o t , t Total discharging power of FCEV in period t [kW].
P H 2 R C t o t , t Total power injected back to the residential community by the households in period t [kW].
P R C 2 H t o t , t Total power drawn from the residential community by the households in period t [kW].
P R C 2 U G , t Power injected back to the upstream grid by the residential community in period t [kW].
P r s l o a d , h , n , t The actual power demand of resiliency-sensitive load n of household h in period t [kW].
P s e l l , h , t Reverse power injection by household h in period t [kW].
P t o t a l l o a d , h , t The total load of household h in period t [kW].
P U G 2 R C , t Power drawn from the upstream grid by the residential community in period t [kW].
S o E C E S S , t State-of-energy of common energy storage unit in period t [kWh].
u 1 , t , u 2 , t , u 3 , t , u 4 , t Binary variables to prevent simultaneous occurrence of different power exchange conditions.

References

  1. Wang, C.; Ju, P.; Wu, F.; Pan, X.; Wang, Z. A systematic review on power system resilience from the perspective of generation, network, and load. Renew. Sustain. Energy Rev. 2022, 167, 112567. [Google Scholar] [CrossRef]
  2. Norouzi, F.; Hoppe, T.; Elizondo, L.R.; Bauer, P. A review of socio-technical barriers to Smart Microgrid development. Renew. Sustain. Energy Rev. 2022, 167, 112674. [Google Scholar] [CrossRef]
  3. Yu, H.; Niu, S.; Shang, Y.; Shao, Z.; Jia, Y.; Jian, L. Electric vehicles integration and vehicle-to-grid operation in active distribution grids: A comprehensive review on power architectures, grid connection standards and typical applications. Renew. Sustain. Energy Rev. 2022, 168, 112812. [Google Scholar] [CrossRef]
  4. Forero-Quintero, J.F.; Villafáfila-Robles, R.; Barja-Martinez, S.; Munné-Collado, I.; Olivella-Rosell, P.; Montesinos-Miracle, D. Profitability analysis on demand-side flexibility: A review. Renew. Sustain. Energy Rev. 2022, 169, 112906. [Google Scholar] [CrossRef]
  5. Tan, K.M.; Babu, T.S.; Ramachandaramurthy, V.K.; Kasinathan, P.; Solanki, S.G.; Raveendran, S.K. Empowering smart grid: A comprehensive review of energy storage technology and application with renewable energy integration. J. Energy Storage 2021, 39, 102591. [Google Scholar] [CrossRef]
  6. Jeddi, B.; Mishra, Y.; Ledwich, G. Distributed load scheduling in residential neighborhoods for coordinated operation of multiple home energy management systems. Appl. Energy 2021, 300, 117353. [Google Scholar] [CrossRef]
  7. Gholinejad, H.R.; Adabi, J.; Marzband, M. An energy management system structure for Neighborhood Networks. J. Build. Eng. 2021, 41, 102376. [Google Scholar] [CrossRef]
  8. Fatemeh, T.; Fard, H.H.; Collins, E.R.; Jin, S.; Ramezani, B. Optimization and energy management of distributed energy resources for a hybrid residential microgrid. J. Energy Storage 2020, 30, 101556. [Google Scholar] [CrossRef]
  9. Paterakis, N.G.; Erdinç, O.; Pappi, I.N.; Bakirtzis, A.G.; Catalão, J.P.S. Coordinated Operation of a Neighborhood of Smart Households Comprising Electric Vehicles, Energy Storage and Distributed Generation. IEEE Trans. Smart Grid 2016, 7, 2736–2747. [Google Scholar] [CrossRef]
  10. Gholinejada, H.R.; Lonib, A.; Adabia, J.; Marzband, M. A hierarchical energy management system for multiple home energy hubs in neighborhood grids. J. Build. Eng. 2020, 28, 101028. [Google Scholar] [CrossRef]
  11. Akter, M.N.; Mahmud, M.A.; Amanullah, M.E.H.; Oo, M.T. An optimal distributed energy management scheme for solving transactive energy sharing problems in residential microgrids. Appl. Energy 2020, 270, 115133. [Google Scholar] [CrossRef]
  12. Taşcıkaraoğlu, A.; Paterakis, N.G.; Erdinç, O.; Catalão, J.P.S. Combining the Flexibility From Shared Energy Storage Systems and DLC-Based Demand Response of HVAC Units for Distribution System Operation Enhancement. IEEE Trans. Sustain. Energy 2019, 10, 137–148. [Google Scholar] [CrossRef]
  13. Rafique, S.; Hossain, M.J.; Nizami, M.S.H.; Irshad, U.B.; Mukhopadhyay, S.C. Energy Management Systems for Residential Buildings With Electric Vehicles and Distributed Energy Resources. IEEE Access 2021, 9, 46997–47007. [Google Scholar] [CrossRef]
  14. Ancona, M.A.; Catena, F.; Ferrari, F. Optimal design and management for hydrogen and renewables based hybrid storage micro-grids. Int. J. Hydrogen Energy 2022, in press. [Google Scholar] [CrossRef]
  15. Liu, X.; Ji, Z.; Sun, W.; He, Q. Robust game-theoretic optimization for energy management in community-based energy system. Electr. Power Syst. Res. 2023, 214, 108939. [Google Scholar] [CrossRef]
  16. Hu, M.; Xiao, F.; Wang, S. Neighborhood-level coordination and negotiation techniques for managing demand-side flexibility in residential microgrids. Renew. Sustain. Energy Rev. 2021, 135, 110248. [Google Scholar] [CrossRef]
  17. Thirunavukkarasu, G.S.; Seyedmahmoudian, M.; Jamei, E.; Horan, B.; Mekhilef, S.; Stojcevski, A. Role of optimization techniques in microgrid energy management systems—A review. Energy Strategy Rev. 2022, 43, 100899. [Google Scholar] [CrossRef]
  18. Denga, Y.; Mua, Y.; Wang, X.; Jin, S.; He, K.; Jia, H.; Li, S.; Zhang, J. Two-stage residential community energy management utilizing EVs and household load flexibility under grid outage event. Energy Rep. 2023, 9, 337–344. [Google Scholar] [CrossRef]
  19. Beyazıt, M.A.; Taşcıkaraoğlu, A.; Catalão, J.P.S. Cost optimization of a microgrid considering vehicle-to-grid technology and demand response. Sustain. Energy Grids Netw. 2022, 32, 100924. [Google Scholar] [CrossRef]
  20. Mobarakeh, A.I.; Sadeghi, R.; Esfahani, H.S.; Delshad, M. Optimal planning and operation of energy hub by considering demand response algorithms and uncertainties based on problem-solving approach in discrete and continuous space. Electr. Power Syst. Res. 2023, 214, 108859. [Google Scholar] [CrossRef]
  21. Hou, L.; Dong, J.; Herrera, O.E.; Merida, W. Energy management for solar-hydrogen microgrids with vehicle-to-grid and power-to-gas transactions. Int. J. Hydrogen Energy 2022, in press. [Google Scholar] [CrossRef]
  22. Energy Exchange Istanbul (EXIST-EPIAS) Tranparency Platform. Available online: https://seffaflik.epias.com.tr/transparency/index.xhtml (accessed on 3 November 2022).
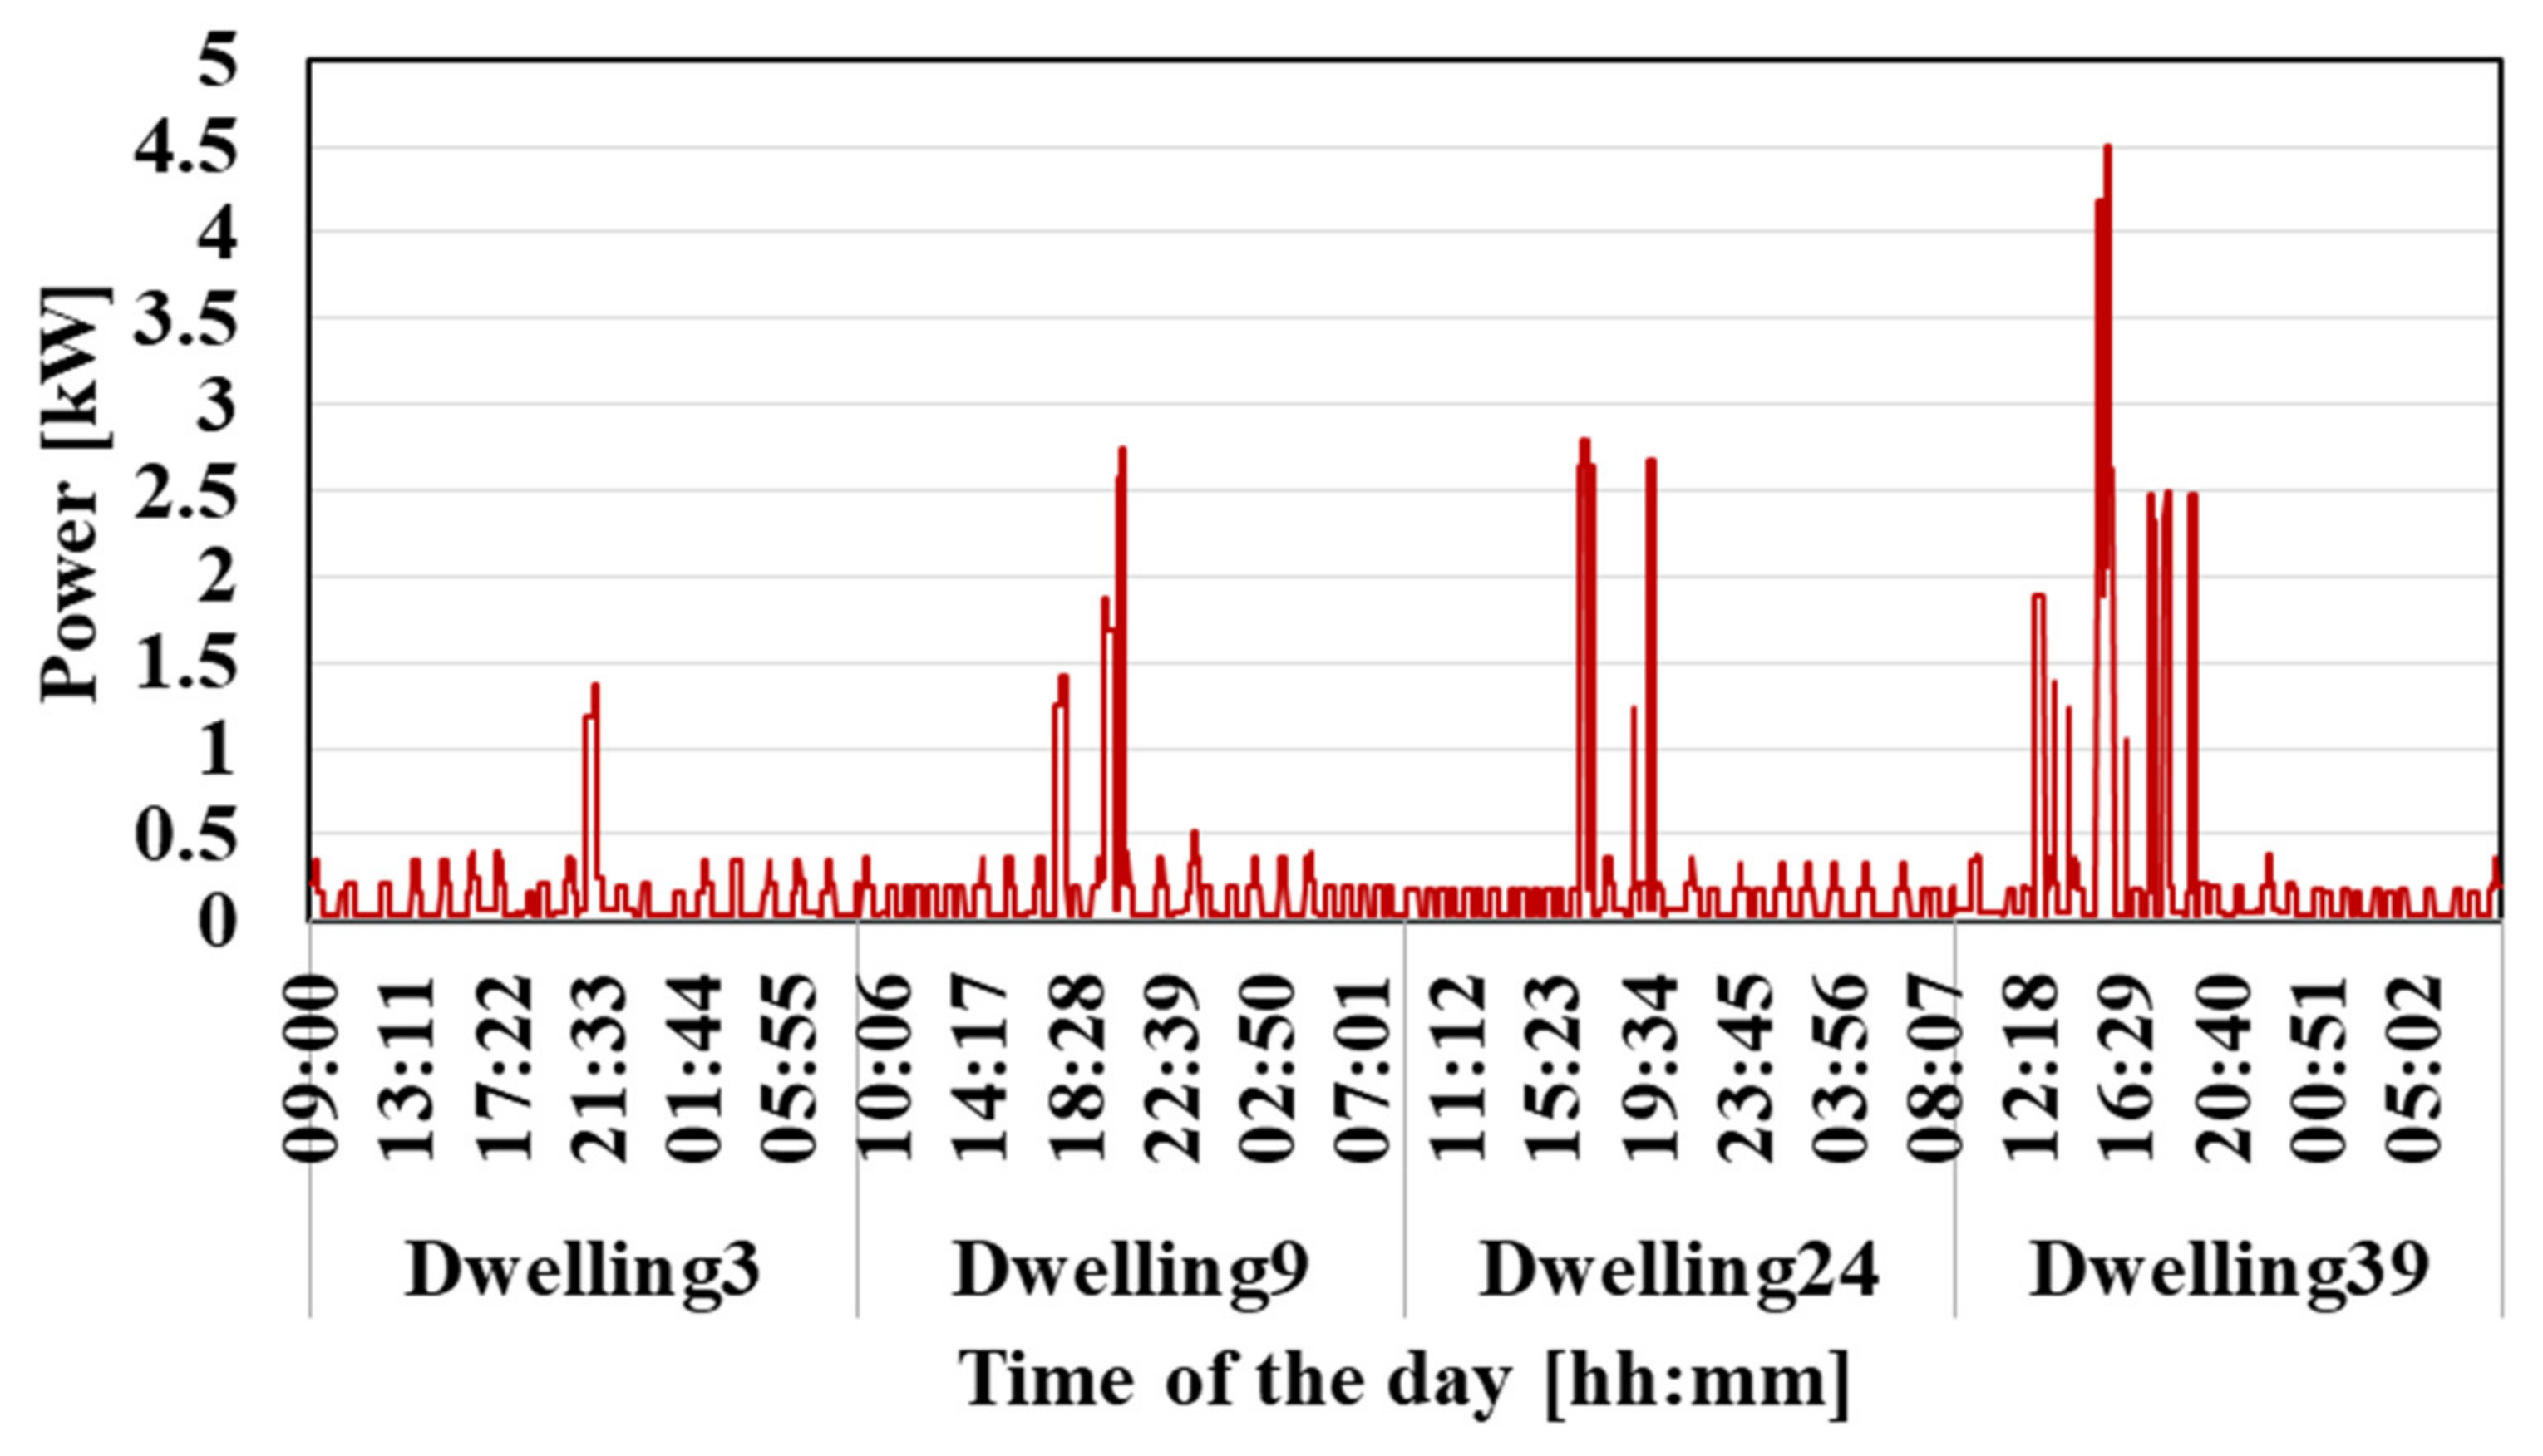
Figure 1. Inflexible load–demand of dwelling3, dwelling9, dwelling24 and dwelling39.
Energies 15 08729 g001
Figure 2. Resiliency-sensitive load–demand of dwelling15 and dwelling39.
Energies 15 08729 g002
Figure 3. Total expected load–demand of residential community without power outage.
Energies 15 08729 g003
Figure 4. Electricity price data.
Energies 15 08729 g004
Figure 5. Power generated from common PV system in the residential community.
Energies 15 08729 g005
Figure 6. Initial and desired hydrogen molar amounts of FCEVs.
Energies 15 08729 g006
Figure 7. Total power consumption of dwellings in Case-1 and Case-2.
Energies 15 08729 g007
Figure 8. Power balance for dwelling25 (a) and dwelling27 (b).
Energies 15 08729 g008
Figure 9. State of energy variation in CESS.
Energies 15 08729 g009
Figure 10. Hydrogen molar change in common hydrogen storage in Case-1, Case-2, Case-5 and Case-6.
Energies 15 08729 g010
Figure 11. Variation in hydrogen molar at hydrogen tank of FCEV18 in Case-1 and Case-2.
Energies 15 08729 g011
Figure 12. Variation in hydrogen molar at hydrogen tanks of FCEV4 (a) and FCEV16 (b) in Case-2.
Energies 15 08729 g012
Figure 13. Power curtailment in Case-1, Case-8 and Case-10.
Energies 15 08729 g013
Figure 14. Power consumption of electrolyzer in Case-1 and Case-2.
Energies 15 08729 g014
Figure 15. Power consumption of residential community in Case-1 and Case-2.
Energies 15 08729 g015
Figure 16. Power exchange data of the residential community with the upstream grid.
Energies 15 08729 g016
Figure 17. Total power exchange in dwellings with residential community.
Energies 15 08729 g017
Table 1. The taxonomy of the relevant literature.
ReferenceCommon Distributed Generation Common ESSAdditional ESSDemand Side FlexibilityResiliencyEV TypeV2X
[6] X X X X X X
[7] X X X X X SBEV X
[8] X X X X X
[9] X X X X SBEV
[10] X X X X SBEV
[11] X X X X X X X
[12] X X X X X
[13] X X X X X SBEV
[14] X X X X
[15] X X X X
[18] X X SBEV X
[19] X X X X SBEV
[20] X SBEV
[21] X SBEV and FCEV
This study FCEV
Table 2. Data of FCEV behaviors.
EV No.* DT–ATEV No.* DT–ATEV No.* DT–ATEV No.* DT–ATEV No.* DT–AT
FCEV107:47–17:32FCEV907:40–17:28FCEV1707:42–16:39FCEV2508:08–15:51FCEV3308:53–18:03
FCEV207:13–15:29FCEV1009:00–17:36FCEV1807:21–17:12FCEV2606:21–16:39FCEV3408:05–18:34
FCEV309:58–17:29FCEV1108:43–16:07FCEV1908:34–18:15FCEV2707:15–15:30FCEV3508:11–17:15
FCEV408:32–17:49FCEV1209:25–17:59FCEV2008:21–18:23FCEV2808:32–16:36FCEV3697:10–17:04
FCEV509:11–18:32FCEV1306:55–17:04FCEV2107:18–15:55FCEV2909:34–17:06FCEV3708:45–17:02
FCEV608:51–17:19FCEV1408:36–17:20FCEV2207:19–16:28FCEV3008:06–16:33FCEV3807:54–18:30
FCEV708:24–17:43FCEV1507:10–16:59FCEV2309:06–17:15FCEV3108:21–17:21FCEV3907:15–15:47
FCEV808:51–17:09FCEV1606:29–17:01FCEV2407:55–15:25FCEV3210:22–18:31FCEV4008:24–16:10
* DT–AT: Departure time from the residential community–arrival time to the residential community.
Table 3. Data of CESS.
C E [%] D E [%] S o E C E S S i n i t [kWh] S o E C E S S m i n [kWh] S o E C E S S m a x [kWh]Maximum Value of P C E S S c h , t
[kW]
Maximum Value of P C E S S d i s c , t
[kW]
0.950.95500100500250250
Table 4. Data of common hydrogen storage unit.
m H 2 C S i n i t [kg] m H 2 C S m i n [kg] m H 2 C S m a x [kg]
80580
Table 5. Case Studies.
CasesParameter A
(Cost Minimization)
Parameter B (Curtailment Minimization)PV (Common and Dwellings)Power from FCEVs to Residential CommunityCESS
Case-110
Case-201
Case-310
Case-401
Case-510
Case-601
Case-710
Case-801
Case-910
Case-1001
Table 6. Results for case studies.
CasesCost [TL]Curtailment [kWh]
Case-1−1263.8116,206
Case-2406.99
Case-3−1084.3516,206
Case-4456.32
Case-5−1022.6316,206
Case-6499.18
Case-7201.4116,206
Case-8354.274271
Case-9261.9616,206
Case-10409.325959
Publisher’s Note: MDPI stays neutral with regard to jurisdictional claims in published maps and institutional affiliations.