Article

Flow-Induced Vibration of Non-Rotating Structures of a High-Head Pump-Turbine during Start-Up in Turbine Mode

1
Branch Company of Maintenance & Test, CSG Power Generation Co., Ltd., Guangzhou 511400, China
2
State Key Laboratory of Hydroscience and Engineering, Tsinghua University, Beijing 100084, China
3
S.C.I. Energy, Future Energy Research Institute, Seidengasse 17, 8706 Zurich, Switzerland
*
Author to whom correspondence should be addressed.
Energies 2022, 15(22), 8743; https://doi.org/10.3390/en15228743
Submission received: 9 October 2022 / Revised: 10 November 2022 / Accepted: 14 November 2022 / Published: 21 November 2022
(This article belongs to the Topic Hydroelectric Power)

Abstract

:
Pumped storage-power plants play an extremely important role in the modern smart grid due to their irreplaceable advantages in load peak-valley regulation, frequency modulation, and phase modulation. The number of start-stops per day of pump-turbine units is therefore also increasing. During the start-up transient process in turbine mode, the complex flow in runner passage, crown and band chambers, and seal labyrinth is able to induce severe vibration of non-rotating structures such as head cover, stay-ring, and pose a threat to the safe operation of the pump-turbine unit. In this article, the flow-induced vibration of the structures of a pump-turbine unit during its start-up process in turbine mode is studied. In the first place, this investigation establishes a three-dimensional model of the full flow passage and carries out a full three-dimensional CFD calculation based on one-dimensional pipeline calculation results for the start-up transient process. In the next place, by applying the fluid–structure interaction calculation method, the finite element analysis of non-rotating components of the pump-turbine unit is carried out. The flow-induced stresses and deformations of head cover, stay-ring, etc., are obtained and analyzed. The results reveal that the maximum deformation of the non-rotating structures is located at the inner edge of the head cover while the maximum stress appears at the trailing edge fillet of a stay vane. In summary, the dynamic stress of the non-rotating structures changes largely during the start-up process. The stress is strongly related to the axial thrust caused by the fluid flow. The achieved results can provide guidance for further fatigue life assessment of non-rotating structures and contribute to the structural safety design of pump-turbine units.

1. Introduction

In recent years, with the increasing requirement for clean and green energies, people are paying more and more attention to new renewable energies such as wind energy, solar energy, marine energy, and so on. However, the intermittent output of new renewable energies provides an unstable supply to the power grid, which brings a great challenge to the stability of the energy system. On the other hand, conventional power resources such as coal power are difficult to modify in a short time (several minutes), which is not able to match the consumption fluctuation of electricity in the power grid. More flexibility in the power system has to be developed to deal with this new scenario. Energy storage techniques highlight the importance because of their mature technology and fast response ability. The pumped storage power is a type of energy that consumes the surplus electricity of the power grid when there is an excessive supply and converts the potential energy of water to electricity and supply to the power grid during peak hours [1]. Pumped storage stations effectively play the role of dynamic balance between the supply and consumption in the power grid [2]. Therefore, the operation stability of pump-turbines is of paramount significance to the safety of the power plants and the grid.
In order to keep the balance of the power grid, the pumped-storage power plant has to switch its function between pump mode and turbine mode. Because of the entrance of new renewable energies, pump storage stations have to switch their function more and more frequently. Some of them have to start-up and close-down more than 10 times in a single day [3]. Pump-turbine is a pump as turbine by nature, and it can be flexibly switched between pump and turbine conditions [4]. Under frequent start-up and close-down, load change, load rejection and other transient processes, pump-turbine units have to face a series of unsteady hydraulic excitations such as turbulence, rotor–stator interaction (RSI), vortex rope, etc. The alternate stress induced by the excitations will cause damage to the structure of the turbine units. Unstable flows such as RSI and vortex under transient processes may lead to strong vibrations to the non-rotating structures such as the head cover and stay-ring of the pump-turbine, which may develop stress concentrations [5]. A long-time operation may cause fatigue damage to the non-rotating structures, thus threatening the operation safety of the unit. Generally, hydraulic excitations mainly induce the vibration of the head cover while the vibration of the upper and lower brackets are generated by the rotor [6]. Because of the special design of the pump-turbines, the rotor–stator interaction is more severe than the regular type of hydraulic turbines [7]. Theoretical analysis, numerical simulation and experimental research have been done on the analysis of hydraulic excitation in pump-turbine units [8]. Researchers have carried out numerical simulations on the fluid domain of hydraulic turbine units in order to obtain their vibration behavior [9], modal characteristics [10], etc. A lot of experience has been accumulated in the calculation under steady-state and transient conditions. Valentín, D., et al. [11] researched the dynamic response of a Francis turbine runner by means of both Experimental Modal Analysis and Finite Element Method (FEM). The accuracy of the numerical simulation was proved to be high with the comparison of the experimental results. The behavior of a Francis turbine at part load condition is studied by Computational Fluid Dynamics and the vibration and stress show good accuracy compared with the field test results [12]. Egusquiza, E., et al. calculated the natural frequency, modal shape, and damping of a pump-turbine impeller by means of FEM. The obtained results have been validated with the field test and can be used on similar machines [13].
The transient process of pump-turbines is one of the most critical conditions that need to be researched because of its complicated inner flow and strong vibration [14]. Due to the inconvenience and high-cost of field measurements of hydraulic turbine units, numerical simulation methods have become a substitute to study the internal flow characteristics of machines. In a number of previous research, numerical simulations have been verified to be reliable in the prediction of the inner flow of hydraulic machinery by comparing the simulation result with the field tests. Tomaž, K. proposed a novel method for the prediction of water turbine characteristics during transient operating regimes based on numerical flow simulation with the finite volume method. The method has been validated by the model test [15]. Song, X. carried out a free surface vortex prediction method by means of two-phase flow method. The simulation clearly shows that the predicted results are consistent with the existing problems of the unit on site [16]. Wang, W. established a numerical model of a pump-turbine unit for pressure pulsation prediction. The prediction result shows good agreement with the condition monitoring data [17]. The above research has proven that for engineering problems, the comparisons show that the errors are within an acceptable range. Lingyan He et al. [18] investigated the resonance phenomenon of a pump-turbine unit during its start-up process by means of three-dimensional (3-D) full flow path analysis. The results revealed that the resonance was caused by the matching between the RSI and natural frequencies of the runner mode. Zhongyu Mao et al. studied the axial force of the shaft in the pump-turbine unit during the start-up process. The consequences of axial force during the start-up such as deformation and stress were analyzed in detail [19]. Funan Chen et al. analyzed transient unsteady flow in pump-turbine units and obtained reliable dynamic stress results during the start-up process. The results show that the RSI can be a leading factor of dynamic stresses during the transient process [20]. There are also some investigations that have investigated the stress level of non-rotation components by means of stress measurement through numerical simulation [21] or experiments of stress and strain [22,23]. During the transient process, the flow is mainly influenced by the critical time points, which are the extrema in the pressure curve [24,25]. The critical points can be obtained from one-dimensional pipeline calculation. In literature [19,26], scholars have proposed the simulation method at critical moments during transient processes and calculated the variation of stress/strain on the structures caused by the fluid flow. The above studies on the influence of the start-up process on the non-rotating structures in turbine mode based on the fluid-structure interaction (FSI) method still need to be supplemented.
In this study, the fluid domain of a reversible pump-turbine during the turbine start-up process has been conducted by means of numerical simulation. In Section 2, the basic theory of 1-D and 3-D simulation is introduced. In Section 3, the transient flow in the hydraulic system is calculated by the one-dimensional (1-D) transient flow calculation method. Then, the 3-D models of the fluid domain and the non-rotating structures are built up. After that, a full 3-D computational fluid dynamic (CFD) calculation is conducted on the whole fluid domain, which includes the labyrinth seals of the crown and band for the turbine start-up. In Section 4, Fluid-Structure Interaction (FSI) is used in order to couple the 1-D calculation and 3-D calculation. In FSI, the flow and pressure results obtained by 1-D simulation are transferred to the 3-D model as the boundary conditions. The obtained simulation results are then used as the excitation force of FSI analysis to calculate the fatigue and vibration of the non-rotating structures. The flow-induced stresses and deformations of head cover, stay-ring, etc., are obtained and analyzed. Section 5 gives the main conclusions. The calculated results have shown that the variation of guide vane opening (GVO) and spiral casing water level have a great influence on the vibration of the head cover during the turbine start-up, and the vibration tends to be stable after entering the load-increasing stage. The achieved results can provide data for further fatigue life assessment of non-rotating structures and contribute to the structural safety design of pump-turbine units.

2. Methodology of FSI Calculation

The analysis process in this study consists of 1-D pipeline calculation, fluid-structure interaction calculation and finite element analysis. Firstly, the 1-D pipeline calculation result provides border conditions for the calculation of FSI. Then the FSI will be used for the Finite Element Analysis (FEA) on the 3-D structure of the pump-turbine unit and the result of FEA will be analyzed in detail. The basic governing equations of the above methodologies are introduced below.

2.1. Governing Equations of 1-D Pipeline Calculation

The mathematical unsteady flow models of the pipeline system of the researched power plant consist of the penstock, surge shaft, valves, pump-turbine unit, and upper and lower reservoirs. The basic equations of unsteady flow in the closed pipeline include the kinematic equation of motion and the continuity equation.
g H X + V V X + V t + F d V V 2 D = 0
V H X + a 2 g V X + H t V s i n α = 0
H = Z + p ρ f g
where Z, D, and X represent the elevation, diameter, and length of the pipeline, respectively. ρ f and p are the density and pressure of the fluid. V represents the fluid velocity in the pipeline. A is the velocity of the wave in the pipeline, t is the transient time, F d is the Darcy Westbach friction coefficient, α represents the angle between the pipeline and the horizontal plane. By combining Equations (1)–(3), the full differential equation can be obtained:
C + : d x d t = + a A 2 d H d t + A a g d Q d t Q A s i n α + F d a Q Q 2 g D = 0
C : d x d t = a A 2 d H d t A a g d Q d t Q A s i n α F d a Q Q 2 g D = 0
Equations (4) and (5) are called the method of characteristic (MoC) equations and the compatibility equation is established along the characteristic lines. Two characteristic line directions are C + and C . The equation can be integrated by the variation of flow rate and head of the water in the form of difference, and then the 1-D pipeline calculation can be completed by iteration solution.

2.2. Governing Equations of 3-D FSI Calculation

The laws of conservation of mass and momentum are the governing equations of the 3-D unsteady turbulent flow in the flow passage:
ρ f u j t + ρ f u u j τ j x j = f j
where u j represents the velocity (on j direction) of the flow field, respectively, f j is the volume force vector of the fluid on j direction, and τ j is the shear force tensor:
τ j = p + μ · u j + 2 μ e j
where μ and e j are the dynamic viscosity and the velocity stress tensor of the fluid, respectively:
e j = 1 / 2 ( ( u j ) / ( x j ) + ( u j T ) / ( x j T ) )
The fluid pressure at the FSI interface is calculated according to the above theory. The force applied on the structure f j ( t ) by the fluid can be calculated by summing the pressure of fluid p j ( t ) with the FSI interface S j .
f j t = p j t · d S j
By applying fluid pressure to the fluid-structure coupling surfaces of the structures, the following equations can be adopted to analyze the flow-induced structural vibration of the non-rotating components of the pump-turbine unit:
M x ¨ + C x ˙ + K x = F t
σ = E S x
where [ M ] is the mass matrix of the structure, [ C ] is the damping matrix, and [ K ] is the stiffness matrix of the structure. { x } , u ˙ and u ¨ are the displacement, velocity, and acceleration vectors of the structure, F ( t ) is the external volume force vector applied to the structure including the pressure load of fluid, [E] is the elasticity matrix, and [S] is the strain-displacement matrix of the structure, respectively.

3. Set-Up of Flow-Induced Vibration Calculation

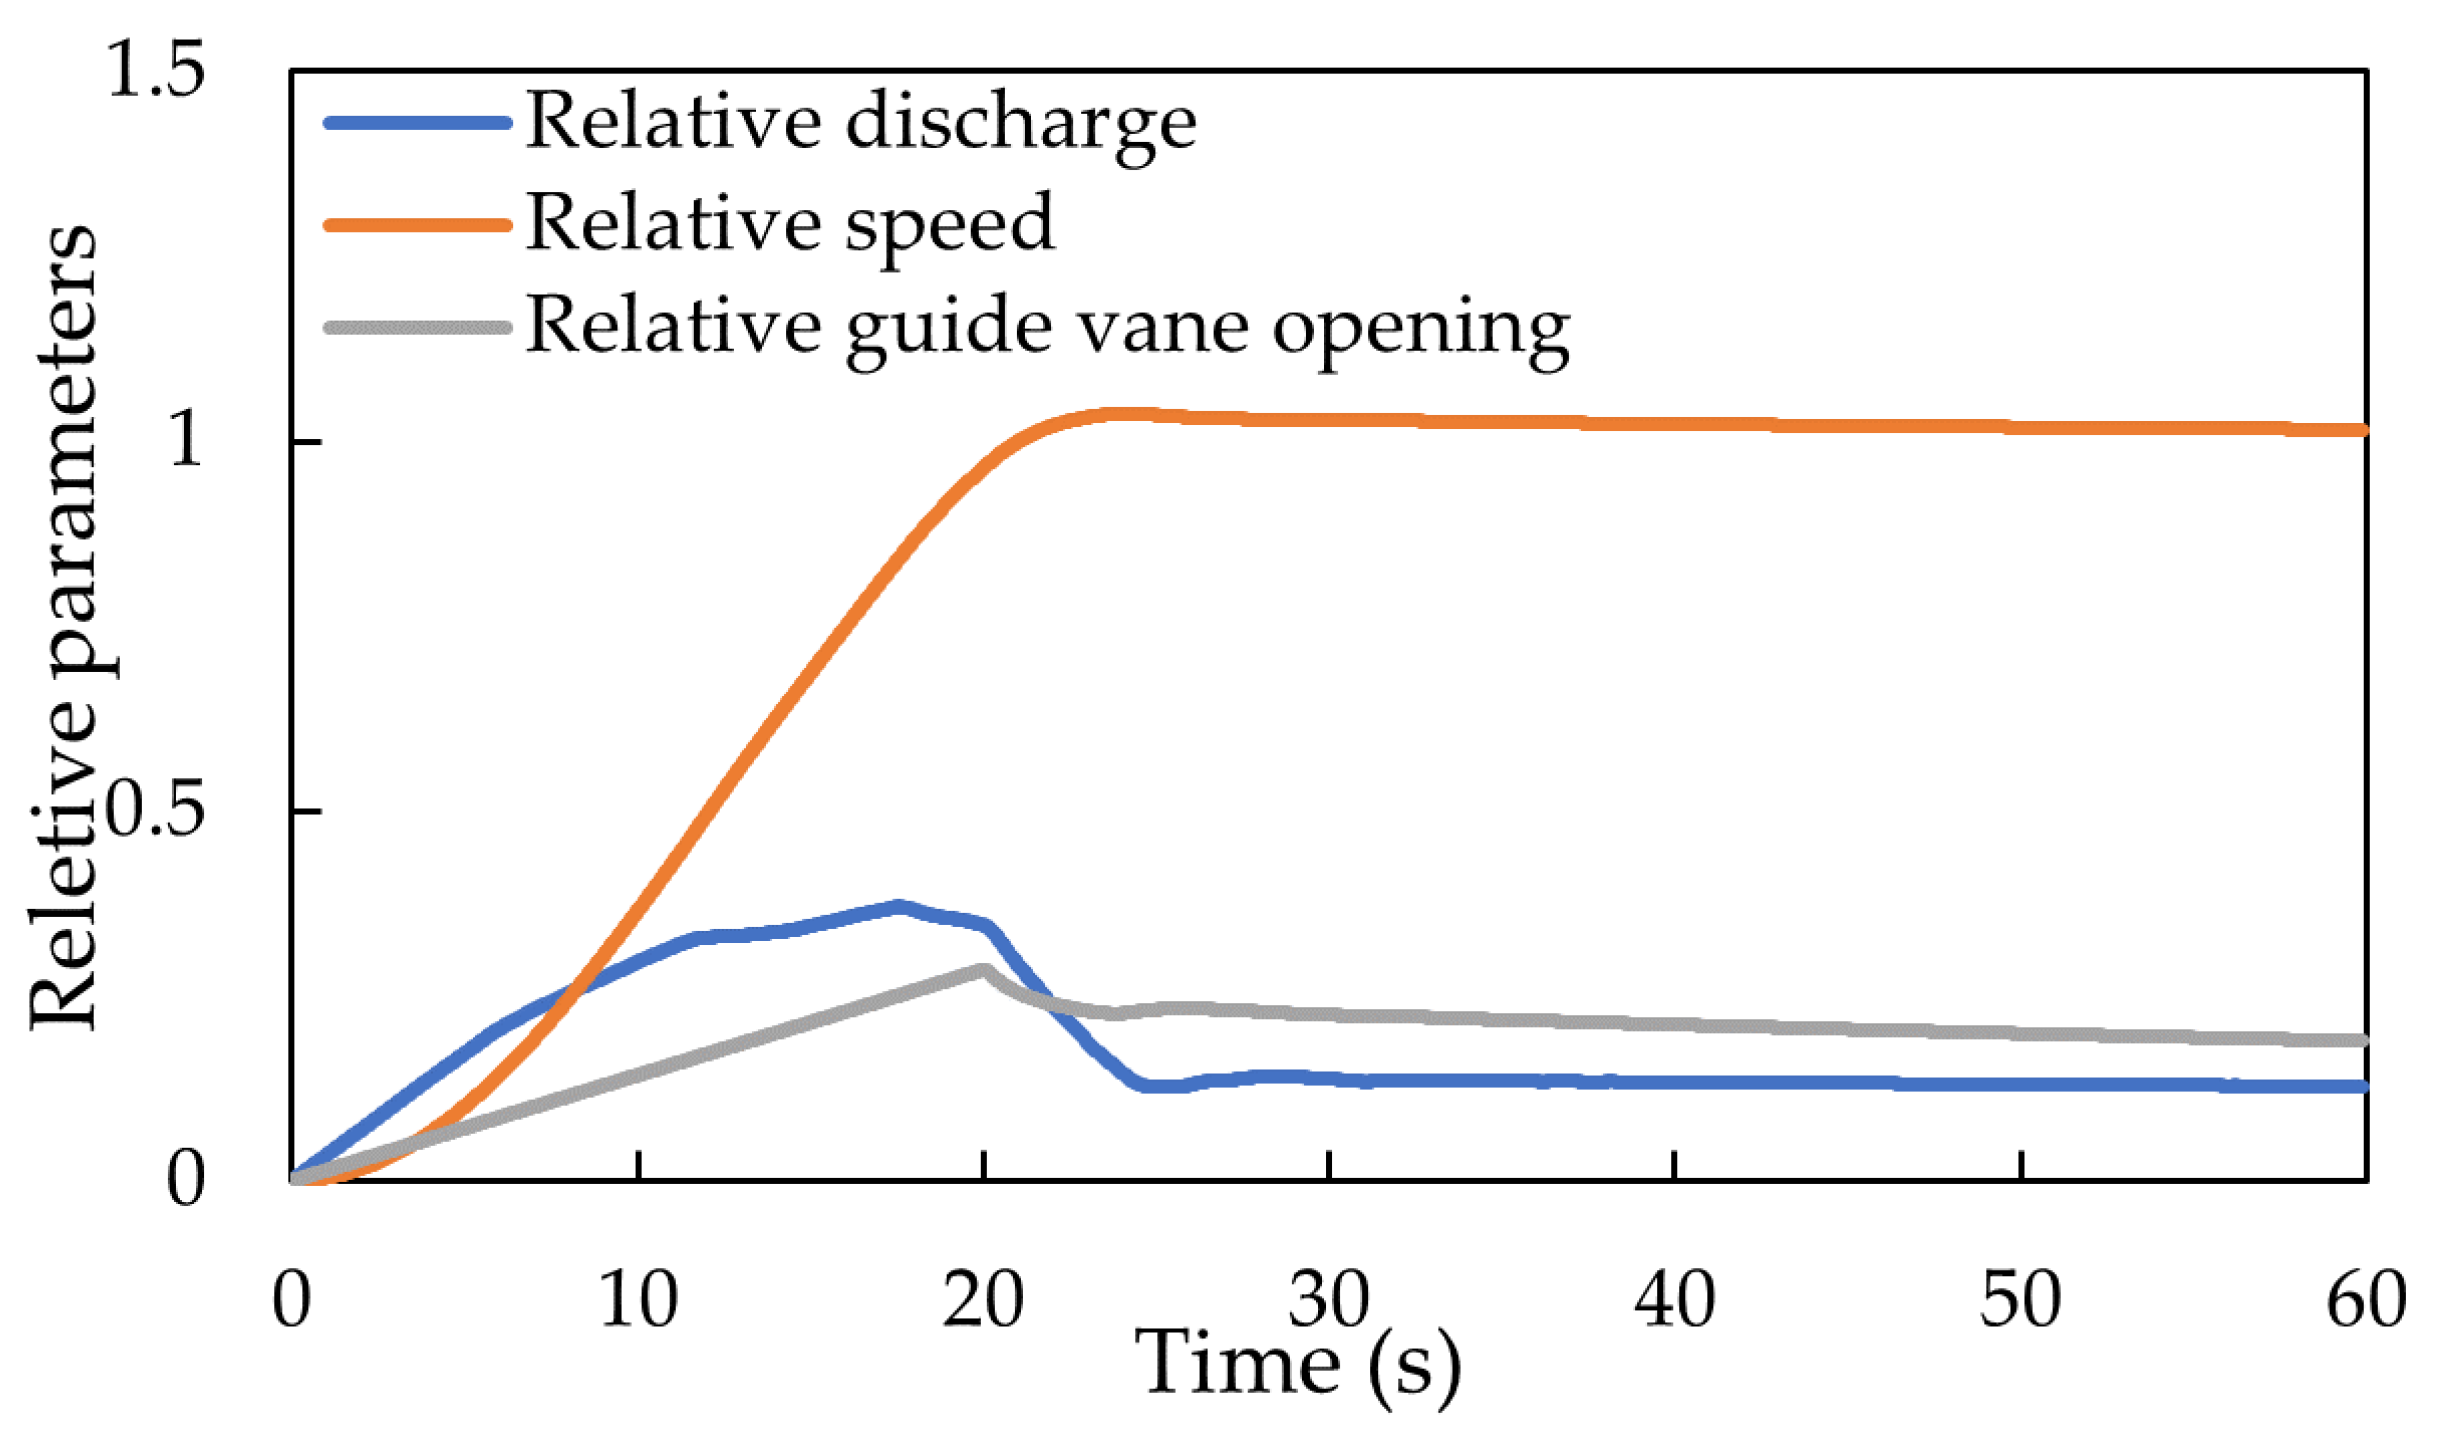
3.1. Transient Calculation of 1-D Pipeline

The researched pump-turbine unit is a vertical-shaft machine with a rated power of 300 MW and a rated rotating speed of 500 rpm. The turbine unit has 7 blades and 20 guide vanes. The rated head of the researched machine is 520 m. The structure of the flow passage of the pipeline is shown in Figure 1, which is composed of an upper and a lower reservoir, an upper and a tailrace surge shaft, four turbine units, and the penstock.
The 1-D pipeline numerical calculation during turbine start-up is carried out on the pipeline in order to determine the boundary conditions for 3-D CFD simulation for the turbine channels. The boundary conditions of the 1-D pipeline calculation are the water level of the reservoirs and the opening angle of the guide vanes. In this study, the water level between the upper and lower reservoirs is similar to the rated head.
The start-up process in turbine mode starts at 0 s and finishes at 60 s. During this time period, the guide vane opening increases from 0% to 27% and then decreases slowly from its peak value to 19% (Figure 2). By applying these boundary conditions on the 1-D model, the discharge and pressure in the pipeline are calculated, and the results are shown in Figure 2. The pressure at the spiral casing inlet and draft tube outlet calculated by 1-D simulation is displayed in Figure 3. A dimensionless parameter pressure coefficient ϕ described by Equation (12) is used in order to obtain a general rule of the pressure variation p during the turbine start-up process.
ϕ = p / ( ρ g H r )
where H r is the rated head of the unit.
The pressure coefficient at the spiral casing inlet oscillates ( ϕ s ) around 1.14 while the pressure coefficient at the draft tube outlet ( ϕ d ) oscillates around 0.17. A sudden increase in pressure at the time of 20 s is induced by the water hammer effect when the guide vane opening decreases. A total of 14 time points in Figure 3 have been picked according to the extreme values of ϕ s . The pressure values from the selected points are used as the boundary conditions of the spiral casing inlet and the draft tube outlet for the 3-D CFD simulation. The other surfaces in the CFD model were set as no-slip walls. The runner flow channel was set as the rotation domain with the corresponding rotational speed during turbine start-up, and the other flow channels were set as the stationary domains.

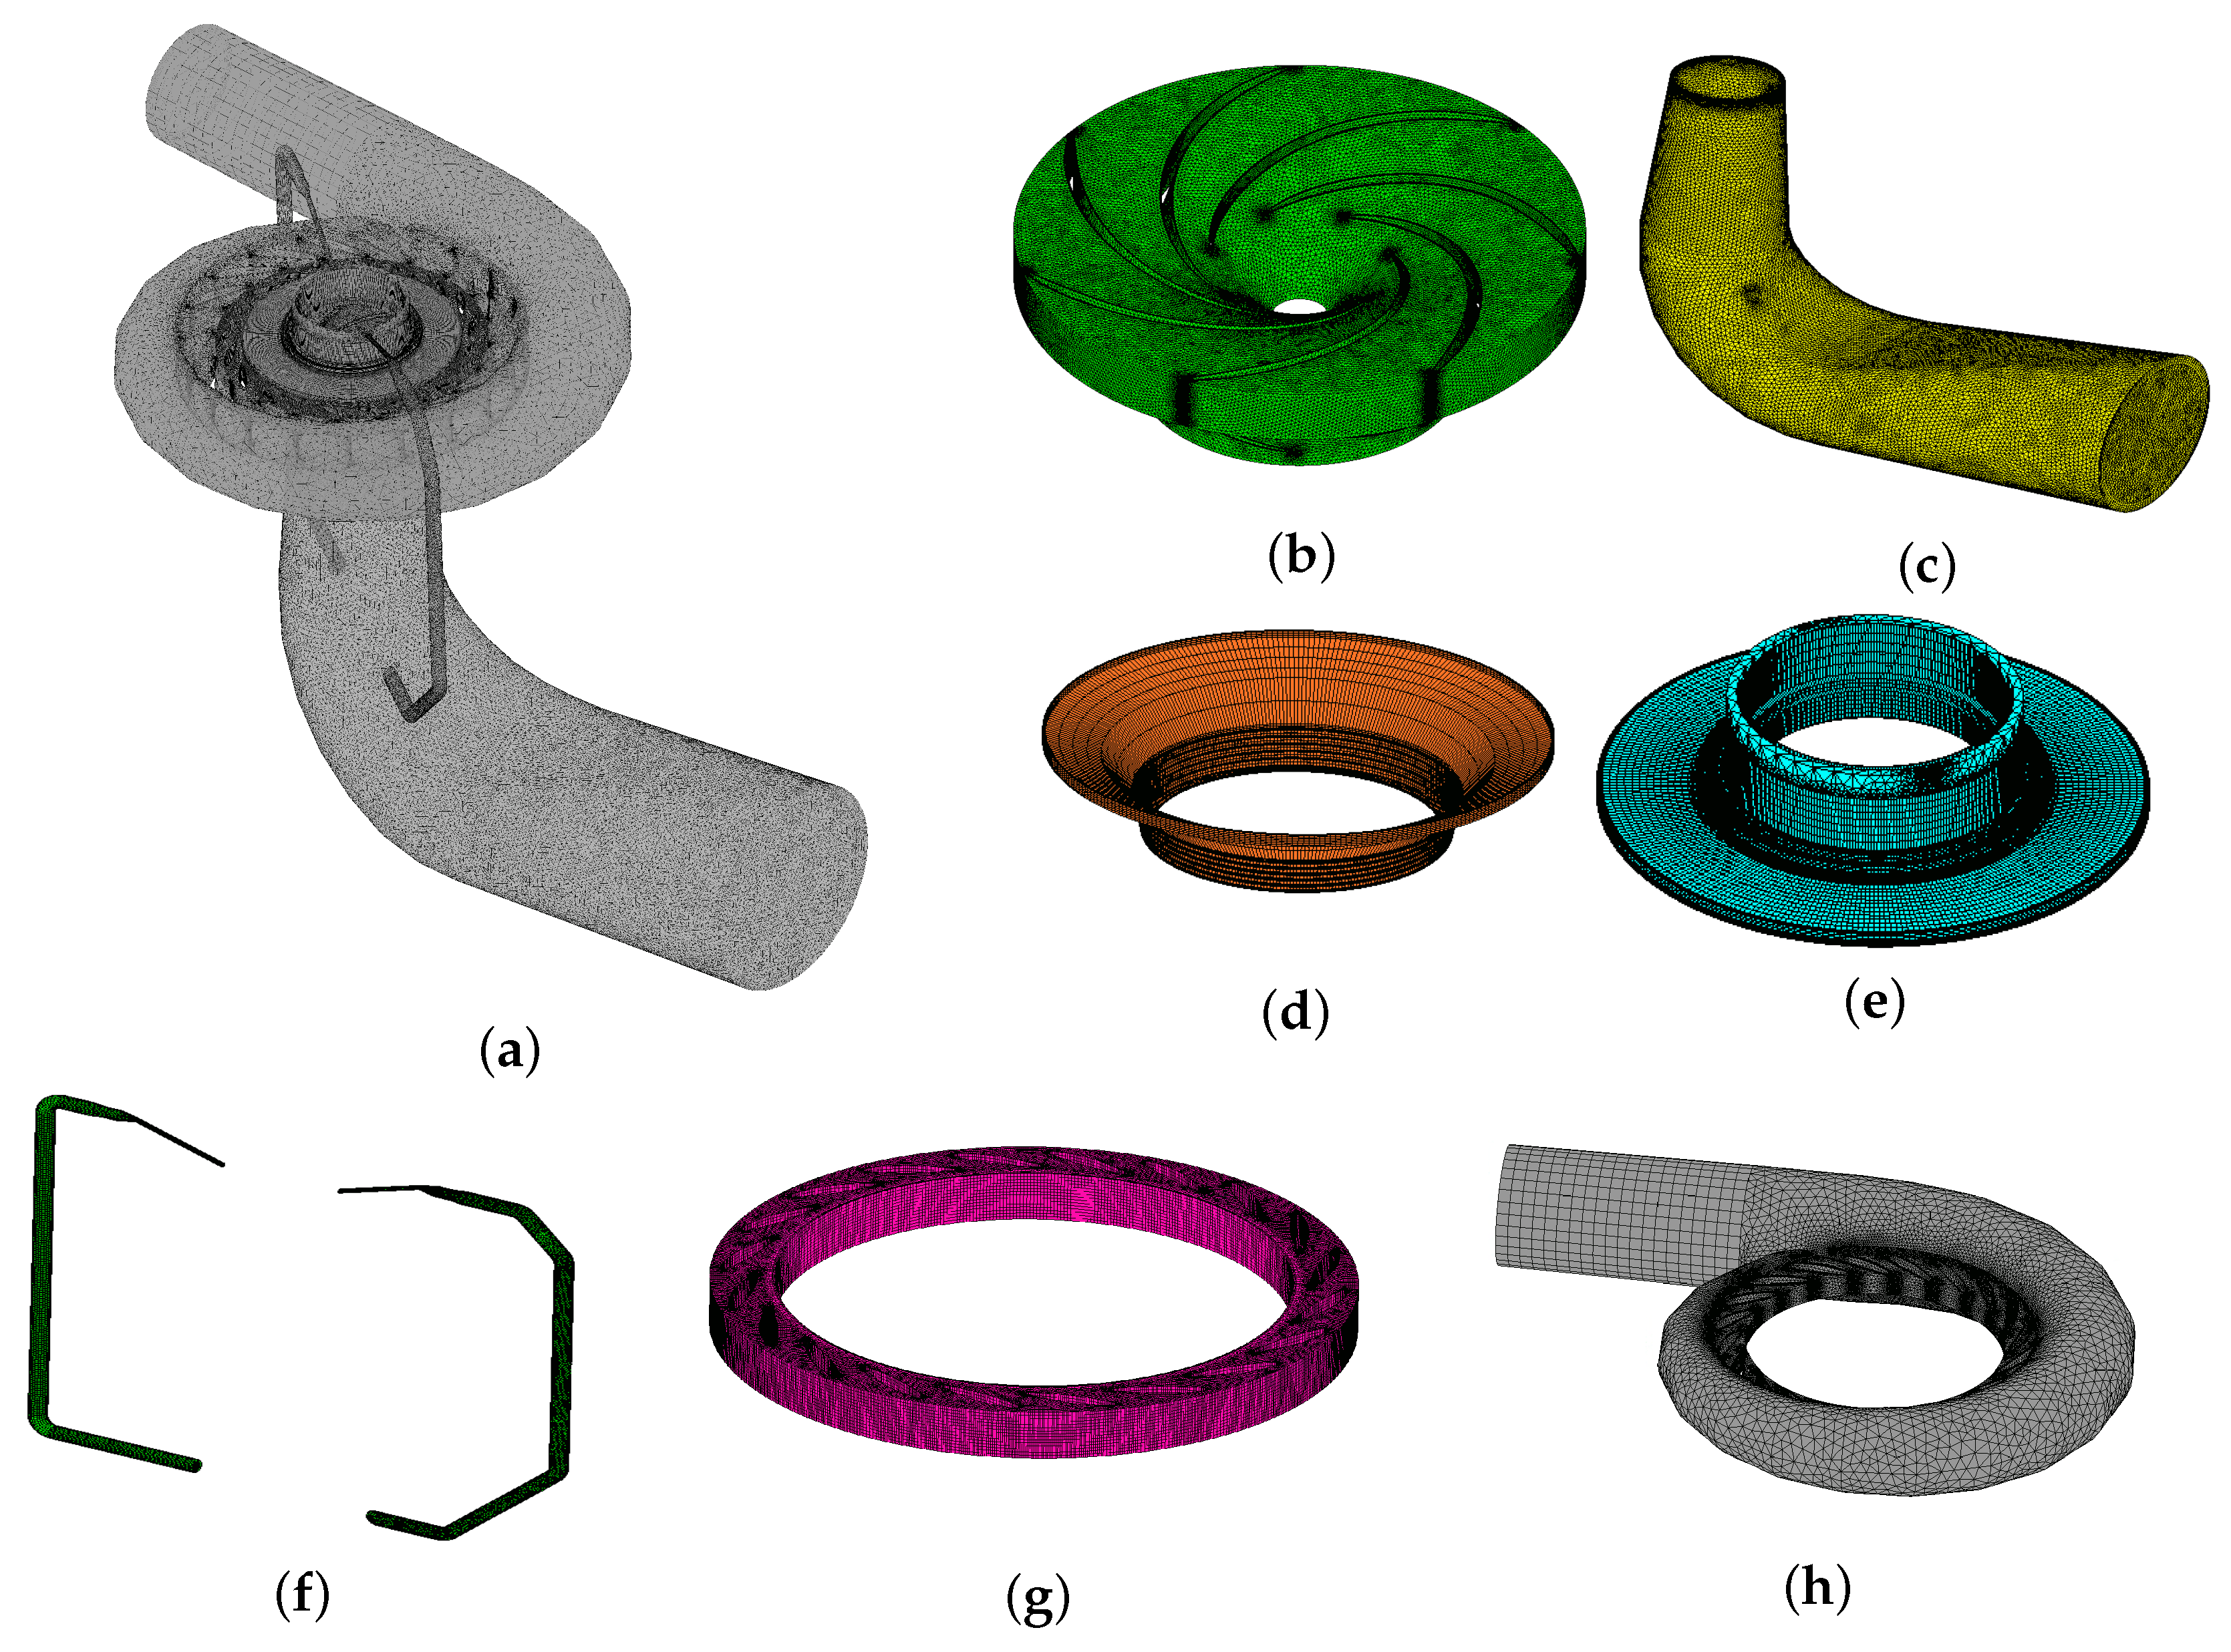
3.2. Setup of the 3-D CFD Numerical Simulation

Based on the measured parameters shown in Figure 3, 14 time points during the turbine start-up process were selected to perform the detailed flow field simulation. The 3-D simulation model of the flow passage of the researched pump-turbine is shown in Figure 4, including the spiral casing, stay and guide vanes, runner, draft tube, labyrinth seals and pressure-balance pipelines. For the following CFD numerical simulation, the flow passage in the labyrinth seal has been taken into consideration since it has a significant impact on the flow in the unit, although the size of the labyrinth seal clearance is only 1.5 mm.
The mesh for the fluid domain of the researched machine is constructed by ANSYS Meshing Tool. The element density on the boundary layers of the flow passage and the gaps between the adjacent guide vanes have been increased in order to refine the mesh quality. The hybrid mesh, which includes both tetrahedral and hexahedral elements, can achieve a good balance between the computational time and simulation quality. By using the hybrid mesh, which combines two types of elements, a rather good balance between calculation time and calculation accuracy can be achieved. The meshes of the flow passage are shown in Figure 5.
The fluid mesh independence test is performed before the calculation. Four sets of mesh (as shown in Table 1) with different numbers of elements have been developed in order to validate the grid of the fluid domain. The efficiency of the machine under the steady-state of the rated power generation condition is calculated with different sets of mesh. As shown in Figure 6, mesh set 3, marked with the green square box, is taken to carry out the CFD analysis.

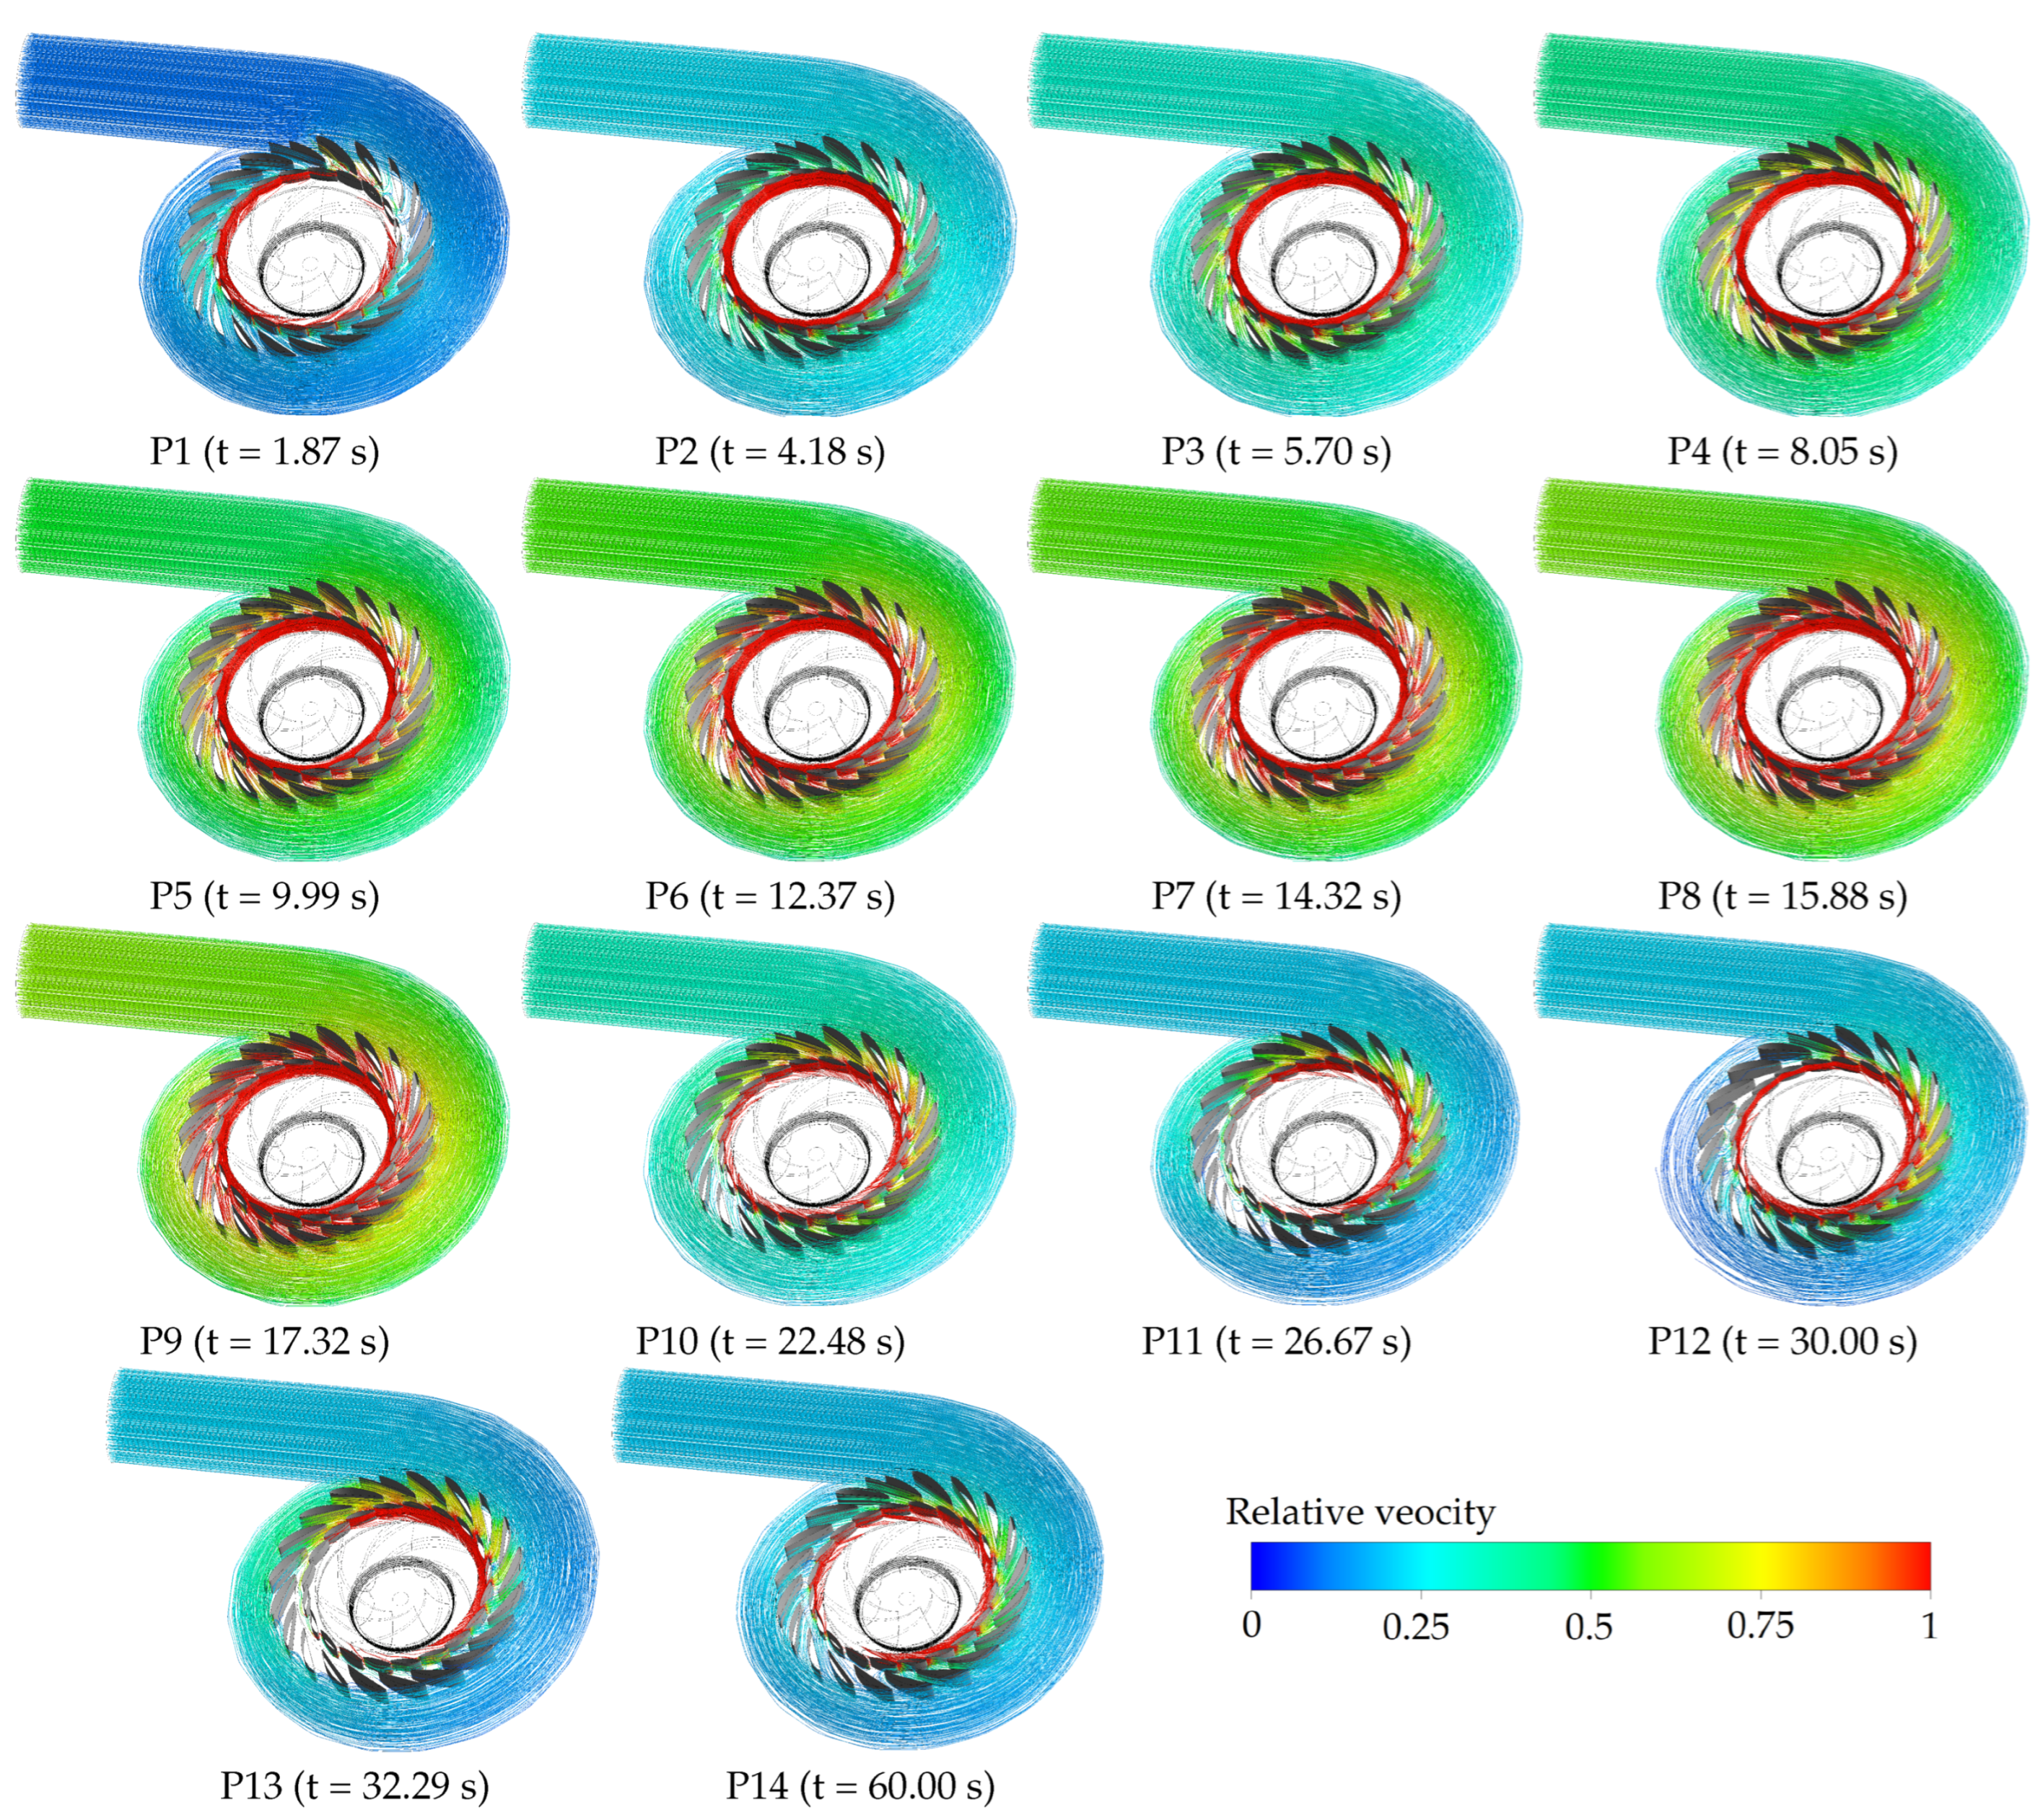
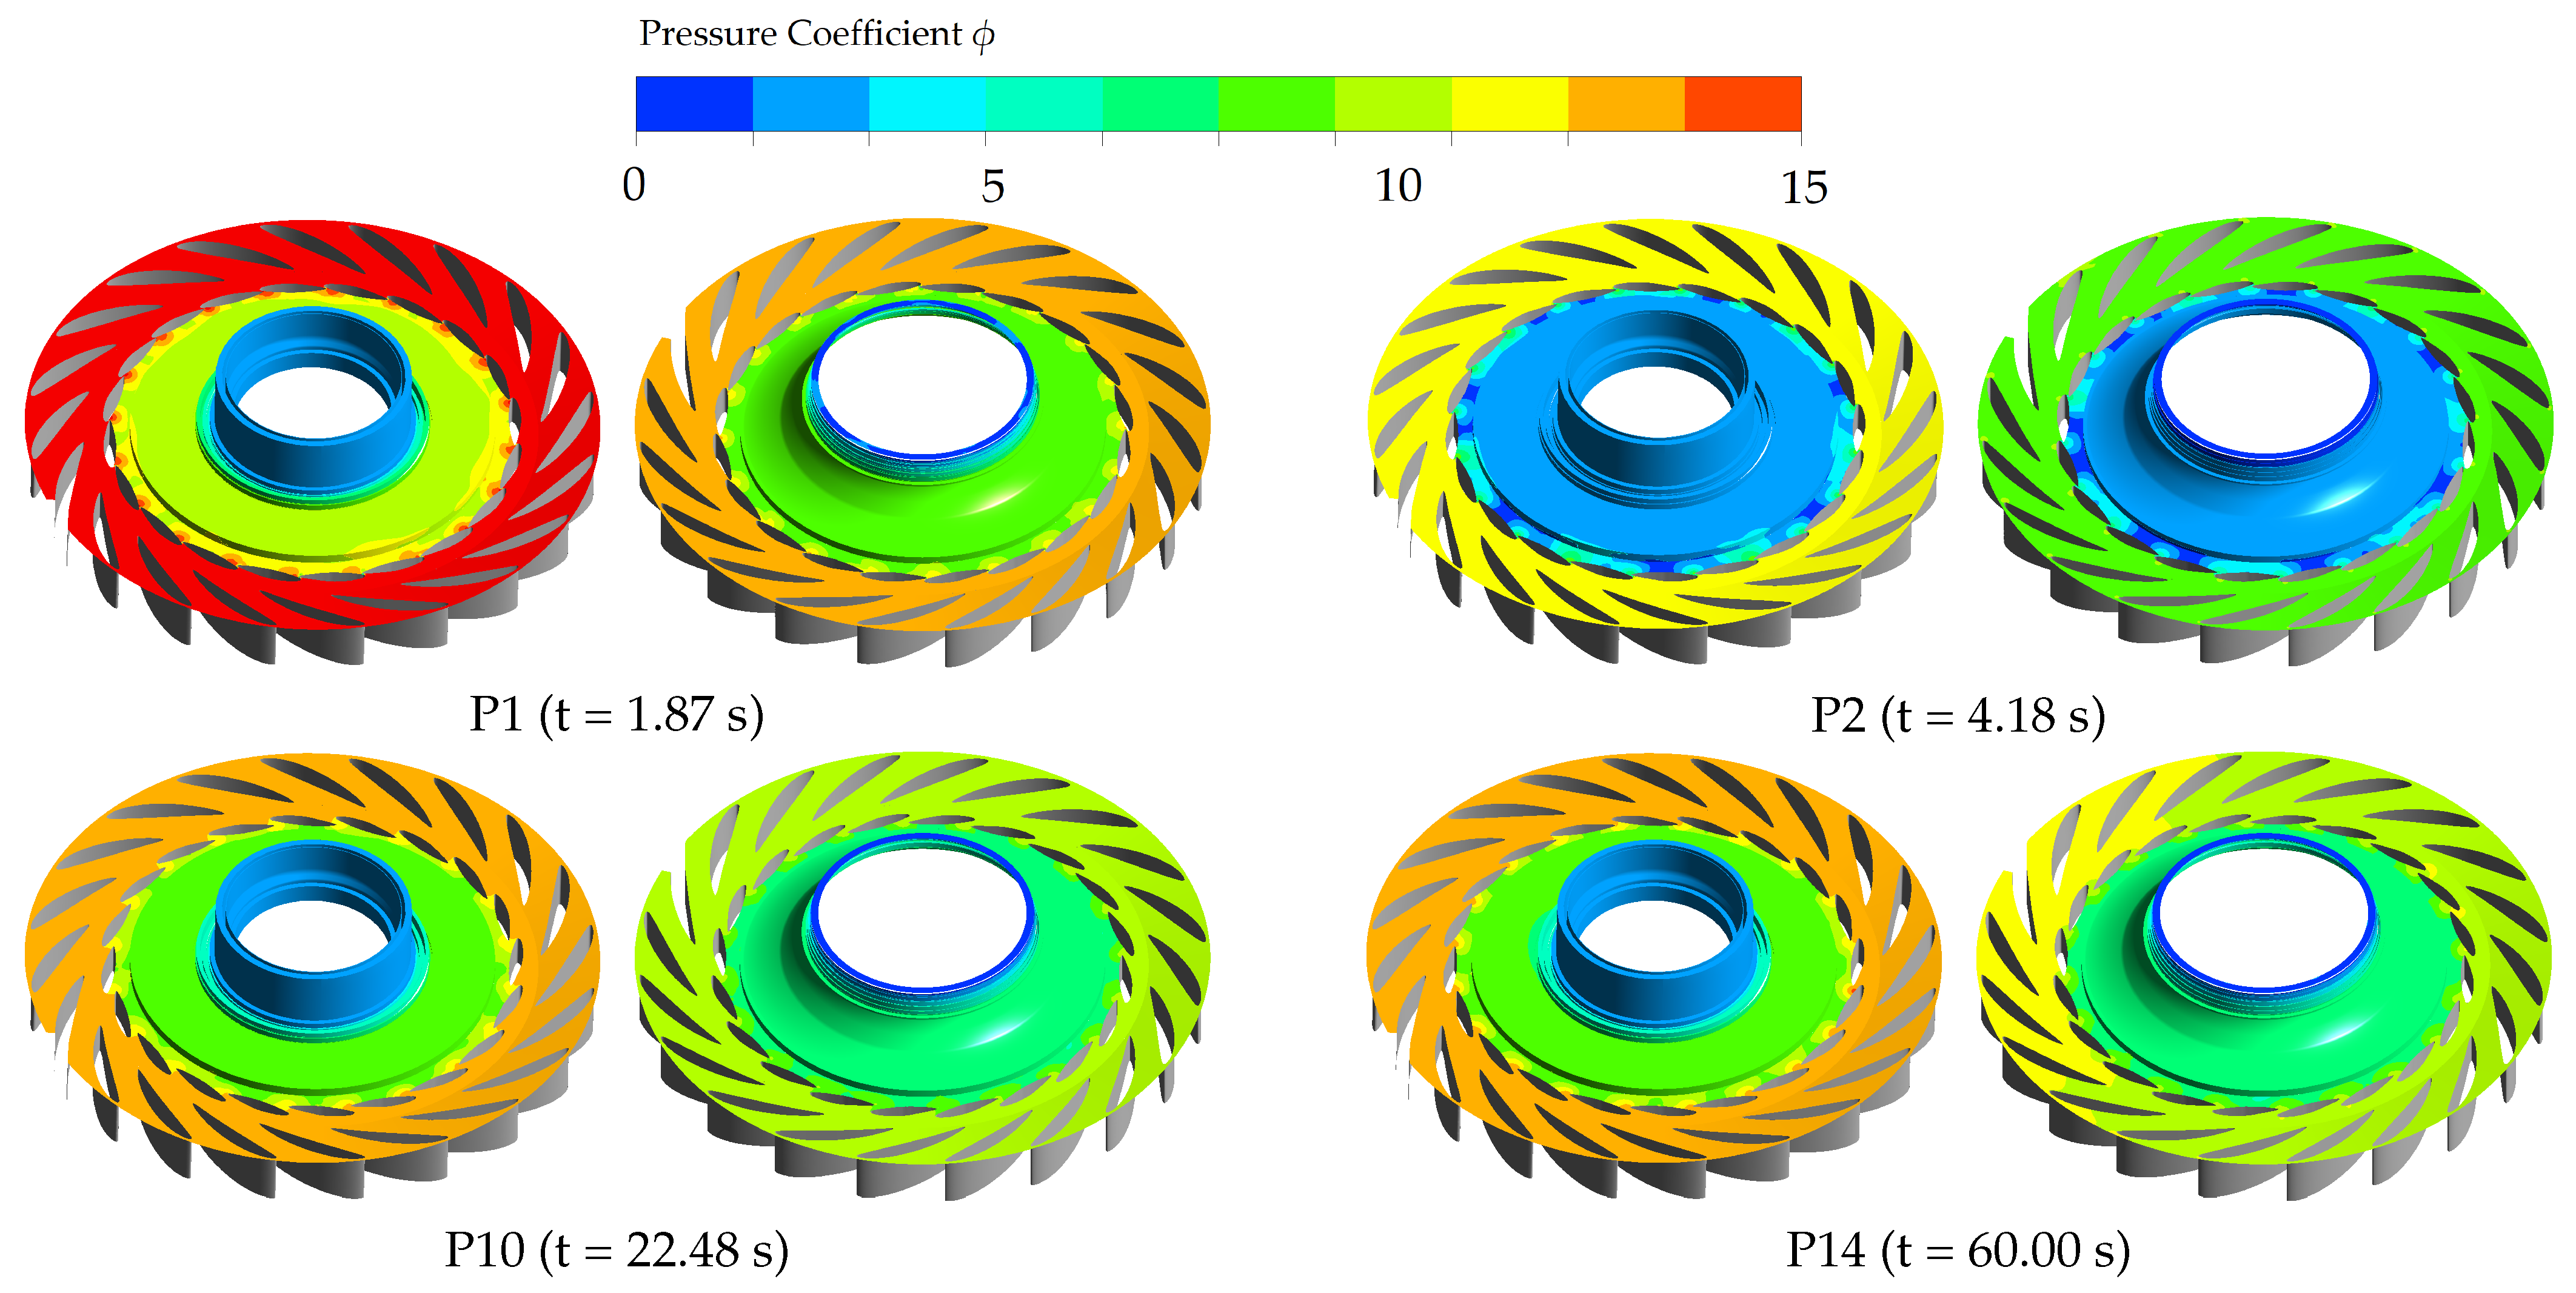
3.3. Results of the 3-D CFD Numerical Simulation

The velocity distributions of the flow passage from the spiral casing to the draft tube during the turbine start-up process are shown in Figure 7. The color of the streamlines indicates the velocity of the flow. From the figure it can be seen that the flow velocity in the spiral casing is the lowest (nearly zero) at the beginning of the start-up process. At the start, the gap between the adjacent guide vanes is small, so the fluid velocity before the guide vanes is low. Because of the small discharge, the circumferential asymmetry phenomenon raises the flow passage of the spiral casing. From each figure it can be seen that the red color, which means a higher velocity, always appears in the guide vane and vaneless region. The velocity of the fluid in the stay vane region is between the velocity of the guide vane area and spiral casing. From the spiral casing to the runner, the velocity keeps raising. The velocity increases dramatically after the guide vanes open. It reaches its highest value at the time of 17.32 s. At this moment, the streamline before and after the guide vanes gets more uniform, and the circumference flow in the vaneless region disappears. The velocity of the flow in the spiral casing increases in the beginning but decreases in the middle of the start-up process. The highest flow velocity appears in the middle of the start-up process. At Point 10 (t = 22.48 s), the velocity decreases. According to the Bernoulli principle, the pressure increases, which can be seen from Figure 3. The discharge keeps decreasing until t = 26.67 s and then reaches the velocity of no-load condition.
The pressure distributions in the upper and lower side of the flow passage from stay vanes to draft tube at four typical moments (t = 1.87 s, t = 4.18 s, t = 22.48 s, t = 60.00 s) are displayed in Figure 8. The upper side of the flow passage includes the region of the stay vanes, guide vanes, upper chamber, and upper labyrinth seal, while the lower side includes the stay vanes, guide vanes, upper chamber, and upper labyrinth seal. In each subfigure, the upper side is on the left and the lower side is on the right. From Figure 8 it can be seen that the upper side at the beginning of the start-up process has the largest pressure. At this time, the discharge is low so that the pressure applied on the flow passage equals the static pressure of the water. With the guide vanes open, the flow rate increases. According to the Bernoulli principle, the pressure decreases with the rise of the flow velocity. However, at the time of 22.48 s, the pressure increases in the flow passage, which corresponds to the lowest discharge in the flow passage. The same phenomenon can also be seen in Figure 3. In Figure 3, the pressure in the spiral casing inlet increases at 20 s, which is caused by the water hammer. Figure 8 also indicates that the pressure before the guide vanes is much higher than that in the runner chamber, which is due to the small opening of the guide vanes. In addition, during turbine start-up, the pressure on the upper side of the flow channel is always higher than that on the lower side. The pressure drops sharply from the runner chamber to the upper and lower labyrinth seals.

4. Flow-Induced Vibration Analysis of Non-Rotating Structures

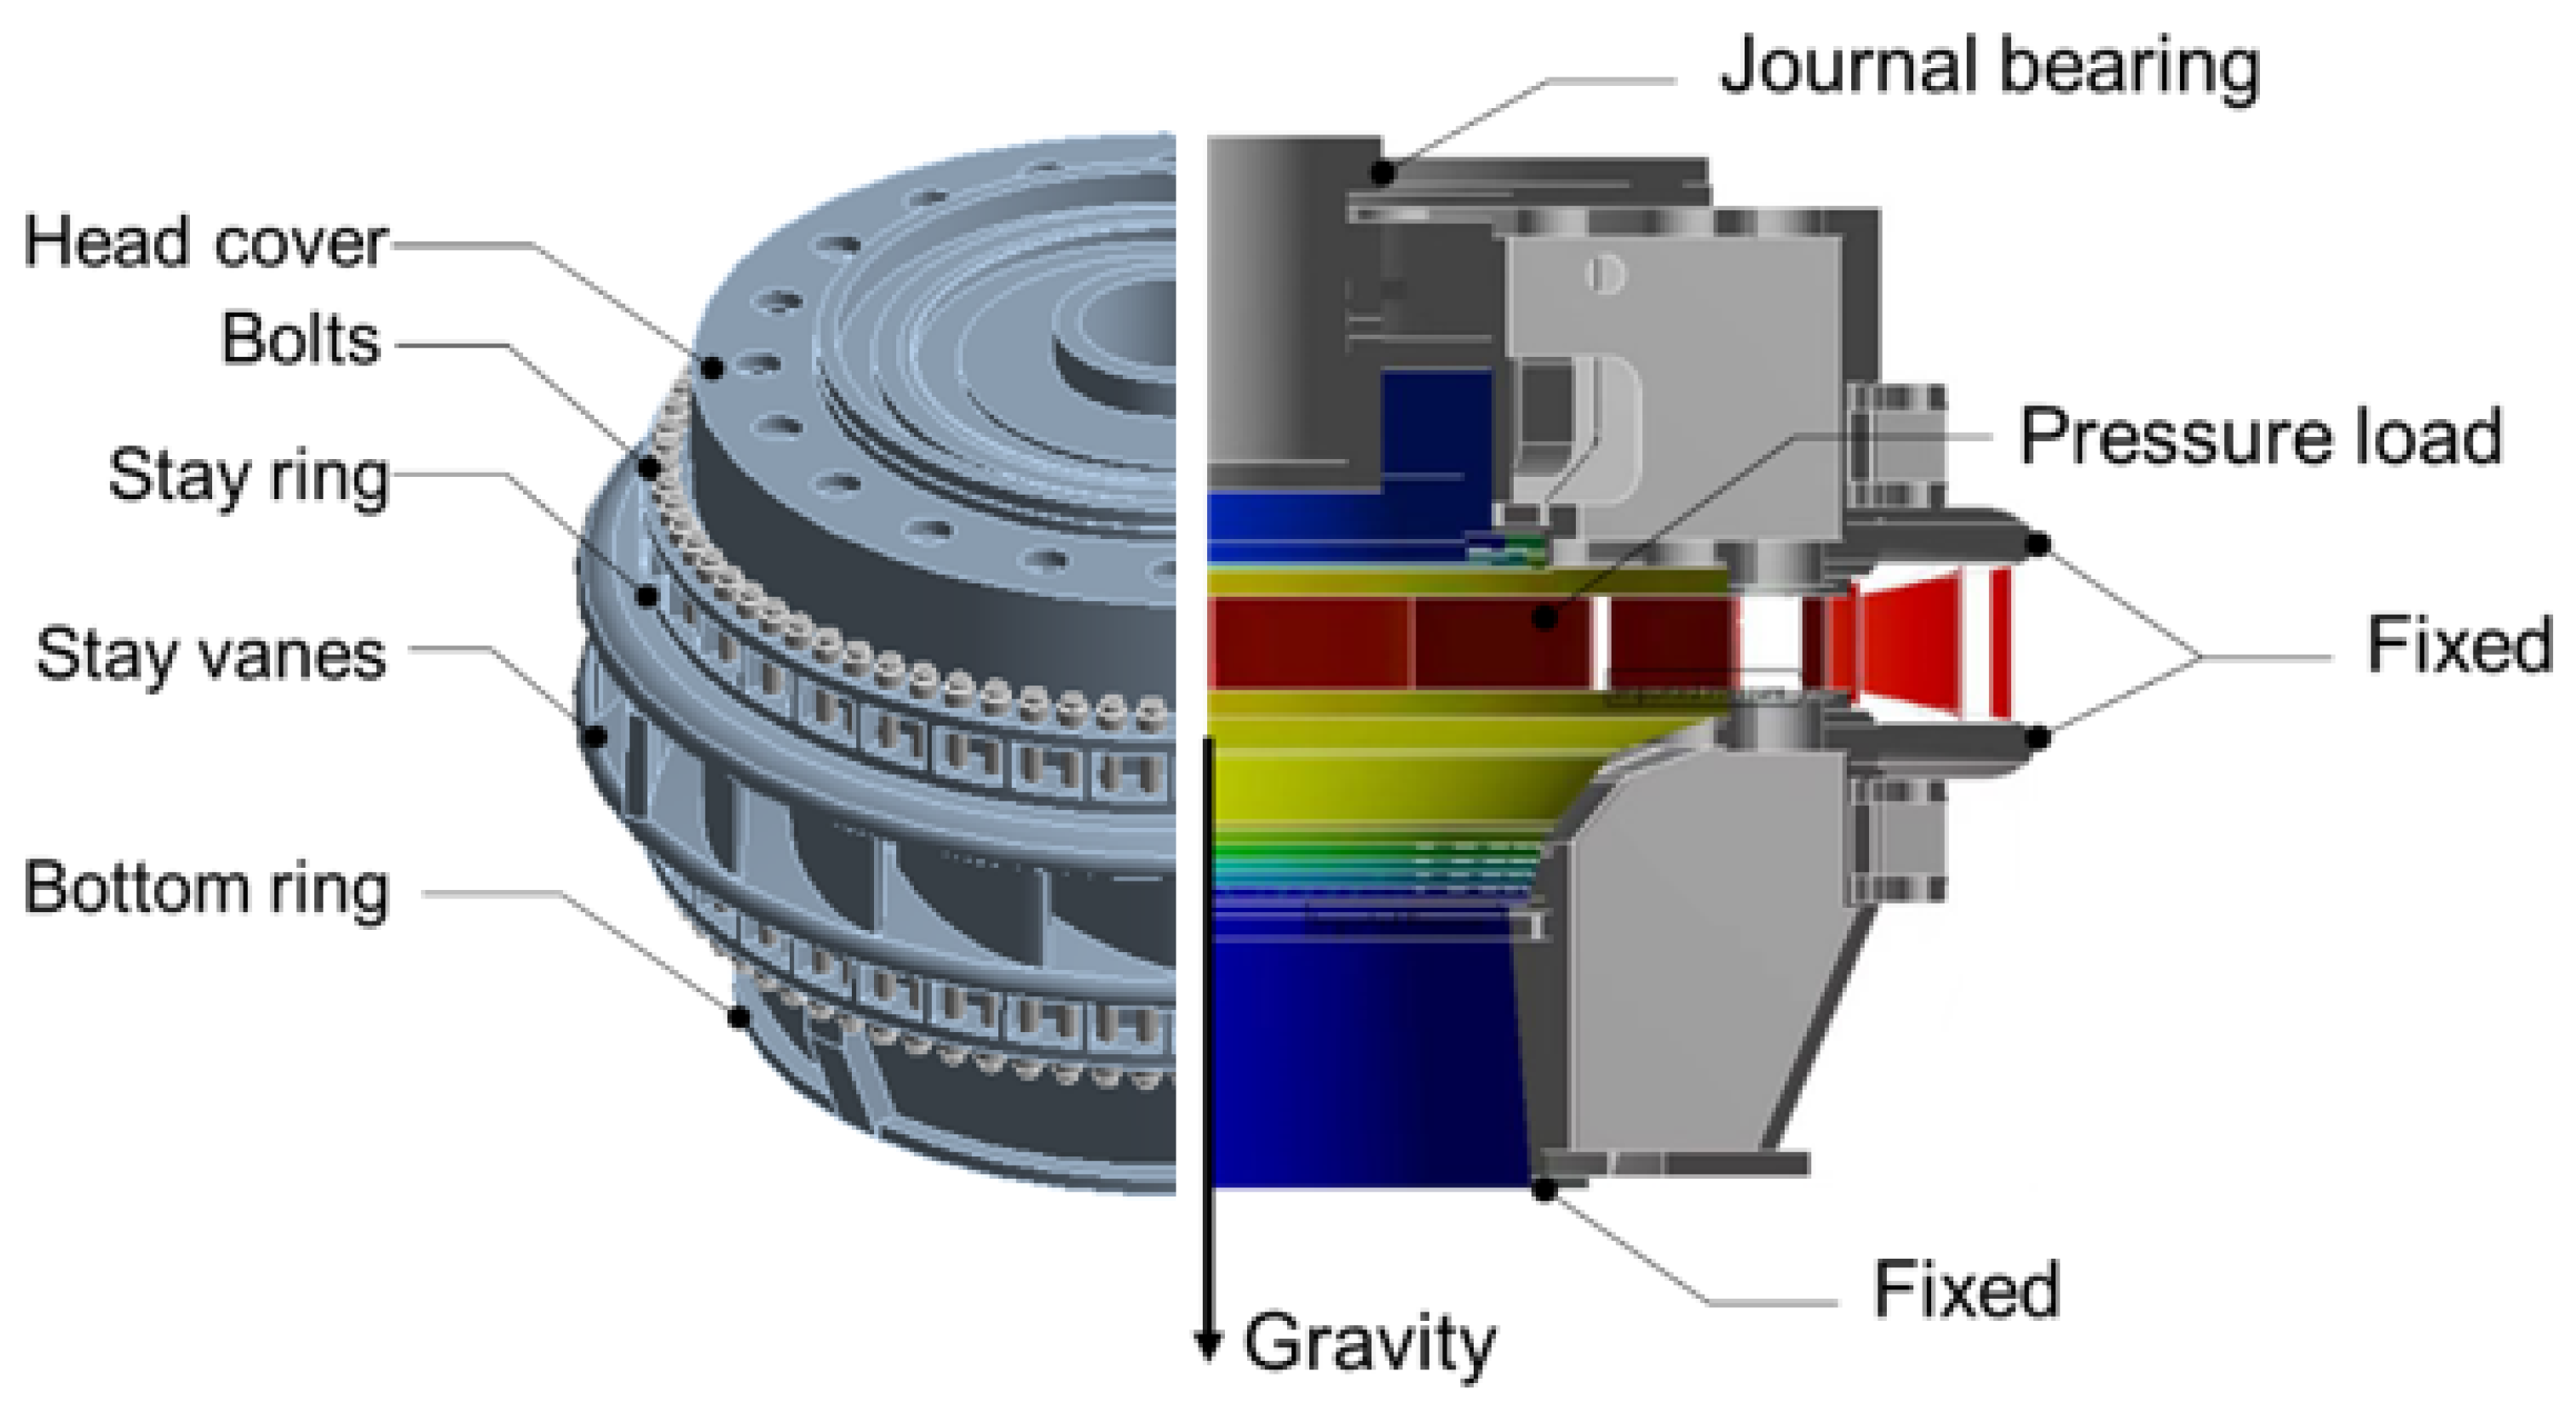
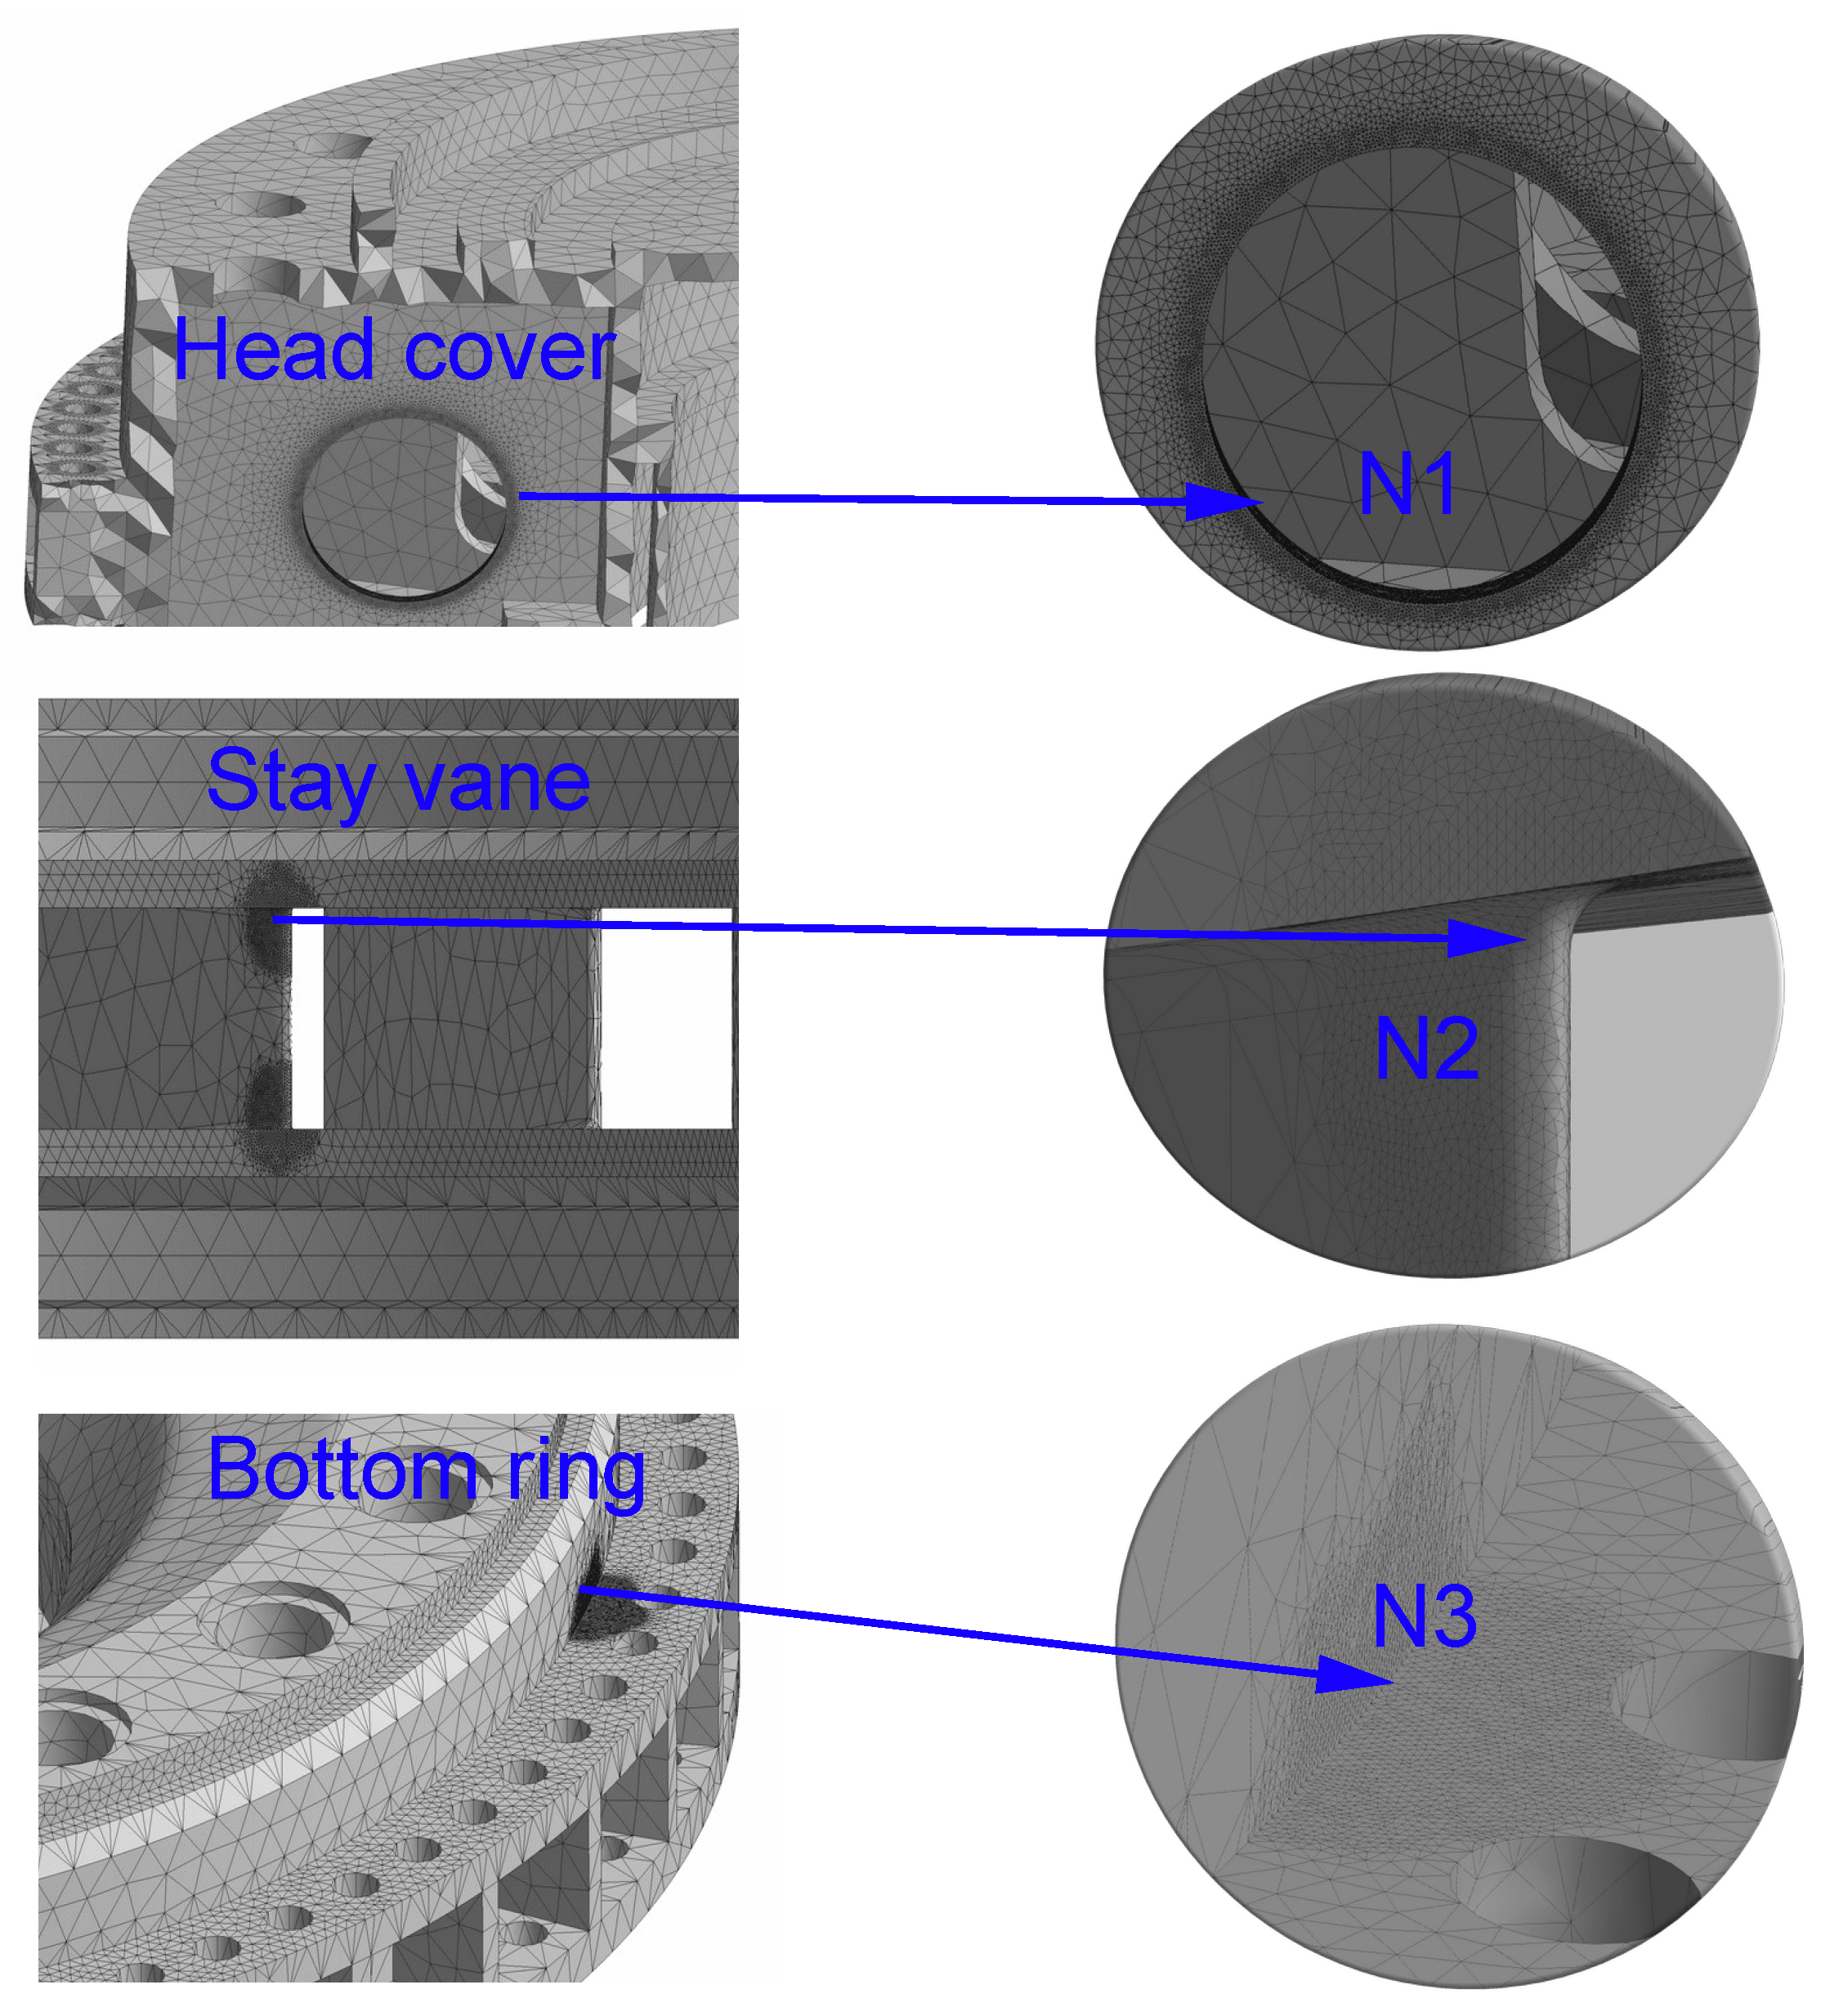
4.1. Setup of the Flow-Induced Vibration Analysis for Non-Rotating Structures

The geometry model and boundary conditions of the non-rotating structures of the researched pump-turbine unit are demonstrated in Figure 9. The entire non-rotating structure is assembled by the head cover, bottom ring, stay ring, stay vanes, and high-strength bolts. The density, elastic modulus, and Poisson’s ratio of the non-rotating structures are 7850 kg · m 3 , 2.1 × 10 11 Pa, and 0.3, respectively.
Since the non-rotating structures of the unit have been embedded in concrete during construction, the surfaces of the structure connected to the concrete are set as a fixed constraint boundary condition for the flow-induced vibration simulation. The turbine journal bearing stiffness is 1 × 10 6 N · mm 1 and the earth gravity is 9.8 m · s 2 . The pressure profiles calculated by 3-D CFD are applied to the inner surface of the non-rotating structures for flow-induced vibration simulation using ANSYS Mechanical.
Three groups of meshes with 0.8, 1.1, and 3.0 million high-quality tetrahedral elements are created for the non-rotating structures (Figure 10) for the mesh independence study. The local meshes for the stress concentration locations of the head cover, stay vane, and bottom ring are also refined.
Figure 11 compares the stresses at nodes N1, N2, and N3 for non-rotating structures with different amounts of elements under designed operating conditions, and the corresponding computational time consumption. The mesh independence study shows that the results of the second group of mesh are similar to those of the third group of mesh, but the computation time is only about 0.11% of that of the third one. Therefore it is reasonable to use the second group of mesh for following flow-induced vibration simulations.

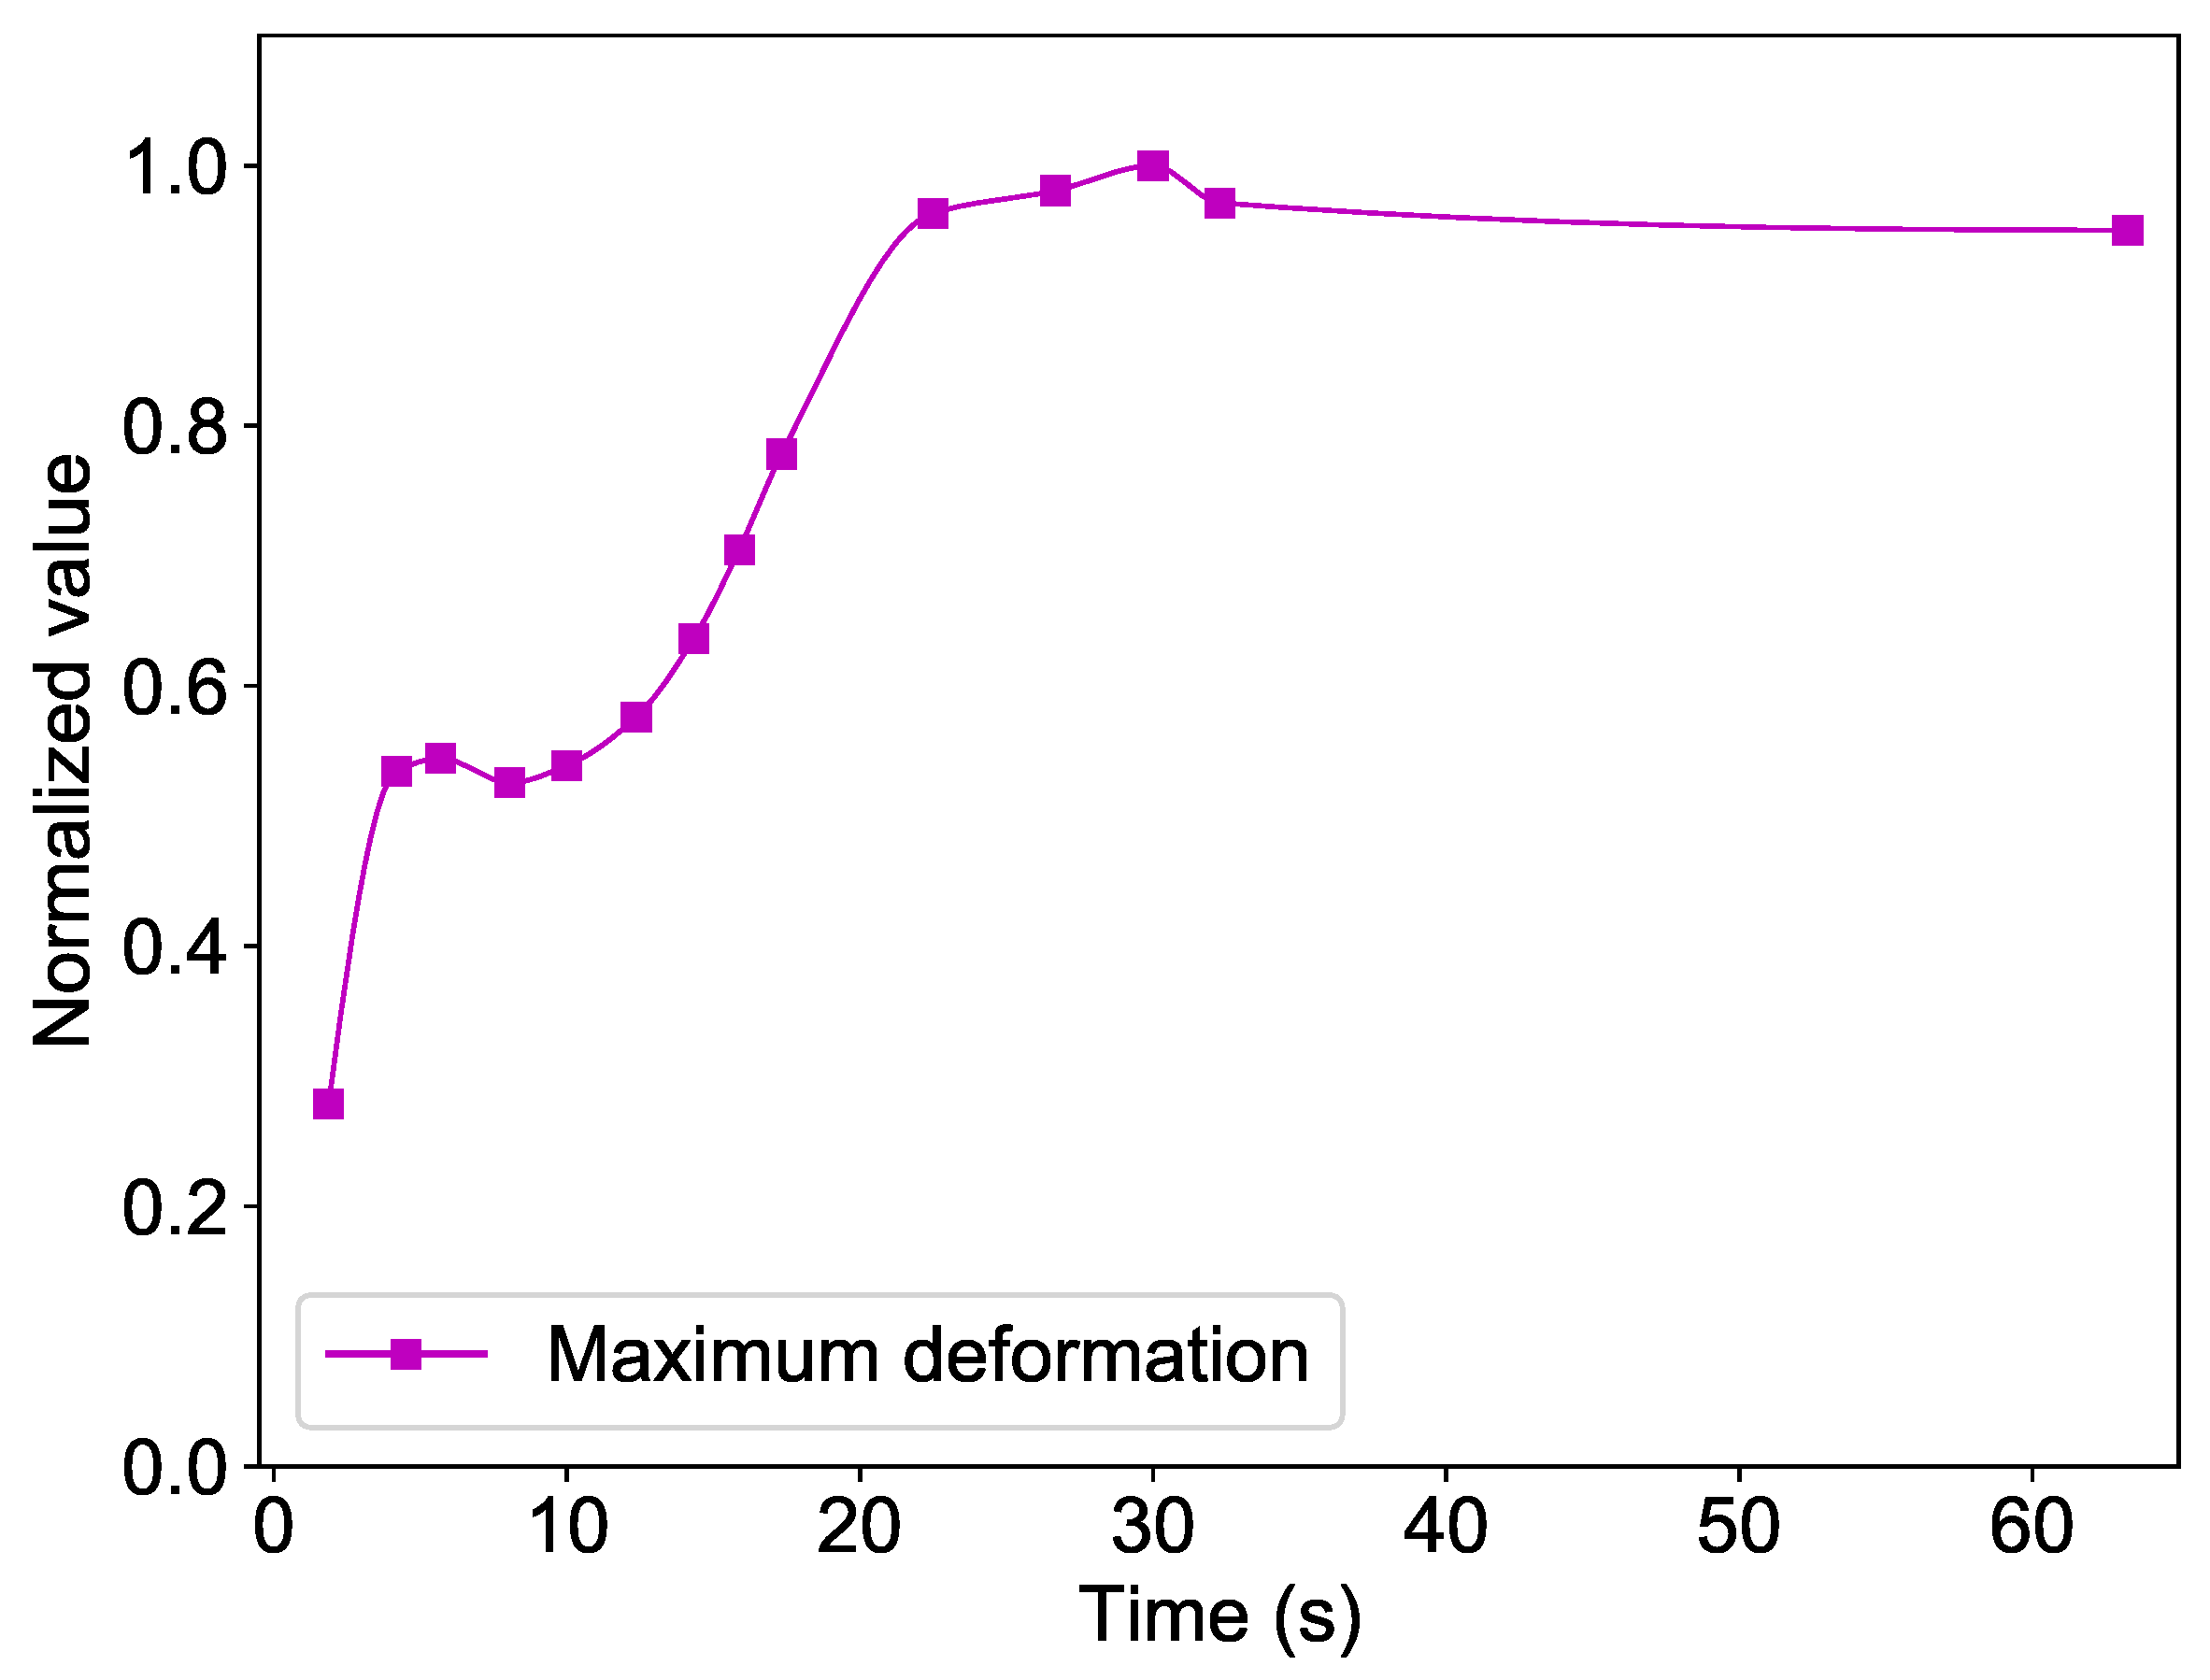
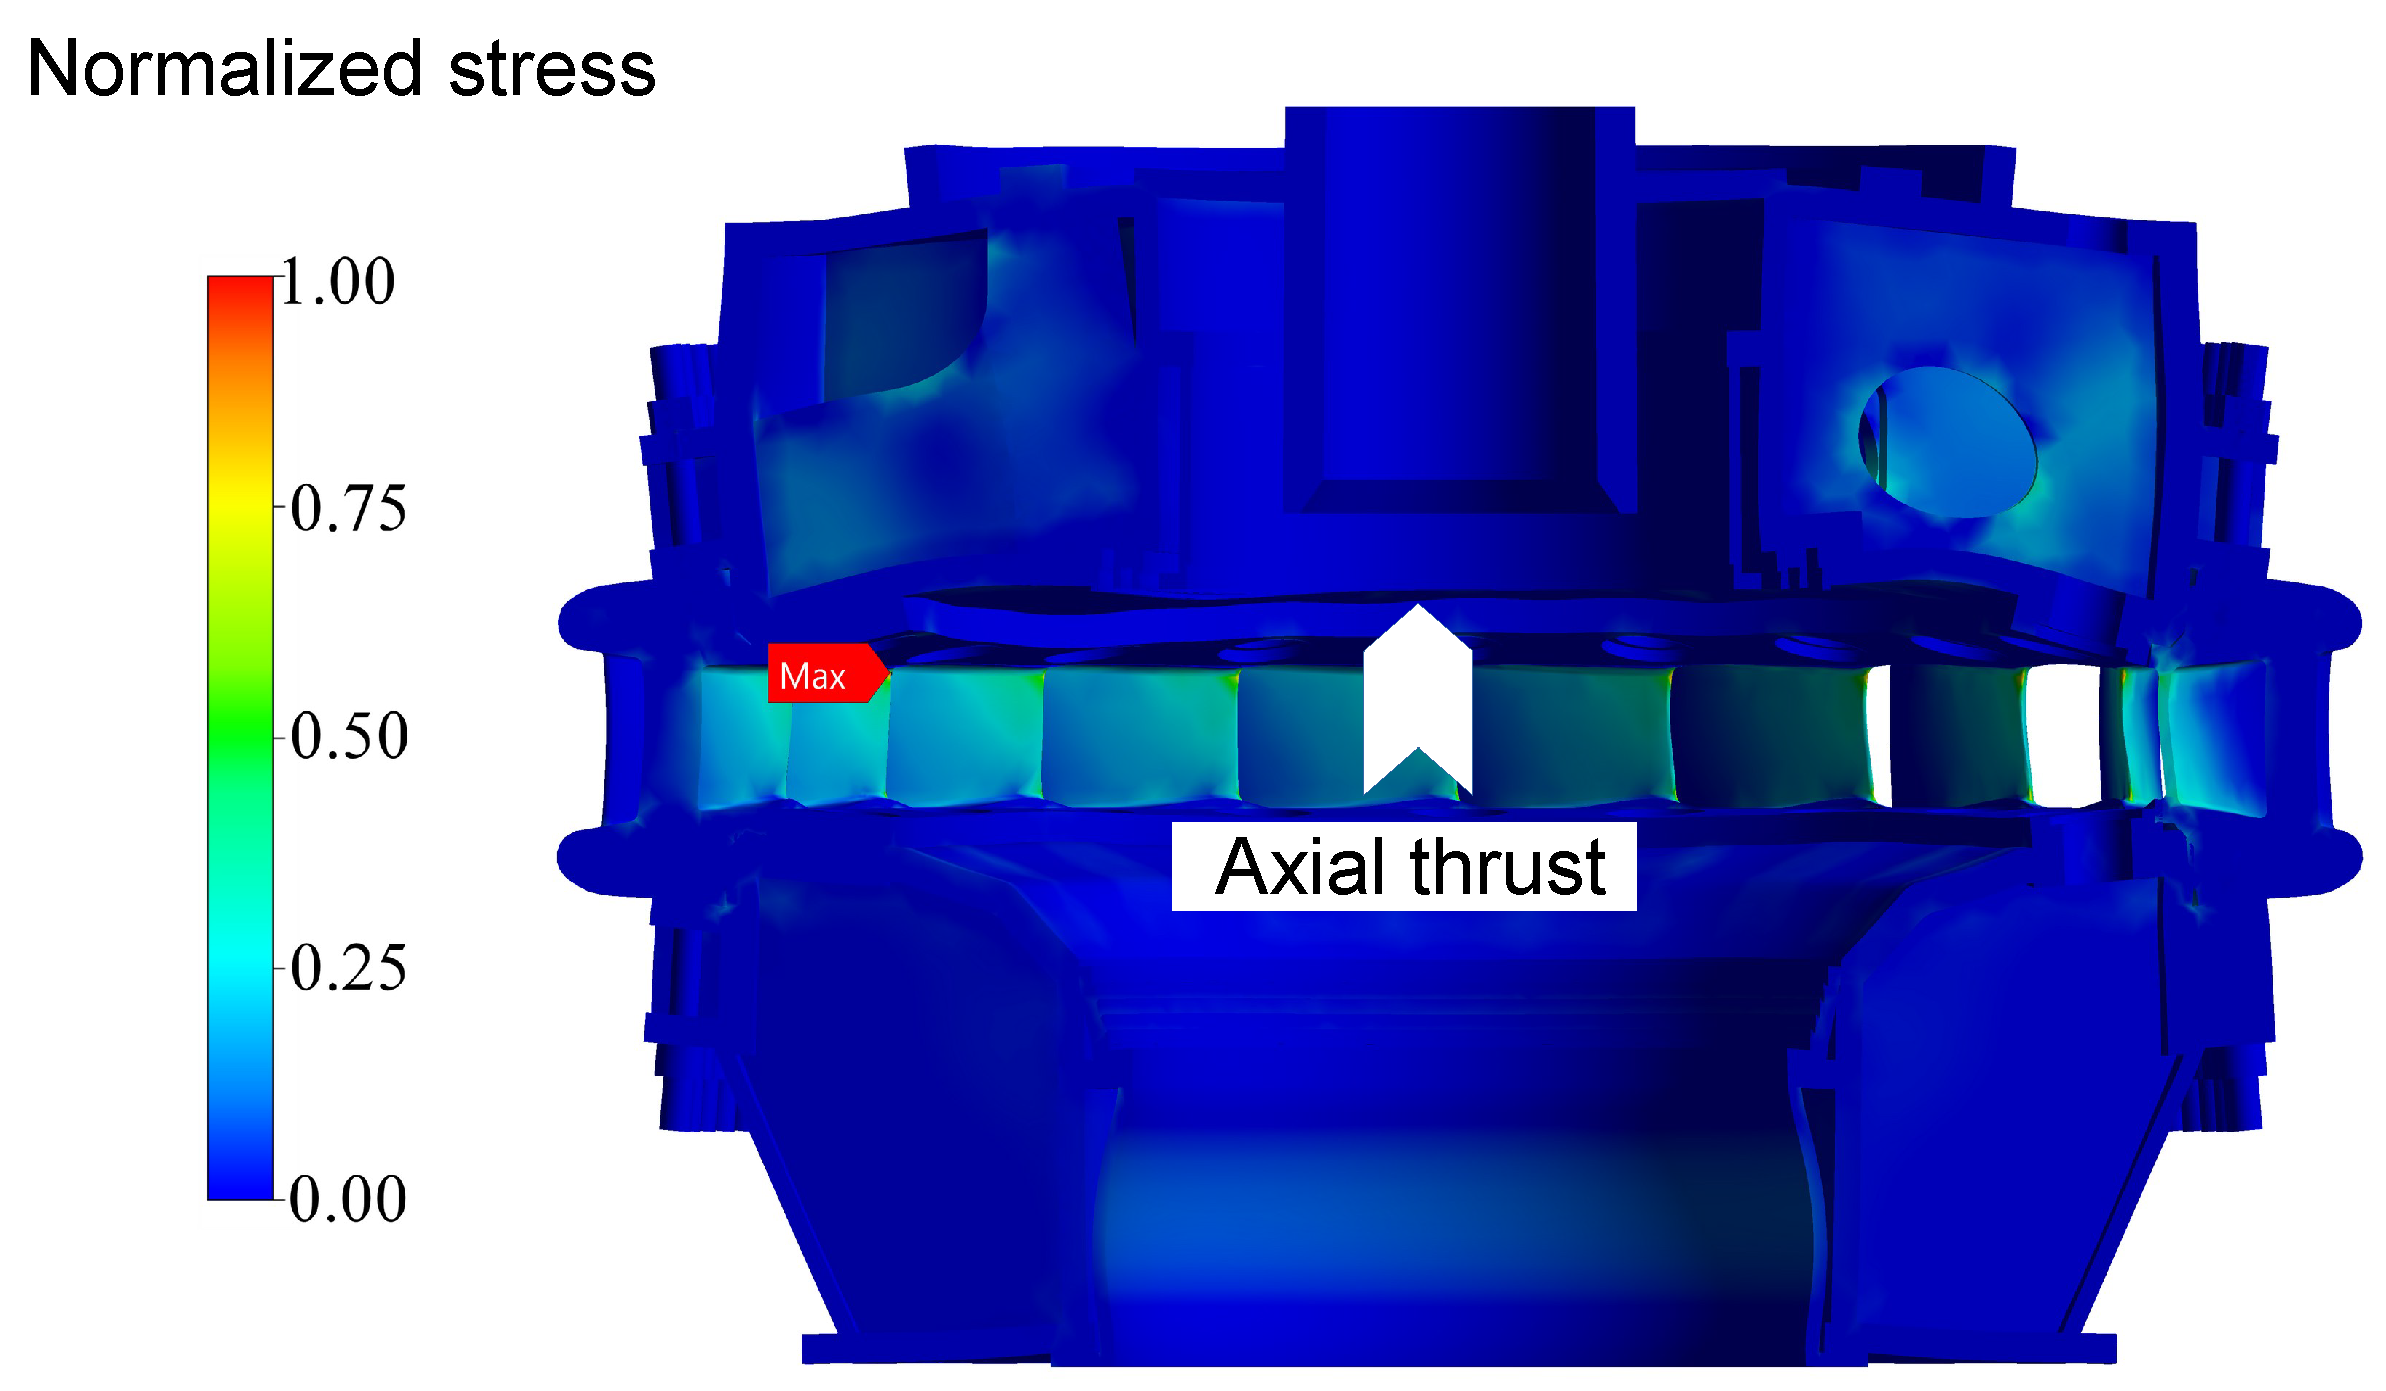
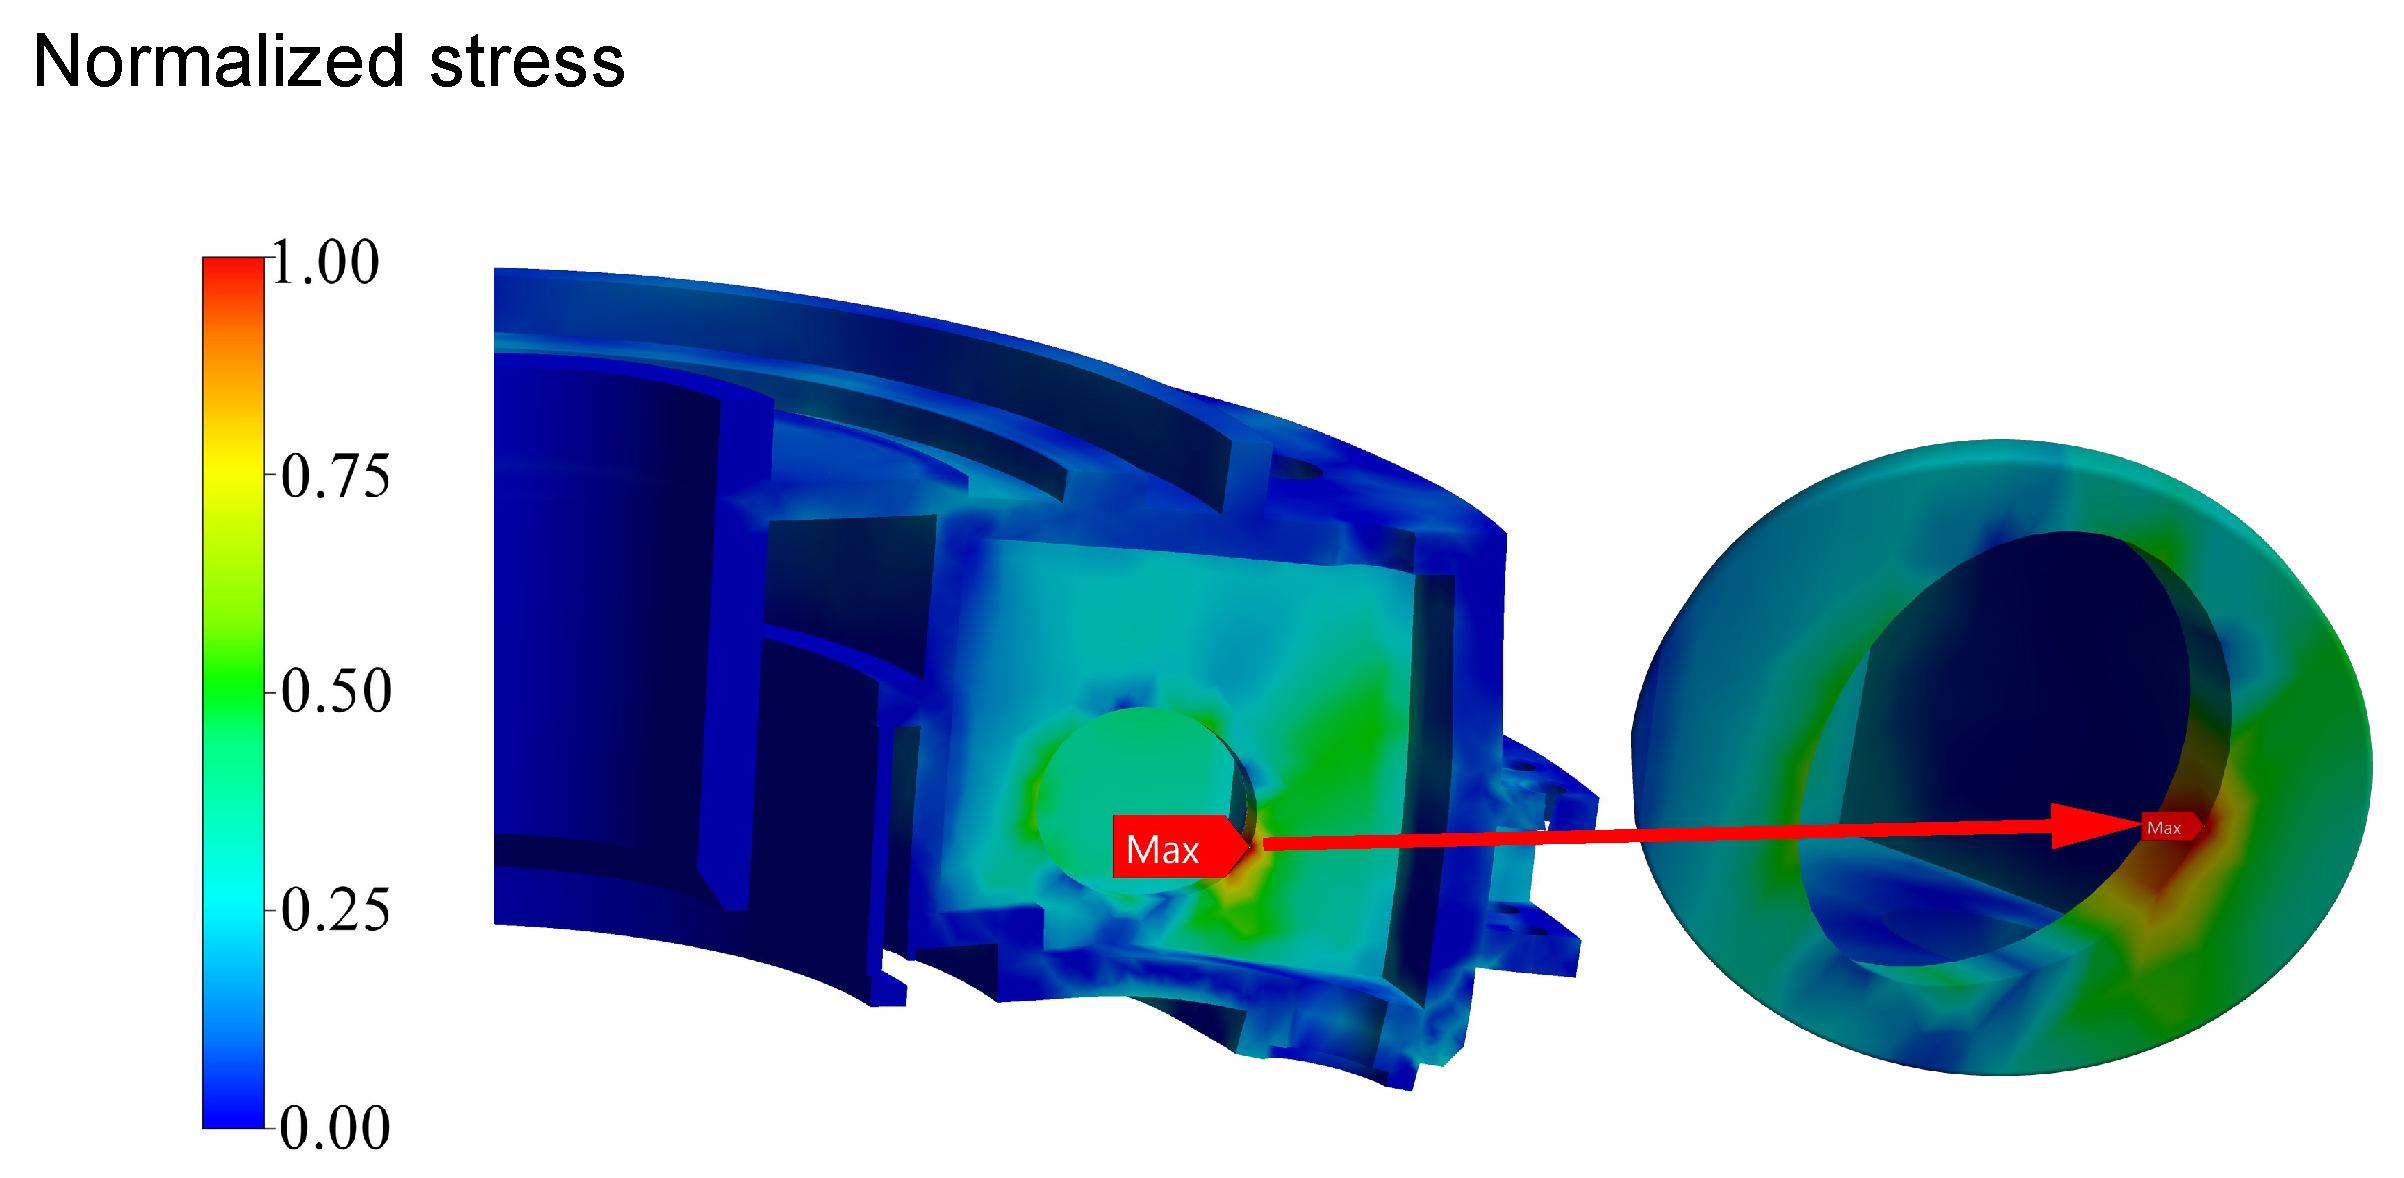
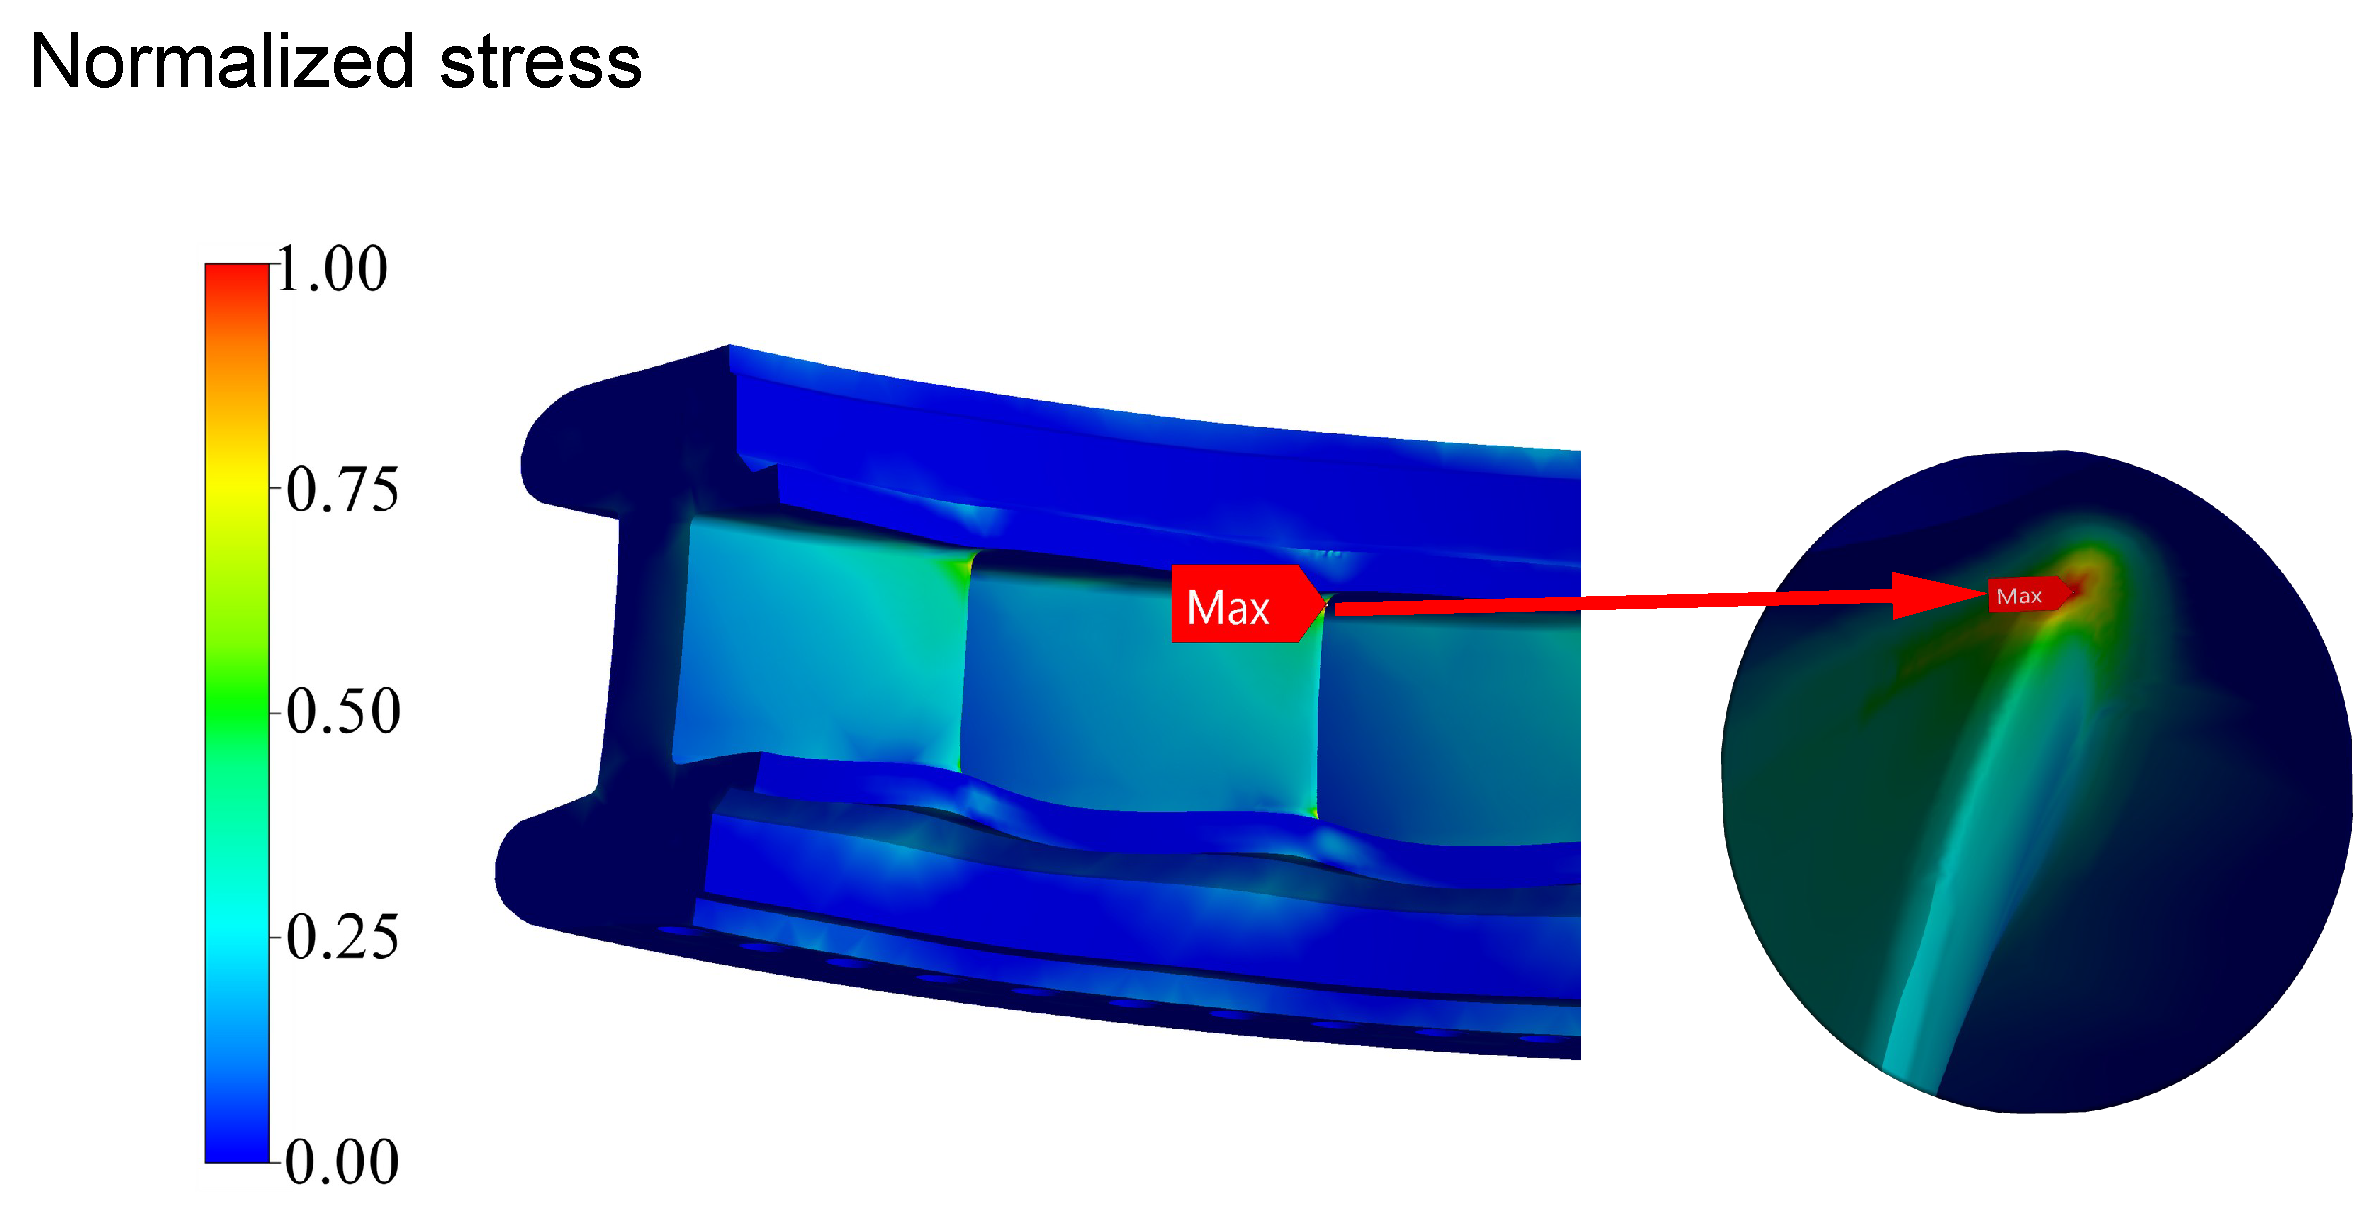
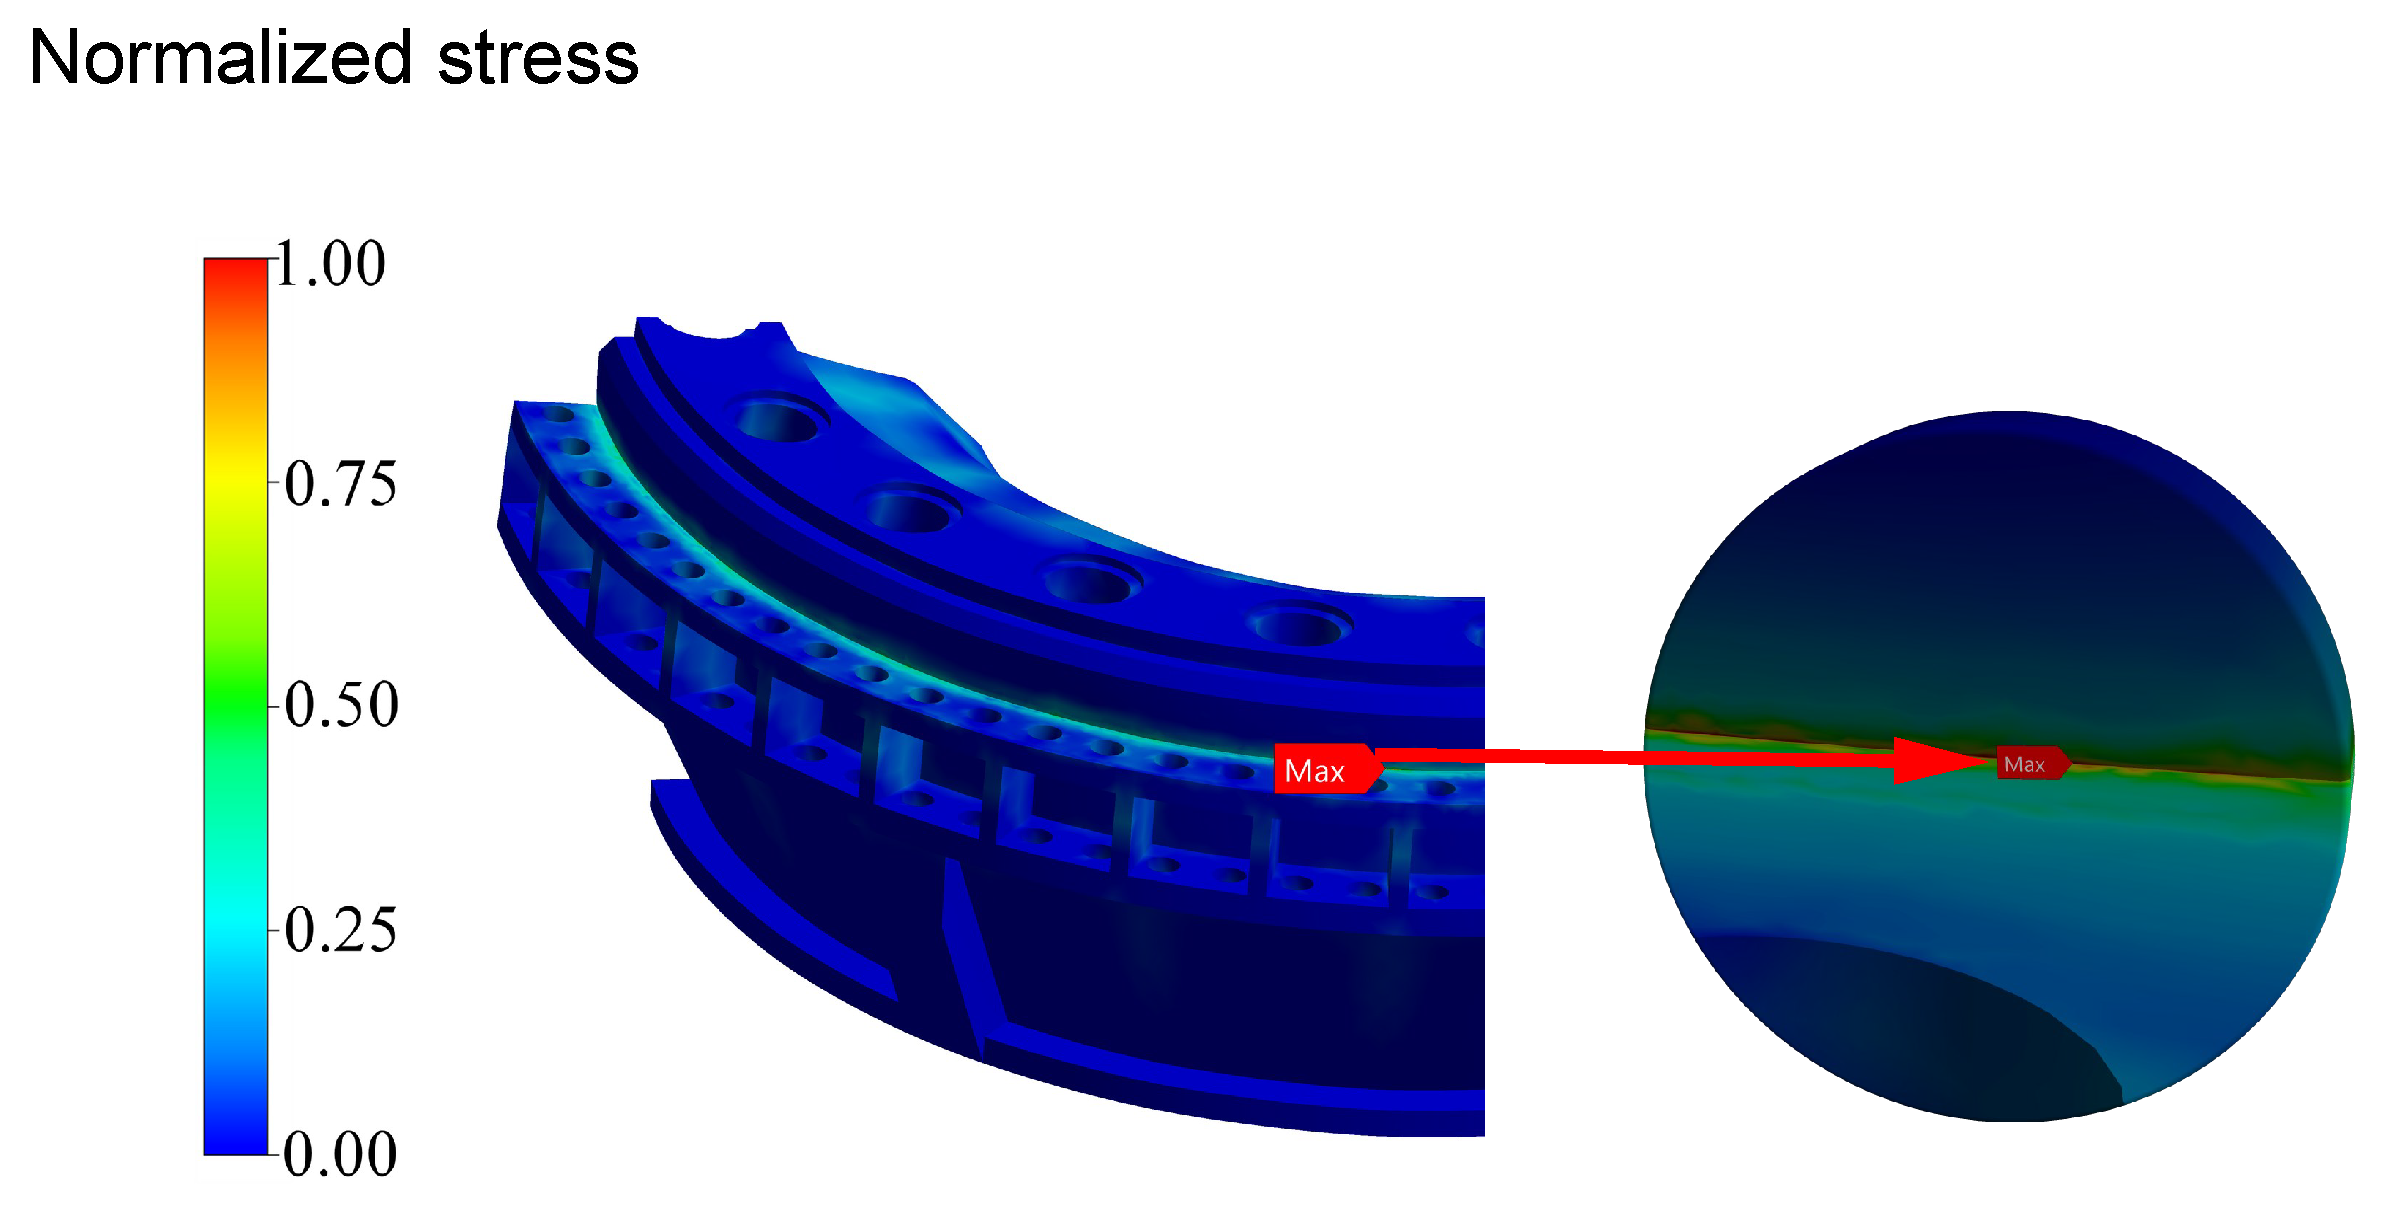
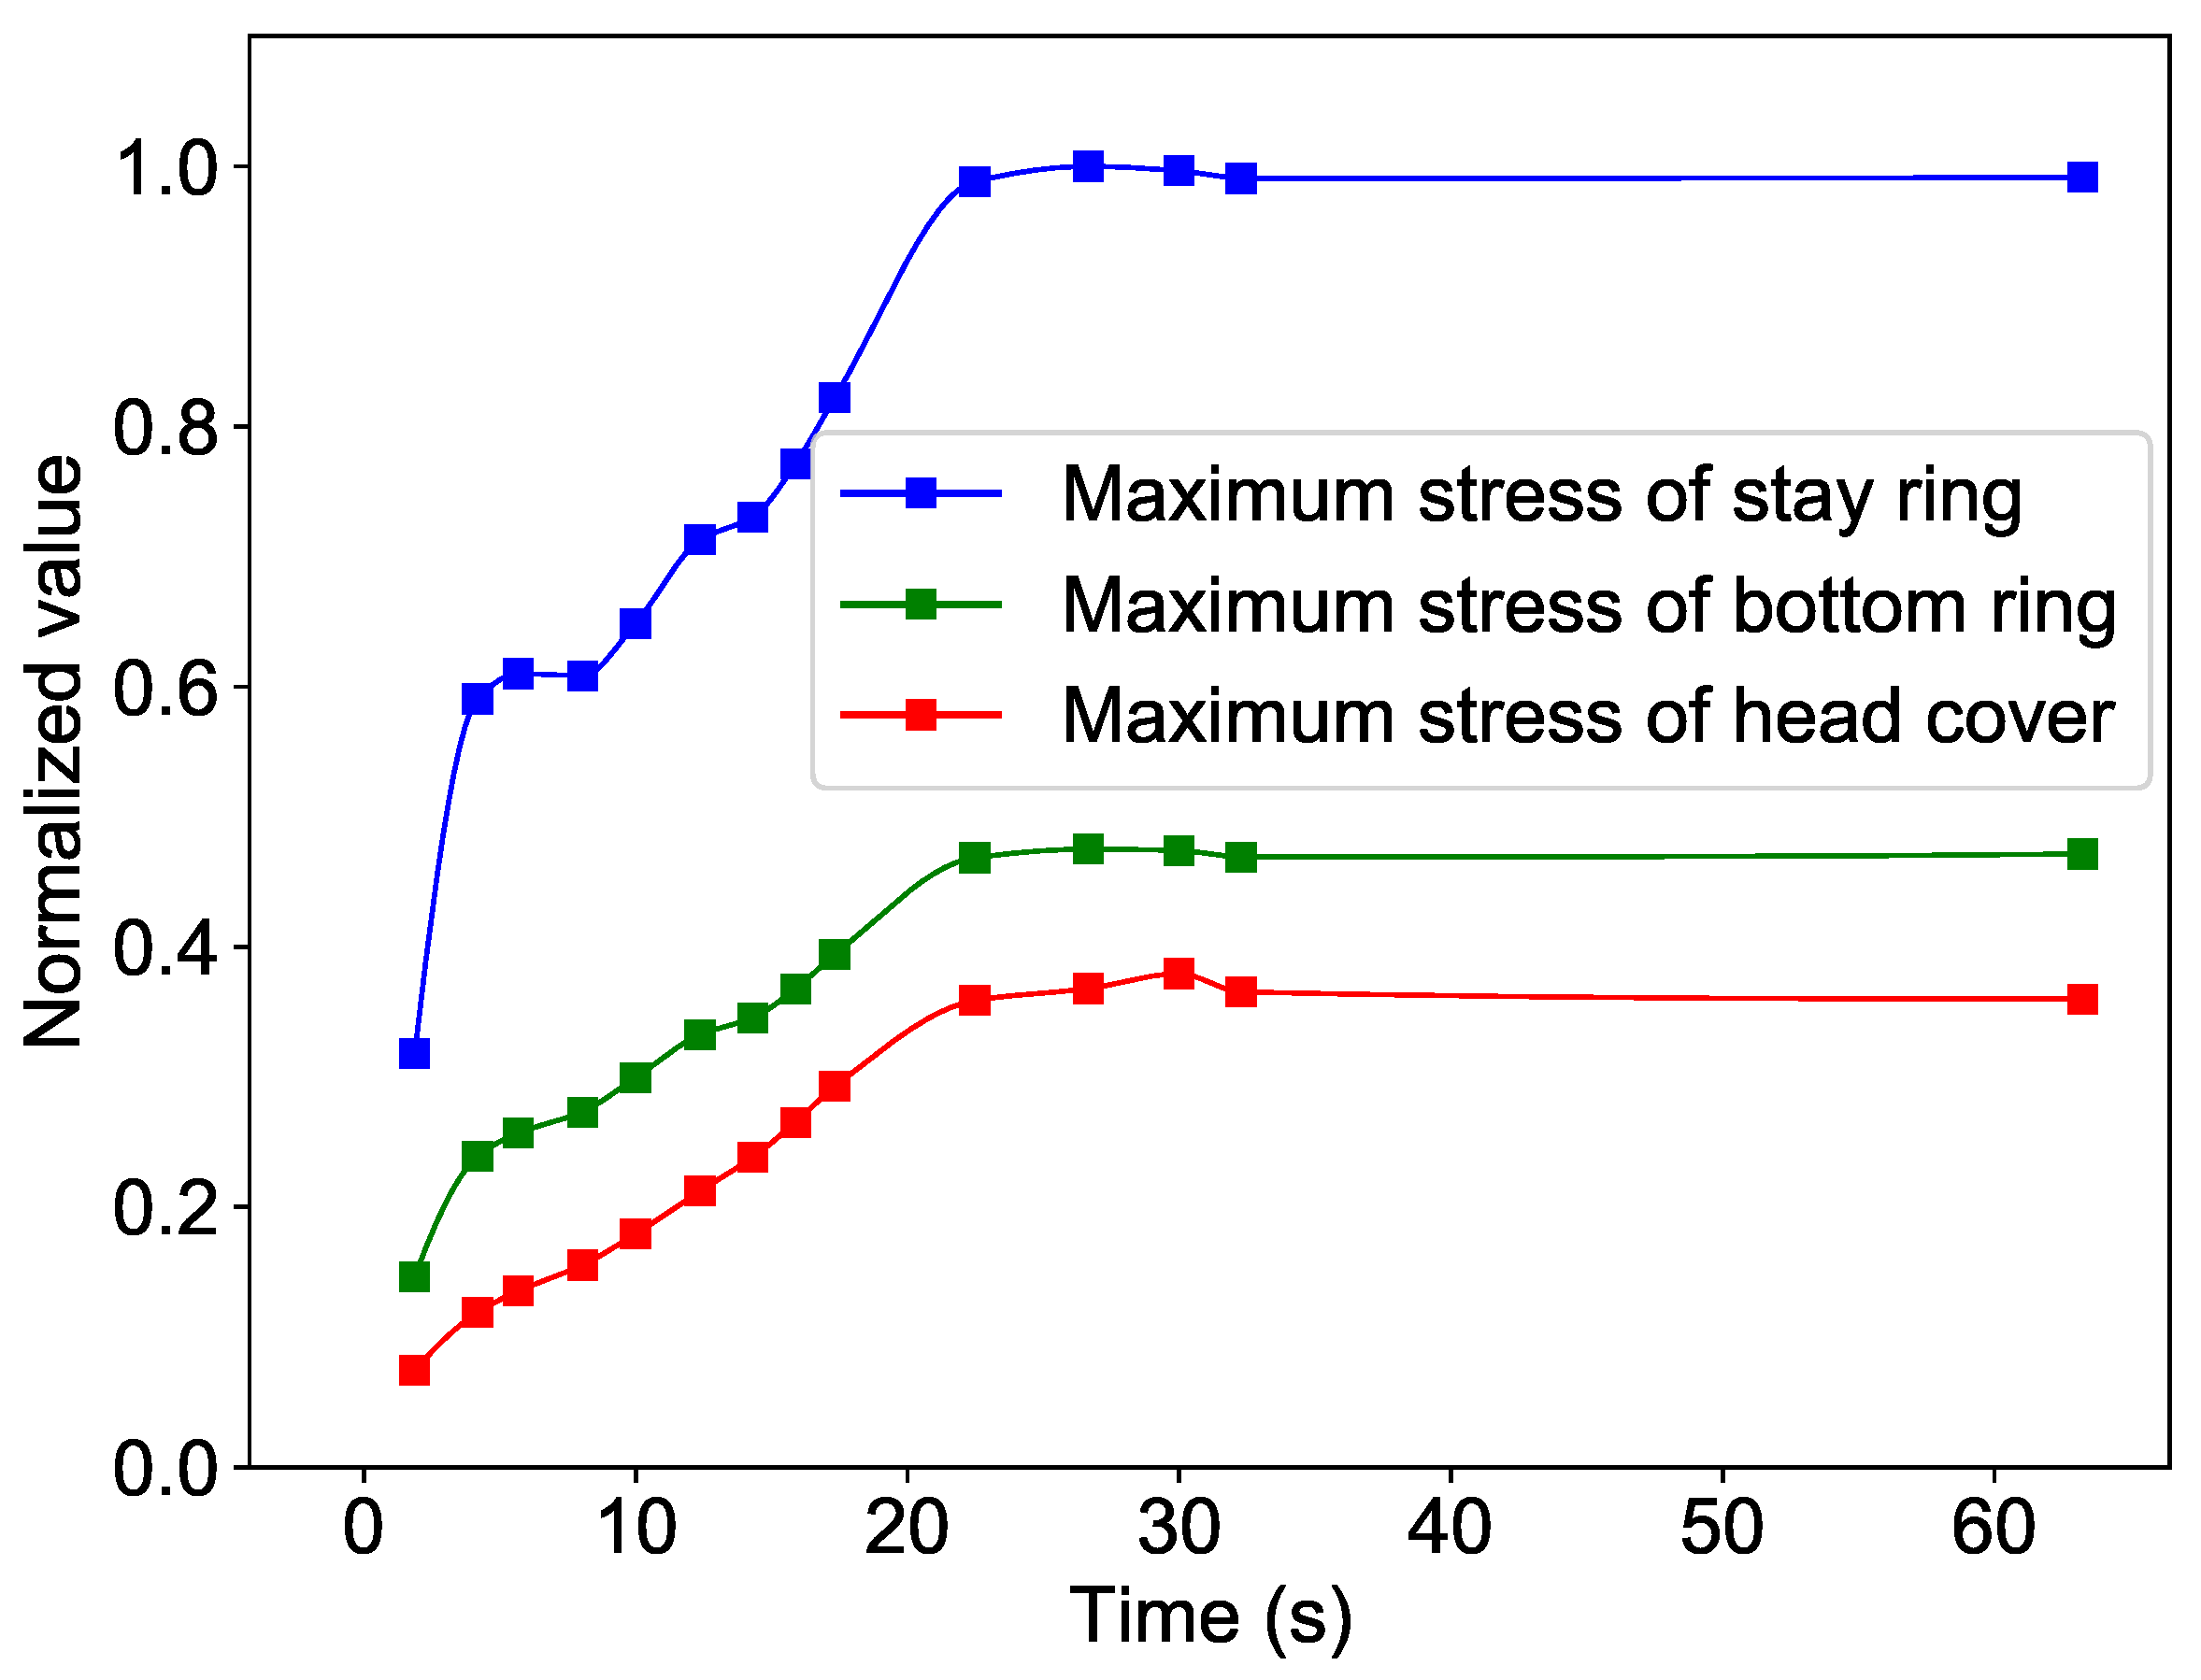
4.2. Results of the Flow-Induced Vibration Analysis for Non-Rotating Structures

Pressure profile data contains coordinates and pressure values for all nodes of the CFD mesh. With ANSYS built-in tools, the pressure data can be accurately interpolated and mapped at the nearest node at the fluid-structure interface of non-rotating structures. This allows the flow-induced vibration in non-rotating structures of the pump-turbine unit to be analyzed. The flow-induced deformation distribution of the non-rotating structures at different time moments during turbine start-up has a similar pattern. The maximum deformation is located at the same location (Figure 12), but the maximum deformation value is changing with time (Figure 13).
The head cover outer flange is assembled to the stay ring with high-strength bolts, but the interior plates are suspended without support in the axial direction. Due to the large hydraulic pressure loads applied on the inner surfaces of the head cover, the interior plates of the head cover have larger axial deformation than other plates.
The inner surface area of the stay ring is much smaller than that of the head cover, so the hydraulic loads applied on the stay ring are consequently lower than the head cover. Furthermore, the stay vanes of the stay ring are very stiff, so the flow-induced deformation of the stay ring is very small.
The height of the bottom ring is larger and stiffener than the head cover. In addition, the effective area of the inner surface of the bottom ring to bear the axial hydraulic load is smaller than that of the head cover, so the deformation of the bottom ring is also smaller than that of the head cover.
For ease of manufacture and installation, the head cover of the investigated pump-turbine unit is of split structures, which are assembled into an integral structure through the bolts of the connecting flanges. It can be seen from Figure 14 that the deformation distribution of the head cover is also symmetrical. Since the thickness of the connecting flange is thicker than that of the reinforcing plates of the head cover, the deformation of the head cover near the connecting flanges is smaller than the deformation in other locations of the head cover.
The flow-induced stresses of the non-rotating structures of the pump-turbine unit at different moments during turbine start-up also present a similar distribution, with the maximum stresses concentrated at the stay ring. The flow-induced stress distribution during turbine start-up normalized with the maximum stress value of the stay vanes (Figure 15).
The stress distributions of the stay ring, bottom ring and head cover shown in Figure 16, Figure 17 and Figure 18 are normalized by their respective maximum stress values.
During the start-up process in turbine mode, the pressure load applied to the inner surface of the non-rotating structure lifts the head cover, presses down the bottom ring, and stretches all the stay vanes of the stay ring, and the maximum stress occurs on the trailing edge fillet of a stay vane of the stay ring. The maximum stress of the head cover is located at the round hole of a reinforcing plate, which has a lower stiffness than other reinforcing plates. and the maximum stress of the bottom ring is on the connecting flange of the bottom ring. To analyze the variation of the maximum stresses of the non-rotating structures with time, Figure 19 compares the normalized maximum stresses during turbine startup.
It can be seen that the maximum stress of the stay ring is always larger than the maximum stresses of the bottom ring and head cover during the whole turbine start-up process. However, the maximum stresses of different components have a similar variation law with time.
Figure 20 shows the comparison of normalized maximum deformation, maximum stresses, and axial thrust of the non-rotating structures during turbine start-up. During turbine start-up, the maximum deformation, maximum stresses, and axial thrust of the non-rotating structures increase rapidly with increasing hydraulic parameters such as GVO, discharge, and rotational speed. After t = 25 s, the hydraulic parameters remain almost constant and the maximum stresses in the non-rotating structures become also stable. The parameter comparison in Figure 20 also reveals that the variation of the flow-excited vibration behavior including structural deformation and stress is consistent with the variation of the axial thrust generated by the pressure load on the structure during turbine start-up.

5. Conclusions

In this study, the flow-induced vibration of non-rotating structures of a high-head pump-turbine during start-up in turbine mode has been researched. A 1-D simulation is carried out in order to obtain the variation of pressure and discharge during the start-up process. The results are used as the border condition of the fluid-structure interaction analysis on the 3-D model of the pump-turbine unit.
The numerical simulation results show that at the beginning of the start-up, the discharge is low and the pressure is the highest. With the guide vane opening increasing, the pressure decreases with the rise of the flow velocity. At the time of 22 s, the pressure increases in the flow passage, which is caused by the water hammer. The flow field calculation results are used as the boundary conditions to calculate the behavior of the non-rotating structures for further fluid-structure interaction analysis.
The changing hydraulic pressure loads during turbine start-up cause changes in the distribution of the deformation and stresses on the non-rotating structures of the pump-turbine unit. However, the deformation distribution and stress distribution at different moments during the turbine start-up process follow similar patterns, respectively.
The maximum deformation of the non-rotating structures is located at the inner edge of the head cover, which is without support in the axial direction. The maximum stress of the non-rotating structures appears at the trailing edge fillet of a stay vane of the stay ring, which is stretched by the large hydraulic pressure. The flow-induced deformation and stresses of the non-rotating structures increase rapidly with the increasing hydraulic parameters at the beginning of the turbine start-up process. When the unit reaches the rated state, the hydraulic parameters remain almost constant and the stresses of the non-rotating structures also become stable. The flow-induced stresses of the non-rotating structures change largely during turbine start-up, and the variation of the deformation and stresses have a strong relationship with the axial thrust caused by the large pressure caused by the fluid flow. It is recommended to avoid too many frequent start-stops of the pump-turbine unit to reduce the risk of structural fatigue damage.

Author Contributions

Conceptualization, M.Y. and W.Z.; methodology, Q.H.; software, H.B.; Q.H.; X.H.; validation, H.B.; H.Y., formal analysis, W.Z.; writing—original draft preparation, W.Z.; writing—review and editing, X.H.; visualization, W.Z.; supervision, Z.W. All authors have read and agreed to the published version of the manuscript.

Funding

This research was funded by National Natural Science Foundation of China grant number 51876099.

Data Availability Statement

Not applicable.

Acknowledgments

The authors gratefully acknowledge the financial support of the project: Research on Lifetime Prediction of Non-rotating Parts of Pump–Turbine Unit Based on Rotor–Stator Interaction (RSI), Fluid–Structure Coupling and Fracture Mechanics—Research project on RSI mechanism and its Influence on Non-rotating Parts of Pump–Turbine Unit of Branch Company of Maintenance and Test, CSG Power Generation Co., Ltd.

Conflicts of Interest

The authors declare no conflict of interest.

Abbreviations

The following abbreviations are used in this manuscript:
RSIRotor–Stator Interaction
CFDComputational Fluid Dynamics
FSIFluid-Structure Interaction
GVOGuide Vane Opening
FEAFinite Element Analysis

References

  1. Zhao, W.; Presas, A.; Egusquiza, M.; Valentín, D.; Egusquiza, E.; Valero, C. On the use of Vibrational Hill Charts for improved condition monitoring and diagnosis of hydraulic turbines. Struct. Health Monit. 2022, 21, 14759217211072409. [Google Scholar] [CrossRef]
  2. Zhao, W.; Presas, A.; Egusquiza, M.; Valentín, D.; Egusquiza, E.; Valero, C. Increasing the operating range and energy production in Francis turbines by an early detection of the overload instability. Measurement 2021, 181, 109580. [Google Scholar] [CrossRef]
  3. Wang, H.; Jiang, H. Design of the control sequence for monitoring and control system of Pushihe Pumped Storage Power Station. In Proceedings of the 2012 IEEE International Conference on Computer Science and Automation Engineering (CSAE), Zhangjiajie, China, 25–27 May 2012; Volume 1, pp. 329–331. [Google Scholar]
  4. Ansari, B.; Aligholami, M.; Rostamzadeh Khosroshahi, A. An experimental and numerical investigation into using hydropower plant on oil transmission lines. Energy Sci. Eng. 2022, in press. [Google Scholar] [CrossRef]
  5. Zhao, W.; Egusquiza Estévez, E.; Valero Ferrando, M.D.C.; Egusquiza Montagut, M.; Valentín Ruiz, D.; Presas Batlló, A. A novel condition monitoring methodology based on neural network of pump-turbines with extended operating range. In Proceedings of the 16th IMEKO TC10 Conference on Testing, Diagnostics & Inspection as a Comprehensive Value Chain for Quality & Safety, Berlin, Germany, 3–4 September 2019; pp. 154–159. [Google Scholar]
  6. Zhang, Y.; Zheng, X.; Li, J.; Du, X. Experimental study on the vibrational performance and its physical origins of a prototype reversible pump turbine in the pumped hydro energy storage power station. Renew. Energy 2019, 130, 667–676. [Google Scholar] [CrossRef]
  7. Egusquiza, E.; Valero, C.; Valentin, D.; Presas, A.; Rodriguez, C.G. Condition monitoring of pump-turbines. New challenges. Measurement 2015, 67, 151–163. [Google Scholar] [CrossRef] [Green Version]
  8. Rodriguez, C.G.; Mateos-Prieto, B.; Egusquiza, E. Monitoring of rotor-stator interaction in pump-turbine using vibrations measured with on-board sensors rotating with shaft. Shock Vib. 2014, 2014, 276796. [Google Scholar] [CrossRef] [Green Version]
  9. Kaneko, Y.; Iwasaki, Y. Study on Vibration Response of High Head Pump Turbine Runner (Vibration Characteristics of Mistuned Runner). J. Environ. Eng. 2008, 3, 37–48. [Google Scholar] [CrossRef] [Green Version]
  10. Liang, Q.; Rodríguez, C.; Egusquiza, E.; Escaler, X.; Avellan, F. Modal response of hydraulic turbine runners. In Proceedings of the 23rd IAHR Symposium on Hydraulic Machinery and Systems, Yokohama, Japan, 17–21 October 2006; Volume 1, pp. 1–9. [Google Scholar]
  11. Valentín, D.; Presas, A.; Egusquiza, E.; Valero, C.; Bossio, M. Dynamic response of the MICA runner. Experiment and simulation. In Proceedings of the Journal of Physics: Conference Series; IOP Publishing: Bristol, UK, 2017; Volume 813, p. 012036. [Google Scholar]
  12. Valentín, D.; Presas, A.; Egusquiza, M.; Valero, C.; Egusquiza, E. Behavior of Francis turbines at part load. Field assessment in prototype: Effects on power swing. In Proceedings of the IOP Conference Series: Earth and Environmental Science; IOP Publishing: Bristol, UK, 2019; Volume 240, p. 062012. [Google Scholar]
  13. Egusquiza, E.; Valero, C.; Presas, A.; Huang, X.; Guardo, A.; Seidel, U. Analysis of the dynamic response of pump-turbine impellers. Influence of the rotor. Mech. Syst. Signal Process. 2016, 68, 330–341. [Google Scholar] [CrossRef]
  14. He, Q.; Huang, X.; Yang, M.; Yang, H.; Bi, H.; Wang, Z. Fluid–Structure Coupling Analysis of the Stationary Structures of a Prototype Pump Turbine during Load Rejection. Energies 2022, 15, 3764. [Google Scholar] [CrossRef]
  15. Kolšek, T.; Duhovnik, J.; Bergant, A. Simulation of unsteady flow and runner rotation during shut-down of an axial water turbine. J. Hydraul. Res. 2006, 44, 129–137. [Google Scholar] [CrossRef]
  16. Song, X.; Luo, Y.; Wang, Z. Numerical prediction of the influence of free surface vortex air-entrainment on pump unit performance. Ocean. Eng. 2022, 256, 111503. [Google Scholar] [CrossRef]
  17. Wang, W.; Wang, X.; Wang, Z.; Ni, M.; Yang, C. Analysis of Internal Flow Characteristics of a Startup Pump Turbine at the Lowest Head under No-Load Conditions. J. Mar. Sci. Eng. 2021, 9, 1360. [Google Scholar] [CrossRef]
  18. He, L.; Wang, Z.; Kurosawa, S.; Nakahara, Y. Resonance investigation of pump-turbine during startup process. In Proceedings of the IOP Conference Series: Earth and Environmental Science; IOP Publishing: Bristol, UK, 2014; Volume 22, p. 032024. [Google Scholar]
  19. Mao, Z.; Tao, R.; Chen, F.; Bi, H.; Cao, J.; Luo, Y.; Fan, H.; Wang, Z. Investigation of the starting-up axial hydraulic force and structure characteristics of pump turbine in pump mode. J. Mar. Sci. Eng. 2021, 9, 158. [Google Scholar] [CrossRef]
  20. Chen, F.; Bi, H.; Ahn, S.H.; Mao, Z.; Luo, Y.; Wang, Z. Investigation on dynamic stresses of pump-turbine runner during start up in turbine mode. Processes 2021, 9, 499. [Google Scholar] [CrossRef]
  21. Casanova, F.; Mantilla, C. Fatigue failure of the bolts connecting a Francis turbine with the shaft. Eng. Fail. Anal. 2018, 90, 1–13. [Google Scholar] [CrossRef]
  22. Wang, Z.; Yang, J.; Wang, W.; Qu, J.; Huang, X.; Zhao, W. Research on the Flow-Induced Stress Characteristics of Head-Cover Bolts of a Pump-Turbine during Turbine Start-Up. Energies 2022, 15, 1832. [Google Scholar] [CrossRef]
  23. Chen, F.; Chen, L.; Wang, Z.; Yu, J.; Luo, C.; Zhao, Z.; Ren, S.; Li, J.; Deng, D. Computation of static stresses of the head cover bolts in a pump turbine. In Proceedings of the IOP Conference Series: Materials Science and Engineering; IOP Publishing: Bristol, UK, 2019; Volume 493, p. 012143. [Google Scholar]
  24. Bi, H.; Chen, F.; Wang, C.; Wang, Z.; Fan, H.; Luo, Y. Analysis of dynamic performance in a pump-turbine during the successive load rejection. In Proceedings of the IOP Conference Series: Earth and Environmental Science; IOP Publishing: Bristol, UK, 2021; Volume 774, p. 012152. [Google Scholar]
  25. Li, X.; Mao, Z.; Lin, W.; Bi, H.; Tao, R.; Wang, Z. Prediction and analysis of the axial force of pump-turbine during load-rejection process. In Proceedings of the IOP Conference Series: Earth and Environmental Science; IOP Publishing: Bristol, UK, 2020; Volume 440, p. 052081. [Google Scholar]
  26. Nicolle, J.; Giroux, A.; Morissette, J. CFD configurations for hydraulic turbine startup. In Proceedings of the IOP Conference Series: Earth and Environmental Science; IOP Publishing: Bristol, UK, 2014; Volume 22, p. 032021. [Google Scholar]
Figure 1. The layout of the pipeline system of the researched pumped storage power plant.
Energies 15 08743 g001
Figure 2. Regulation of the guide vane opening during turbine start-up and discharge and rotating speed calculated.
Energies 15 08743 g002
Figure 3. Pressure coefficients at spiral casing inlet and draft tube outlet during the turbine start-up.
Energies 15 08743 g003
Figure 4. Fluid domain of the researched pump-turbine.
Energies 15 08743 g004
Figure 5. Mesh of different domains of the fluid model. (a) Entire simulation model; (b) Runner; (c) Draft tube; (d) Lower chamber with its labyrinth seal; (e) Upper chamber with its labyrinth seal; (f) Pressure balance pipelines; (g) Guide vane flow passage; (h) Spiral casing.
Energies 15 08743 g005
Figure 6. The mesh independence test of the CFD simulation.
Energies 15 08743 g006
Figure 7. The flow velocity distributions of the pump-turbine unit during turbine start-up.
Energies 15 08743 g007
Figure 8. Pressure distribution of the pump-turbine unit during turbine start-up.
Energies 15 08743 g008
Figure 9. Setup of the non-rotating structures for flow-induced vibration simulation.
Energies 15 08743 g009
Figure 10. The meshes of the non-rotating structures of the pump-turbine unit.
Energies 15 08743 g010
Figure 11. The mesh independence study of the flow-induced vibration simulation.
Energies 15 08743 g011
Figure 12. The deformation distribution of the non-rotating structures (longitudinal section).
Energies 15 08743 g012
Figure 13. The maximum deformation of the non-rotating structures with time.
Energies 15 08743 g013
Figure 14. The deformation distribution of the non-rotating structures (cross-section).
Energies 15 08743 g014
Figure 15. The flow-induced stress of the non-rotating structures.
Energies 15 08743 g015
Figure 16. The maximum stress of the head cover during turbine start-up.
Energies 15 08743 g016
Figure 17. The maximum stress of the stay ring during turbine start-up.
Energies 15 08743 g017
Figure 18. The maximum stress of the bottom ring during turbine start-up.
Energies 15 08743 g018
Figure 19. Comparison of maximum stresses in non-rotating structures during turbine start-up.
Energies 15 08743 g019
Figure 20. Comparison of maximum deformation, maximum stresses, and axial thrust during turbine start-up.
Energies 15 08743 g020
Table 1. Number of elements of the four sets of meshes.
Fluid DomainMesh 1 (× 10 6 )Mesh 2 (× 10 6 )Mesh 3 (× 10 6 )Mesh 4 (× 10 6 )
Runner2.943.273.634.25
Guide vane0.220.240.270.32
Spiral casing and stay vane2.642.933.263.81
Draft tube0.490.540.600.70
Labyrinth seals and pressure balance pipes0.320.360.400.47
Total model6.617.348.169.55
Publisher’s Note: MDPI stays neutral with regard to jurisdictional claims in published maps and institutional affiliations.

