1. Introduction
The fast rebound in overall energy demand strained conventional energy sources (i.e., coal, nuclear, gas) to renewable energy sources (RESs), a large share of which is located in the distribution layer of the power system. [
1]. With the mass adoption of distributed energy resources (DERs) and advancements in control and communications, small-scale electricity consumers are becoming prosumers, i.e., proactive consumers that can actively influence the operation of PDSs by consuming, producing, storing and sharing energy with other grid users [
2,
3]. This means that households and other energy users can now both produce and consume energy and participate in peer-to-peer trading. Prosumers can actively trade energy in real-time and facilitate the exchange of energy between each other in a bilateral peer-to-peer manner or within energy communities (EComs). An ECom is referred to as an entity of local prosumers that jointly produce, consume and share energy resources [
2].
Governments can support the accelerated integration of the RESs and step forward towards environmentally friendly PDSs or, on the contrary, they can suspend the deployment of new renewable-based generation and discourage energy trading between prosumers if that detrimentally impacts the PDS operation [
4], e.g., violates the operational constraints or leads to inadmissible energy losses. A summary of the perspectives and progress in prosumers’ communities and relationships is presented in [
1,
2]. The authors of [
2,
4] suggest that the decision-making process of the prosumers to address the problems of reducing the cost of energy, increasing and maintaining the sustainable use of renewable energy, and improving users’ engagement are restricted by the hard constraints imposed by the power network operators for ensuring the stable operation of the PDS without violating the voltage limit at prosumers’ nodes while keeping the overall network loss within reasonable limits. To support the decision-making for the power systems’ development, the definition of the HC was introduced in [
5], which is the amount of new generation or consumption that can be added to the PDS without violation of its constraints or without requiring infrastructure modifications.
The behavior of the prosumers is critically important for the long-term efficiency, sustainability and resiliency of the smart grid. If coordinated properly, they can bring significant benefits for PDSs in terms of peak demand lowering [
6], lowering investment and operational expenditures and bringing a mix of clear renewable energy into the grid [
7]. Thus, the attention to prosumer management has increased, and several research groups focused on related issues. There are many publications pointing to the advantages of HC, on the one hand, and the need to overcome barriers, such as operational standards and physical limitations, that prevent the penetration of DERs in networks [
8,
9,
10,
11,
12,
13,
14,
15,
16,
17,
18,
19,
20,
21,
22,
23,
24,
25].
Voltage and thermal overload are considered the main limiting factors in the majority of the hosting-capacity-focused studies [
8,
9,
10,
11]. When the active power produced by a prosumer exceeds the active power consumption of a load, the voltage level on that load bus can increase beyond the acceptable level and damage the connected equipment. Conversely, undervoltage occurs when the demand at the bus grows beyond the normal load [
11]. On the other hand, exceeding the current limits of lines and transformers causes overheating of these components leading to various operational failures [
11,
12]. The impact of the increased number of prosumers on distributed generation curtailment in constrained distribution networks was studied in [
8]. The authors concluded that enabling energy trading without conventional intermediaries (i.e., local electricity markets) can make distributed generators (DGs) with lower priority vulnerable to excessive curtailment [
8]. The paper [
9] presents a method based on sensitivity analysis to assess the impact of energy transactions on the network and to guarantee an exchange of energy that does not violate network constraints. Completely decentralized peer-to-peer trading could be detrimental to maintaining the technical limits of the PDS within the safety range [
9]. The simulation conducted in [
10] has shown that ignorance of the network constraints can lead to violation of bus voltage limits and compromise the security and reliability of the PDS with active players (e.g., prosumers and EComs) [
10]. And the authors of [
13] estimated how the HC of a PDS can be enhanced by curtailment of RESs.
Electric energy exchange between sellers and buyers could compromise the node voltages and overload the network line capacity, which inevitably incurs power losses as well [
14]. The papers [
11,
14,
15,
16,
17,
18,
19,
20] examined the impact of high PV penetration on the distribution network losses, which directly depend on the magnitude of the line currents and the length of the branches. The integration of DG, in some cases, can cause reverse power flows, increasing the network losses and decreasing the operational efficiency of the PDS [
11]. A graph-based loss allocation approach to harmonize the physical attributes of the low voltage distribution grid is proposed and tested in [
14]. A scheme to reduce power losses by means of optimal power routing and effective dispatching is presented in [
15]. The authors of [
16] investigated the impact of peer-to-peer trading on the energy losses in a large grid-connected electricity network and concluded that flexible power dispatch of prosumers has a negligible effect on loss reduction. The work [
17] proposes an energy-sharing framework that takes into consideration the dynamic network structure and helps to decrease power losses. An energy trading scheme to maximize social welfare and to achieve the balance between supply and demand in the market while considering power losses and utilization fees for the third-party-owned network was designed [
18]. The article [
19] presents an approach to determine a generation mix while assuring voltage stability and minimal power losses. An approach to allocate capacitors and PV systems in the PDS for the purpose of lessening power loss in branches and satisfying hard network constraints is introduced in [
20]. And a method to calculate the PV HC of distribution networks countrywide and extend it through energy storage systems is presented in [
21].
Some works are also focused on maintaining the safe and efficient operation of the network with high penetration of PV generation [
5,
22,
23,
24,
25]. In [
5], a linear programming formulation is employed to find a near-optimal solution for the HC model of a 33-bus distribution test system. The authors of [
22] offered a real-time method for solar plants that coordinates PV inverters and battery storage systems to achieve voltage regulation and avoid failures due to the lack of the system’s inertia. The work [
23] evaluates maximum steady-state PV penetrations for several representative distribution feeders. In the article [
24], an approach to assess the impacts of PV generation on voltage deviations and reverse power flows is presented, and the operation of a real distribution feeder is analyzed against different PV penetration levels. And a stochastic methodology to increase the HC of the PDS, considering the costs of energy procurement from the upstream network and power generation by RES is presented in [
25].
Although the aforementioned articles deeply studied the prospects and challenges associated with the integration of RESs and an increasing number of proactive consumers, not much attention has been paid to the differentiation between the impacts of small-scale local prosumers and medium-capacity EComs on the operation of the PDS. Also, the impact of decisions made by the network operators and governmental agencies for setting the rules for connection, trade and support are not sufficiently covered. To fill out this gap and to contribute to the understanding of how the prosumers of different sizes affect the operation and the HC of the distribution networks, this study elaborates and compares two alternatives for PDS development: (a) when consumers become individual prosumers with low-power rooftop PV installations; (b) when consumers become members of a single-node medium-capacity ECom.
The purpose of the comparison will be HC assessment to understand PV power levels that are acceptable for consumers, for the PDS, and for government entities. In order to achieve the named goal, it is necessary to evaluate the effectiveness of prosumers’ investments, voltage volatility and energy losses in the distribution grid. To solve these problems, it is necessary to use models of loads and prosumers’ behavior, PV generation, billing energy system, and distributed power system and make a number of assumptions, the justification of which requires the following actions: (a) to briefly review a concept of HC and of a supportive scheme, such as a net-metering system (NMS); (b) to make forecasts of energy prices, and energy consumption; (c) to demonstrate the HC possibilities and limitations on a specific example, using real and predicted data.
The approach for the HC assessment will be based on the results of the works [
26,
27]. However, compared to [
26,
27], the case study will be substantially extended, the simulation will be performed for real load and PV generation profiles, using utility data and meteorological annual weather data, and operationally feasible levels of PV penetration for individual prosumers and members of an ECom will be defined. Simulations with a single solar ECom will be conducted to examine the correlation between maximum PV penetration and distance from the ECom to the feeder’s source. The analysis of how the physical topology of the distribution network with multiple individual prosumers and EComs can be harmonized with the underlying bidirectional power flows while satisfying system constraints will be performed as well.
The rest of the paper is organized as follows.
Section 2 introduces the methodology for the HC assessment based on the adopted modeling approach.
Section 3 describes numerical case studies pertaining to the augmentation of individual prosumers with rooftop PV and energy communities.
Section 4 provides a discussion of the obtained results, estimates acceptable levels of PV penetration, and highlights the value of modeling the unbalanced conditions at the distribution level with regard to the HC and energy losses. Finally, conclusions are drawn.
2. Methodology and Modelling of the Distribution Grid
2.1. Object under Consideration, Objective Function and Operational Constraints
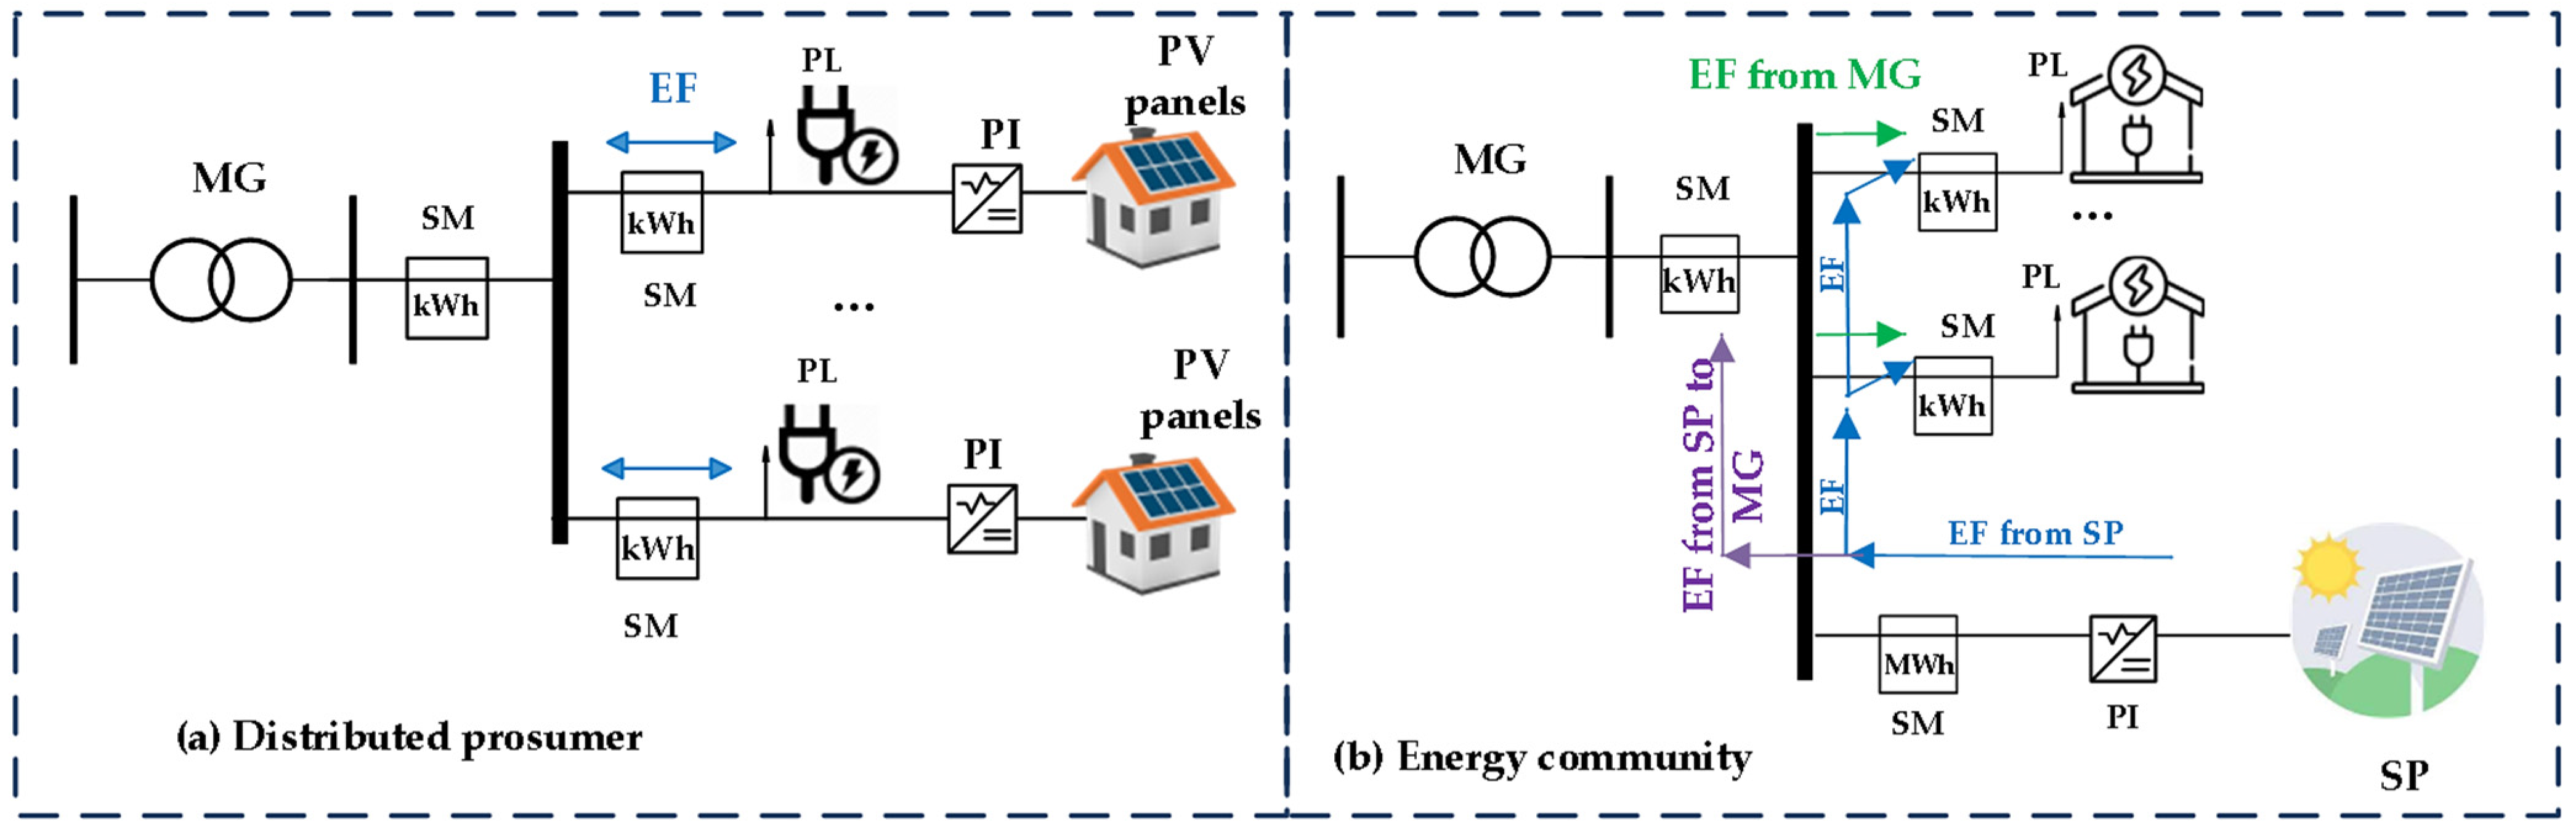
Implementation of a large number of RESs transforms the electricity network from the traditional “producer-consumer” scheme to updated business models, where the consumer with local generation becomes not only a consumer of electricity but also an energy producer. There are two ways to “transform” a consumer into a prosumer (see
Figure 1). The first way is to deploy a low-power distributed generation (several kW) consisting of a certain number of generating units at home. Such a consumer will be referred to as the distributed prosumer (DP). The second way is the creation of an ECom of medium power (up to several thousand kW). The consumer of the second transformation is hereinafter referred to as the energy community prosumer (EComP).
Both of the above ways lead to the same ultimate goal: to make it possible to massively attract investments from the population, contributing to the choice of a rational and cost-effective mode for distribution grid transformation.
An increase in the number of prosumers and, thus, of the installed capacity can only be ensured under the conditions that energy losses, as well as voltage losses in the network, do not exceed permissible limits and investments in an additional generation are paid off within a reasonable period. The payback period depends on a number of factors and specific operating conditions [
28]. The most important influencing factors include the number of investments required, meteorological conditions, conditions for the sale and purchase of energy, energy consumption profiles, energy prices and the amount of support for “green” energy [
28]. Considering the abovementioned, the concept of HC can be visually represented by
Figure 2 [
28].
As it can be seen from
Figure 2, the PV power of the prosumers above the red line is unacceptable in terms of one of the performance indices or a combination of indices: in terms of their profits, which can be received during the planning period, payback period, in terms of voltage losses, and/or in terms of energy losses. This area is called the “Unacceptable Operation”. It is worth noting that the red line can shift either up or down, depending on the use of RESs support schemes and the desire and suggestions of the decision-maker.
Several important tasks are to be solved prior to the connection of new prosumers with energy generation units to the PDS: the technologies and their parameters must be selected; the allocation of the DGs must be identified; the return on investment must be evaluated; power losses and voltage deviations in the network must be checked.
An essential feature of the solution to the problem under consideration is the presence of many decision-makers: network operators, prosumers, and the government. The desire to cover a varied range of tasks and the presence of multiple decision-makers requires using multiple criteria forms for setting the problem. Everyone is looking for their own benefit: for prosumers, it is the maximum profit for the planning period; for a government—the maximum PV installed capacity, and for network operators—the fulfillment of technical restrictions.
The first step is the selection of objective functions for the DP and the EComP decision-makers, who seek to maximize their profits during the planning period (see Equation (1)):
where
J—the total number of
j-th prosumers;
T—the number of sampling steps
t (one hour) in the year;
Y—the number of sampling steps
y (one year) in the planning period;
—the profit estimation procedure of the
j-th prosumer during the
t-th hour of the
y-th year, EUR;
—the energy price during the
t-th hour of the
y-th year, EUR;
—the energy consumption of
j-th prosumer during the
t-th hour of the
y-th year, kWh;
—the PV permissible permitted power of the
j-th prosumer, kW;
—the amount of support for the
j-th prosumer, EUR.
The objective function of the EComP decision-makers is as follows in Equation (2):
The
j-th prosumer’s profit in Equation (1) depends on the PV power of all prosumers (decision variables), consumed energy during each hour and its price, and the government support (decision variables) [
29].
The seemingly simple expressions (1) and (2) describe very complex tasks since, in the general case, they are stochastic, nonlinear, and contain many objective functions. In addition, many decision-makers participate in task resolution. Instead of the practically unsolvable problem of maximizing the profits of all prosumers separately, a linear scalarization method [
30] can be applied.
Thereby problems (1) and (2) can be rewritten in the following form in Equation (3):
The objective of network developers (prosumers, network operators, and government bodies) is to maximize DG capacity, taking into account economic indicators, power losses and support of green energy sources. The total installed DG capacity can be calculated by the summation of the capacities of the injected PV generation units in Equation (4):
where
—the real power capacity of a PV generation unit installed at the
n-th bus, kW;
N—the number of buses in the PDS.
The challenge for the researchers is to find a representative set of solutions and quantify possible trade-offs that satisfy the subjective preferences of the decision-makers.
The decision-making algorithm is provided in
Figure 3.
For this study, utility data from an automatic energy metering system were collected, covering the whole year of electricity consumption for different consumers. The resulting annual load profiles reflect the consumption structure of several Latvian residential and private houses [
27]. Historical data on electricity prices are obtained from Nord Pool [
31]. The solar irradiation data—from the Photovoltaic Geographical Information System (PVGIS) [
32].
It should be noted that the problem being solved requires a description of the system for the entire planning period (25 years), which requires forecasting the parameters of the influencing processes (generation, electricity prices and consumption). Also, to solve the problem, it is necessary to model the distribution network and check for the implementation of technical restrictions. The next step is to simulate the billing system (for example, of Latvia), considering the rules of the NMS [
33], the tariff policy, and other principal indicators. Finally, the economic criteria for each scenario for the installation of RESs will be estimated. The operational feasibility of various HC values will be evaluated by considering economic criteria, grid constraints and energy loss criteria. Based on the results obtained, summarized information will be offered to the decision-makers.
The description of these sub-models is presented in the following subchapters.
2.2. Modelling of PV Generation
The solar irradiation data and the ambient temperature data were extracted from the PVGIS [
32] for the geographical location of Riga city (latitude: 56°57′, longitude: 24°04′) as an example. It is assumed that the slope of the PV modules (i.e., the angle with the horizontal plane) is 41° for a fixed mounting type, the azimuth is 1°, the approximate system losses is 14% for small-scale rooftop PV installations and 10% for larger PV arrays of ECom [
26]. The crystalline silicon photoelectric technology is considered.
The PV electric output can be calculated according to [
26,
34], Equation (5):
where
ηPV—the power conversion efficiency of the PV module in p.u.;
ηPC—the efficiency of the power converter in p.u.;
APV—the area of the PV array, m
2;
GPV—the solar irradiance incident on the plane of the PV array, kW/m
2;
γ—the temperature coefficient of the PV module;
TPV—the PV module temperature, °C;
Tref—the reference temperature, °C.
The PV module temperature is among the critical factors to be considered during the modeling of any PV application. It can be estimated with the arbitrary temperature model, as shown in Equation (6) [
34]:
where
Tamb—the ambient temperature, °C;
mc—the mounting coefficient;
Ws—the wind speed, m/s.
For more accurate seasonal solar simulations (e.g., during months with snowfalls and active dusty winds), the PV generation model can be modified by accounting for the influence of snowing and dust cover on the performance of photovoltaic installations [
34,
35].
The energy supplied by the PV power generation system is represented by multiplying the electrical power output with the operating time
t, Equation (7):
The penetration level KPVpen is defined as the ratio of the total installed PV power ΣPPVinstalled, kW, to the total peak load active power consumption ΣPLoadrated, kW, in a distribution grid, and it is estimated with Equation (8):
2.3. Forecasting Procedure of Electricity Prices and Consumption
The forecasting procedure is part of the overall assessment of the project’s profitability. The complexity of the forecast depends on the duration of the planning period. There are several methods introduced in scientific literature. In this study, the naive forecasting approach [
36] (for PV generation and the energy consumption of the prosumers) has been chosen. This method assumes that past processes will repeat in the future and is described in detail in our previous publication [
37]. For electricity price forecasting, the authors offered a prediction method based on the Fourier transformation [
38] to capture the seasonality characteristics of the price series. A long-term forecast was obtained by applying the 3% annual increase in electricity prices (for the period between 2020 and 2050) [
29].
2.4. Modelling of the Distribution Grid
The operation of the PDS with local prosumers and EComs is studied using a time series analysis. The PDS is represented by a standard test feeder with an unbalanced load profile, and the three-phase current injection (TCIM) method, which is a modification of the Newton-Raphson (NR) method, is selected to calculate and analyze the power flow. This method is widely used in engineering practice. It exploits the current injection at each node through rectangular coordinates, resulting in a faster load flow solution with a smaller number of iterations [
14]. The NR power flow model contains a set of equations (see Equations (9) and (10)) defining the current injection from the load into the given network:
where Δ
Irn—the real current injection at bus
n, A; Δ
Imn—the reactive current injection at bus
n, A;
Pnsp is the scheduled real power [
37] injection at node
n, kW;
Qnsp—the scheduled reactive power injection at node
n, kvar;
Gnk—the real portion of the admittance between nodes
n and
k, ℧;
Bnk—the imaginary portion of the admittance between node
n and
k, ℧;
Urn—the real component of voltage at node
n, V;
Umn—the imaginary component of voltage at node
n, V.
It should be noted that the signs of the power injections correspond to the directions of the power flows and, therefore, depend on whether a prosumer at each node imports energy from or injects it into the PDS. Concretely, the following conventionality is used in this work: power (either real or reactive) is signed positive if it is consumed at a node. And vice versa, power is signed negative if it is injected at a node.
The combined current injection mismatches of load flow formulation can be determined from Equations (11) and (12):
Unlike the traditional NR solver, where the voltage and voltage angle is computed, the TCIM computes the real and reactive components. With the magnitudes known, the voltage angle can be further determined.
Next, the Backward-Forward Sweep (BFS) method is used to check the convergence of results. The backward sweep starts with an assumed or known voltage and calculates the current consumed by each load in the system. The currents at each node in the system are summed up until the current at the source is determined. During the forward sweep, the voltage drops on each segment are determined using the calculated currents. Based on the new voltages, the new current draw of each load is recalculated, and another sweep is performed [
15].
2.5. Verification of the Implementation of Technical Restrictions
Problems (1)–(4) must be solved considering many technical and legal constraints. At each step of the modeling, the power network must meet operational constraints [
39], such as power balance, voltage limit at each node, and feeder current capacity limits. In this work, the demand values change in hourly steps. To simulate different operating states of the PDS, the power flow should be recalculated for all the snapshots of load demand values.
Following are the equality and inequality constraints of the optimization problems in Equation (13):
where
Un—the voltage in the
n-th node, V;
If,i—the forward flow capacity of the
i-th branch of the PDS, kWh;
Ir,i—the reverse flow capacity of the
i-th branch of the PDS, kWh;
PPV,n—the real power capacity of the injected distribution generation (i.e., PV installations of DPs and of EComPs) at the
n-th bus, kW. The superscripts
min and
max represent the maximum and minimum allowable limits of the corresponding values.
To estimate the HC thresholds, the necessary network models are synthesized (
Section 2.4), the prosumers’ influence on the network is simulated, and the economic effect is calculated (
Section 2.6), which allows decision-makers to decide in favor of one or another alternative based on the obtained results.
2.6. Profitability Assessment of Participation in ECom and Installation of Rooftop PV Equipment
To assess the project, decision-makers use economic criteria, such as the payback period and net present value (NPV) of cash flow. A payback and NPV study identify the strengths and weaknesses of a project and help decision-makers to choose the right planning path based on the financial health of prosumers. In this article, a positive NPV of cash flows for year 25 will be considered as the prosumer’s net profit and a negative NPV—as the prosumer’s monetary losses.
The simplified NPV of cash flow can be formulated as follows in Equation (14):
where
—the initial investments into PV technologies, EUR;
id—the discount rate, %;
—the net cash flow, i.e., cash inflow and cash outflow at year,
y, in EUR.
The formulas of mentioned parameters are detailed and described in our previous paper [
29].
In order to apply Equation (14), it is necessary to simulate the billing system of the country under study, which includes:
Tariff system. The electricity bill in Latvia comprises the following a variable payment for electricity distribution; a fixed payment for the connection; a fixed mandatory procurement component (MPC) based on the capacity for the connection; a mandatory procurement component, which depends on the electricity consumption from the grid, as well as the energy market price. All the prosumers pay the fixed payment depending on the capacity of their connection at any time moment.
The net metering system (NMS) payment is the payment for the net consumption, i.e., the payment for the difference between the amount of electric energy received from the grid and the amount of electric energy transmitted to the grid [
40]. The NMS for DP is applied. The algorithm for estimating annual expenses, considering the Latvian NMS, is presented in detail in [
29]. For ECom participants, a virtual NMS is applied [
41].
4. Results and Discussion Summarized Information for Decision-Making
4.1. Results of Assessing the Profitability of PV Equipment
In this article, a positive NPV of cash flows for year 25 will be considered as the prosumer’s net profit.
Obviously, the profitability of using PV technologies fluctuates greatly: the payback period for the capital investments of PV equipment varies from 6 to 16 years. Analyzing
Figure 6, for ECom prosumers, the payback period is shorter than for individual prosumers. The difference is significant—from 4 to 6 years. The lowest payback period (6 years) and the highest prosumers’ net profit (EUR 6.39 million ) is reached in Scenario 7, when the permitted power of the PV panels equals 2470 kW (100% power). The longest payback period (16 years) and the lowest net profit (EUR 2.29 million ) is received in Scenario 18, where DP permitted power is 3520 kW (200% power). Overall, the ECom scenarios demonstrate better economical attractiveness compared to the scenarios with local prosumers owning individual PV installations.
Scenarios with government support demonstrate improved results for both cases with DPs and EComPs. For instance, let us consider the worst scenarios for DPs (3, 11 and 19 scenarios), when, with different HC (2470 kW (100%), 3705 (150%) and 4940 kW (200%)), the payback period is longer. Applying the support in the amount of 25% and 50%, the following results are obtained (
Table 3).
The payback period of the PV panels of a DP reaches the period when the prosumer is an EComP. However, is it expedient for the government to spend big money (from 0.81 million euros to 3.22 million euros) when short payback periods are achieved by participating in the ECom.
Obtained results (
Figure 5 and
Figure 6,
Table 3) are visual, and all the decision-makers decide what is more profitable and efficient for them, taking into account all considered limiting conditions and assumptions while complying with the technical restrictions, the results of which are described in the following subchapters.
4.2. Assessment of Energy Losses at Different Capacities of PV Units
A model for simulation of the modified IEEE 123 Node Test Feeder was created with the GridLAB-D coding structures. Simulations were run using hourly time steps over a year with 11 load profiles based on utility data, and annual meteorological data [
32]. The power flow calculations for the considered PDS were performed in GridLAB-D software, employing the TCIM NR and BFS methods, as described in
Section 2.3. Both methods demonstrated good convergence, and the difference in their outputs does not exceed 0.1%. The yearly energy consumption of the network’s consumers is 11,577.9 MWh. Four voltage regulators available between the nodes 149 and 150; 9 and 14; 25 and 26; 160 and 67 (see
Figure 4) were set to automatically adjust their tap positions to maintain the appropriate voltage levels.
The proportion of energy losses related to the total energy demand is evaluated. The condition of the hard constraints’ satisfaction was checked for each time interval. Firstly, let us compare different variants for ECom allocation. Four nodes were considered for ECom placement: (1) at the feeder’s head—node 149 (cases 23, 27, 31, 35); (2) in the middle of the feeder—node 152 (24, 28, 32, 36), node 160 (cases 21, 25, 29, 33); (3) at the feeder’s tail—node 108 (cases 22, 26, 30, 34). Most of the cases are operationally feasible, i.e., their power flows converged successfully, and none of the established constraints were violated. The exceptions were the cases 30, 33, 34, and 36 scenarios. For these cases, the reverse power flows caused by the high PV penetration was significant, which led to the voltage deviations beyond the ±0.1 p.u. threshold [
47] during pick-generation hours. Furthermore, some branches were overloaded 1.1 ÷ 1.3 times during pick generation hours. Therefore, the maximal hosting capacity of the PDS for these cases was exceeded. Permissible HC for the cases 30, 33, 34, 36 was estimated to be 3545 kW, 4050 kW, 3550 kW, and 4855 kW, accordingly. These values correspond to the HC of 143.5%, 164%, 143.7%, and 196.6% of the installed load, accordingly. Additional infrastructural investments are required to make the HC of the PDS under cases 30, 33, 34, and 36 feasible.
Further, the authors will analyze the results when the ECom is in node 160.
The charts of yearly active energy losses for the cases 1–21, 25, 29, and 33 with DPs and EComPs (the ECom is installed in node 160) are shown in
Figure 7.
As it can be seen, for the first subcase, when PV power is equal to the initial permitted power of the prosumer, with increase of DG penetration, energy losses are continuously decreasing. Although, this trend is steeper for DPs: at the 100% PV penetration level, prosumers with rooftop PV panels (case 4) allow to decrease energy losses by 0.96%, compared to the base case, while the EComPs of the same HC (case 8) contribute to the decrease in energy losses by 0.69% only.
For the second and third subcases (150% and 200% power), the situation is different. For the cases with DPs, when the installed power of PV is 150% of the rated load of the corresponding consumer (i.e., cases 9–12), the reduction in energy losses is more significant. At the 100% penetration level (case 12), the reduction in energy losses is 1.04%, compared to the base case. However, for the corresponding cases with EComPs (i.e., cases 13–16), improvement in terms of energy loss reduction is supervised until the PV penetration level reaches 58%, and further, the trend line changes its direction, demonstrating increasing energy losses. The 200% of subcases express similar but better-expressed behavior. For the DP-oriented cases (i.e., cases 17–20), the energy losses decrease until the PV penetration is below 64%. Further, the energy losses become higher, and at the penetration level of 100% (case 20), the reduction in energy losses is 0.88% compared to the base case. In such a way, case 20 is seen as outperformed by cases 4 and 12. If one looks at the corresponding trend line for EComPs, it can be seen that the energy losses stop decreasing after 40% PV penetration already. At the penetration level of 100% (case 33), the energy losses even increase by 0.34% compared to the base case.
The situations when the energy loss trends change their direction to the opposite, i.e., energy losses begin to increase, can be explained by the fact that when energy generation prevails over consumption, additional losses occur in the PDS due to energy transfer to the main grid. This pattern takes place for the scenarios with DPs as well as with EComPs. But for DP-oriented scenarios, a higher PV penetration threshold is needed to observe the increase in energy losses with additional solar distributed generation deployed. This means that the PDS is more tolerant of evenly distributed DPs, compared to ECom. From the charts, it can be concluded that the reduction in energy losses is nonlinear, and its pace slows down with the incrementing PV penetration.
The comparison of energy losses in the power network for DPs and EComPs (ECom is the 160th node) is presented in
Figure 8.
The charts confirm the previously stated conclusions, namely that for DPs, energy losses constantly decrease with the increasing power of the PV generation units. On the contrary, for EComPs, energy losses slightly decrease until the PV HC reaches a certain point, which is, in our case, 3490 kW. Further energy losses increase, which is due to the distribution of larger power flows through the network, compared to the DPs scenarios when the generated power can be consumed nearby the source.
5. Conclusions
In this study, the influence of different individual/community options for the prosumers on the profitability and hosting capacity of the power distribution system was investigated. The results show that the profitability of Ecom is higher compared to the individual distributed prosumers. According to the results obtained, the payback period of a solar power plant of an ECom is from 6 to 12 years, depending on the installed PV capacity. The payback period for a PV installation for DPs is between 12 and 16 years, depending on the scenario. The total profit of EComPs is 36–54% more than that of DPs. Based on the results obtained, decision-makers consider which scenario suits them best and how long they are ready to wait for the payback of the investments, taking into account the fulfillment of technical restrictions. The feasibility of various penetration levels of prosumers was determined by requiring that voltages and currents in the PDS stay within the explicitly determined acceptable ranges.
For all the scenarios considered, improvements in terms of energy loss reduction can be supervised until the PV penetration reaches a particular threshold. In such a way, the trend lines of energy loss reduction in the PDSs with prosumers are nonlinear, and their slope reduces with the increase in PV penetration. At certain points, when the penetration of DPs or EComPs reaches critical values, the trend lines change their declining character to the opposite, and with further growth of PV penetration, the energy losses increase. This phenomenon is due to the physical nature of the PDS operation: when energy generation prevails over consumption, the excessive energy is transferred to the main grid, which causes additional transmission losses.
For all the studied cases with DPs, the HC is over 200% of the installed load, i.e., each individual consumer can become a prosumer with a rooftop PV installation, and the rated capacity of the latter can be twice as big as the prosumer’s consumption. For the EComPs-focused scenarios, the HC of the PDS was found to be slightly lower and dependent on the location of a solar power plant. In particular, the PDS cannot safely operate with a big enough solar ECom, when it is deployed in nodes 108 (cases 30, 34), 152 (case 36), and 160 (case 33). For these cases with EComPs, the HC of the PDS was estimated to be as high as 143.5%, 143.7%, 196.6%, and 164% of the installed load, correspondingly, while for similar DPs-focused cases, the possible HC was higher than 200%.
In general, cases with EComs demonstrate higher PV generation output, which is due to lower system interconnection losses (including inverters and efficiency rates) compared to the scattered small-scale rooftop PV installations. However, DP-focused cases are outstanding in terms of safer operation of the PDS and smaller energy losses compared to EComP-focused cases. This means that the PDS is most tolerant to evenly distributed prosumers rather than to single sources of a larger scale installed in one node. For the studied scenarios, the capacity of PV for DPs and EComPs does not exceed 200% of the total load demand. Further increase of the capacity, in most cases, causes a violation of the hard operational constraints or requires additional investments to reinforce the PDS.


