Article

Numerical Study on Hydraulic Fracture Propagation in a Layered Continental Shale Reservoir

1
Chinese Academy of Geological Sciences, Beijing 100037, China
2
Faculty of Urban Construction, Beijing University of Technology, Beijing 100124, China
3
Oil and Gas Survey, China Geological Survey, Beijing 100083, China
*
Author to whom correspondence should be addressed.
Energies 2022, 15(23), 8840; https://doi.org/10.3390/en15238840
Submission received: 6 October 2022 / Revised: 14 November 2022 / Accepted: 20 November 2022 / Published: 23 November 2022

Abstract

:
The distribution of beddings varies greatly in shale reservoirs. The influence of beddings on hydraulic fracture propagation has often been studied using simplified geological models, i.e., uniformly distributed bedding models. However, the propagation processes of hydraulic fractures in shale reservoirs with complicated distributed beddings remains unclear. In this research, an outcrop-data-based bedding model of a continental shale formation in the Ordos Basin, China, is built. A mathematical model for fracture propagation is built using the discrete element method and is then verified by a hydraulic fracturing experiment. Reservoir-scale simulations are employed to investigate the influence of geological factors and engineering factors on fracture geometry. The study finds that beddings have significant inhibitory effects on fracture height growth; hydraulic fractures have difficulty in breaking through zones with densely distributed beddings. If a hydraulic fracture encounters a bedding plane with a larger aperture, it is more likely to be captured and expand along the weak interface. High vertical stress difference and a high fluid injection rate can promote the vertical penetration of hydraulic fractures through beddings and activate the bedding system to yield a complex fracture network. Increments in fluid viscosity can increase the resistance of fracture propagation, thereby reducing fracture complexity.

1. Introduction

Multistage hydraulic fracturing technology plays an important role in shale gas production. Engineering practice finds that geological factors, such as bedding distributions, interface properties and in situ stresses, and engineering factors, such as fluid injection rate and fluid viscosity, all affect fracture complexity [1,2,3,4,5]. Field hydraulic fracturing tests reveal that it is difficult to obtain expected fracture heights through increasing fluid injection rates due to the blockage of beddings [6,7]. The distribution of beddings varies greatly in the vertical direction, leading to the heterogeneity and mechanical anisotropy of shale reservoirs [8,9,10,11,12]. Fracture growth in layered shale reservoirs has the following characteristics [13,14,15]: (1) they are affected by beddings and fracture height growth is restricted; (2) fracture geometry is complex, resulting in uncertainty in multistage hydraulic fracturing design.
Fracture propagation in layered reservoirs has been often studied by hydraulic fracturing experiments. Warpinski et al. [16] investigated the effect of stress variations on fracture growth in layered rock samples. Olson et al. [17], Liu et al. [18] and Huang et al. [19] investigated fracture height growth in layered rocks based on experimental analysis. Ranjith et al. [20] found that a low foam injection flow rate could improve fracture complexity. Triaxial fracturing tests provide an effective way to analyze the effect of geological and engineering parameters on fracture penetration [21,22,23,24,25]. Zhang et al. [26] and Zhao et al. [15] analyzed the role of beddings in facture growth, and concluded that bedding interfaces were the main cause of fracture network patterns. The interaction mechanisms between hydraulic fractures and bedding interfaces are well understood through laboratory experiments. However, limited by sample size, knowledge of the actual propagation process on a reservoir scale remains unclear.
Numerical simulations provide an insight into fracture growth in layered reservoirs [27]. Commonly used methods for hydraulic fracturing include the finite element method (FEM), displacement discontinuity method (DDM), discrete element method (DEM) and extended finite element method (XFEM). For example, Fu et al. [28] investigated the influence of interlayer permeability and stress difference on fracture penetration using the FEM. Gu et al. [29] built a three-dimensional model, considering the influence of bedding plane interfacial slip and filtration loss based on the DDM; however, the interaction between bedding planes and hydraulic fractures was solved by a simplified analytical method. Zhang et al. [30] established a quasi-3D displacement discontinuity model to study fracture height growth in layered rocks. Tang et al. [31,32,33] and Xie et al. [34] used the DDM to study the limiting effect of horizontal weak interfaces on fracture height. Dahi-Taleghani and Olson [35], and Klimenko and Dahi-Taleghani [36] realized the simulation of asymmetric fracture wings using the XFEM. Settgast et al. [37] presented a fully coupled finite element/finite volume method to realize a filed-scale reservoir simulation, and found that under low vertical stress difference, T-shaped or horizontal fractures were easily formed, and the opening of bedding interfaces inhibited the growth of fracture height. Tan et al. [38] modeled the turning, twisting and expanding behavior of hydraulic fractures in a layered shale formation using the XFEM-based CZM method. The discrete element method (DEM) offers an effective tool to model arbitrary propagation of hydraulic fractures, and is more suitable for analyzing discontinuous media, such as fractured reservoirs [39,40]. Currently, the DEM has been successfully applied to study the role of preexisting discontinuities on fracture extension. For example, Zhou et al. [41] and Zhang et al. [42] employed a smooth joint model to study interactions between hydraulic and natural fractures; Yao et al. [43] investigated the role of natural fracture characteristics in hydraulic fracture propagation using the DEM; Li et al. [44] used a grain-based DEM to model hydraulic fracture propagation. Although current progress in hydraulic fracturing modeling has been achieved, knowledge of the actual propagation process remains unclear, since the geological models used in the simulations cannot reflect the geological structure of shale reservoirs [3]. Fracture behavior cannot be predicted or controlled unless an accurate geological model is built.
The Ordos Basin is the second largest sedimentary basin in China, where multiscale beddings are pervasive in the continental shale formations [45,46]. At present, field fracturing tests in this area show that injected fluid is prone to enter bedding interfaces during hydraulic fracturing, resulting in unsatisfactory production and low economic benefits [6]. Although the combination of high-viscosity fluids which is used to generate hydraulic fractures and low-viscosity slick water which is used to disrupt beddings has been used, the reconstruction effect of different blocks is quite different [6,47]. To effectively guide the hydraulic-fracturing design, it is urgent to determine fracture growth in layered shale rock, and clarify the influencing factors. In this research, an outcrop-based bedding model of the continental shale formation in the Ordos Basin is built. Reservoir-scale simulations using the discrete element method are employed to investigate the influence of geological factors and engineering factors on fracture geometry.

2. Geological Background

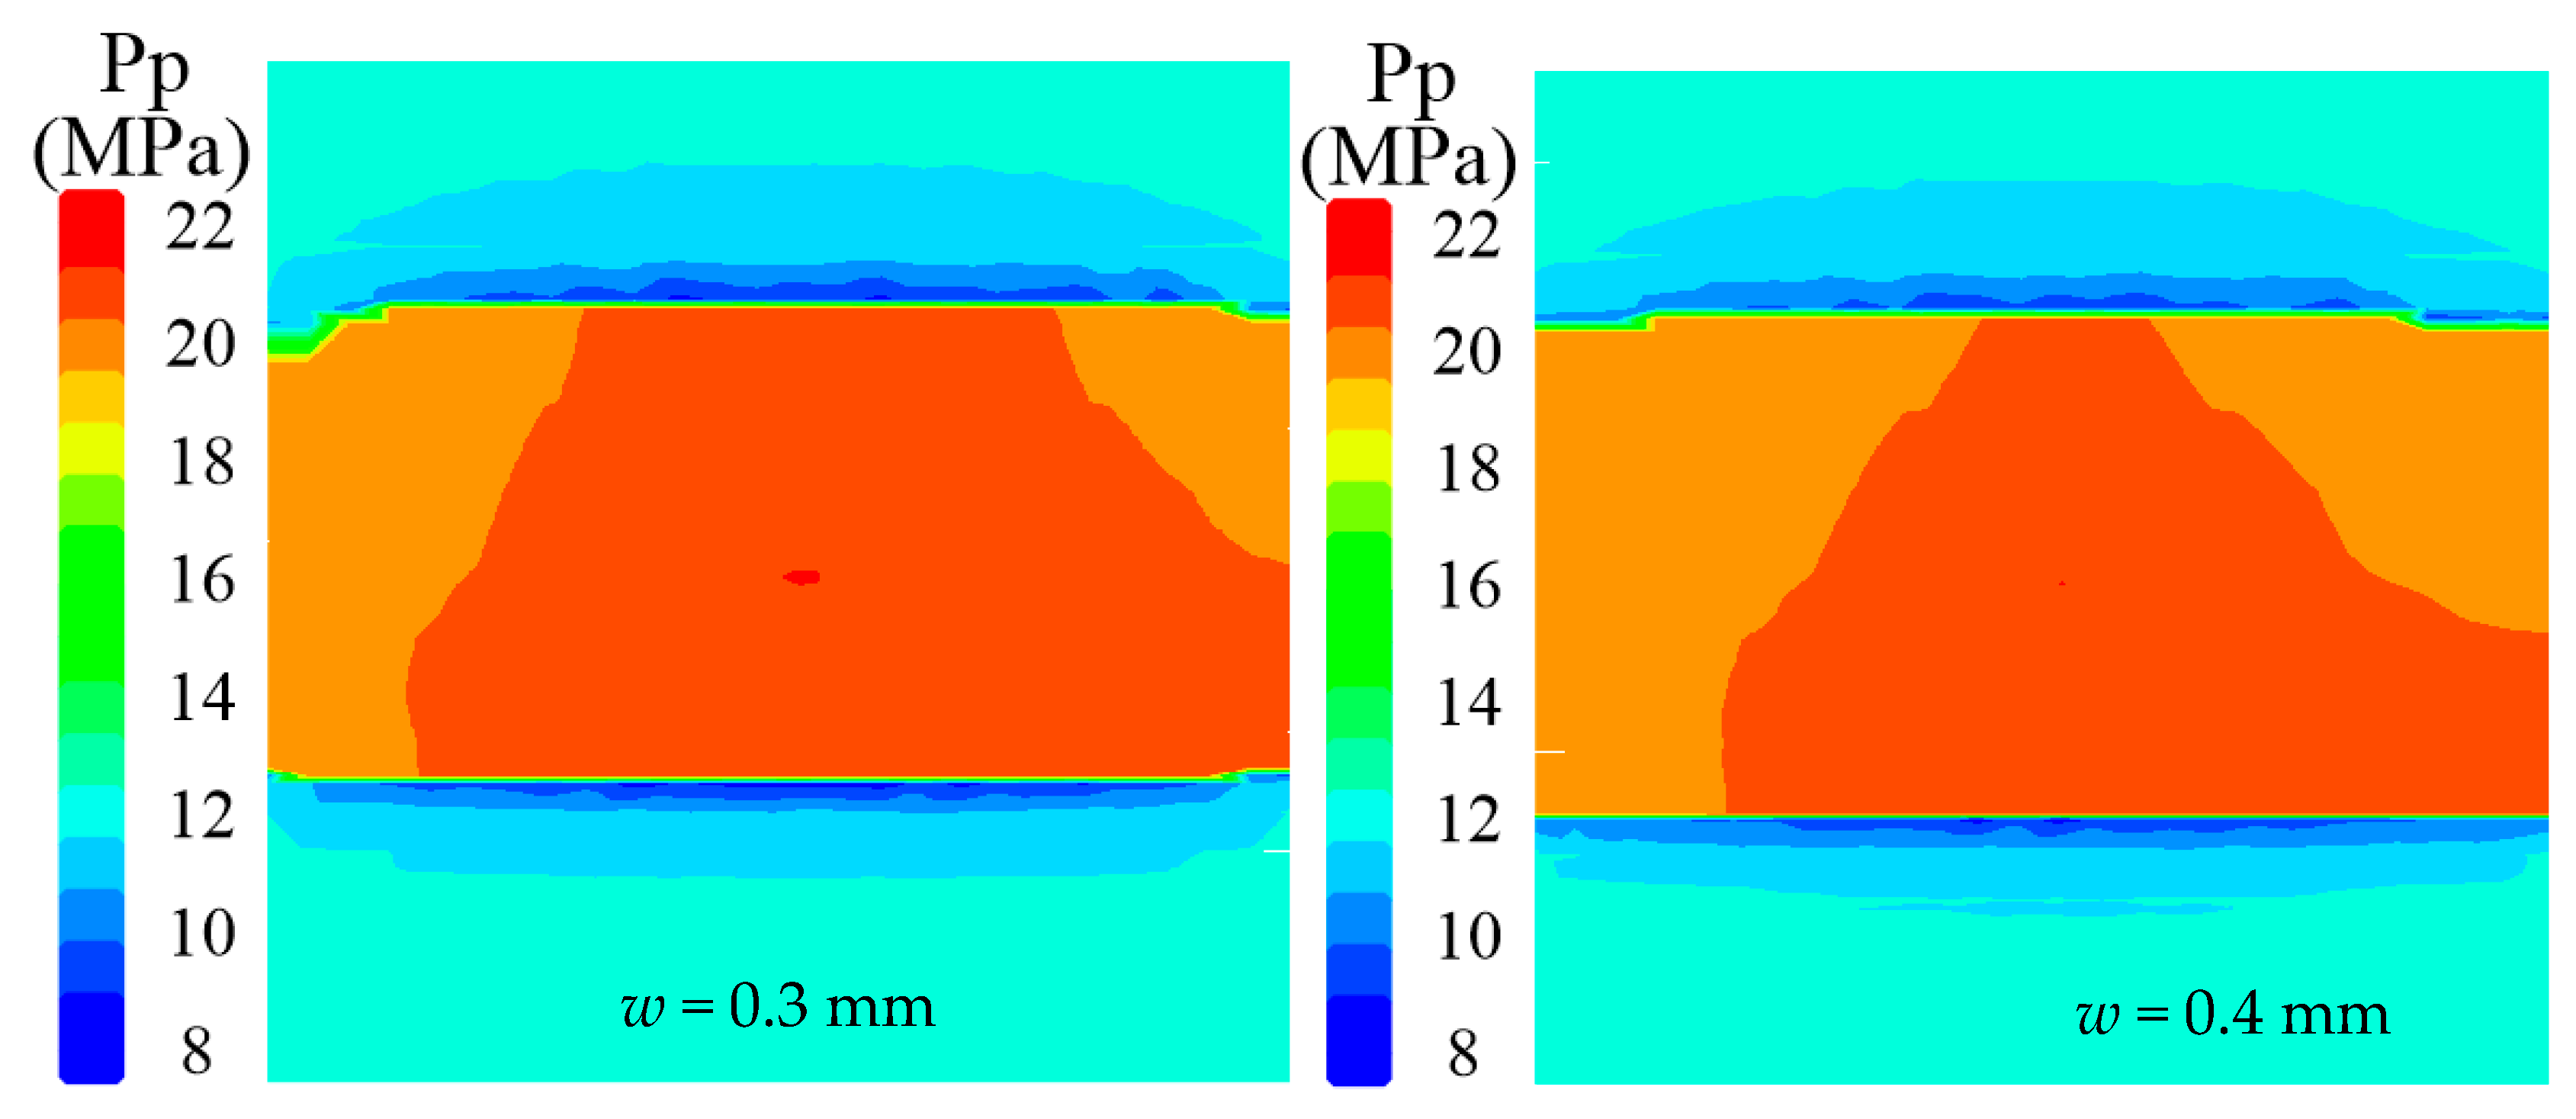
The Ordos Basin is a multi-cycle sedimentary basin that developed on the North China Platform. The structural framework of the basin was formed in the Mesozoic period. The basin is a gentle monoclinic structure, low in the west and high in the east, and the east-to-west dip is smaller than 1° [48]. It is composed of six secondary structural units [14], including the Yimeng uplift belt, Yishan slope, Tianhuan depression, western edge thrusting belt, Jinxi flexural fold belt and Weibei uplift belt (Figure 1a).
In the late Triassic period, as the material supply in the basin was sufficient, a series of terrigenous clastic deposits were formed. The Chang 7 member of the Triassic Yanchang Formation was formed in the heyday of the lake basin expansion, which is divided into three sub-members from top to bottom, namely Chang 7-1, Chang 7-2 and Chang 7-3. The Chang 7-2 shale, with a thickness varying from 10 m to 40 m, is the main source rock, which is deemed to be the key target formation for gas exploration. As a sedimentary rock, the structure of the Chang 7-2 shale is thin-layered or laminar, resulting in strong heterogeneity in its mechanical properties. The porosity of shale is approximately 10%, and the permeability is less than 1 × 10⁻³ μm2. Filed investigation was carried out in the south margin of the Ordos Basin, as shown in Figure 1b.

3. Geological Model of the Shale Gas Reservoir

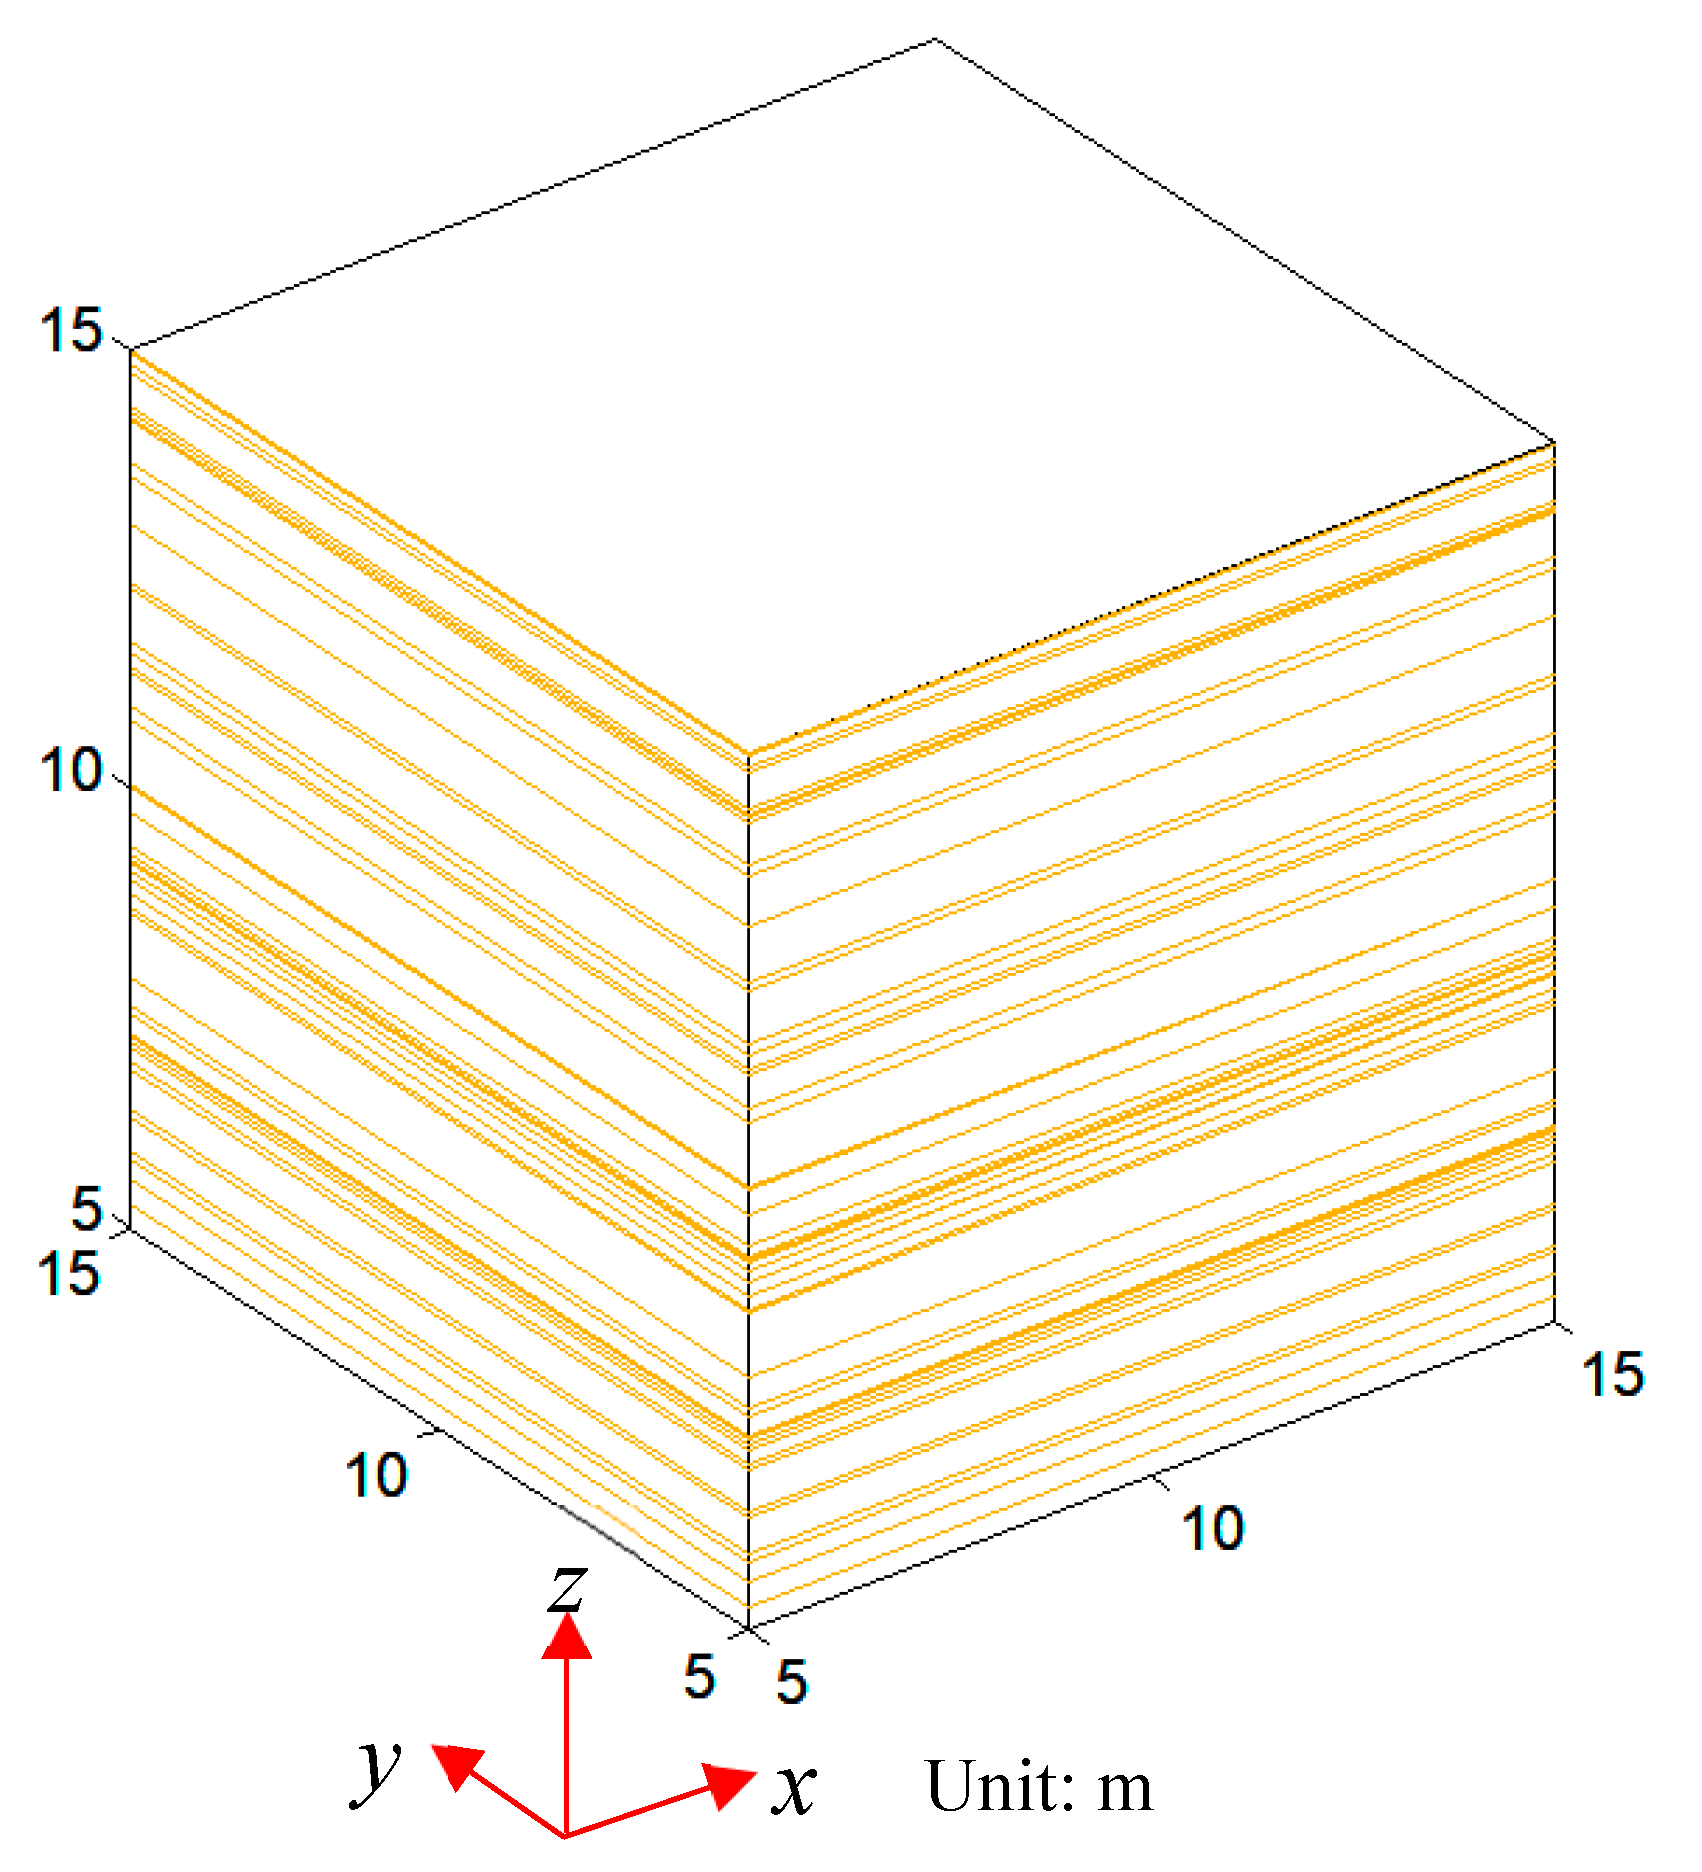
Field investigation, borehole imaging and logging were conducted to obtain the bedding data in the study area (Figure 2a,b). Figure 2c shows that the beddings have an average spacing of 20.9 cm. As shown in Figure 2d, the distribution of the spacing obeys a negative exponential distribution. Bedding planes are horizontally distributed in the shale formations in the study area. In the model, bedding planes are horizontal planes and the persistence of the bedding planes is assumed to be larger than the model size. A three-dimensional (3D) bedding model of the Chang 7-2 shale is built using the Monte Carlo method based on the statistical parameters of bedding spacing, including the mean of 20.9 cm and standard deviation of 25.2 cm (Figure 3). The average spacing of the simulated beddings is 20.7 cm. The relative difference between the simulated and actual beddings is only 0.96%, indicating that the bedding model is reliable.

4. Numerical Method

4.1. Governing Equation

In the numerical method used in this study, rock mass is represented by an assembly of intact rock blocks separated by a fracture network. Crack propagation is achieved by contact breakage [50]. The contact constitutive behavior is described by [51,52].
{ σ n = k n u n ,   while   u n 0 σ n = 0 ,   while   u n > 0
{ τ s = k s u s ,   while   | τ s |   σ n tan φ + c L τ s = sign ( Δ u s ) ( σ n tan φ + c L ) ,   while   | τ s |   > σ n tan φ + c L
where σn and τs are the normal and shear stresses, respectively; un and us are the normal and shear displacements, respectively; Δus is the displacement increment; kn and ks are the normal and shear stiffnesses, respectively; φ and c are the friction angle and cohesive strength, respectively; and L is the length of the contact surface.
The rock blocks are assumed to be impermeable, and fluid infiltrates the rock only through fractures. The flow rate qf along a fracture is calculated by the following cubic law [43,53,54]:
q f = e 3 12 μ w l Δ p
where e is the aperture, Δp is the pressure differential, and l and w are the length and width of a crack segment, respectively. e is calculated by [50].
e = e 0 + Δ u n
where e0 is the initial domain aperture, and Δun is the domain normal displacement increment. The domain pressure p is calculated as shown in [52].
p = p 0 + K w Q Δ t V 2 K w ( V V 0 ) ( V + V 0 )
where p0 is the initial domain pressure, Q is the sum of flow rates into the domain, Kw is the fluid bulk modulus, Δt is the time step, and V and V0 are the new and old domain volumes, respectively.

4.2. Validation

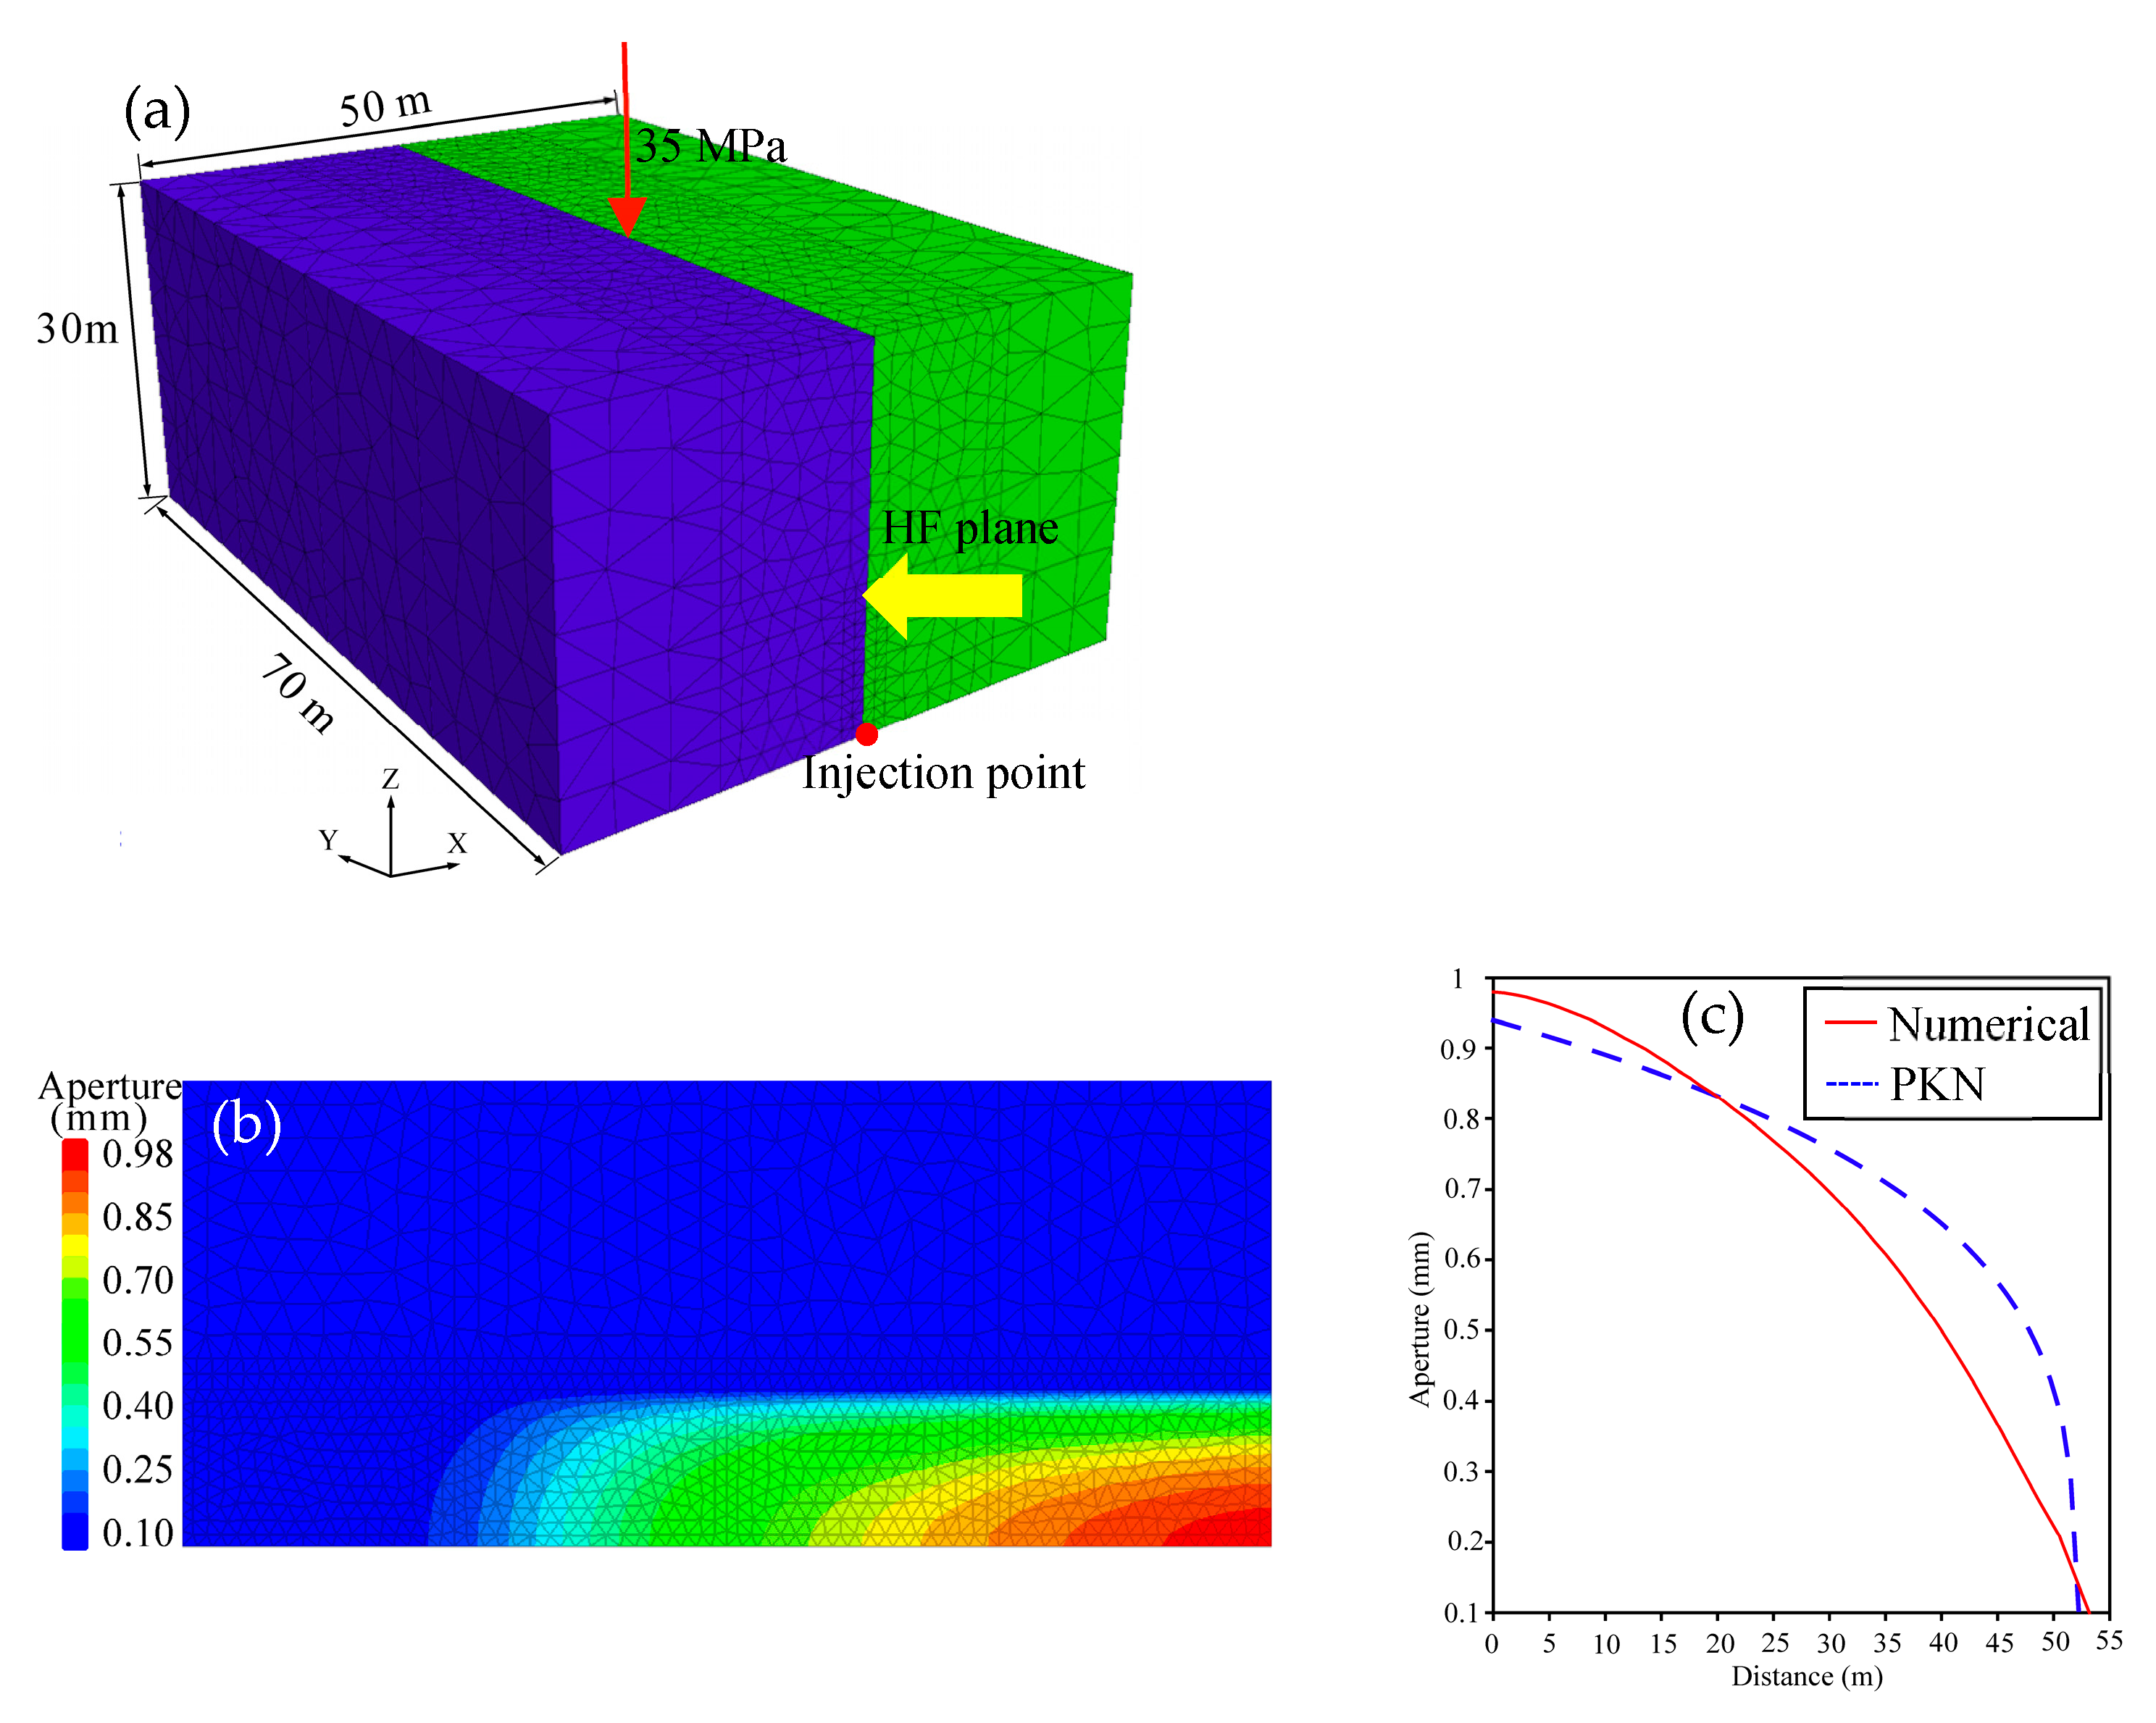
We choose a homogeneous and elastic model with a Young’s modulus of 10.3 GPa and a Poisson’s ratio of 0.22 (Figure 4a) to verify the numerical method through a PKN solution [55]. A fluid with a 0.001 Pa·s viscosity is injected through the injection point at a rate of 0.002 m3/s. The fracture aperture distribution calculated by the simulation matched well with that obtained by the PKN solution (Figure 4b,c). The maximum fracture apertures obtained by the numerical and PKN solutions are 0.98 mm and 0.94 mm, respectively.

5. Hydraulic Fracture Propagation in the Layered Shale Reservoir

5.1. Numerical Model and Parameter Settings

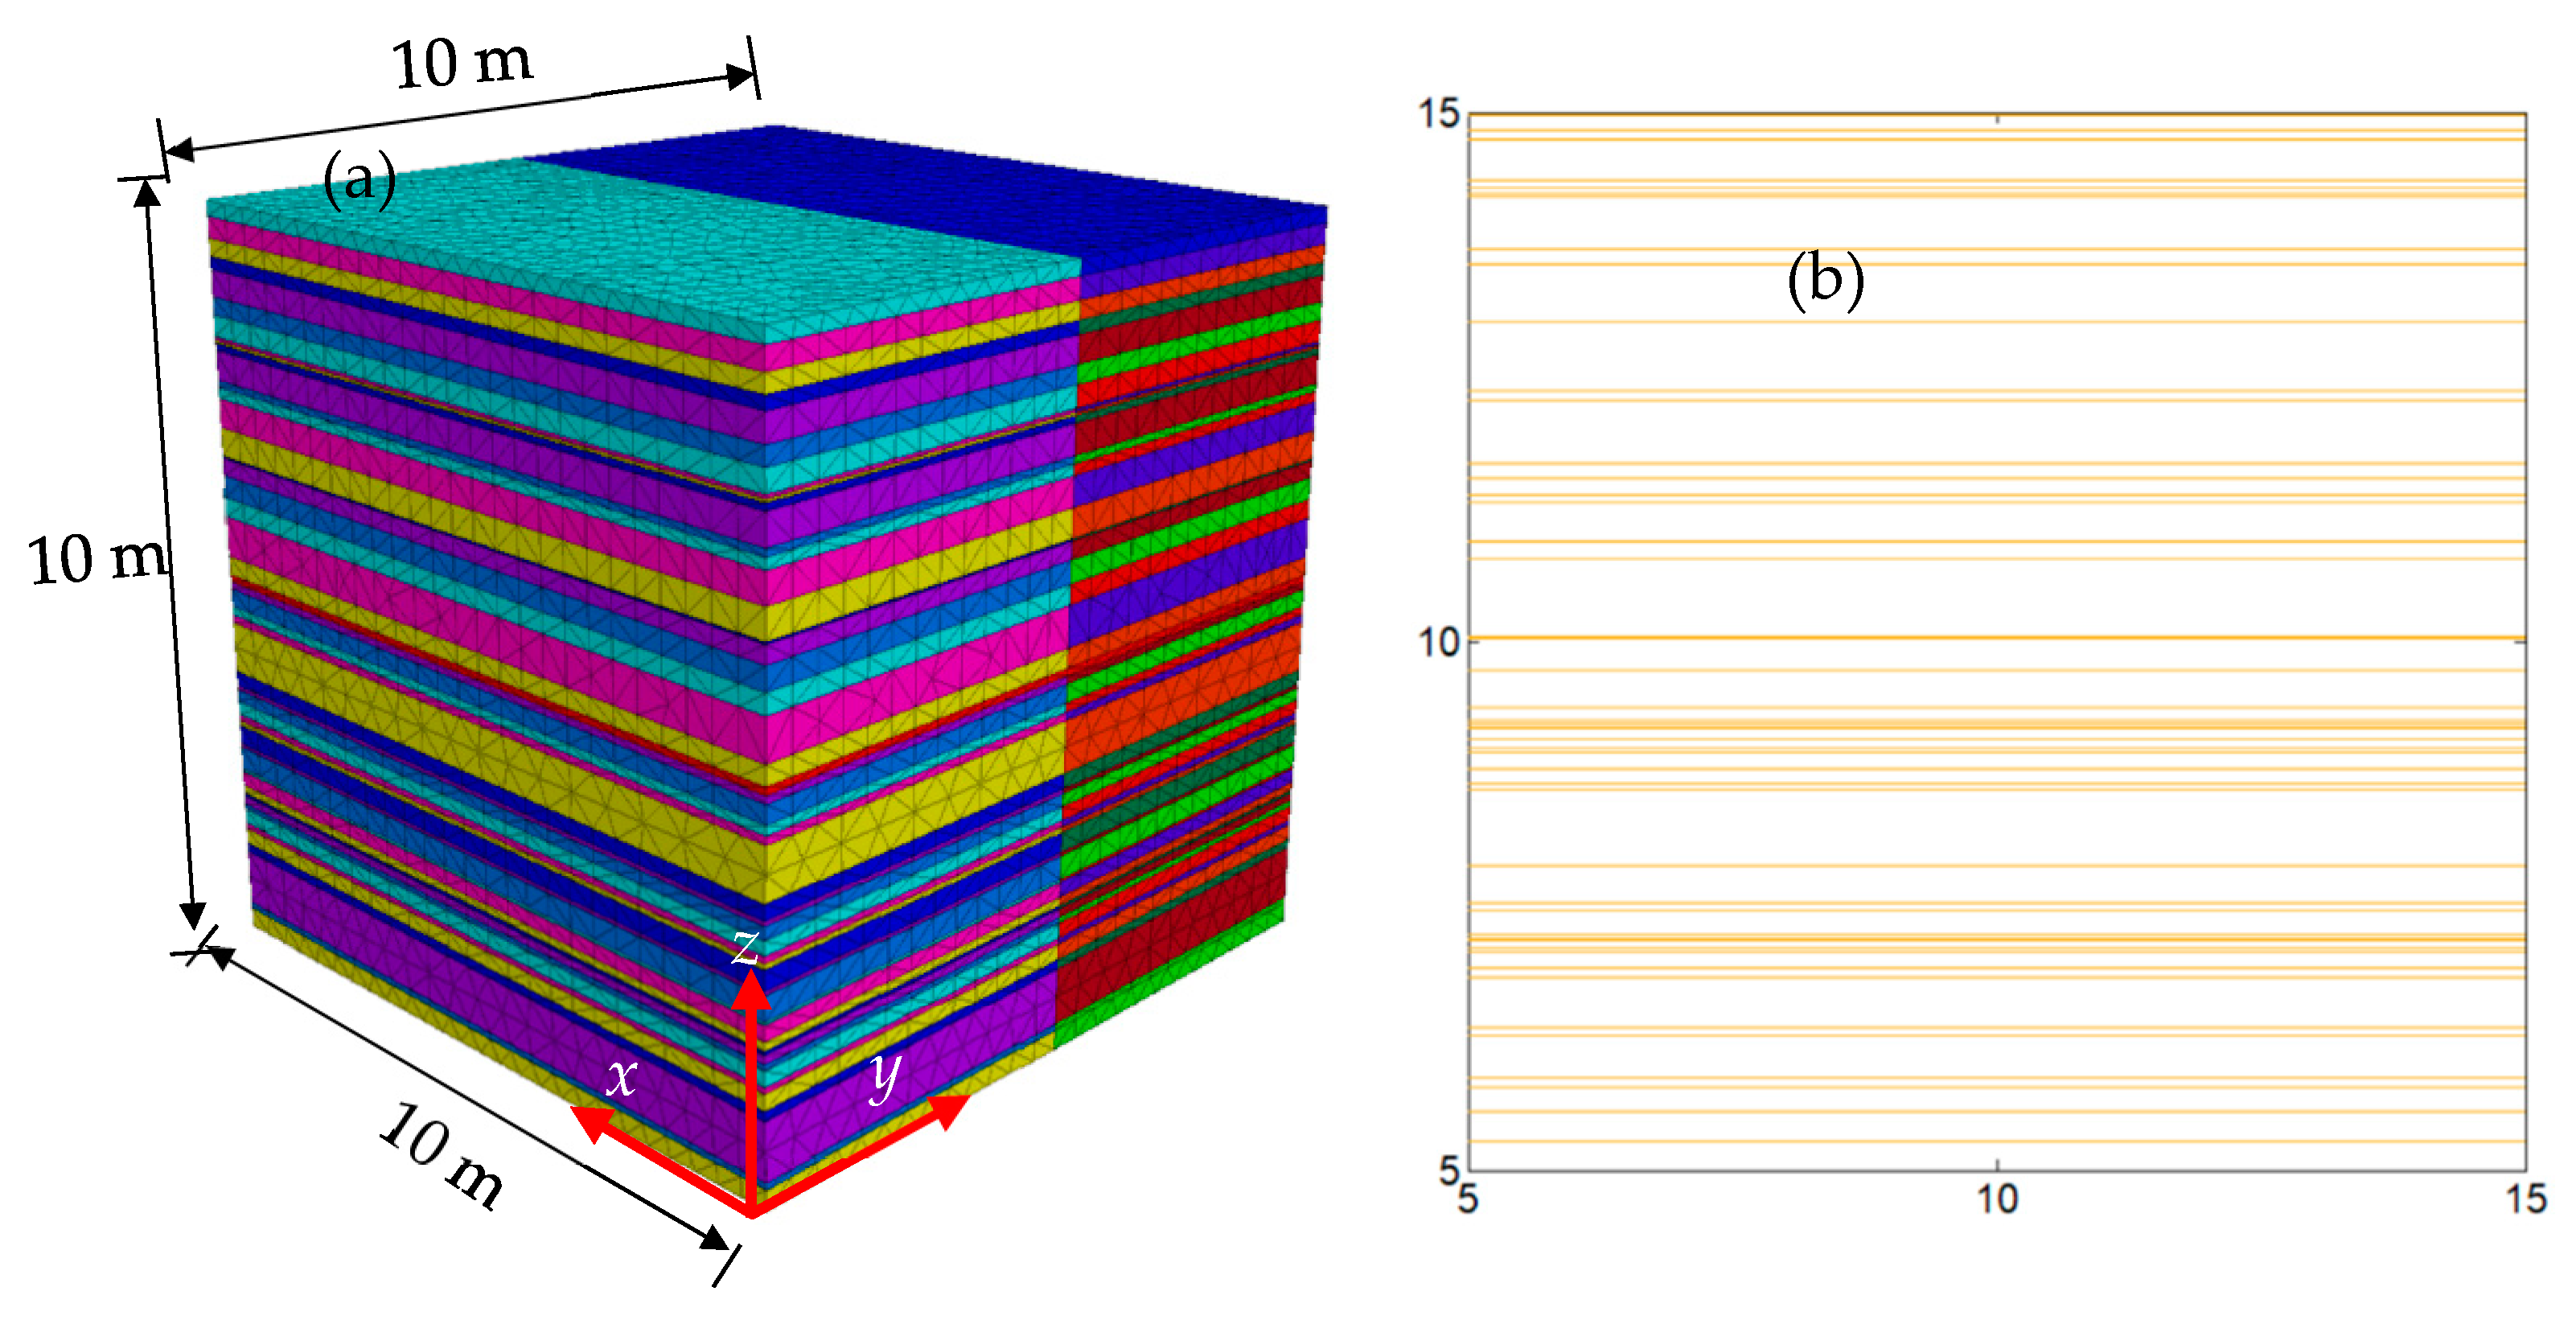
Numerical simulations of fracture propagation in the layered shale reservoir are conducted based on the 3D bedding model. To improve computational efficiency, a cubic model with a length of 10 m (Figure 5a) is extracted from the bedding model and used as the computational model in this work. In the simulations, to avoid the boundary effect, a larger model region with the dimensions of 20 m × 20 m × 20 m that is centered at (10, 10, 10) is built, while the inner box (i.e., the area of interest in the bedding model) with the dimensions of 10 m × 10 m × 10 m, which is also centered at (10, 10, 10), is built. A vertical profile is chosen to monitor the fracture growth process, as shown in Figure 5b. The isotropic elastic model is used for the rock matrix, and the Coulomb slip model is used for the beddings. The parameters used in the simulations are obtained from laboratory experiments on shale rock carried out by previous studies [11,56], as listed in Table 1. The injection well with a radius of 0.1 m is placed in the model center, and the injection time is 0.7 s. The model boundaries are fixed by setting the velocity to zero. In the simulation, the rock matrix is deemed to be impermeable, and fluid only flows along the fractures. In addition, one must note that fluid leak-off is not considered and the computation is time-consuming.

5.2. Numerical Results and Discussion

5.2.1. Effect of Vertical Stress Difference on Fracture Complexity

Four cases with the vertical/horizontal stress combinations of 20/20 MPa (Δσ = 0), 30/20 MPa (Δσ = 10 MPa), 40/20 MPa (Δσ = 20 MPa) and 50/20 MPa (Δσ = 30 MPa) are selected to investigate the role of vertical stress difference in fracture complexity. The bedding aperture is 0.1 mm. The fluid viscosity and injection rate are set as 0.001 Pa·s, and 0.05 m3/s, respectively.
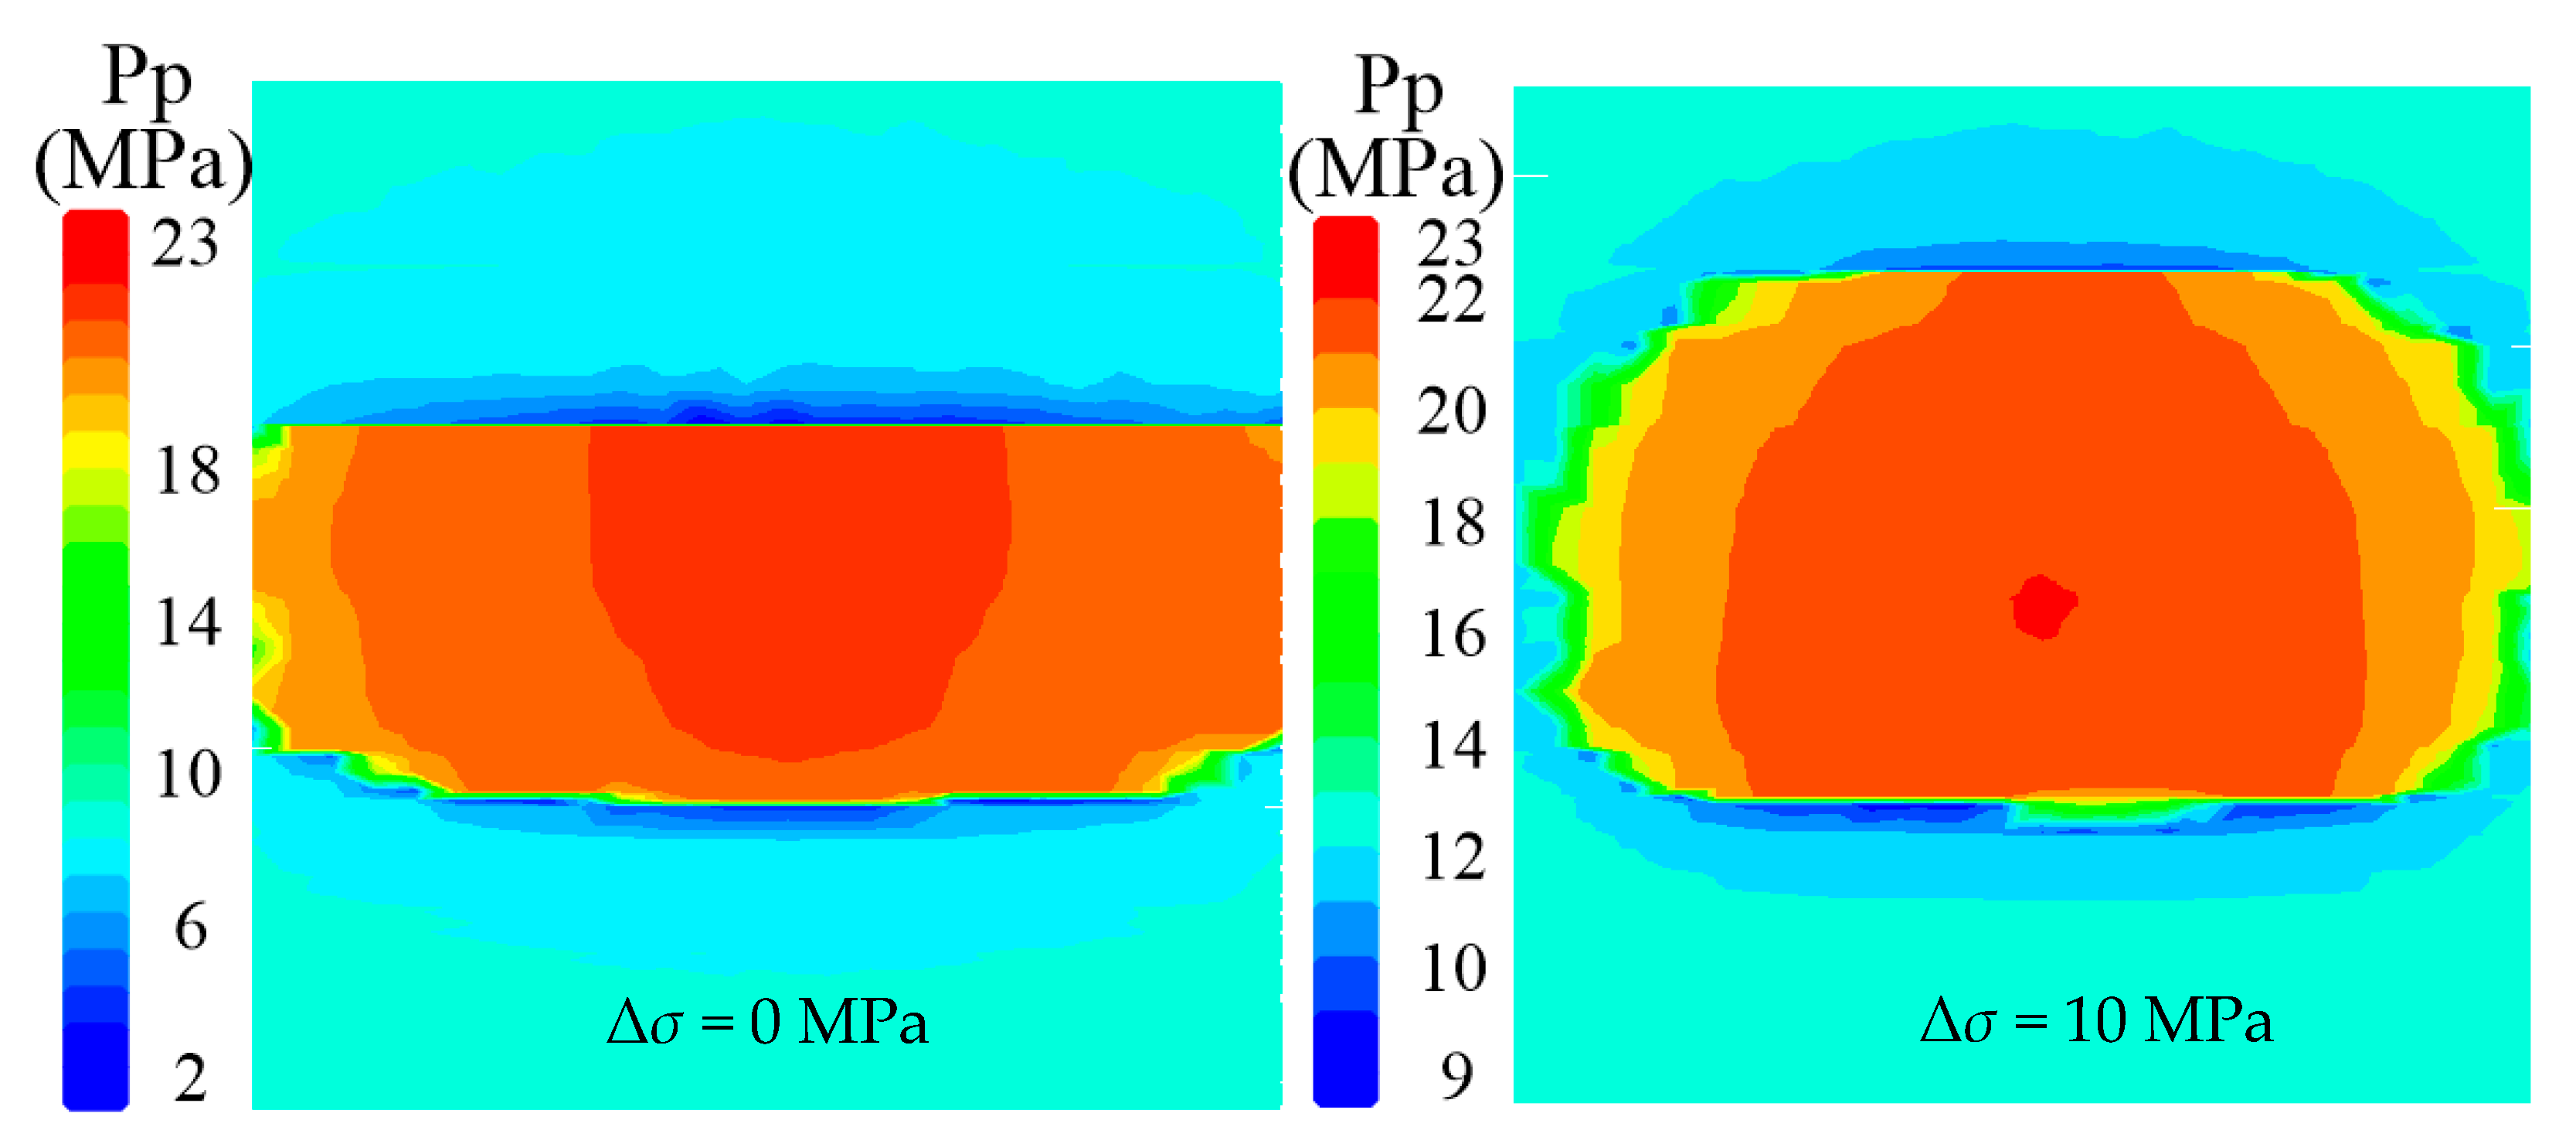
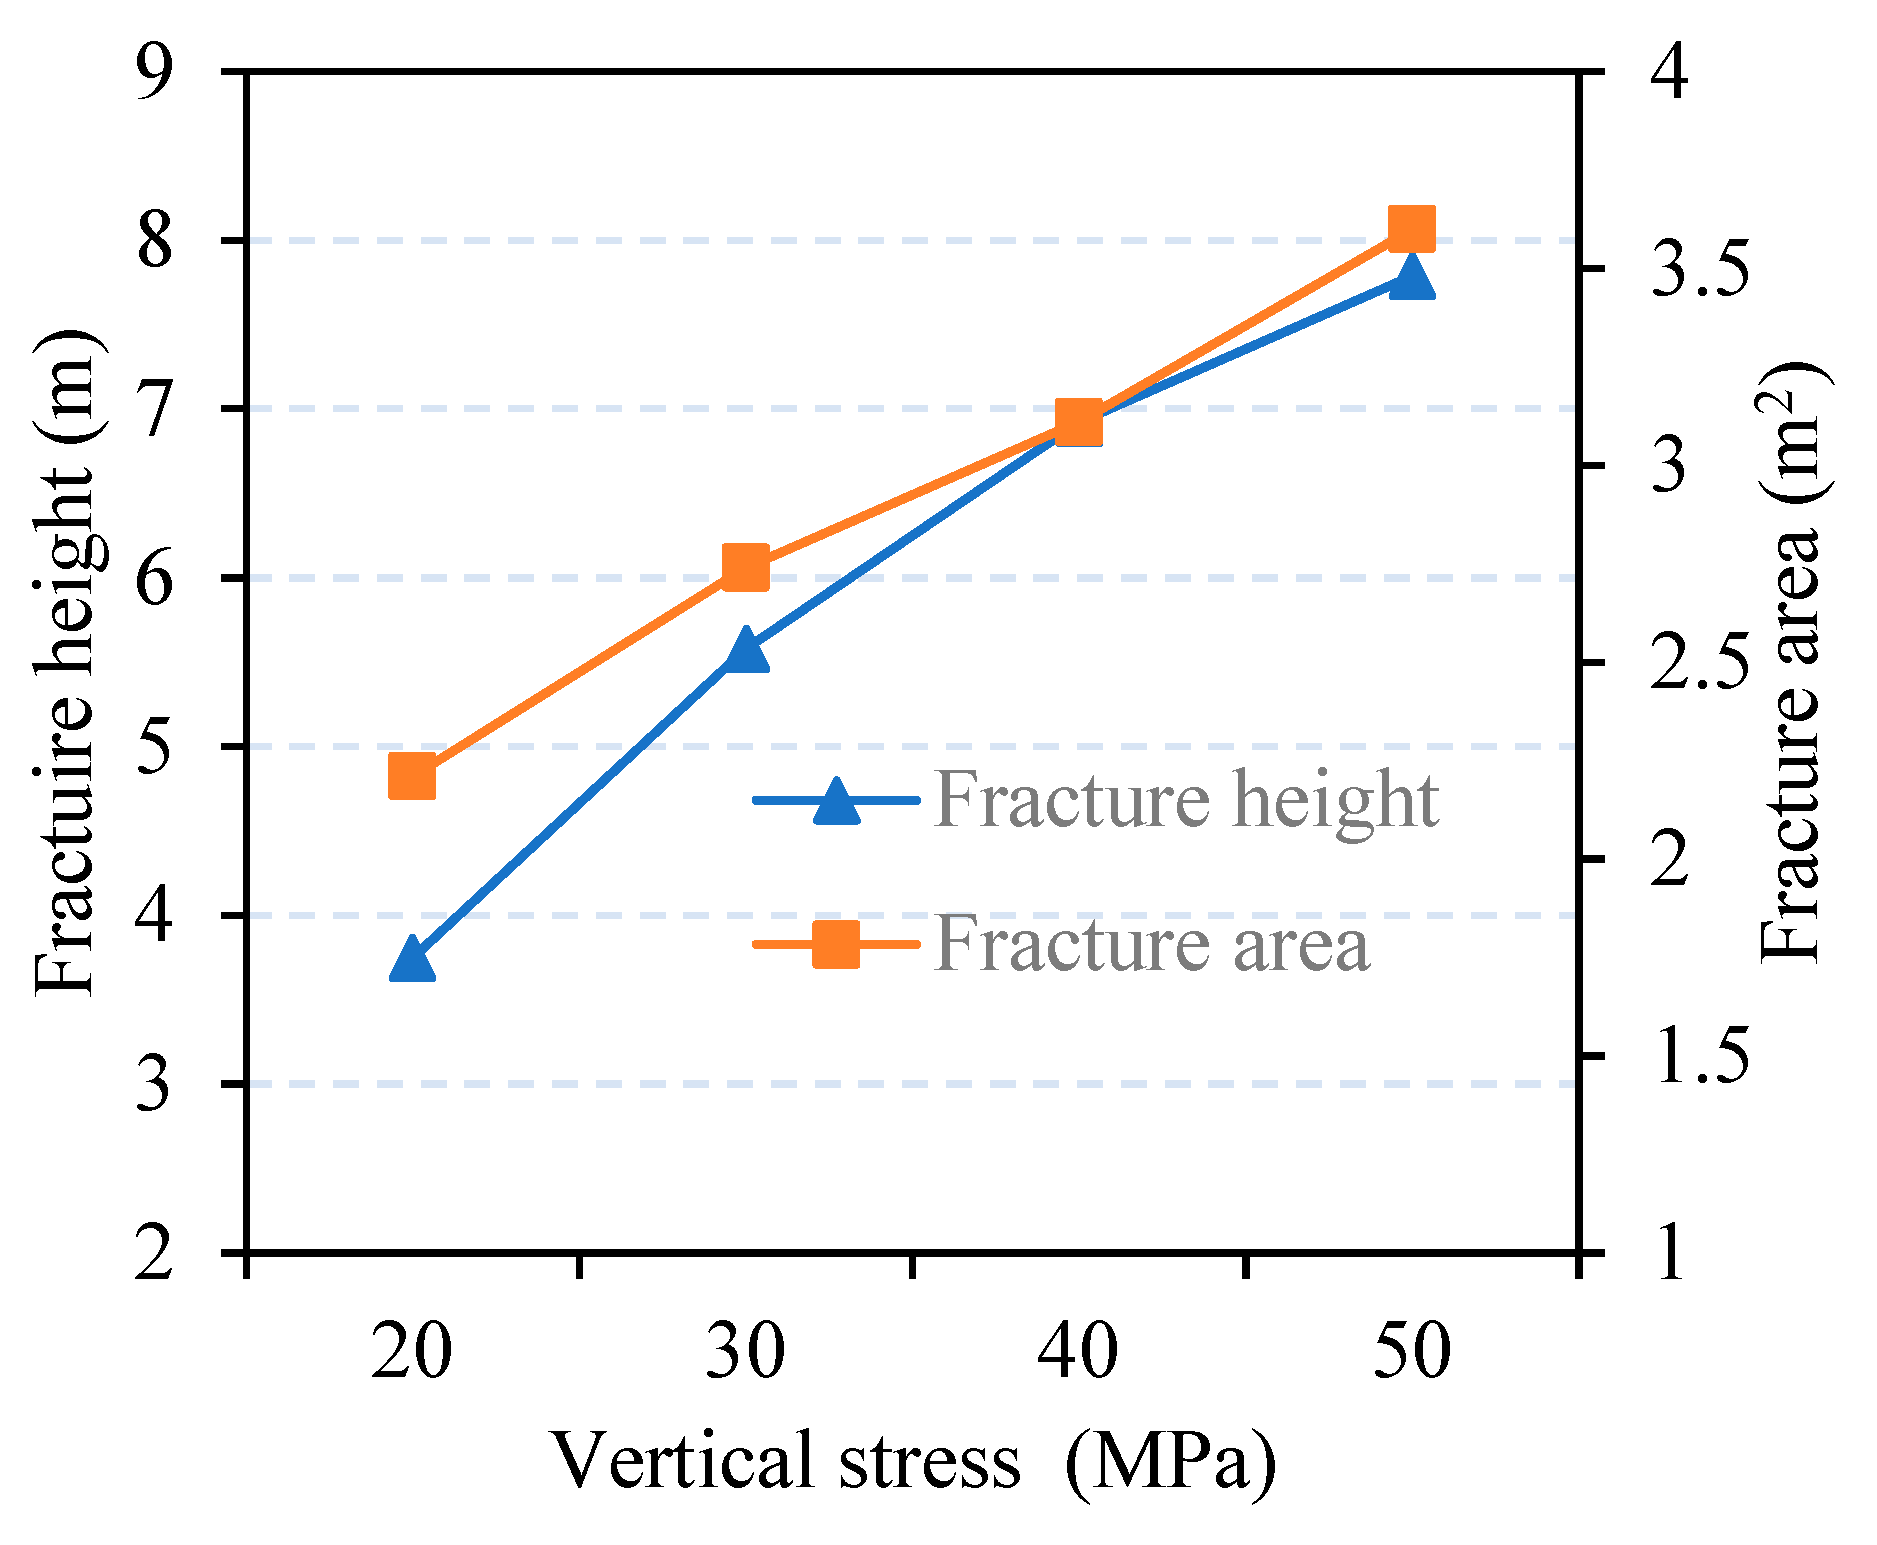
The vertical stress difference strongly influences hydraulic fracture geometry, as shown in Figure 6 and Figure 7. When Δσ = 0, the vertical growth of hydraulic fractures is restricted by bedding interfaces (Figure 6a). The opening of the bedding interfaces strongly inhibits the fracture height growth. Hydraulic fractures preferentially expand horizontally along the beddings when Δσ = 0, resulting in an ellipse-shaped fracture geometry, as shown in Figure 6a. Hydraulic fractures are more likely to be captured by bedding interfaces when Δσ is low. When Δσ increases from 0 MPa to 10 MPa, hydraulic fractures continue to expand upward, but fail to break through the densely distributed beddings in the lower part of the model (Figure 6b). When Δσ = 20 MPa and Δσ = 30 MPa, hydraulic fractures propagate through the beddings in both upward and downward directions driven by the vertical stress; the fracture height increases rapidly, and the fracture shape changes from an ellipse to a circle (Figure 6c,d), indicating that high vertical stress difference is favorable for fracture penetration through bedding interfaces. As shown in Figure 8, high vertical stress difference can improve fracture height and fracture area.

5.2.2. Effect of Fluid Viscosity on Fracture Complexity

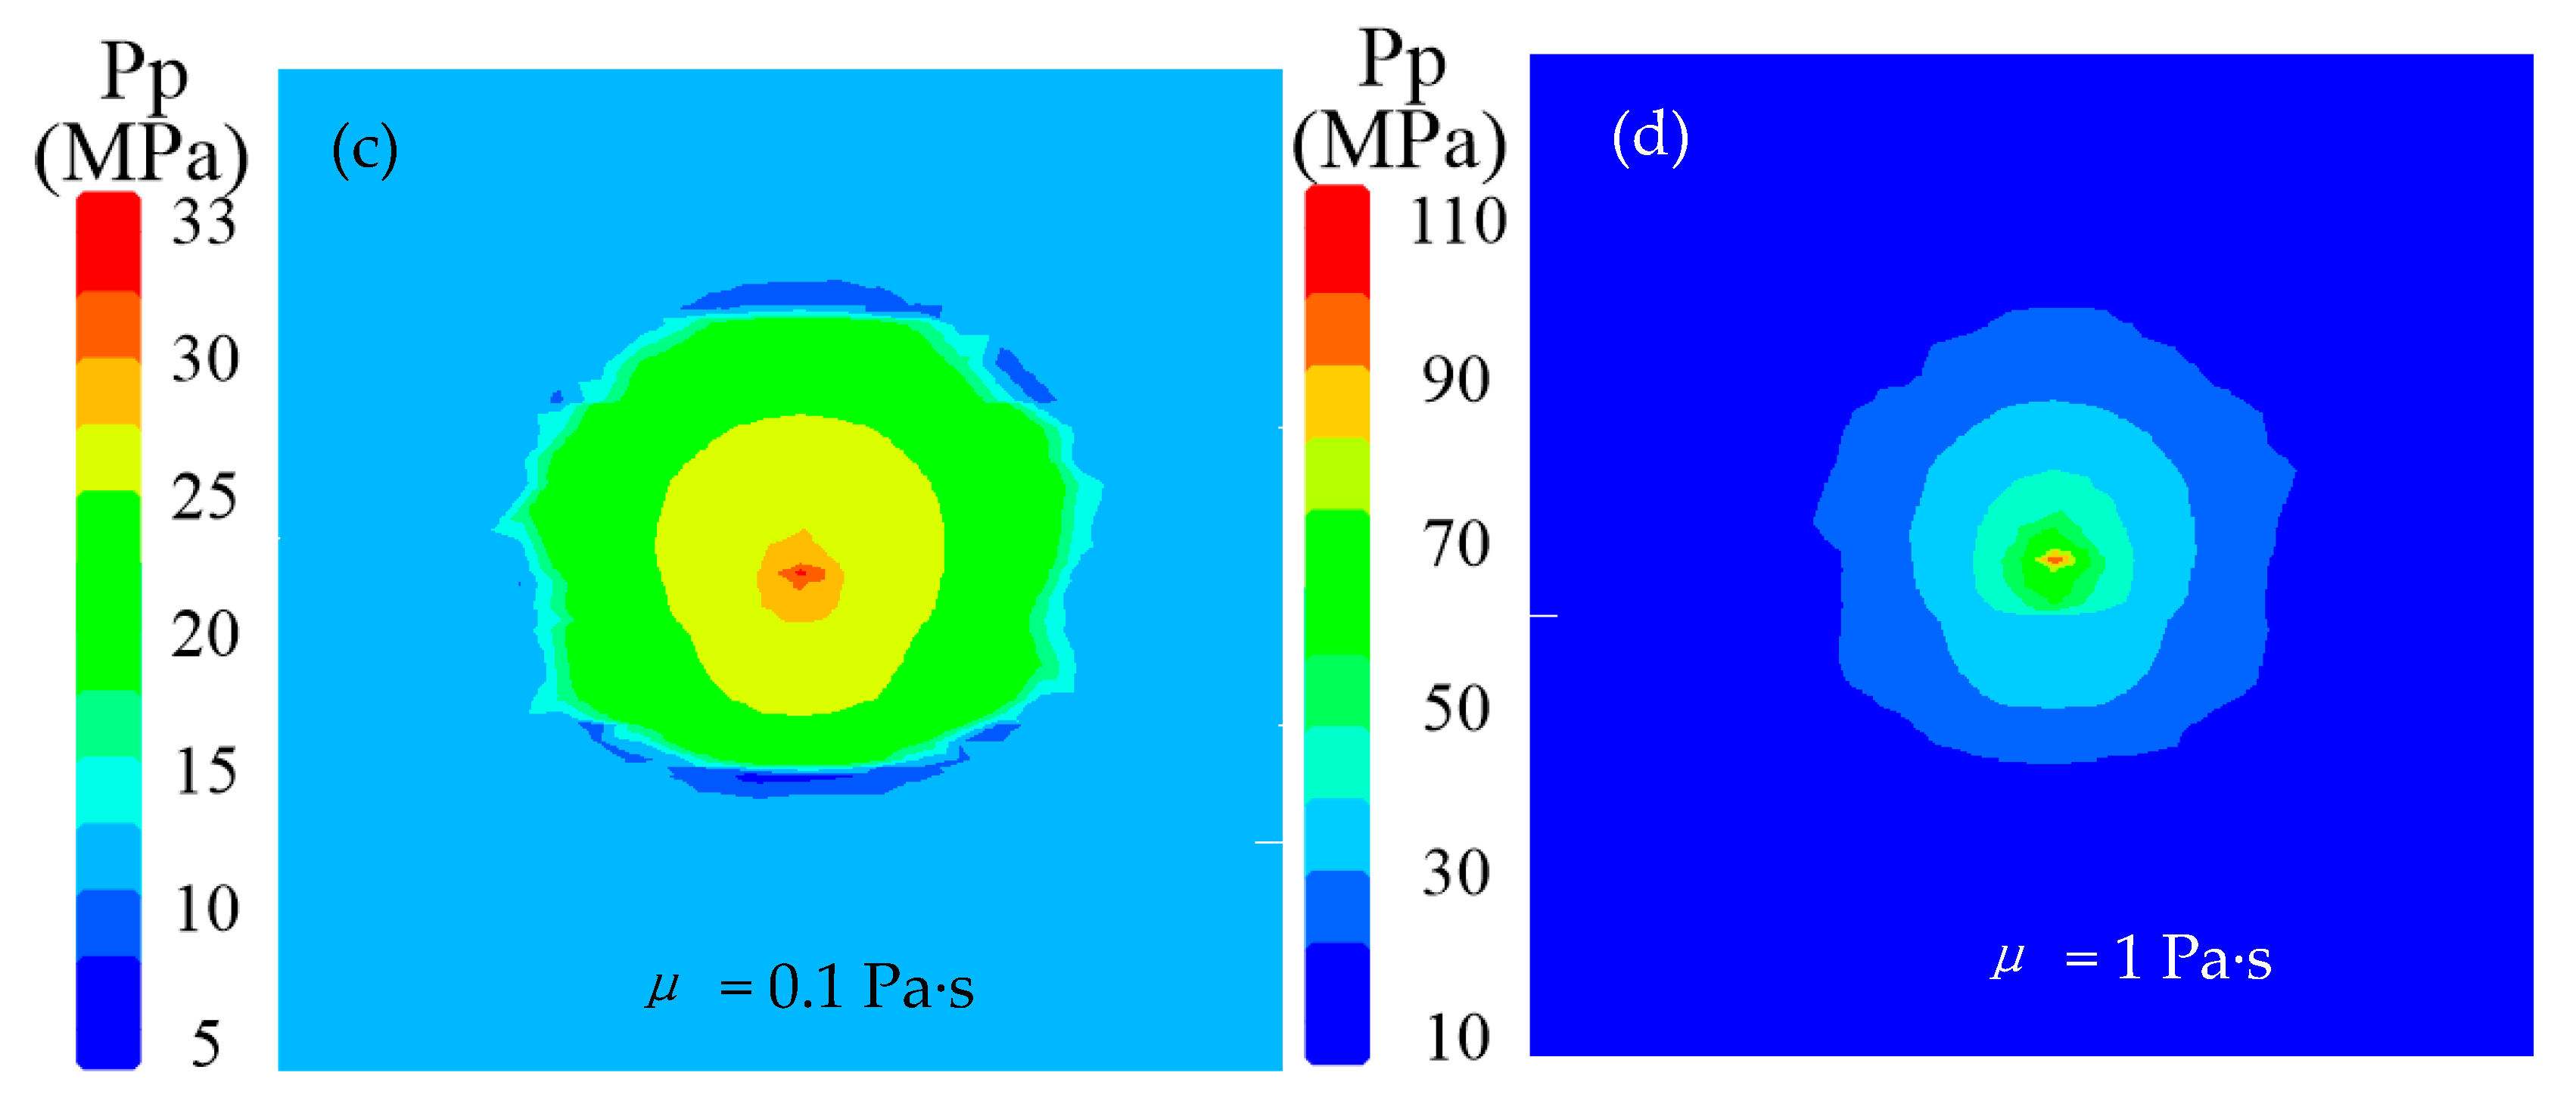
Four kinds of fluid viscosity, i.e., μ = 0.001 Pa·s, 0.01 Pa·s, 0.1 Pa·s and 1 Pa·s, are applied in the simulations. The vertical/horizontal stress is 30/20 MPa, and the injection rate is 0.05 m3/s, and the bedding aperture is 0.1 mm. The results suggest that fracture height and fracture area both decrease with the increase in fluid viscosity (Figure 9 and Figure 10). Fracture propagation is significantly affected by beddings for the case of μ= 0.001 Pa·s, which is characterized by horizontal expansion along the beddings. The hydraulic fracture height is controlled by the densely distributed beddings, and the fracture shape is an ellipse (Figure 9a). With the increase in fluid viscosity, fracture propagation in the vertical and horizontal directions is blocked (Figure 9b–d); at this time, fluid viscosity controls the propagation pattern of hydraulic fractures. According to Figure 11, it seems that increasing fluid viscosity can restrict fracture growth. In conclusion, high fluid viscosity increases the resistance of hydraulic fractures to propagate, thereby reducing the height and length of hydraulic fractures.

5.2.3. Effect of Injection Rate on Fracture Complexity

In the simulation, the injection rate q is set as 0.02 m3/s, 0.04 m3/s, 0.06 m3/s and 0.08 m3/s, respectively, to investigate its influence on fracture complexity. The bedding aperture is 0.1 mm and the vertical/horizontal stress is 30/20 MPa. The fluid viscosity is set as 0.001 Pa·s.
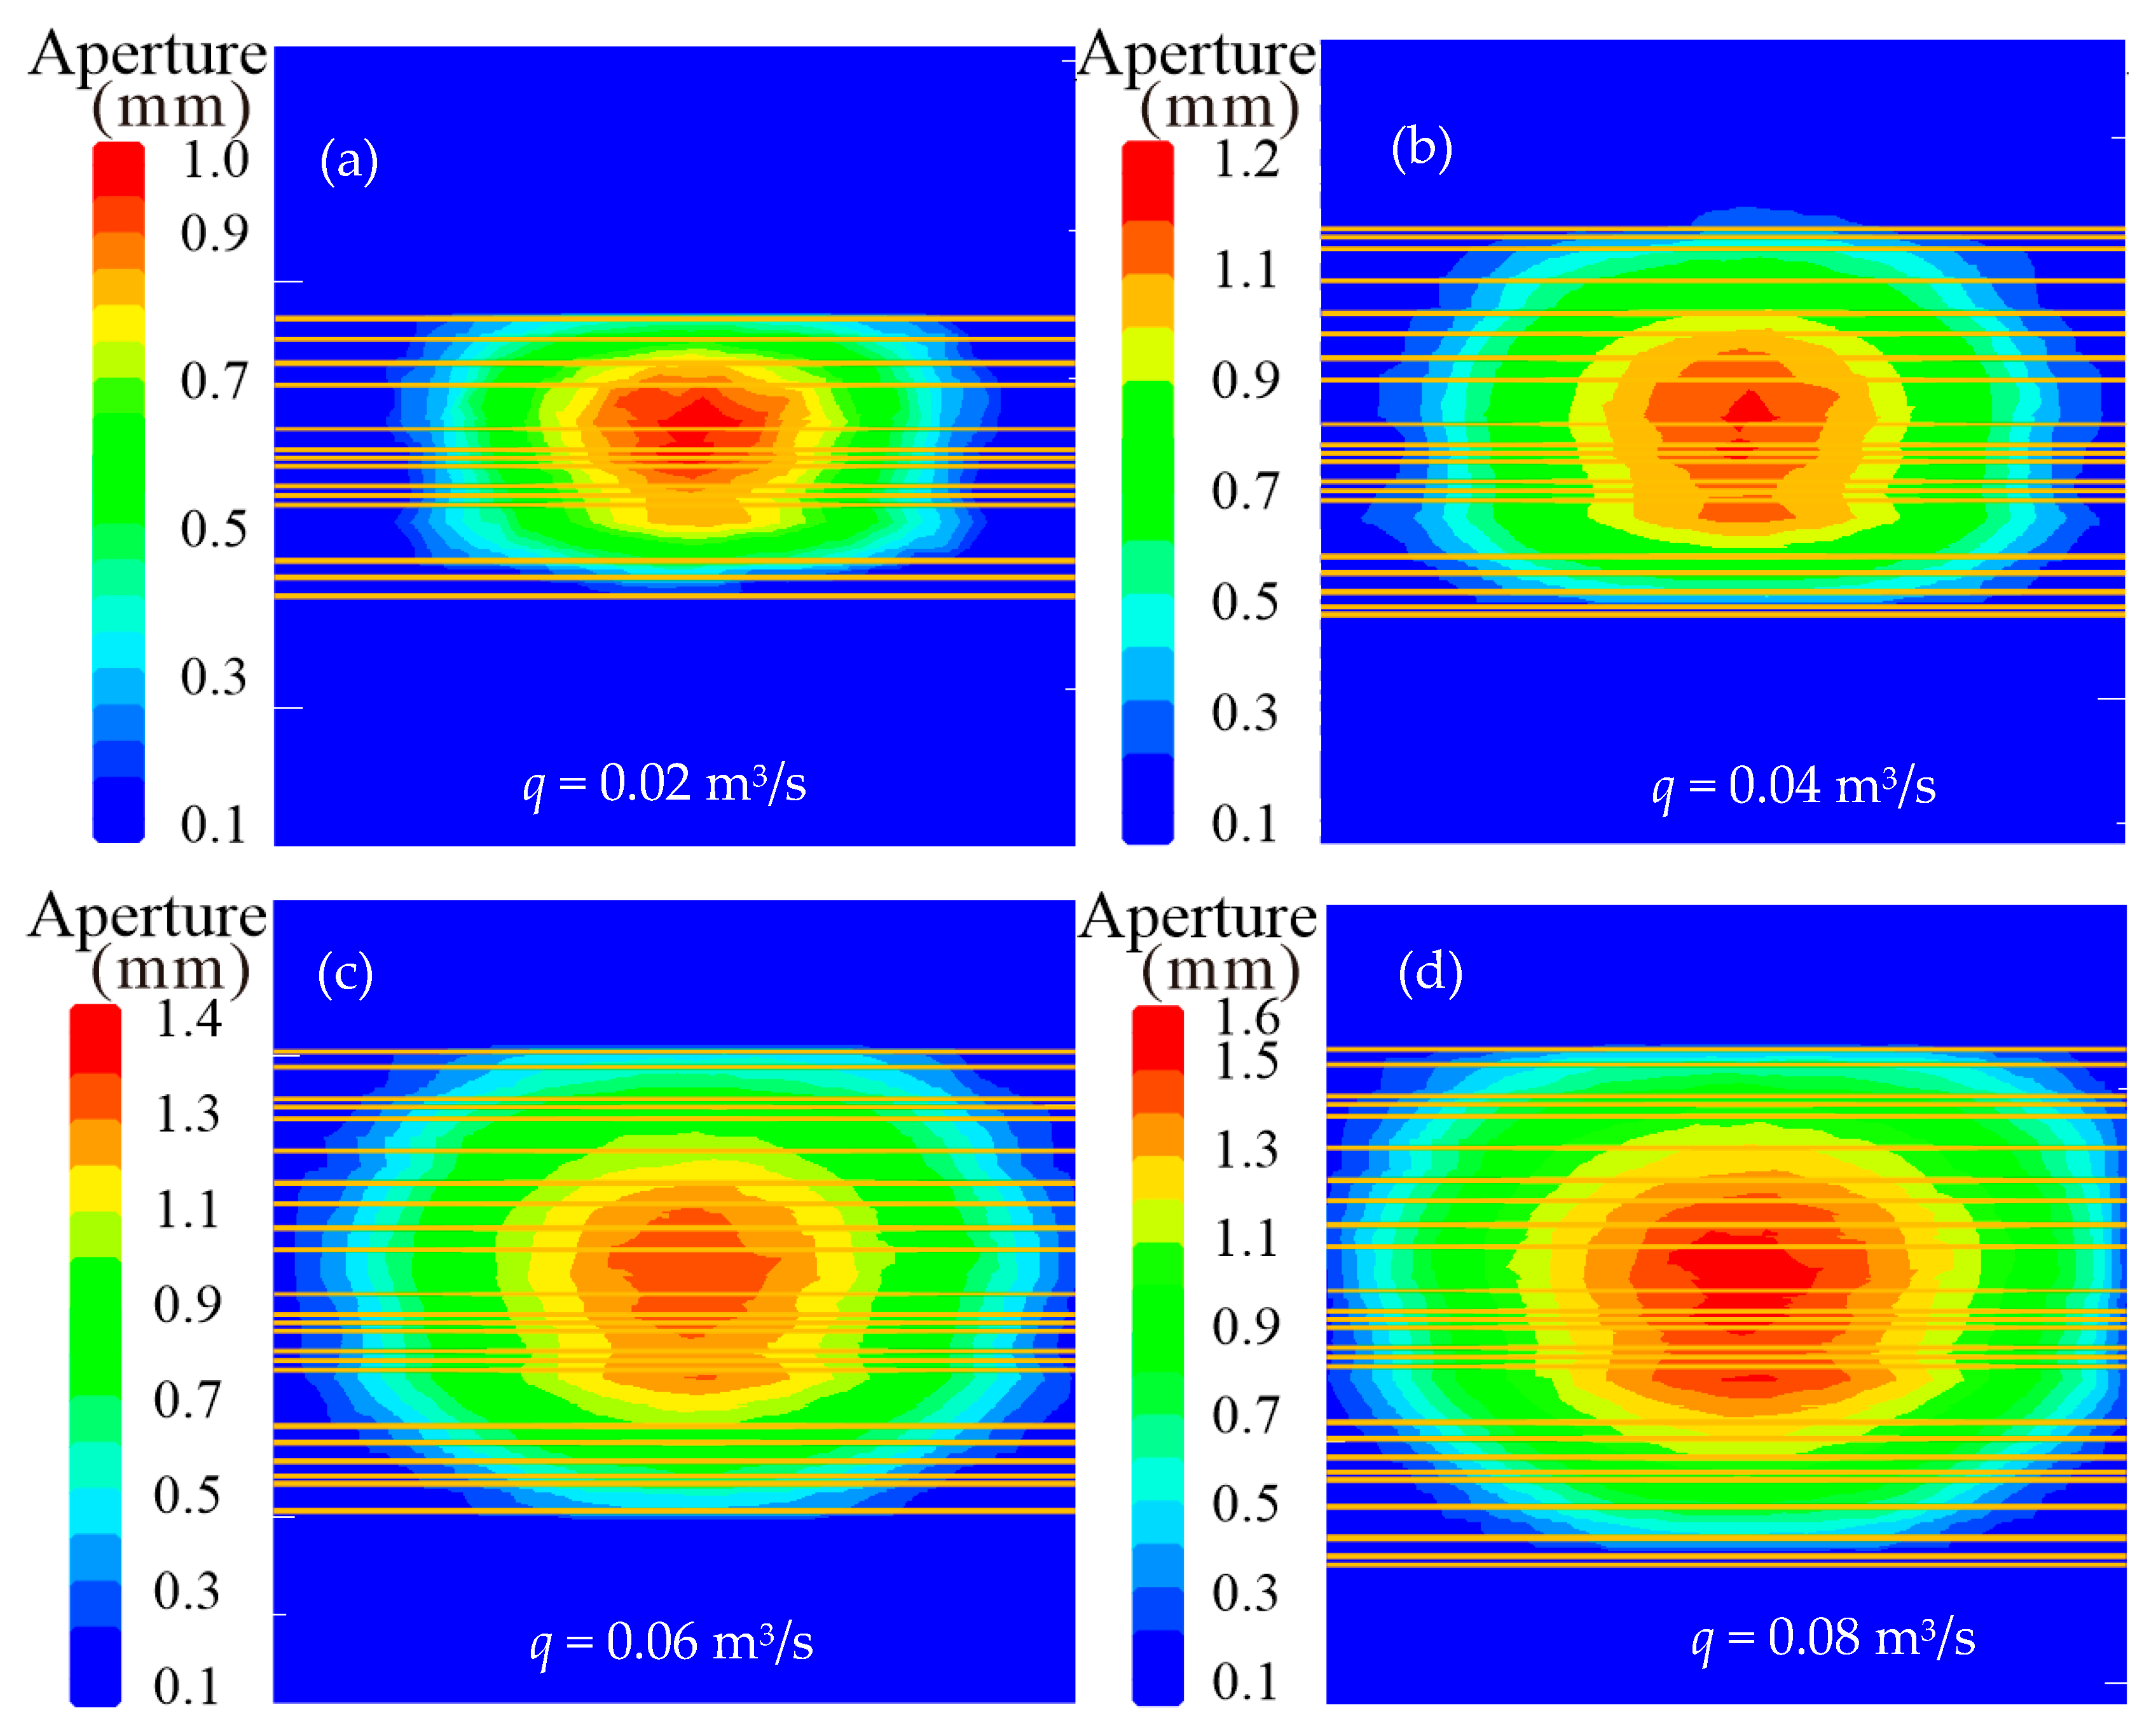
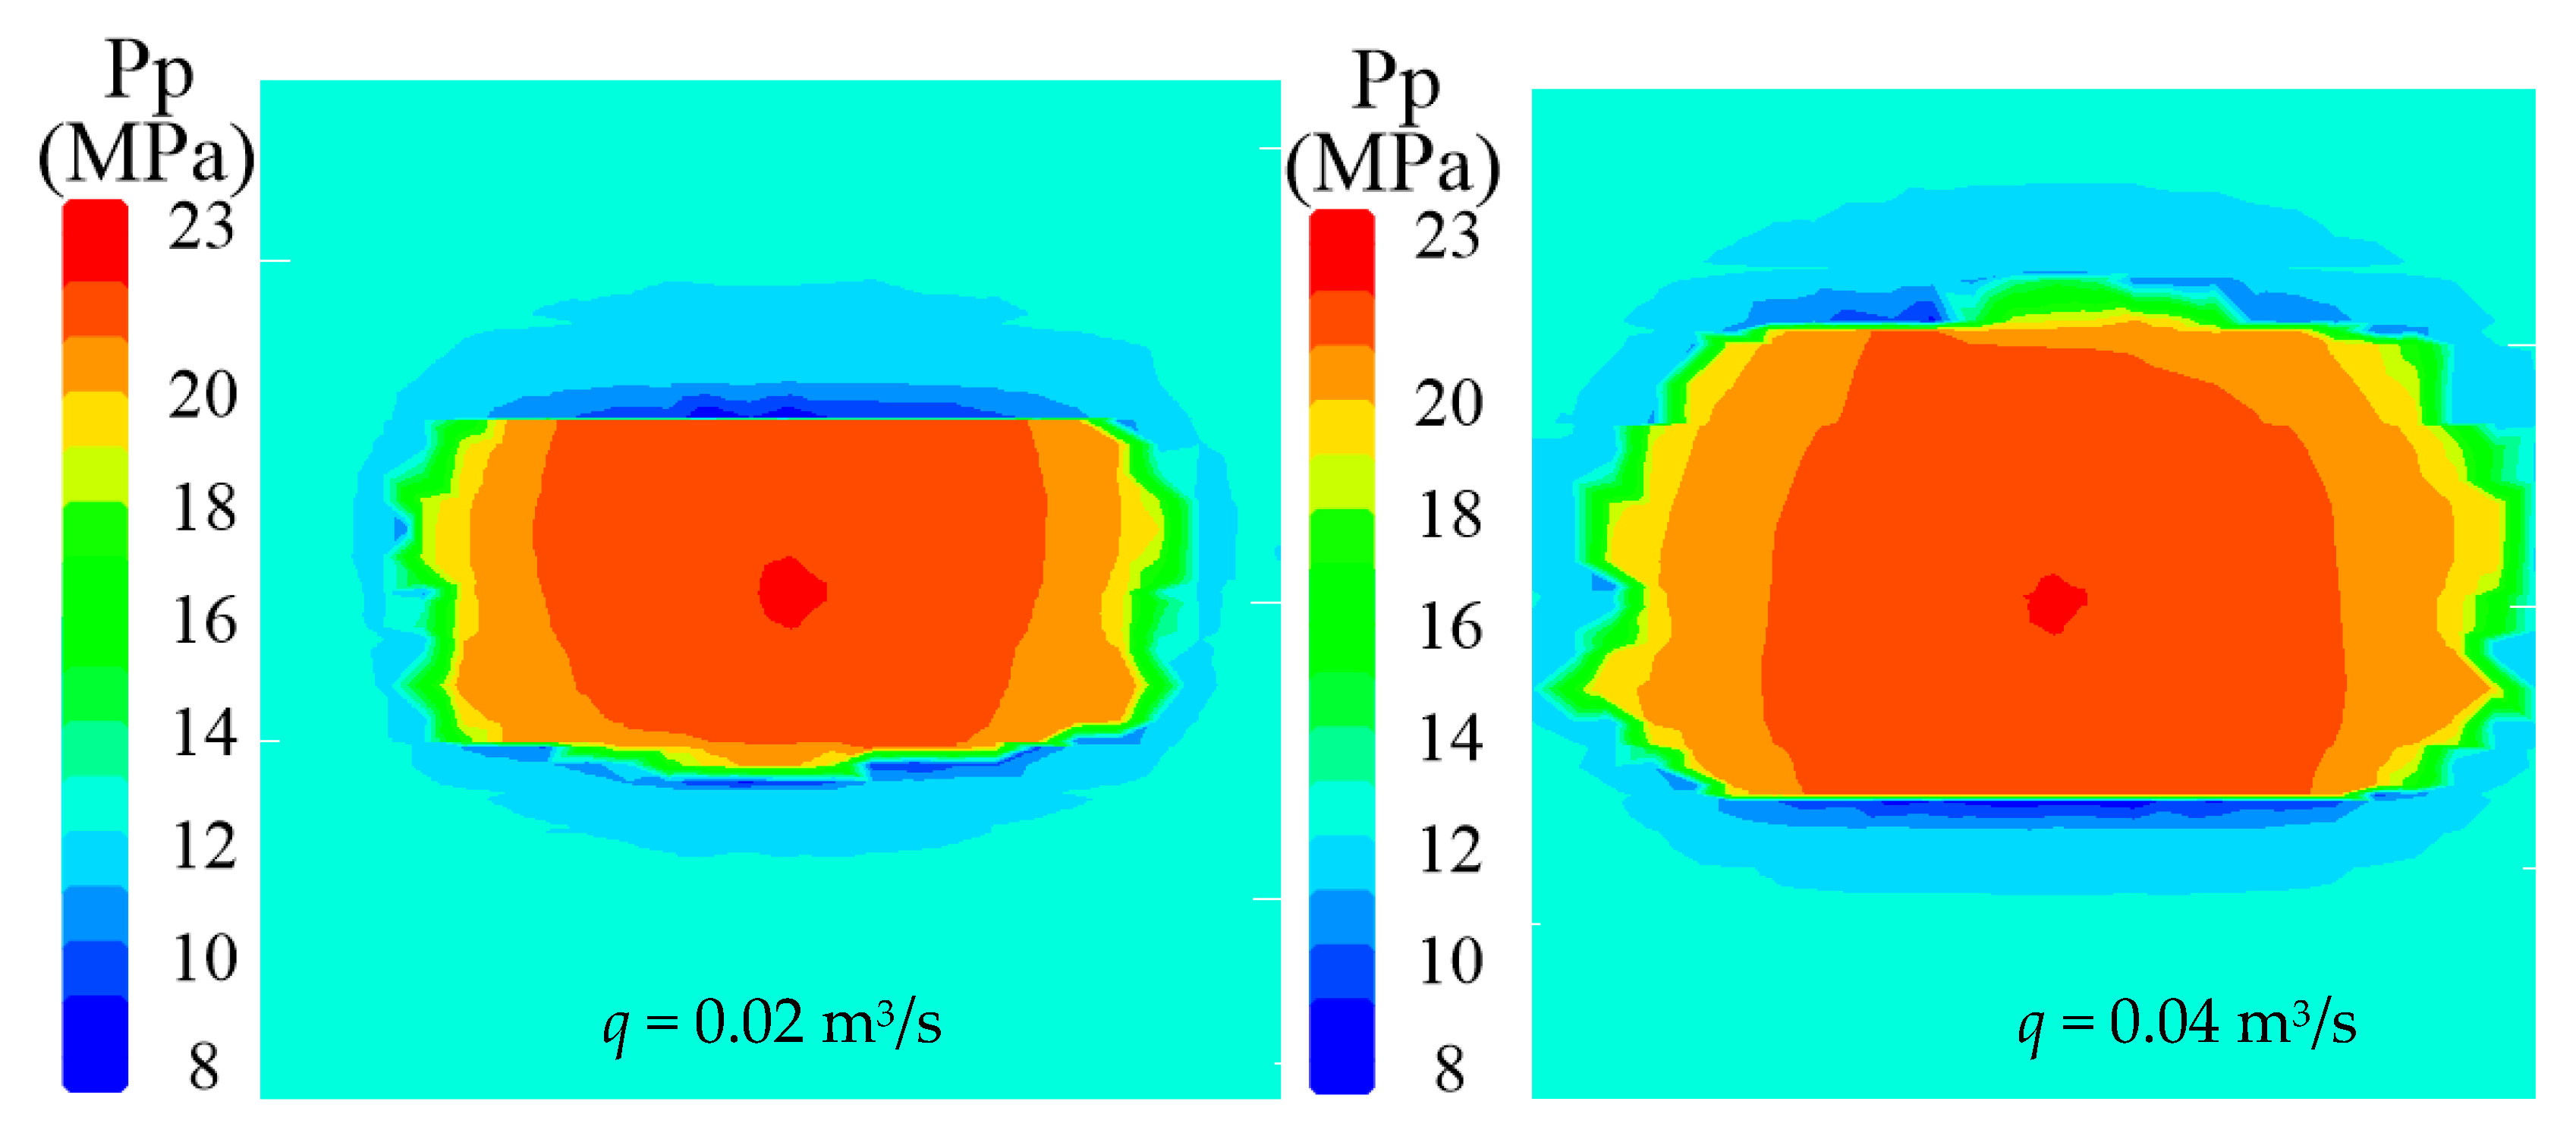
When q = 0.02 m3/s, fracture height growth is strongly restricted by the beddings, and the fracture shape is elliptical (Figure 12a). When q increases from 0.04 to 0.08 m3/s, the fracture height increases (Figure 12b–d) because the hydraulic fractures break through the beddings in the lower part of the model and expand downward. However, hydraulic fractures cannot penetrate the densely distributed beddings in the upper part of the model. Fluid pressure distributions in the model with different injection rates are shown in Figure 13.
The injection rate can improve the fracture height and the fracture area (Figure 14). Usually, fluid pressure has a positive relationship with the fluid injection rate. Fluid pressure can generate induced tensile stress at the tip of a hydraulic fracture, which can cause the failure of rock matrices and shearing of bedding interfaces. Therefore, hydraulic fractures can easily penetrate through bedding interfaces under the condition of a high injection rate. In summary, the injection rate significantly affects fracture complexity, and a higher injection rate can yield a complex hydraulic fracture network.

5.2.4. Effect of Bedding Aperture on Fracture Complexity

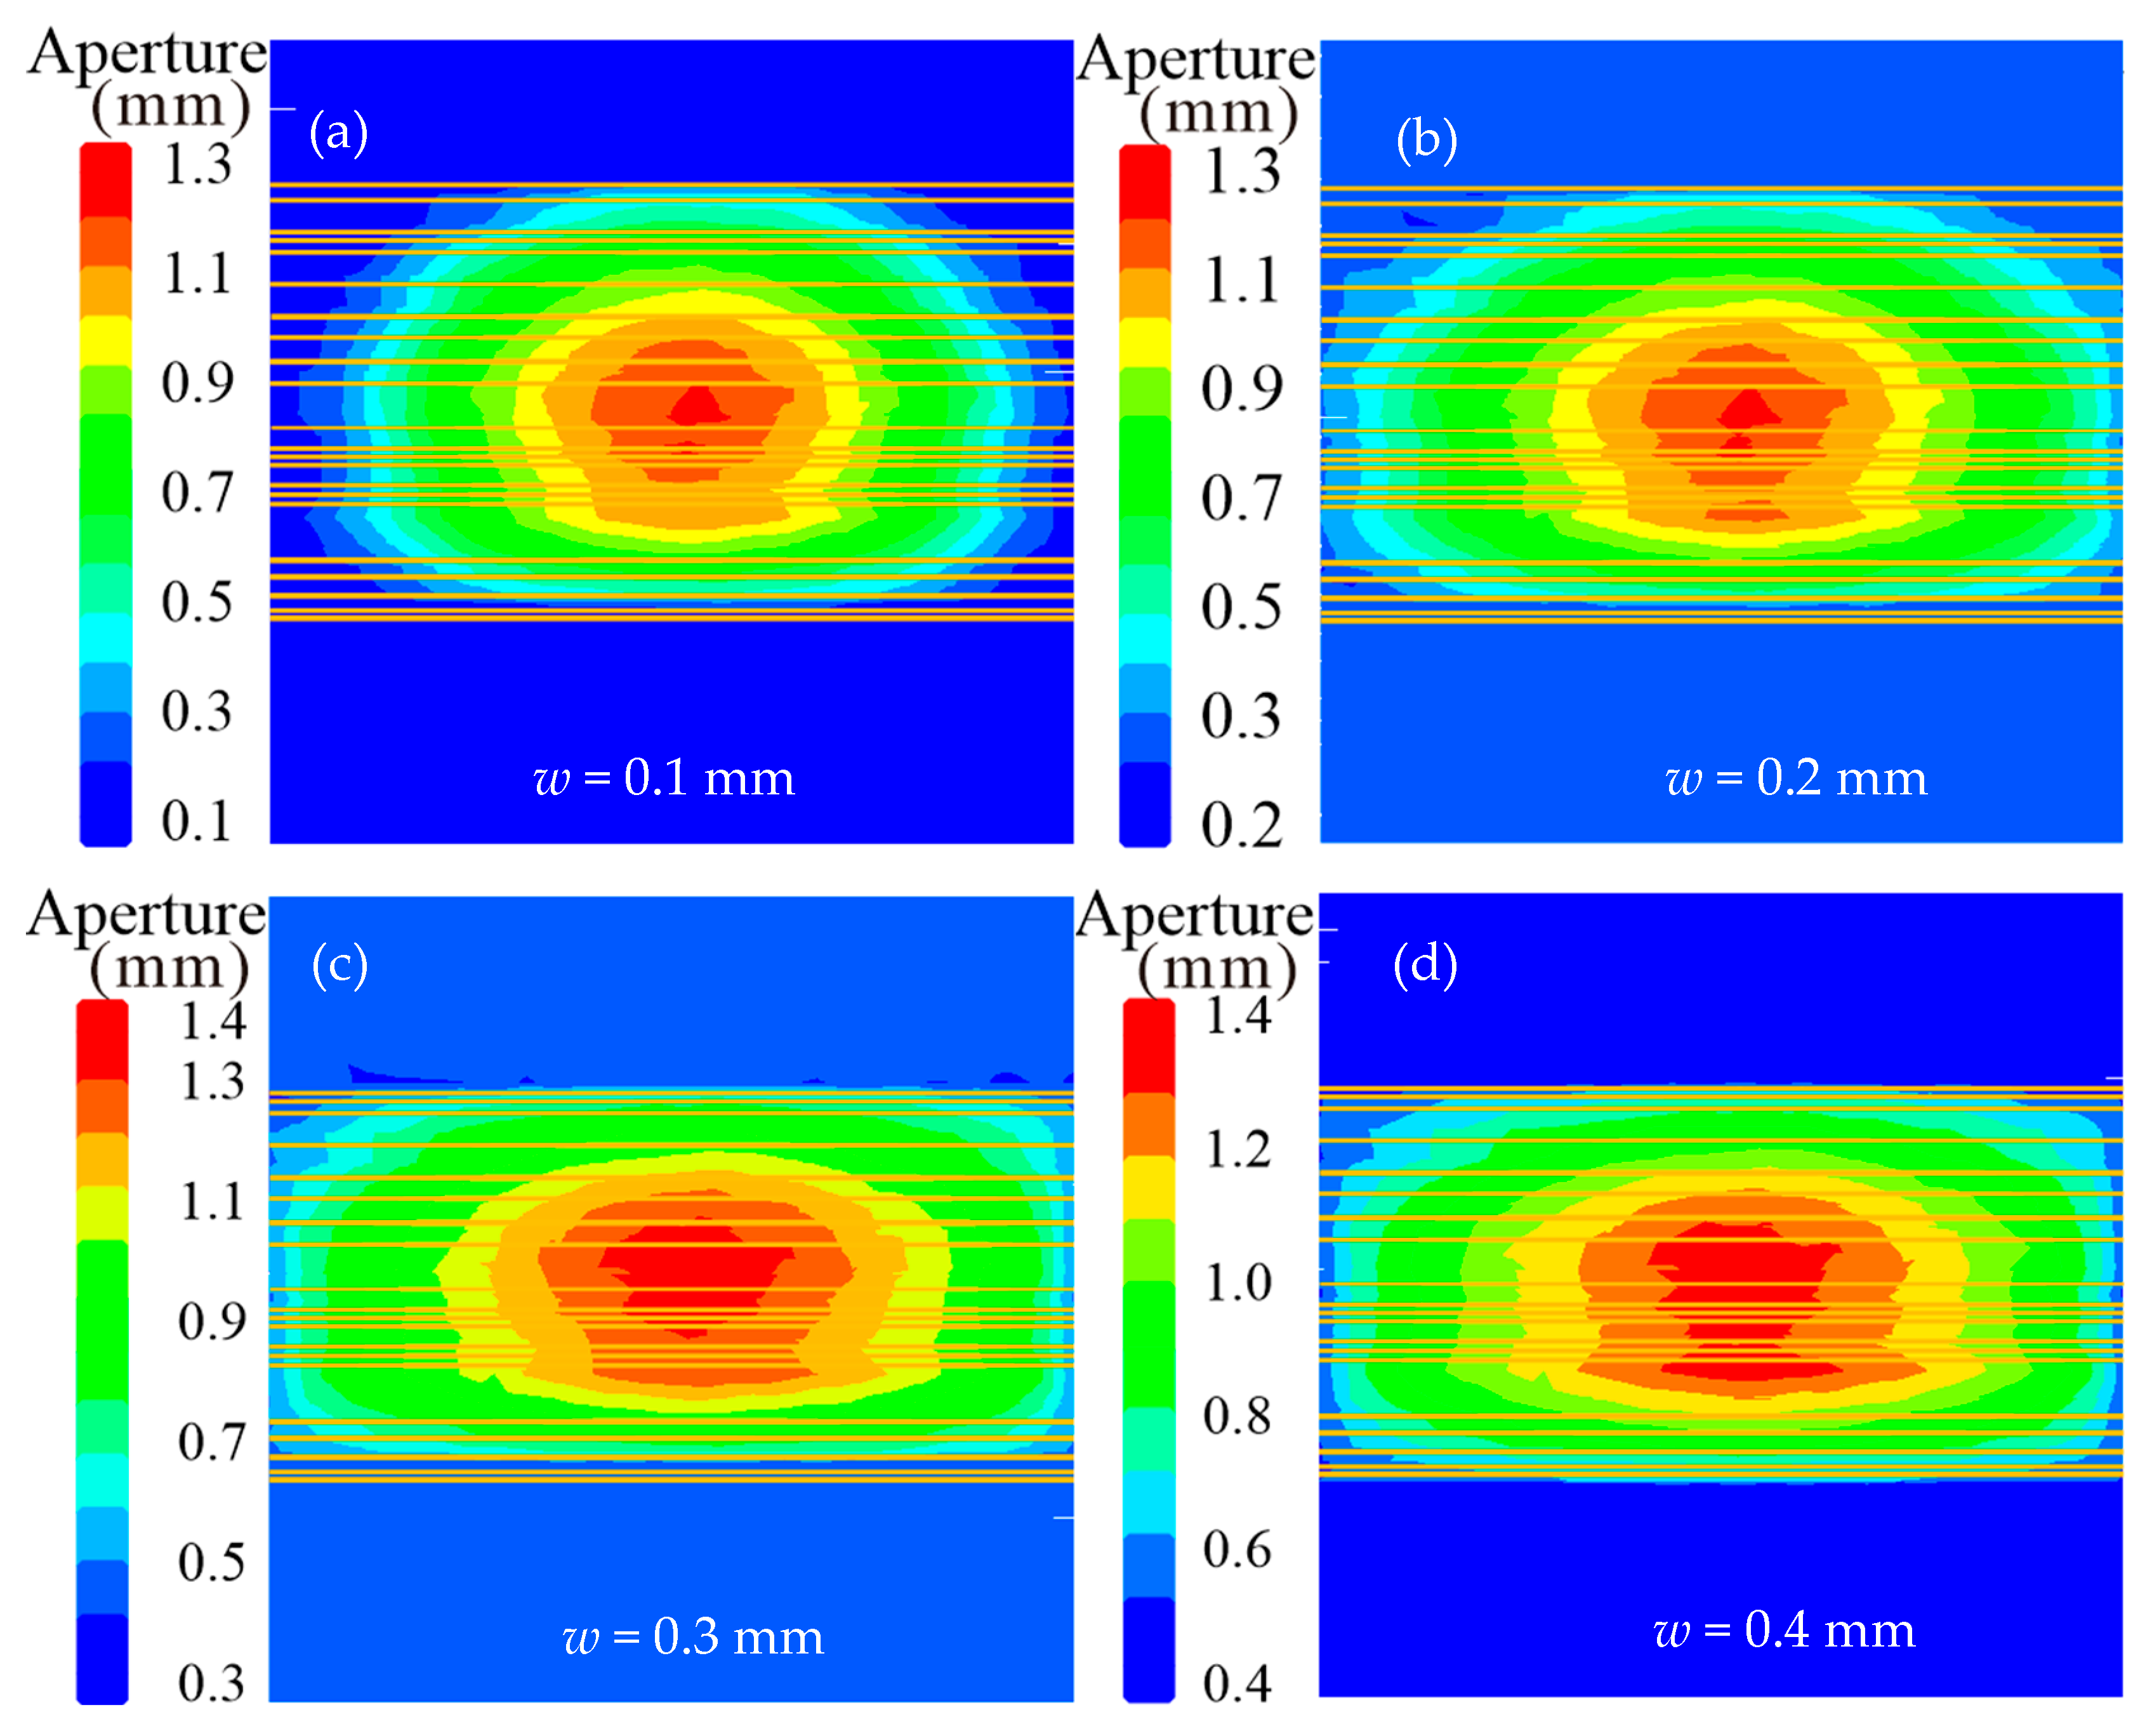
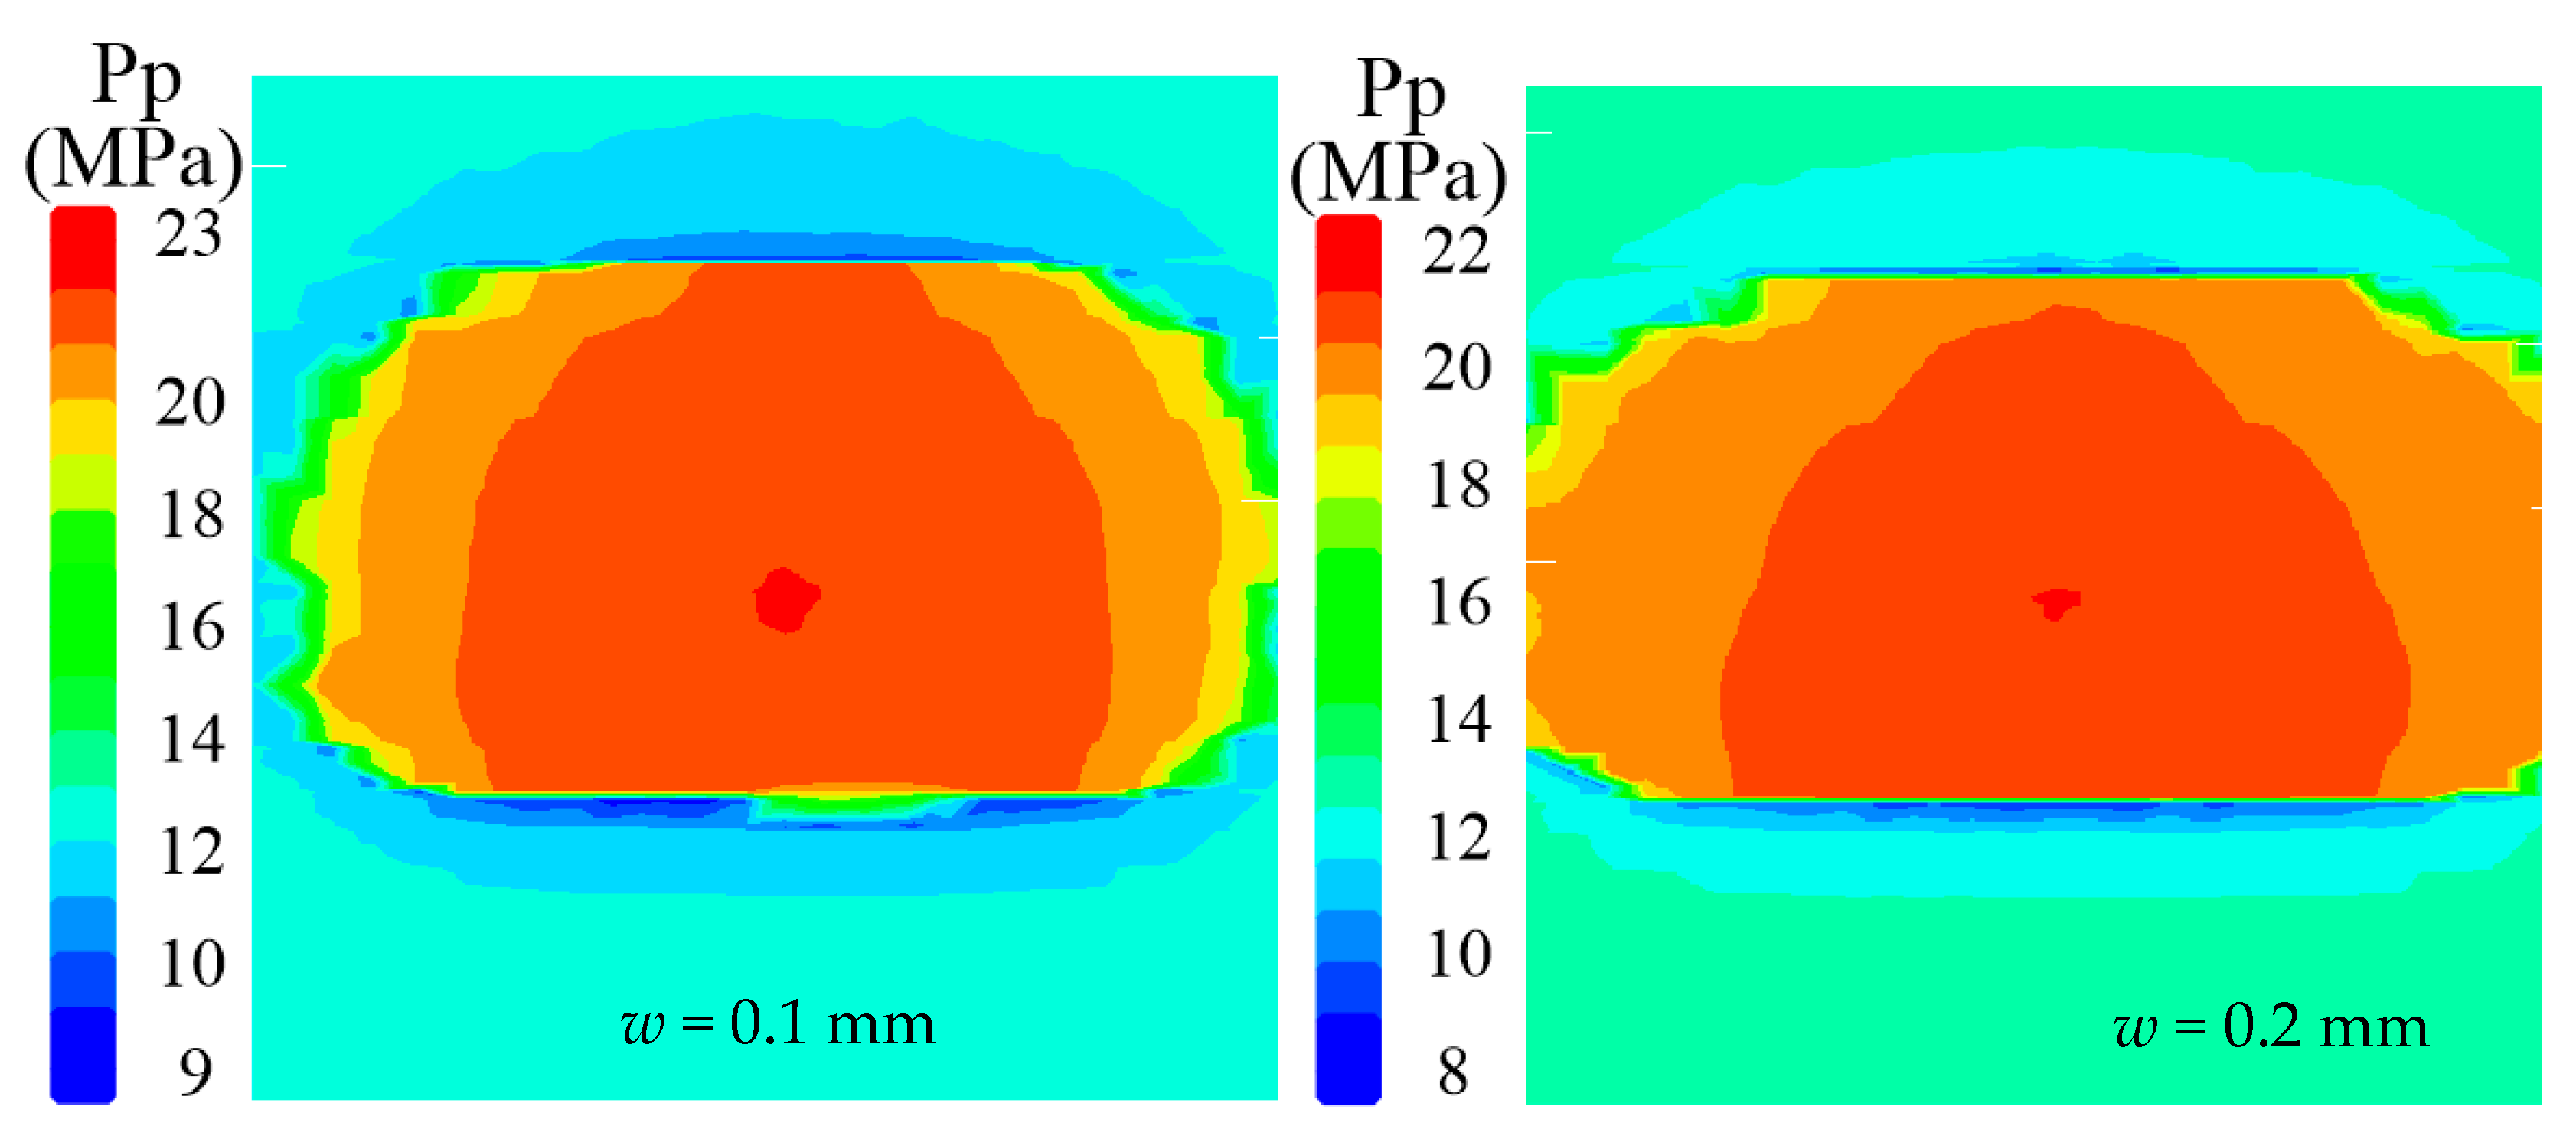
Fluid flow in shale reservoirs is closely related to bedding aperture. Four kinds of bedding aperture, including w = 0.1 mm, 0.2 mm, 0.3 mm and 0.4 mm, are applied to the model. The vertical/horizontal stress is 30/20 MPa, the fluid viscosity is 0.001 Pa·s, and the injection rate is 0.05 m3/s.
The simulation results are shown in Figure 15 and Figure 16. Affected by the beddings, the vertical expansion of hydraulic fractures is constrained, and they mainly propagate along the bedding planes in the horizontal direction, resulting in an ellipse-shaped fracture geometry (Figure 15a). As the bedding aperture increases, the fracture height decreases but the fracture width increases (Figure 15b–d), resulting in a slight increase in the fracture area (Figure 17).

6. Conclusions

In this work, an outcrop-data-based bedding model of a continental shale formation in the Ordos Basin, China, is built. The discrete element method is used to carry out a series of numerical simulations of hydraulic fracture propagation to investigate the influence of geological factors and engineering factors on hydraulic fracture complexity. The main conclusions are as follows:
(1) Beddings have significant inhibitory effects on fracture height growth. It is difficult for hydraulic fractures to penetrate zones with more densely distributed beddings. When a hydraulic fracture encounters a bedding with a larger aperture, it is more likely to be captured and expand along the weak interface.
(2) High vertical stress difference is favorable for the penetration of hydraulic fractures through bedding interfaces. When the vertical stress difference is Δσ = 0 MPa and Δσ = 10 MPa, the vertical growth of hydraulic fractures is strongly restricted by bedding interfaces. When Δσ = 20 MPa and Δσ = 30 MPa, hydraulic fractures propagate through the beddings in both upward and downward directions driven by the vertical stress. Thus, increasing vertical stress difference can improve fracture complexity.
(3) The properties of the injected fluid significantly affect the fracture propagation process. When the injection rate increases from 0.02 m3/s to 0.08 m3/s, the fracture height increases, suggesting that a higher injection rate can produce a more complex hydraulic fracture geometry. The fracture height and fracture area both decrease when the fluid viscosity increases from 0.001 Pa·s to 1 Pa·s. Therefore, high fluid viscosity is unfavorable for hydraulic fracture propagation.

Author Contributions

Conceptualization, L.H.; methodology, Y.L.; software, W.H.; validation, Y.L. and W.H.; formal analysis, L.H.; investigation, Y.L. and S.W.; resources, Y.L.; writing—original draft preparation, L.H.; writing—review and editing, L.H., Y.L., S.W., W.W., F.Z. and Y.W.; supervision, Y.L.; funding acquisition, Y.L. All authors have read and agreed to the published version of the manuscript.

Funding

This research received no external funding.

Data Availability Statement

Not applicable.

Conflicts of Interest

The authors declare no conflict of interest.

References

  1. Teufel, L.W.; Clark, J.A. Hydraulic fracture propagation in layered rock: Experimental studies of fracture containment. SPE J. 1984, 24, 19–32. [Google Scholar] [CrossRef] [Green Version]
  2. Catalli, F.; Meier, M.A.; Wiemer, S. The role of Coulomb stress changes for injection-induced seismicity: The Basel enhanced geothermal system. Geophys. Res. Lett. 2013, 40, 72–77. [Google Scholar] [CrossRef]
  3. Wang, J.; Xie, H.; Li, C. Anisotropic failure behavior and breakdown pressure interpretation of hydraulic fracturing experiments on shale. Int. J. Rock Mech. Min. Sci. 2021, 142, 104748. [Google Scholar] [CrossRef]
  4. Hu, G. Influences of anisotropic mechanical properties in the hydraulic fracturing design in shale reservoirs. Drill. Eng. 2022, 49, 97–103. [Google Scholar]
  5. Silveira, B.T.; Roehl, D.; Sanchez, E.C.M. Forecasting of the interaction between hydraulic and natural fractures using an artificial neural network. J. Petrol. Sci. Eng. 2022, 208, 109446. [Google Scholar] [CrossRef]
  6. Fu, H.; Cai, B.; Geng, M.; Jia, A.; Weng, D.; Liang, T.; Zhang, F.; Wen, X.; Xiu, N. Three dimensional simulation of hydraulic fracture propagation based on vertical reservoir heterogeneity. Nat. Gas Ind. 2022, 42, 56–68. [Google Scholar]
  7. Zheng, Y.; He, R.; Huang, L.; Bai, Y.; Wang, C.; Chen, W.; Wang, W. Exploring the effect of engineering parameters on the penetration of hydraulic fractures through bedding planes in different propagation regimes. Comput. Geotech. 2022, 146, 104736. [Google Scholar] [CrossRef]
  8. Renshaw, C.E.; Pollard, D.D. An experimentally verified criterion for propagation across unbounded frictional interfaces in brittle, linear elastic materials. Int. J. Rock Mech. Min. Sci. 1995, 32, 237–249. [Google Scholar] [CrossRef]
  9. Loon, V.L. Preferred orientations and anisotropy in shales: Callovo-Oxfordian shale (France) and Opalinus Clay (Switzerland). Clays Clay Miner. 2008, 56, 285–306. [Google Scholar]
  10. Lisjak, A.; Grasselli, G.; Vietor, T. Continuum–discontinuum analysis of failure mechanisms around unsupported circular excavations in anisotropic clay shales. Int. J. Rock Mech. Min. Sci. 2014, 65, 96–115. [Google Scholar] [CrossRef]
  11. Heng, S.; Li, X.; Liu, X.; Chen, Y. Experimental study on the mechanical properties of bedding planes in shale. J. Nat. Gas Sci. Eng. 2020, 76, 103161. [Google Scholar] [CrossRef]
  12. Dou, F.; Wang, J.G. A numerical investigation for the impacts of shale matrix heterogeneity on hydraulic fracturing with a two-dimensional particle assemblage simulation model. J. Nat. Gas Sci. Eng. 2022, 104, 104678. [Google Scholar] [CrossRef]
  13. Zhang, X.; Jeffrey, R.G.; Thiercelin, M. Mechanics of fluid-driven fracture growth in naturally fractured reservoirs with simple network geometries. J. Geophys. Res. 2009, 114, B12406. [Google Scholar] [CrossRef]
  14. Li, Y.; Zhang, Z.; Wei, S.; Yang, P.; Shang, Y. Opportunities in Measuring Multiscale Pore Structure of the Continental Shale of the Yanchang Formation, Ordos Basin, China. Energies 2021, 14, 5282. [Google Scholar] [CrossRef]
  15. Zhao, Y.; Zhang, Y.; Wang, C.; Liu, Q. Hydraulic fracturing characteristics and evaluation of fracturing effectiveness under different anisotropic angles and injection rates: An experimental investigation in absence of confining pressure. J. Nat. Gas Sci. Eng. 2022, 97, 104343. [Google Scholar] [CrossRef]
  16. Warpinski, N.R.; Clark, J.A.; Schmidt, R.A.; Huddle, C.W. Laboratory investigation on the effect of in-situ stresses on hydraulic fracture containment. SPE J. 1982, 22, 333–340. [Google Scholar] [CrossRef] [Green Version]
  17. Olson, J.E.; Bahorich, B.; Holder, J. Examining hydraulic fracture: Natural fracture interaction in hydrostone block experiments. In Proceedings of the SPE Hydraulic Fracturing Technology Conference, The Woodlands, TX, USA, 6–8 February 2012; p. 152618. [Google Scholar]
  18. Liu, Z.Y.; Jin, Y.; Chen, M.; Hou, B. Analysis of Non-Planar Multi-Fracture Propagation from Layered-Formation Inclined-Well Hydraulic Fracturing. Rock Mech. Rock Eng. 2016, 49, 1747–1758. [Google Scholar] [CrossRef]
  19. Huang, B.X.; Liu, J.W. Experimental investigation of the effect of bedding planes on hydraulic fracturing under true triaxial stress. Rock Mech. Rock Eng. 2017, 50, 2627–2643. [Google Scholar] [CrossRef]
  20. Ranjith, P.G.; Wanniarachchi, W.A.M.; Perera, M.S.A.; Rathnaweera, T.D. Investigation of the effect of foam flow rate on foam-based hydraulic fracturing of shale reservoir rocks with natural fractures: An experimental study. J. Petrol. Sci. Eng. 2018, 169, 518–531. [Google Scholar] [CrossRef]
  21. Tan, P.; Jin, Y.; Han, K.; Hou, B.; Chen, M.; Guo, X.; Gao, J. Analysis of hydraulic fracture initiation and vertical propagation behavior in laminated shale formation. Fuel 2017, 206, 482–493. [Google Scholar] [CrossRef]
  22. Tan, P.; Jin, Y.; Yuan, L.; Xiong, Z.Y.; Hou, B.; Chen, M.; Wan, L.M. Understanding hydraulic fracture propagation behavior in tight sandstone–coal interbedded formations: An experimental investigation. Petrol. Sci. 2019, 16, 148–160. [Google Scholar] [CrossRef] [Green Version]
  23. Tan, P.; Pang, H.W.; Zhang, R.X.; Jin, Y.; Zhou, Y.; Kao, J.; Fan, M. Experimental investigation into hydraulic fracture geometry and proppant migration characteristics for southeastern Sichuan deep shale reservoirs. J. Petrol. Sci. Eng. 2020, 184, 106517. [Google Scholar] [CrossRef]
  24. Wan, L.; Hou, B.; Meng, H.; Chang, Z.; Muhadasi, Y.; Chen, M. Experimental investigation of fracture initiation position and fluid viscosity effect in multi-layered coal strata. J. Petrol. Sci. Eng. 2019, 182, 106310. [Google Scholar] [CrossRef]
  25. Wan, L.; Hou, B.; Tan, P.; Chang, Z.; Muhadasi, Y. Observing the effects of transition zone properties on fracture vertical propagation behavior for coal measure strata. J. Struct. Geol. 2019, 126, 69–82. [Google Scholar] [CrossRef]
  26. Zhang, J.; Li, Y.; Pan, Y.; Wang, X.; Yan, M.; Shi, X.; Zhou, X.; Li, H. Experiments and analysis on the influence of multiple closed cemented natural fractures on hydraulic fracture propagation in a tight sandstone reservoir. Eng. Geol. 2021, 281, 105981. [Google Scholar] [CrossRef]
  27. Jamaloei, B.Y. A critical review of common models in hydraulic-fracturing simulation: A practical guide for practitioners. Theor. Appl. Fract. Mech. 2021, 113, 102937. [Google Scholar] [CrossRef]
  28. Fu, S.H.; Hou, B.; Xia, Y.; Chen, M.; Wang, S.; Tan, P. The study of hydraulic fracture height growth in coal measure shale strata with complex geologic characteristics. J. Petrol. Sci. Eng. 2022, 211, 110164. [Google Scholar] [CrossRef]
  29. Gu, H.; Siebrits, E.; Sabourov, A. Hydraulic fracture modeling with bedding plane interfacial slip. In Proceedings of the SPE Eastern Regional/AAPG Eastern Section Joint Meeting, Pittsburgh, PA, USA, 11–15 October 2008; p. 117445. [Google Scholar]
  30. Zhang, X.; Wu, B.; Jeffrey, R.G.; Connell, L.D.; Zhang, G. A pseudo-3D model for hydraulic fracture growth in a layered rock. Int. J. Solids Struct. 2017, 115, 208–223. [Google Scholar] [CrossRef]
  31. Tang, J.; Wu, K. A 3-D model for simulation of weak interface slippage for fracture height containment in shale reservoirs. Int. J. Solids Struct. 2018, 144, 248–264. [Google Scholar] [CrossRef]
  32. Tang, J.; Wu, K.; Li, Y.; Hu, Q.; Ehlig-Economides, C. Numerical investigation of the interactions between hydraulic fracture and bedding planes with non-orthogonal approach angle. Eng. Fract. Mech. 2018, 200, 1–16. [Google Scholar] [CrossRef]
  33. Tang, J.; Wu, K.; Zuo, L.; Xiao, L.; Sun, S.; Ehlig-Economides, C. Investigation of rupture and slip mechanisms of hydraulic fractures in multiple-layered formations. SPE J. 2019, 24, 2292–2307. [Google Scholar] [CrossRef]
  34. Xie, J.; Tang, J.; Yong, R.; Fan, Y.; Zuo, L.; Chen, X.; Li, Y. A 3-D hydraulic fracture propagation model applied for shale gas reservoirs with multiple bedding planes. Eng. Fract. Mech. 2020, 228, 106872. [Google Scholar] [CrossRef]
  35. Dahi-Taleghani, A.; Olson, J.E. Numerical modeling of multi-stranded hydraulic fracture propagation: Accounting for the interaction between induced and natural fractures. SPE J. 2011, 16, 575–581. [Google Scholar] [CrossRef]
  36. Klimenko, D.; Dahi-Taleghani, A. A modified extended finite element method for fluid-driven fractures incorporating variable primary energy loss mechanisms. Int. J. Rock Mech. Min. Sci. 2018, 106, 329–341. [Google Scholar] [CrossRef]
  37. Settgast, R.R.; Fu, P.; Walsh, S.D.C.; White, J.A.; Annavarapu, C.; Ryerson, F.J. A fully coupled method for massively parallel simulation of hydraulically driven fractures in 3-dimensions. Int. J. Numer. Anal. Met. 2017, 41, 627–653. [Google Scholar] [CrossRef]
  38. Tan, P.; Jin, Y.; Pang, H.W. Hydraulic fracture vertical propagation behavior in transversely isotropic layered shale formation with transition zone using XFEM-based CZM method. Eng. Fract. Mech. 2021, 248, 107707. [Google Scholar] [CrossRef]
  39. Potyondy, D.O.; Cundall, P.A. A bonded-particle model for rock. Int. J. Rock Mech. Min. Sci. 2004, 41, 1329–1364. [Google Scholar] [CrossRef]
  40. Damjanac, B.; Cundall, P. Application of distinct element methods to simulation of hydraulic fracturing in naturally fractured reservoirs. Comput. Geotech. 2016, 71, 283–294. [Google Scholar] [CrossRef]
  41. Zhou, J.; Zhang, L.; Pan, Z.; Han, Z. Numerical studies of interactions between hydraulic and natural fractures by Smooth Joint Model. J. Nat. Gas Sci. Eng. 2017, 46, 592–602. [Google Scholar] [CrossRef]
  42. Zhang, L.; Zhou, J.; Braun, A.; Han, Z. Sensitivity analysis on the interaction between hydraulic and natural fractures based on an explicitly coupled hydro-geomechanical model in PFC2D. J. Petrol. Sci. Eng. 2018, 167, 638–653. [Google Scholar] [CrossRef]
  43. Yao, W.; Mostafa, S.; Yang, Z.; Xu, G. Role of natural fractures characteristics on the performance of hydraulic fracturing for deep energy extraction using discrete fracture network (DFN). Eng. Frac. Mech. 2020, 230, 106962. [Google Scholar] [CrossRef]
  44. Li, M.; Wu, J.; Li, J.; Zhuang, L.; Wang, S.; Zhang, F. Modeling of hydraulic fracturing in polymineralic rock with a grain-based DEM coupled with a pore network model. Eng. Frac. Mech. 2022, 275, 108801. [Google Scholar] [CrossRef]
  45. Li, L.; Huang, B.; Tan, Y.; Deng, X.; Li, Y.Y.; Zheng, H. Geometric Heterogeneity of Continental Shale in the Yanchang Formation, Southern Ordos Basin, China. Sci. Rep. 2017, 7, 6006. [Google Scholar] [CrossRef] [PubMed]
  46. Li, L.; Huang, B.; Li, Y.; Hu, R.; Li, X. Multi-scale modeling of shale laminas and fracture networks in the Yanchang formation, Southern Ordos Basin, China. Eng. Geol. 2018, 243, 231–240. [Google Scholar] [CrossRef]
  47. Guo, X.; Zhang, J.; Sun, X.; Ma, Z.; Mu, J.; Zhang, M.; Liu, J. Effect of fiber on fracturing of high conductivity fractures. Drill. Eng. 2021, 48, 13–20. [Google Scholar]
  48. Lai, J.; Wang, G.; Ran, Y.; Zhou, Z.; Cui, Y. Impact of diagenesison the reservoir quality of tight oil sandstones: The case of upper Triassic Yanchang Formation Chang 7 oil layers in Ordos Basin, China. J. Petrol. Sci. Eng. 2016, 145, 54–65. [Google Scholar] [CrossRef]
  49. Zhao, J.; Liu, C.; Zhang, D.; Guo, Y.; Qi, Y.; Lv, Q.; Zhang, L.; Ma, H. Description and its hydrocarbon geological implications of outcrop sections of Triassic Chang-7 Member in southern Ordos Basin. Pet. Reserv. Eval. Dev. 2022, 12, 233–245. [Google Scholar]
  50. Nasehi, M.J.; Mortazavi, A. Effects of in-situ stress regime and intact rock strength parameters on the hydraulic fracturing. J. Pet. Sci. Eng. 2013, 108, 211–221. [Google Scholar] [CrossRef]
  51. Zheng, Y.; Liu, J.; Lei, Y. The propagation behavior of hydraulic fracture in rock mass with cemented joints. Geofluids 2019, 2019, 5406870. [Google Scholar] [CrossRef]
  52. Chen, Z.; Yang, Z.; Wang, M. Hydro-mechanical coupled mechanisms of hydraulic fracture propagation in rocks with cemented natural fractures. Comput. Geotech. 2018, 163, 421–434. [Google Scholar] [CrossRef]
  53. Witherspoon, P.A.; Wang, J.S.Y.; Iwai, K.; Gale, J.E. Validity of cubic law for fluid flow in a deformable rock fracture. Water Resour. Res. 1980, 16, 1016–1024. [Google Scholar] [CrossRef] [Green Version]
  54. Dippenaar, M.A.; Louis Van Rooy, J. On the cubic law and variably saturated flow through discrete open roughwalled discontinuities. Int. J. Rock Mech. Min. Sci. 2016, 89, 200–211. [Google Scholar] [CrossRef] [Green Version]
  55. Perkins, T.K.; Kern, L.R. Widths of hydraulic fractures. J. Pet. Technol. 1961, 13, 937–949. [Google Scholar] [CrossRef]
  56. Wang, X.Z.; Zhang, L.X.; Gao, C. The heterogeneity of shale gas reservoir in the Yanchang Formation, Xiasiwan area, Ordos Basin. Earth Sci. Front. 2016, 23, 134–145. [Google Scholar] [CrossRef]
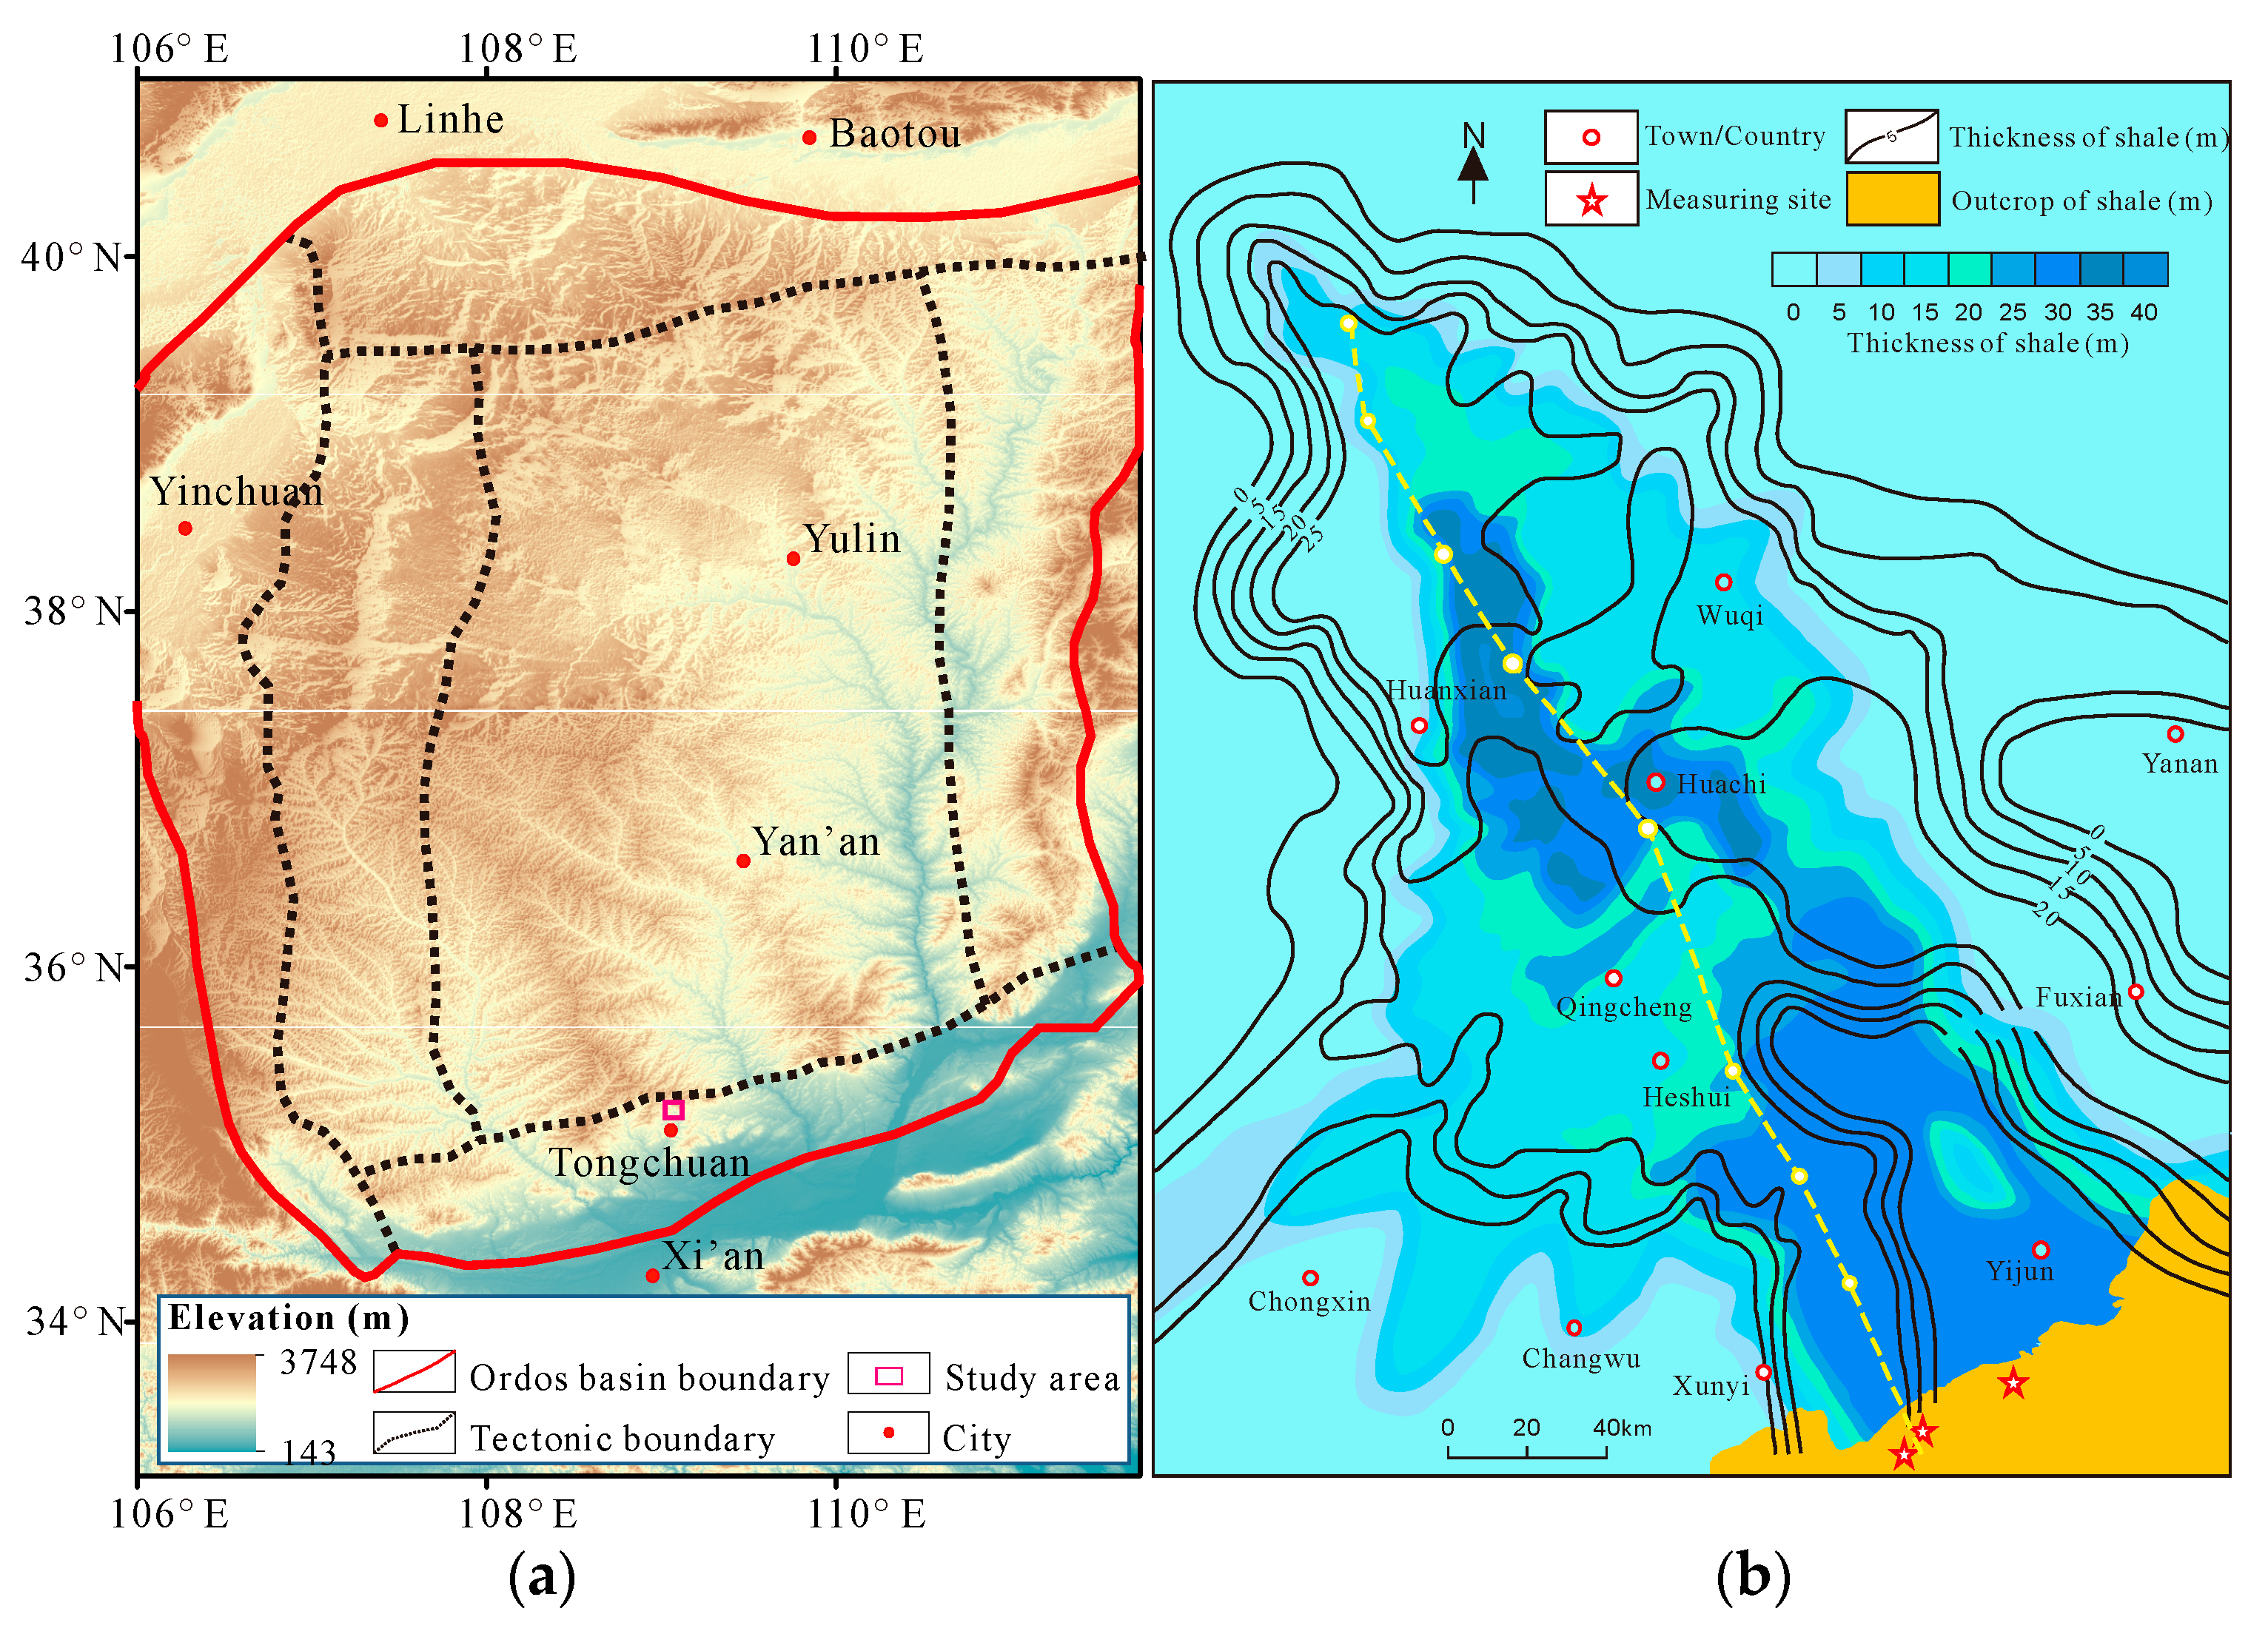
Figure 1. (a) Tectonic map of the Ordos Basin; (b) distribution of shale rocks of the Yanchang Formation [49].
Energies 15 08840 g001
Figure 2. Characteristics of beddings in the Chang 7-2 shale: (a) distribution of beddings at an outcrop; (b) downhole camera image from a well [45]; (c) spacing of beddings based on a total of 90 mapped layers; (d) distribution of spacing of beddings.
Energies 15 08840 g002
Figure 3. Three-dimensional bedding model of the Chang 7-2 shale reservoir.
Energies 15 08840 g003
Figure 4. (a) The validation model; (b) fracture aperture distributions calculated by the numerical and PKN solutions; (c) fracture comparison between the fracture apertures calculated by the numerical and PKN solutions.
Energies 15 08840 g004
Figure 5. Numerical model used for hydraulic fracturing simulations: (a) 3D bedding model with an edge length of 10 m; (b) x-z plane with y = 10 m cut from the bedding model.
Energies 15 08840 g005
Figure 6. Fracture geometry and aperture distribution in different cases of stress configurations: (a) Δσ = 0 MPa; (b) Δσ = 10 MPa; (c) Δσ = 20 MPa; (d) Δσ = 30 MPa.
Energies 15 08840 g006
Figure 7. Fluid pressure distributions in different cases of stress configurations.
Energies 15 08840 g007aEnergies 15 08840 g007b
Figure 8. Variation in fracture height and fracture area versus vertical stress.
Energies 15 08840 g008
Figure 9. Fracture geometry and aperture distribution in different cases, with the fluid viscosity of (a) μ = 0.001 Pa·s, (b) μ = 0.01 Pa·s, (c) μ = 0.1 Pa·s, and (d) μ = 1 Pa·s.
Energies 15 08840 g009
Figure 10. Fluid pressure distributions in different cases, with the fluid viscosity of (a) μ = 0.001 Pa·s, (b) μ = 0.01 Pa·s, (c) μ = 0.1 Pa·s, and (d) μ = 1 Pa·s.
Energies 15 08840 g010aEnergies 15 08840 g010b
Figure 11. Variation in fracture height and fracture area versus fluid viscosity.
Energies 15 08840 g011
Figure 12. Fracture geometry and aperture distribution in different cases, with the injection rate of (a) q = 0.02 m3/s, (b) q = 0.04 m3/s, (c) μ = q = 0.06 m3/s, and (d) μ = q = 0.08 m3/s.
Energies 15 08840 g012
Figure 13. Fluid pressure distributions in different cases, with the injection rate varying from q = 0.02 m3/s to 0.04 m3/s, 0.06 m3/s and 0.08 m3/s.
Energies 15 08840 g013aEnergies 15 08840 g013b
Figure 14. Variation in fracture height and fracture area versus injection rate.
Energies 15 08840 g014
Figure 15. Fracture geometry and aperture distribution in different cases, with the bedding aperture of (a) w = 0.1 mm, (b) w = 0.2 mm, (c) w = 0.3 mm, and (d) w = 0.4 mm.
Energies 15 08840 g015
Figure 16. Fluid pressure distributions in different cases, with the bedding aperture varying from w = 0.1 mm to 0.2 mm, 0.3 mm and 0.4 mm.
Energies 15 08840 g016aEnergies 15 08840 g016b
Figure 17. Variation in fracture height and fracture area versus bedding aperture.
Energies 15 08840 g017
Table 1. Property settings in the simulations [11,56].
CategoryParametersValues
Rock matrixYoung’s modulus (GPa)10.3
Poisson’s ratio0.22
Density (g/cm3)2.44
Bedding planeNormal stiffness (GPa)50
Shear stiffness (GPa)50
Cohesion (MPa)8.9
Friction angle (°)34°
Tensile strength (MPa)4.7
Publisher’s Note: MDPI stays neutral with regard to jurisdictional claims in published maps and institutional affiliations.