Review

Green and Blue Hydrogen Production: An Overview in Colombia

by
Sebastián Mantilla
and
Diogo M. F. Santos
*
Laboratory for Physics of Materials and Emerging Technologies, Center of Physics and Engineering of Advanced Materials, Chemical Engineering Department, Instituto Superior Técnico, Universidade de Lisboa, 1049-001 Lisbon, Portugal
*
Author to whom correspondence should be addressed.
Energies 2022, 15(23), 8862; https://doi.org/10.3390/en15238862
Submission received: 25 October 2022 / Revised: 19 November 2022 / Accepted: 22 November 2022 / Published: 24 November 2022
(This article belongs to the Special Issue Advances in Hydrogen Production and Hydrogen Separation II)

Abstract

:
Colombia, a privileged country in terms of diversity, availability of natural resources, and geographical location, has set a roadmap for hydrogen as part of the energy transition plan proposed in 2021. To reduce its emissions in the mid-term and foster its economy, hydrogen production should be green and blue, with specific targets set for 2030 for the hydrogen costs and produced quantities. This work compares the state-of-the-art production of blue and green hydrogen and how Colombia is doing in each pathway. A deeper analysis considers the advantages of Colombia’s natural resources, the possible paths the government could follow, and the feedstock’s geographical location for hydrogen production and transportation. Then, one discusses what may be the next steps in terms of policies and developments to succeed in implementing the plan. Overall, it is concluded that green hydrogen could be the faster, more sustainable, and more efficient method to implement in Colombia. However, blue hydrogen could play an essential role if oil and gas companies assess the advantages of carbon dioxide utilization and promote its deployment.

Graphical Abstract

1. Introduction

Hydrogen is the most abundant element in nature, but it cannot be considered an energy source by itself because it is impossible to find it in its elemental form in nature. After achieving a separation process from other elements, it can become an adaptable fuel, commonly referred to as an energy vector or carrier that can be moved, stored, and delivered. Accordingly, its manufacturing process determines if it can be considered a non-polluting carrier in all its meaning. As a fuel, hydrogen has good potential to reduce carbon emissions in hard-to-decarbonize sectors, such as the transport sector, by avoiding dependence on petroleum oil. Another target market will be heavy industries such as steel and chemical production. Its high energetic yield and efficiency, far greater than the ones achieved by hydrocarbon fuels, makes it an asset in the transportation sector [1]. The global demand for hydrogen in its pure form has been increasing since the new millennia by up to 50%, reaching values in 2020 of 90 Mt. The driving industries have been the chemical industry, with values of up to 45 Mt, and refining (oil and its byproducts), with up to 37 Mt. Conversely, one of the lowest demands is in the transportation sector, with less than 20 kt (0.02% of global demand), the one that should make the strongest effort to embrace this new technology to attain the pathways pledged by governments [2].
Projections state that hydrogen demand will keep increasing in the coming years, depending on the pathway chosen. If governments follow the announced pledge scenarios, 250 Mt could be the global demand in 2050. Instead, if the net-zero emission (NZE) scenario is the one pursued, more than 500 Mt would be the future demand in 2050, as shown in Figure 1 [2]. In any of them, we can see that the transportation sector has a big market potential, with values of up to 20% of the total demand. Fuel cell electric vehicles should represent the largest deployment due to their early commercial availability, but the quantity will always depend on price reductions and refueling stations.
Although the path towards the hydrogen economy is being led by Europe, the United States, and some Asian countries, South American governments have started giving the first steps in the same direction. Since the 2015 Paris agreement, Colombia has set goals such as stopping deforestation in the Amazonian region and reducing its emissions in the next 15 years. In 2020, more challenging goals were set to reduce emissions by 51% before 2030. To achieve this, the country began the energy transition path by starting the operation of 20 MW of onshore wind and 700 MW of photovoltaic (PV) installed capacity by the end of 2021. Roadmaps for offshore wind and hydrogen were published by the Mines and Energy Ministry, providing some insights into how the next projects will be developed in the energetic field of Colombia [3].
The hydrogen roadmap takes into account emissions reduction in the energy and industry sectors (currently >75 Mt CO2), its tentative demand, and production capacity in Colombia. It considers the country’s privileges in natural resources, such as ca. 19% and 60% of CF in solar PV and wind power, respectively, and coal and gas reserves that can be used to produce hydrogen. The 2030 goals for green hydrogen are set to be between 1 and 3 GW of electrolyzer installed capacity, for a Levelized Cost of Hydrogen (LCOH) of $1.7/kgH2, and an annual production of 50 kt of blue hydrogen, with a LCOH of $2.4/kgH2. During the first semester of 2022, Colombia started two pilots of green hydrogen production by using solar energy as the preferred method of powering the electrolyzers [3].
Considering that major changes are expected soon, this review paper overviews blue and green hydrogen production methods and the current status of these techniques in Colombia, discussing the required next steps for the deployment of said technologies and the implementation of a solid hydrogen economy in the country. The analysis takes into consideration Colombia’s natural resources, the feedstock’s geographical location for hydrogen production and transportation, and the possible paths followed by the Colombian government. The choice between green and blue hydrogen, and which one could be deployed faster, will depend on the mentioned factors, the next policy decisions, and the developments required to successfully implement the hydrogen plan in Colombia.

2. Hydrogen Production

2.1. The Hydrogen Color Code

Hydrogen can be produced in various ways using all sorts of energy sources. As stated before, the environmental impact of hydrogen use depends on the manufacturing method and its production chain. Colors are being used as the classification of hydrogen according to their production route, where brown, grey, blue, and green hydrogen can be described as follows [4]:
  • Brown H2: produced via the gasification of coal, generating CO2 emissions in the process;
  • Grey H2: produced via natural gas reforming processes, generating CO2 emissions in the process;
  • Blue H2: produced via natural gas or biogas reforming processes with CO2 emissions but using carbon capture, utilization, and storage (CCUS) technologies for a neutral carbon system;
  • Green H2: produced via water electrolysis powered by clean and renewable energy sources.
Currently, 96% of the hydrogen production comes from fossil fuels [5], 48% from natural gas steam reforming, 30% from naphtha reforming, and 18% from coal gasification, while only the remaining 4% is manufactured via green methods (e.g., water splitting) [6]. The electricity required for the water splitting comes from PV or wind. Other systems that contribute to hydrogen production include: thermochemical cycles, bio-hydrogen processes such as direct and indirect biophotolysis, or photo and dark fermentation [7]; hydrogen recovery from a waste gas stream through absorption and adsorption processes or membrane processes; however, they still are in their early research stages. Accordingly, only the most important methods will be reviewed [6].

2.2. Hydrogen Production from Fossil Fuels and Biomass

Gasification of coal, steam reforming, the Fischer–Tropsch distillate process, autothermal reforming, and thermal cracking are the main techniques to produce hydrogen via fossil fuels [8]. The first two methods are currently the most conventional. Additionally, biomass-based processes are gaining a lot of attention, as many feedstocks can be used to generate hydrogen following a circular economy approach and, thus, carbon-neutral.

2.2.1. Coal Gasification

For nearly two centuries, coal gasification has been used to produce H2 in the form of syngas, a mixture of hydrogen and carbon monoxide with ashes (Equation (1)). Nevertheless, due to the high temperatures needed (depending on the gasifier from 1400 °C up to 1900 °C), and the pollutants that appear in the reaction, it is the less favored method [8].
2C + O2 + H2O → H2 + CO2 + CO
In a gasifier, oxygen and steam are put in contact with coal, producing syngas. Then, to purify the H2, additional steam is injected, and the CO of the syngas is shifted to more H2 and CO2 reacting over a catalyst. Finally, pure hydrogen is separated in its gas state, generally through an adsorption process, as seen in Figure 2. This technique could improve its efficiency and environmental friendliness by applying carbon capture systems to ensure zero CO2 release [9,10].
Currently, approximately 130 coal gasification plants are in operation, and only three (two in the USA and one in China) have a carbon capture system. Nearly 0.6 Mt are produced yearly between them, showing that the production of H2 with low emissions is economically viable [11].

2.2.2. Steam Reforming

The steam reforming process is the most common and the least expensive method used for hydrogen production. On the other hand, the dependency on fossil fuel stocks is a significant disadvantage. Natural gas, methanol, gasoline, LPG steam, and ethanol, among others, can be used as feedstock for the reaction [12]. Almost 50% of the world’s hydrogen production comes from steam methane reforming (SMR) [6], but we cannot be oblivious to the global situation of war between Ukraine and Russia, which impacts most of the gas supply of Europe; thus, a reduction of that amount is expected.
Natural gas reforming is carried out in a catalyzed reactor at a high pressure (3–25 bar), where high-temperature steam (700–1000 °C) reacts with methane, producing H2 and CO. Since it is an endothermic reaction, heat must be supplied (Equation (2)). Then, the water–gas shift reaction occurs, where the CO and steam react generating CO2 and more H2 (Equation (3)). Lastly, through an adsorption process, pure hydrogen gets separated [13]. It is important to mark that the emissions are far less than from other methods such as coal (45%), diesel (27%), and gasoline (25%) [5].
CH4 + H2O ⇌ CO + 3H2
CO + H2O ⇌ CO2 + H2

Aqueous Phase Reforming

Another technique utilized since 2002, uses carbon-laden wastewater from different industrial sources to produce hydrogen and other valuable compounds. These carbon-rich streams are byproducts of various industries (e.g., food, agriculture and biomass processing, biodiesel production) that need to be handled before being discharged to the environment. The operational temperature is less than one-third of the regular steam reforming process (220–270 °C) at pressures between 1.5 to 6 MPa, which gives a good operational advantage in energy consumption [14,15].
The key component to developing this practice is the catalyst, whose preparation results in different features. It is usually composed of an active metal, such as a platinum group metal (PGM), a non-noble metal, or an alloy, and a support material, such as zirconia, alumina, or carbon. The preparation begins with the formation of the supporting metal system, followed by oxidation (calcination), and catalyst activation.
Equation (4) describes the aqueous phase reforming process. During this reaction, the Fischer–Tropsch and dehydration processes must be avoided, and water activation with carbon-to-carbon bond breaking should be preferred to increase the hydrogen outcome [14,15].
CnH2yOn + nH2O ⇌ nCO2 + (y + n)H2

2.2.3. Hydrogen from Biomass

The biomass used for hydrogen production can be obtained from crops or residues, such as wastes derived from the agricultural and industrial sectors, or the forest [16]. Due to the abundance of biomass in many ecosystems, and the nearly zero release of emissions, it is a method with great potential because it is carbon neutral in its lifecycle [17]. There are two main techniques of development: biomass fast pyrolysis and biomass gasification.

Biomass Fast Pyrolysis

In the absence of air, biomass is heated rapidly to be converted into a dark brown bio-oil (Equation (5)) [18]. To produce additional hydrogen, steam reforming of methane (Equation (2)) and the water–gas shift reaction (Equation (3)) are also applied afterward.
Biomass + heat → H2 + CO + CH4 + bio-oil + other products + char
Fast pyrolysis is a competitor with other techniques of hydrogen production given that, at around 900 °C, the process converts ca. 60% of the original material into gas rich in carbon monoxide and, most importantly, hydrogen [18].

Biomass Gasification

The difference between biomass pyrolysis and gasification is that the latter can be carried out with air, oxygen, and steam agents aiming to produce gaseous products instead of bio-oil [18]. Maximum concentrations of H2 achieved are between 40% to 50% [18]. As in the pyrolysis method, the gases produced are steam-reformed and water-shifted to generate even more H2. During the process, char is formed (Equation (6)). To deal with this issue, there needs to be a good gasifier design, proper control and operation, and adequate catalysts [18].
Biomass + heat + steam → H2 + CO + CO2 + CH4 + light and heavy hydrocarbons + char

2.3. Green Hydrogen Production

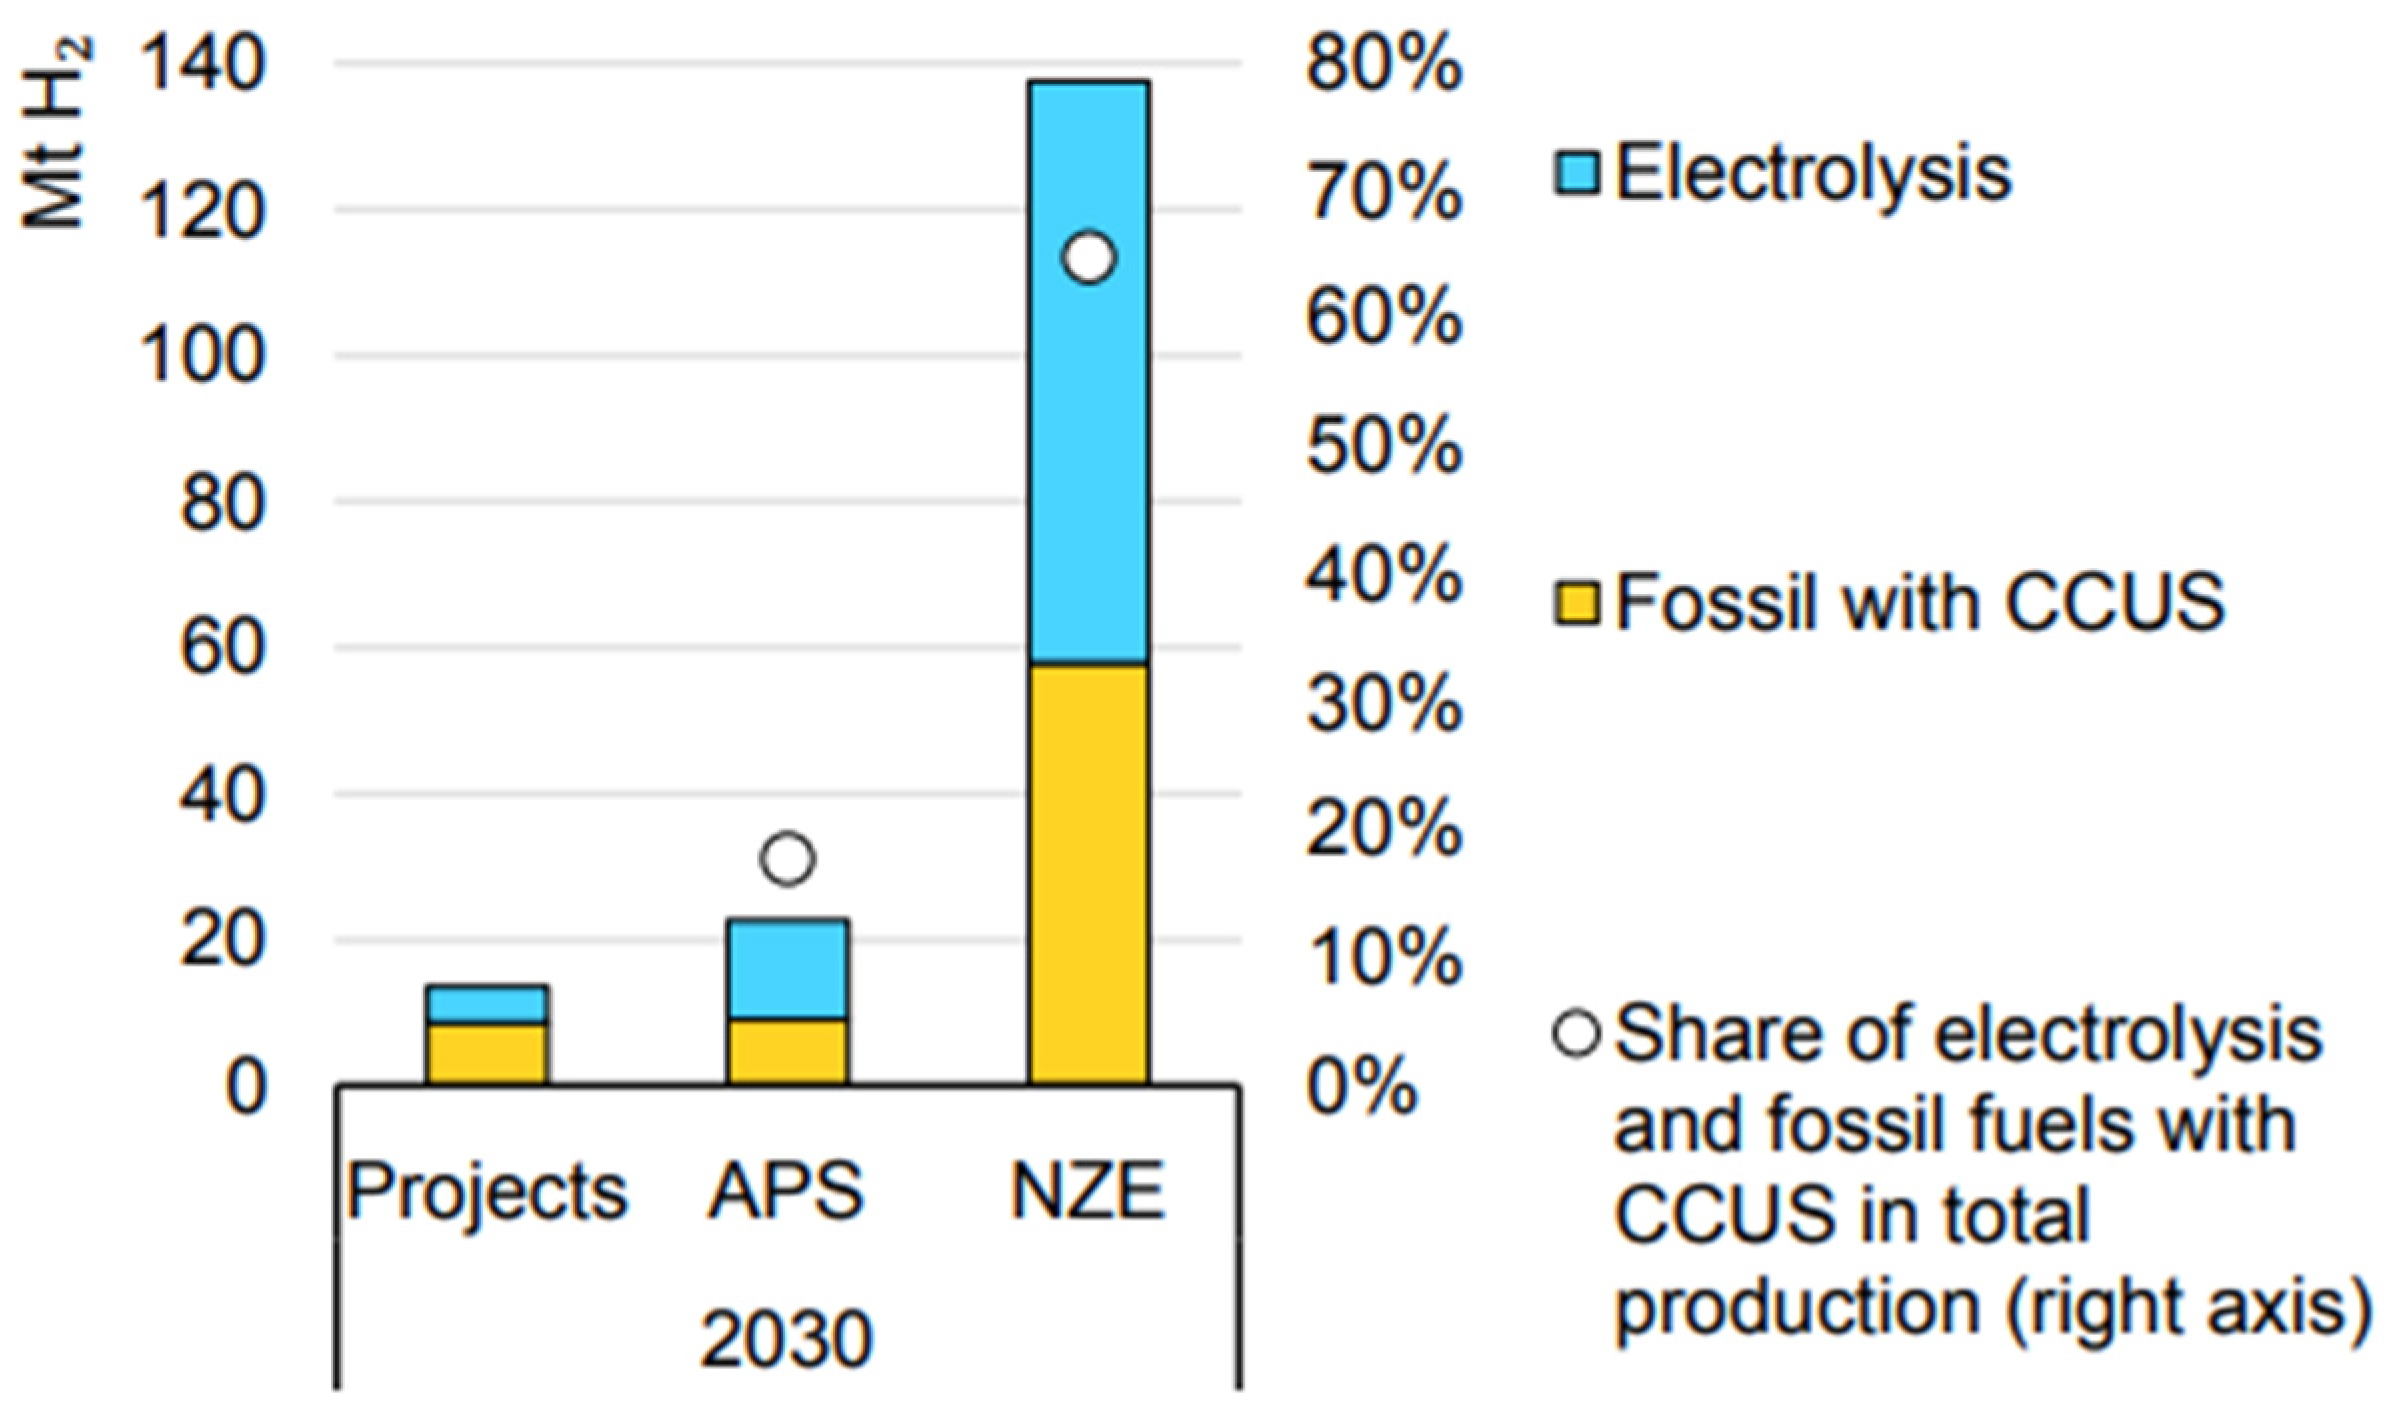
Hydrogen production from renewable sources encompasses a great variety of sources, all resulting in H2 almost with no greenhouse gases (GHG) as a product. To attain the mentioned announced pledges scenario of decarbonization, and finally the NZE scenario, this production classification should play a bigger role in the mid to long term for all the countries. Figure 3 reflects how the amount of electrolysis and blue hydrogen production should behave in 2030 scenarios, and the planned projects appear short.
It should also be noted that the technical potential of green hydrogen in the entire world can supply the forecasted primary energy demand in 2050 by up to 20 times [19].

2.3.1. Green Hydrogen Production Methods

Water electrolysis and photocatalysis are methods that can produce hydrogen by splitting the water molecule into its basic components using electricity or heat/light as input. Photocatalysis is under intense research but still cannot produce hydrogen on a large scale. As for electrolysis, it was discovered more than 200 years ago and is presently the most recognized sustainable technique to split water and produce green hydrogen. The simple electrochemical reaction is given by Equation (7) [20].
2H2O → 2H2 + O2
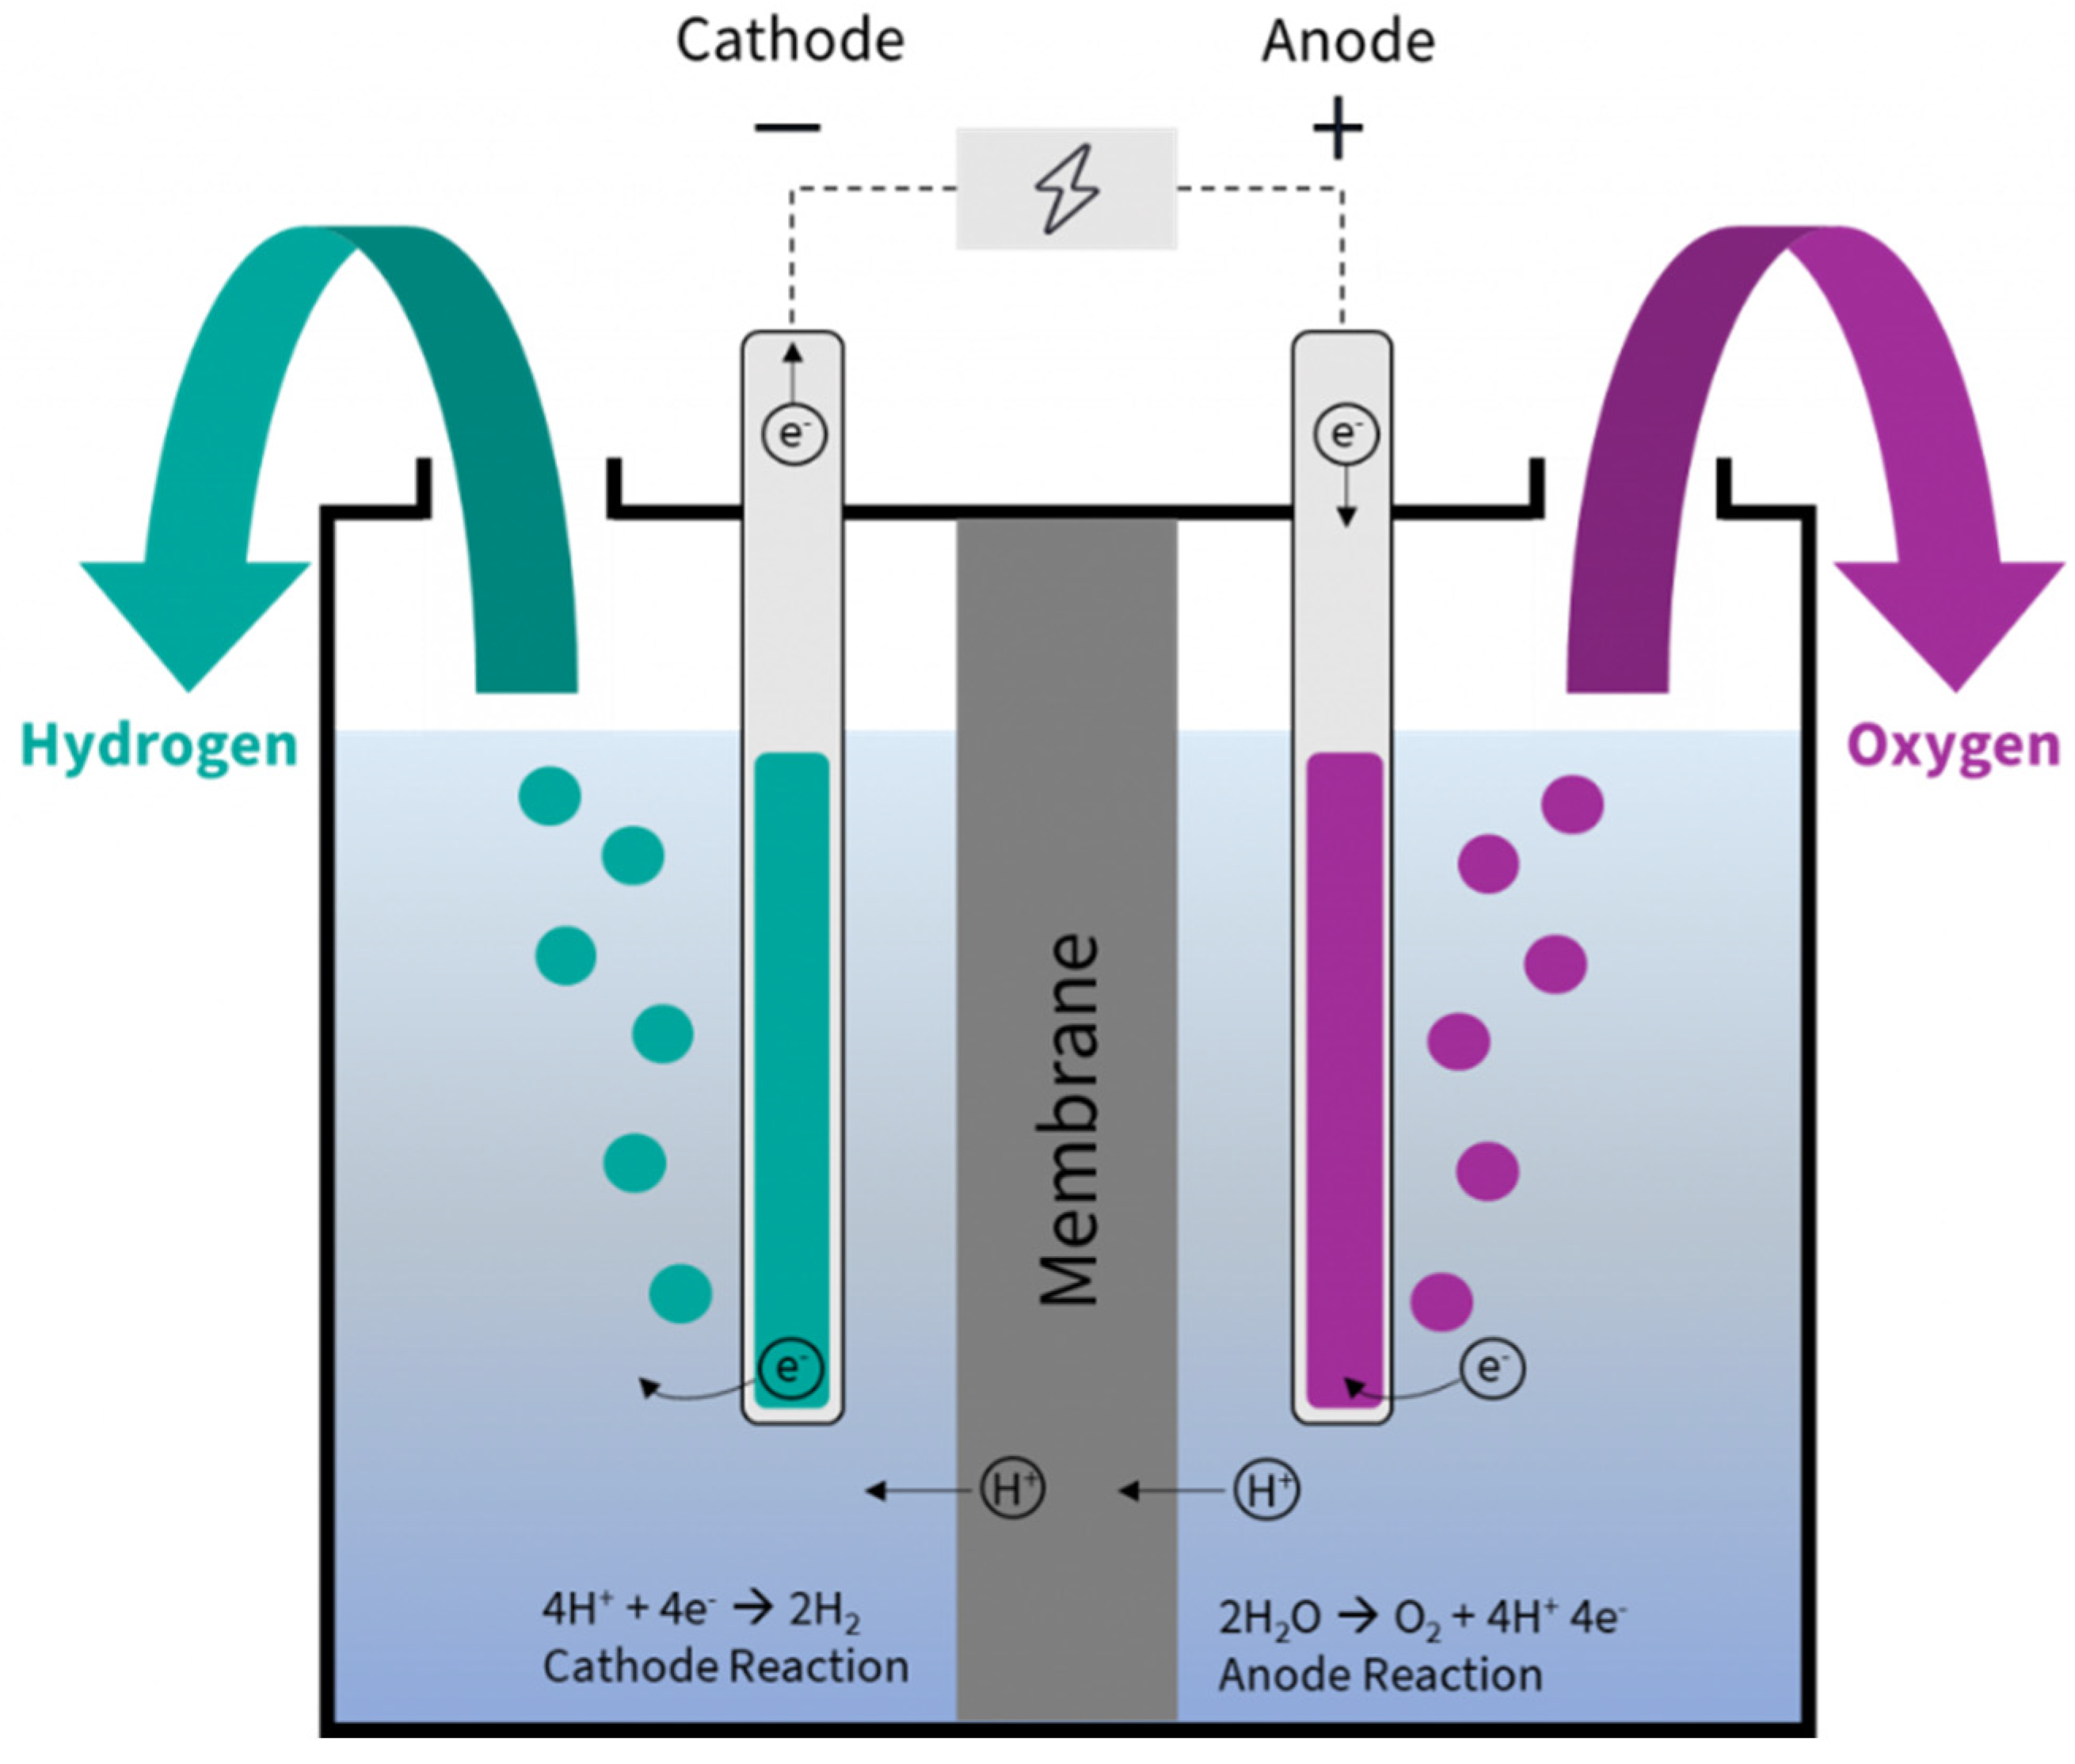
Through the passage of an electrical current, oxygen and hydrogen with a purity of 99.99 wt.% can be produced (Equation (7)), by using an electrolyzer unit where two electrodes, together with the membrane, diffusion layers, catalysts, and current collector, split water molecules (Figure 4) [21].
There are three main technologies for this process, which are reflected in the name of the electrolyzer. Proton-exchange membrane (PEM) electrolysis is the technology that right now is driving the market, because of its high amount of H2 production at low cell voltages, compared to the competition. Alkaline water electrolysis (AWE) is the oldest technology and can still play an important role in the hydrogen economy if more research is done [22]. The last one is the Solid Oxide Electrolysis Cell (SOEC), which has not yet been commercially deployed. It works at high temperatures, admitting contaminants, but with structural problems after some time for its working temperatures [20].
Hydrogen production via water electrolysis may be considered a completely green method depending on the energy source used to power the process. The preferred sources right now are wind and PV combined [23]. Yet, hydro, geothermal, or wave will result in the same green technique. Some drawbacks concerning the price of the electrolyzer and its environmental impact should also be considered. PEM electrolyzers have high costs because of the manufacture of the solid polymer electrolyte membrane and the use of PGMs, which are expensive and scarce. Moreover, PGMs are extracted mostly in South Africa, with high water consumption involved in the extraction, and superior GHG emitted compared with gold mining, for example [24]. Thus, AWE technology, which uses nickel as a low-cost transition metal and does not require ion-exchange membranes, could be the future of electrolysis if the amount of hydrogen produced competes with that of PEM [25,26]. Additionally, novel methods, such as plasma-driven solution electrolysis (PDSE), could represent a more efficient method to produce hydrogen if more research is done on the topic [27].
Water electrolysis technology carries great potential for renewable energies, as it could be the preferred storage solution to the intermittency problem. For example, when solar power is at its peak power production, the electricity demand is lower and the extra energy needs to be stored. If that surplus energy is used to feed the electrolyzer and produce hydrogen, there would be better utilization of the installed capacity [20]. Afterward, power-to-X (e.g., power-to-gas, power-to-liquid) technologies can be utilized, which are new methodologies for hydrogen utilization [28].

2.3.2. Green Hydrogen Prices

As a rising technology, the prices of green hydrogen are still not competitive compared with fossil fuels or other low-carbon technologies. Thus, some variables should be considered to determine the LCOH. Those include the technology used for the electrolysis process and its scale, the interconnection of the electrolyzer with the electricity source, the renewable energy chosen to supply the electricity (can be a single one or a combination of two sources), and the geographical location of the renewable energy source, which can determine the electricity price and, consequently, driving most of the hydrogen cost [19].
Figure 5 shows that the LCOH for renewables was between $8.5/kgH2 and $3/kgH2. Again, the cost variation will depend on the technology used, directly impacting the Levelized Cost of Electricity (LCOE). Additionally, for a specific geographical location, there will be a mix between the renewable energy source and the electrolyzer, thus optimizing the cost. If more than one generation of technology supplies the electrolyzer (i.e., wind + PV), more electricity input will have the hydrogen production system with higher CAPEX. Regarding the location, it is relevant to mention the Capacity Factor (CF) of renewable energies, defined as the ratio between the power produced by a single unit in a specified period and the unit-rated power in the same period.
Thus, CF is a dimensionless coefficient that shows the percentage of time that a system has worked at its rated power. In a global average range, the regular values for PV are 10% to 21%, for onshore wind 23% to 44%, and for offshore wind 29% to 59% [29]. These percentages are, of course, susceptible to daily and seasonal patterns, and location. Higher CF means higher system utilization, higher electricity output, and higher hydrogen production. Figure 5 illustrates the relationship between the LCOH, with different CFs in different countries, and the generation technology ratio supplying the electrolyzer system, ensuring optimal values with lower ratios [19].
Corresponding to a Net Zero Emission scenario, Figure 5 shows the relevance of the CF and the slight impact of having hybrid technologies when compared with the cost of hydrogen in an optimistic approach. It should be considered that this approach expects the technology to be highly developed. For a high CF for a specific technology, i.e., 63% onshore in Chile, the LCOH can be three times lower than for CFs of 20% in the same technology in Japan. That is mainly because green electricity has become cheaper. The LCOE has been declining significantly in the last few years. For newly commissioned projects bigger than 10 MW (utility-scale project), PV has dropped 85%, onshore 59%, and offshore 48% in the last ten years [30].
Typically, LCOH encompasses the Weighted Average Cost of Capital (WACC), CAPEX, and OPEX of projects. OPEX concerns the performance of the system and its needs for operation. The CAPEX conveys the total expenditure invested when increasing the operation, i.e., in a certain way, with the probable profit. The WACC relates to the rate of return shareholders and bondholders demand from a project [31]. Usually, this number should be as low as possible for the project to be profitable.
As a reference, details of the two leading electrolysis technologies (AWE and PEM) and their CAPEX per kW are shown in Table 1 for 2017 and 2025 [32]. Similar to the other aspects, these prices are expected to reduce in the next few years due to a strong push in technological developments and research. As the PEM electrolyzer materials are more expensive, AWE is expected to overcome the market if the target efficiencies are met. OPEX values are a low percentage of the total cost.

2.4. Blue Hydrogen Production Prices

Regarding the production price, several sources of information account for different factors, like the geographic region, fuel prices, renewable electricity price, carbon tax for emissions, capacity and load factors, and learning rates of CCUS; therefore, prices are not standardized and open to discussion. Blue hydrogen production costs could be three times lower than green hydrogen production if large-scale CCUS systems are deployed.
Figure 6 shows that the price of hydrogen obtained by the coal gasification process could range between 1.6 to $2.7/kgH2 and steam reforming is as low as 1 to $2/kgH2 on the world average. As an example, the capital expenditure (CAPEX) and operational expenditure (OPEX) requirements in China accounted for 80–85% of the total cost. There will always be variability in prices, but the feedstock is a critical portion of the OPEX that drives the cost of hydrogen production.

2.5. CO2 Emissions

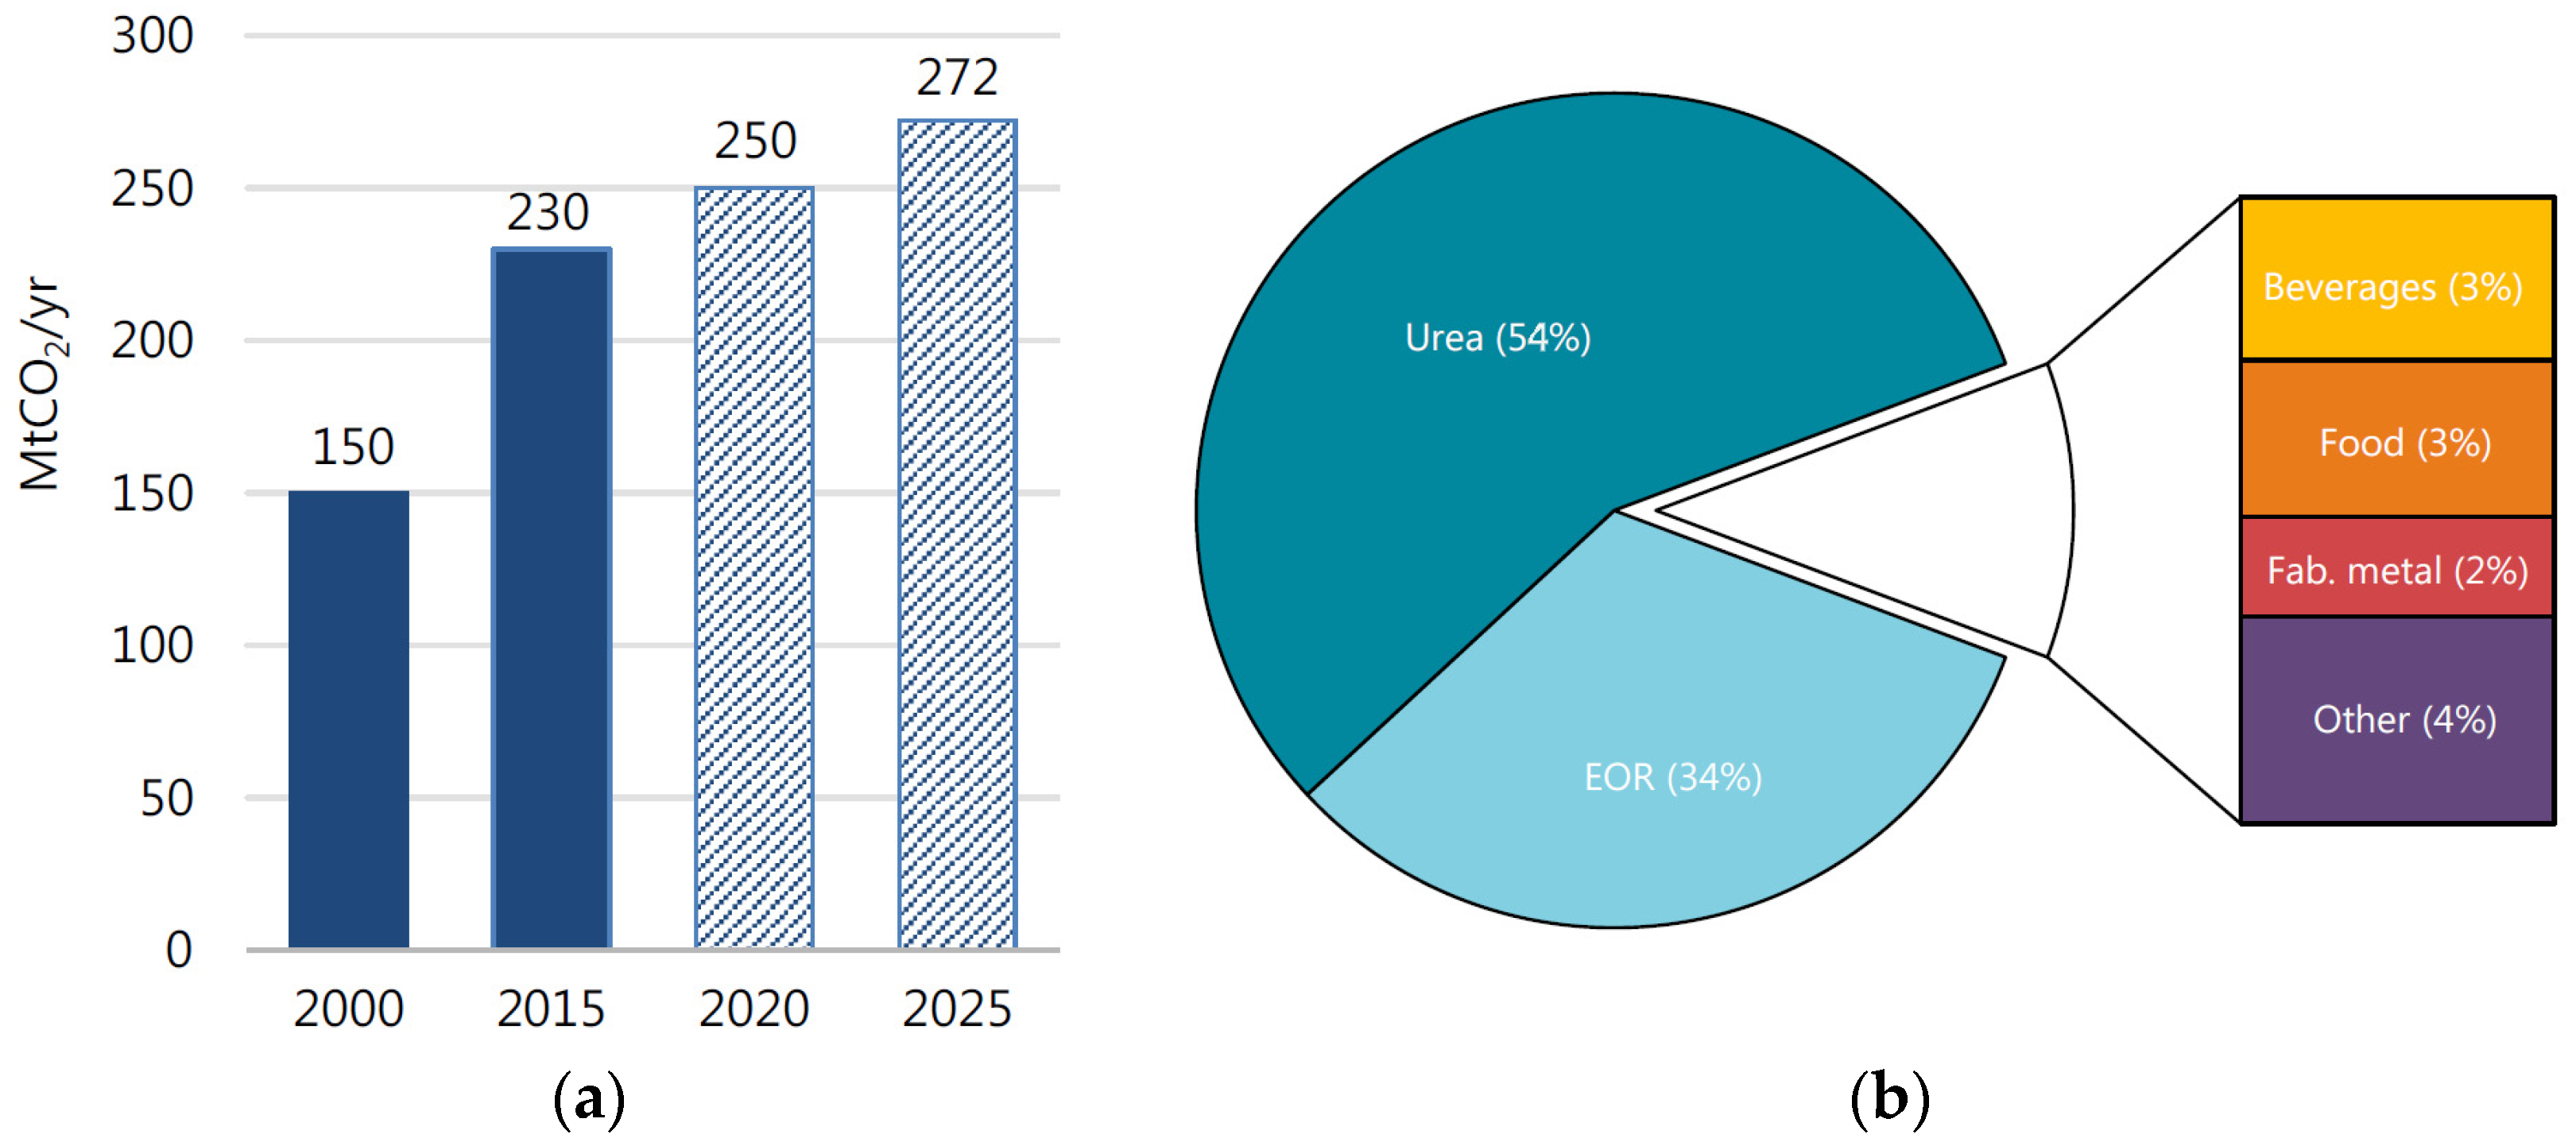
Carbon dioxide (CO2), one possible GHG outcome of H2 production by fossil fuels, can have valuable commercial uses in different industries and, by doing so, help decrease the tendency of climate change. In 2019, 230 Mt of CO2 were used globally, with the fertilizer industry being the biggest consumer with 130 Mt and the Oil sector, with the Enhanced Oil Recovery (EOR) need, the second largest with almost 80 Mt [33].
Geographically, the demand is focused on the US, China, and Europe, with 33%, 21%, and 16%, respectively. The projection of growth in the mature industries is expected to be 1.7% yearly, reaching a value of 272 Mt by 2025 (Figure 7), but that amount is too low to achieve the goal of net-zero emissions. Thus, new developments and industries are needed to be born, using CO2 as the raw material.
The price of CO2 varies depending on the season and industry supply and demand. For big industrial companies, which usually are ammonia and fertilizers producers, the price range is from 3 to $15 per ton. During autumn and winter, the consumption of these industries reaches the top, causing a scarcity in the market for other sectors. Markets with low volume, such as the beverage and food industry, in need of high-purity CO2, can pay even $400 per ton [33]. Therefore, the supply will have to develop further to support peak demand and the incoming increase in consumption.
According to the IEA, three main factors will shape the future market of CO2: scalability, competitiveness, and climate benefit. The first relates supply and demand as a loop: if there is enough demand, the supply will grow, and prices will become more competitive for emerging markets. Naturally, factors such as transportation and processing facilities will take an important role in the development of the loop. Regarding competitiveness, the cost of CO2−derived services and products will drive the market’s growth, making it more competitive [33].
Lastly, climate benefit encompasses the life cycle of the product or service. To be beneficial, the use of CO2 must displace the one with higher life cycle emissions, i.e., the source (biomass being the best and fossil fuels the worst), the product/service to be displaced, the amount of energy used to convert the gas, and the time the carbon will be retained (building materials) are aspects to consider [33].

Carbon Capture, Utilization, and Storage (CCUS)

COP21 set a reduction target of 60% for CO2 emissions, although the current demand for this chemical compound is not enough. One of the possible strategies to attain this percentage is Carbon Capture and Storage (CCS), which could make a great contribution by sequestering CO2 as a long-term solution. On the other hand, Carbon Capture and Utilization (CCU) offers more economic benefits by using the chemical compound in the industry and by having the possibility of using the CO2 from industrial-released ones [34].
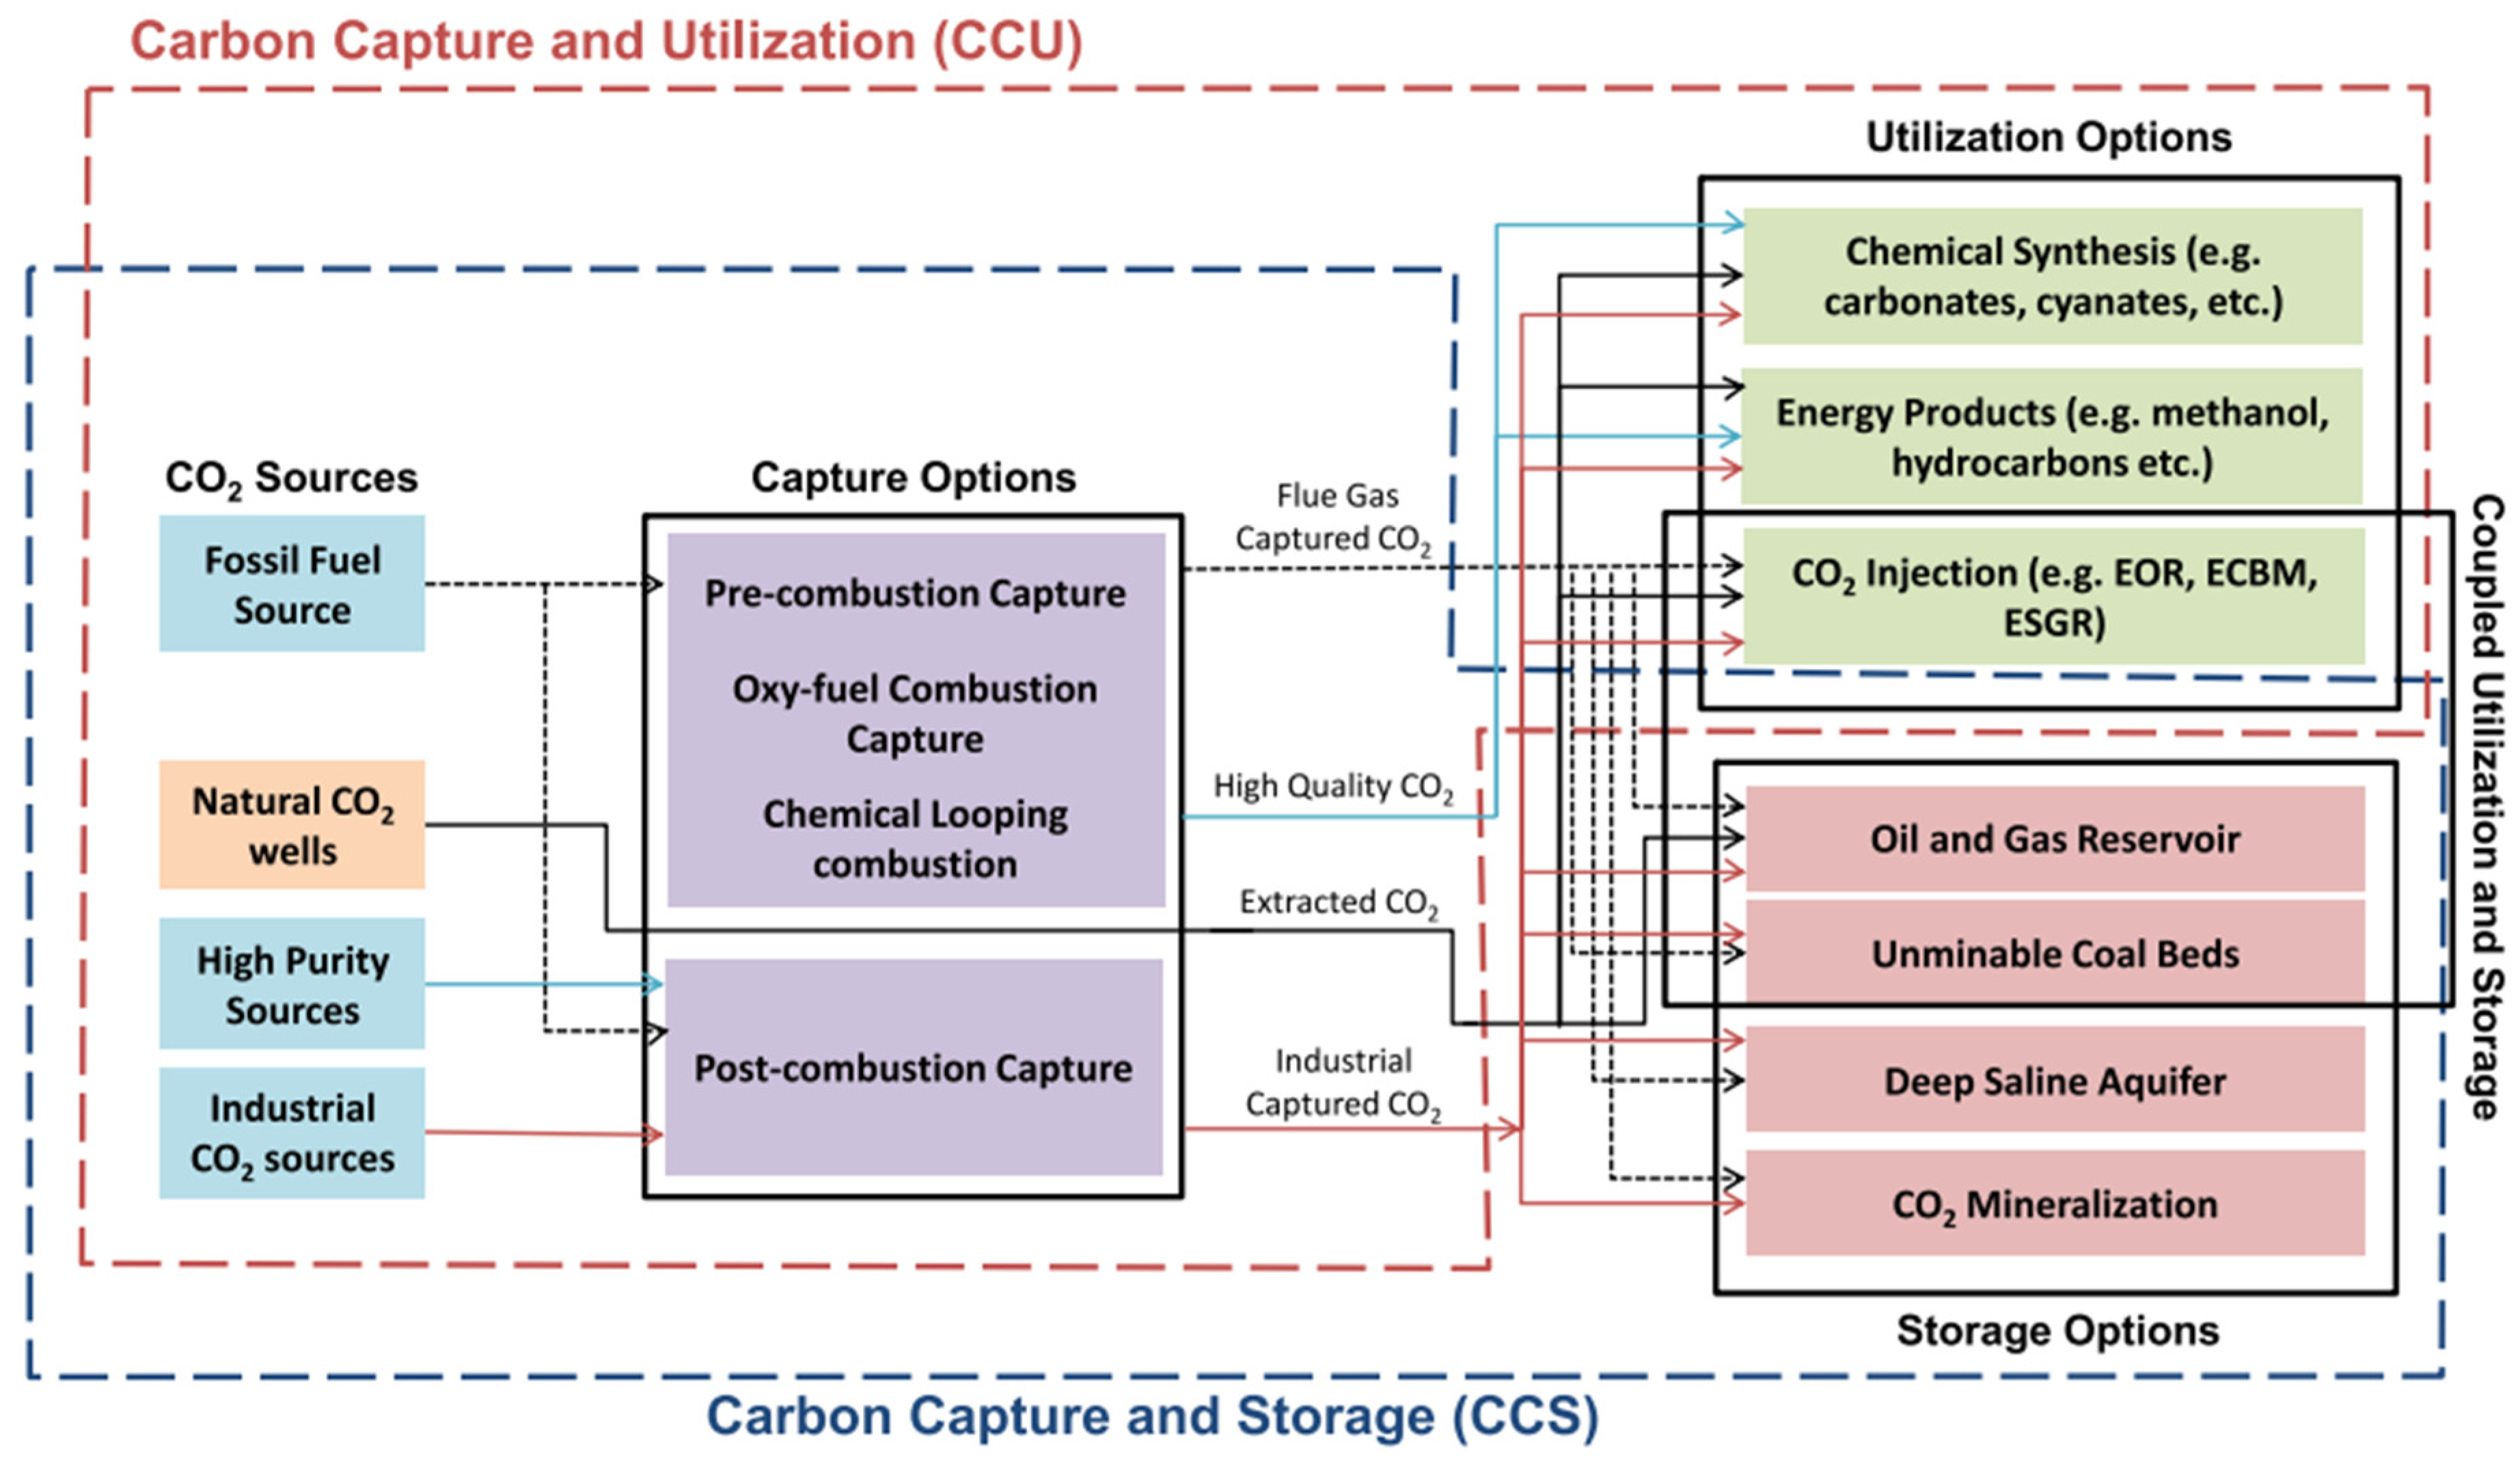
Nearly 5.6 Gt of CO2 emissions should be collected by 2050, 360 Mt for use in the industry (CCU) and 5266 Mt for Storage (CCS). To achieve this objective, hard-to-abate decarbonization industries, such as iron and steel, cement, chemicals, fuel transformation, and power generation, need to contribute from 16% to 90% of the emissions reduction [35]. The role of both processes can have gaps and overlap at some points (Figure 8).
More research is needed to foster the CCUS as a mature technology, desirable by the market. The overlapping utilization options are CO2 injection for Enhanced Material Recovery (EMR), mostly EOR [34], usage in oil and gas reservoirs, and unminable coal beds. For CCS, deep saline aquifer and CO2 mineralization are the main alternatives.
In terms of acquiring this gas, any power plant can be retrofitted to different carbon capture options. Still, most of the raw outcome will provide CO2 with many impurities such as SOx and NOx. Hence, if CCU is the desired product, a post-purification treatment may be required to reach the purity grade needed for chemical synthesis and food processing. Additionally, CO2 as CCU can be employed in the chemical synthesis of polymers, methanol, and hydrocarbon production as a different approach to energy products.
According to the Global Carbon Capture and Storage Institute, the CCU will account only for 6.4% of the total emissions; thus, Large-Scale CCS would be the prime methodology to help accomplish the established goal. Then again, the regular process of CCS consists of capturing the CO2 from the industrial plants, as explained previously, and concentrating it in a Cluster. Next, hubs accumulate, process, and transport the compressed gas by ship, trucks, or pipelines (depending on the distance) to permanent storage that could be onshore or offshore. Usually, this procedure is considered a reinjection or permanent sequestration, suitable for geological formation with porous rock formations such as coal seams, deep saline aquifers, and “depleted” oil or gas reservoirs. There are still doubts regarding the social acceptance of this method, because of possible leakages that should be properly addressed. Still, despite that, many projects are currently being developed following this process that traps oil, gas, and other hydrocarbons on the earth’s surface for years [36].
Only 2% of the global geological storage capacity for CO2 corresponds to oil and gas fields; the rest lies in saline formations, which are more than enough to meet the global storage requirements. Since it has been a century of industry’s exploitation of oil and gas fields, it has been demonstrated so far by seismic and geophysical data, and cores taken from wells, that these reservoirs can comprise CO2 for thousands of years. Still, pilots are required to understand better the behavior of the flow through the storage rocks. Discouraging, as there is no economic benefit in saline formations, there has not been financing to examine its potential. Indeed, if transportation costs are intended to be reduced, research on the topic should be addressed to take advantage of the many locations worldwide [35].
Many countries have deployed their hubs and clusters, where economies of scale have been created for specific tasks of the procedure. As a consequence, the same institute made a classification of the global CCS facilities that exist up to date: Commercial CCS facilities, which are part of a commercial operation, regulated for permanent storage of CO2, and Pilot and Demonstration facilities, which are testing facilities that may not store CO2 permanently and with the lifetime of the project. Globally, there are approximately 65 commercial facilities in operation or construction, the new ones mainly being opened in the United States, Australia, and New Zealand. In 2020, the operational facilities accounted for around 40 Mt of permanently stored CO2, and more than 35 pilot and demonstration facilities will encourage investment in bigger facilities [35].

3. Feasible Deployment Pathway of Blue Hydrogen Production in Colombia

The Mines and Energy Ministry published a hydrogen roadmap as part of the energy transition plan Colombia is about to follow, aiming for a 51% emissions reduction by 2030 and eventually a net zero by 2050. In this, an amount of 50 kt of blue hydrogen production is one of the objectives for 2030 [3]. This section intends to give a superficial overview of how the country could start the production of that hydrogen technique, its probable location, and policies to consider. To start, it is good to acknowledge that a new president has been elected for the 2022–2026 period, Gustavo Petro. During his term, it is expected that energy transition and climate change will take a major role, while fossil fuels, which are currently the spine of the Colombian economy, end up with a plan that strives for its reduction in the long term.
Colombia is a privileged country in the availability of natural resources, which will probably cover its energy needs in the mid-term and possibly in the long term if more exploration is done. The reserves of fossil fuels, such as coal and gas, could be used to produce hydrogen. Still, carbon capture, storage, and/or utilization should accompany this methodology to prevent an increase in emissions while accomplishing the net-zero plan.
The proven gas reserves, the least contaminant approach to producing hydrogen from fossil fuels, are about 7.5 years of consumption (2.95 trillion standard cubic feet, Tcf) [36]. That amount could grow to 39.6 Tcf if the government approves the fracking practice. However, the upcoming presidential administration will most likely refuse this environmentally harmful technique, and the extraction will be limited to a maximum of 3 Tcf (8 years) if all the reserves are successfully extracted [37]. Most of the reserves are situated in the center-east part of Colombia, in the Casanare region, and today, while new regasification plants are under construction, some imports are being made. Without gas exploration developments, the country could face difficulties in energy security because of the dependence on gas imports.
On the other hand, Colombia has one of the biggest coal reserves in Latin America, with potentially 16,500 million tons, of which 6648 Mt have been measured [38]. Being in the top 10 in the export of this resource, and with supply for more than 100 years of consumption, this fossil fuel could be the most feasible option to create a Blue Hydrogen production industry. The most important coal reservoir, with almost 50% of the country’s reserves, is in the Guajira and Cesar regions (Figure 9), in the northern part of the territory [39]. Most of the coal extracted from the opencast mining sites is exported (up to 80%) to the metallurgy industry, partially because of the calorific specifications and low sulfuric content. Usually, despite being one of the most CO2-emitting methods, if carbon capture is fully achieved, there is a high chance for the industry to foster.
Colombia’s total primary energy supply in 2019 was 44 Mtoe, with oil and natural gas being the most significant, with 39% and 27%, respectively. As it is an exporter of fossil fuels, its energy production is only 0.128 Mtoe or 5330 TJ. The energy consumption is focused on transportation, with 36.2%, and industry and buildings, with 25.2% and 19.4%, just as in any other regular country. From the electricity perspective, up to 65% of the yearly consumption (75 TWh) comes from Hydro renewable energy. From the other sources, the annual emissions are 75 Mt of CO2, i.e., 1.45 t CO2 per capita, an amount way below the global average of ca. 4.7 t CO2 [40].
From this information, it is inferred that Colombia will not significantly reduce its emissions without changing its exploitation of the fossil fuels industry. If a real reduction in CO2 emissions is intended, the transportation sector should be the prime focus, with the biggest share of 31 Mt. Then, it is to be said that hydrogen production could essentially benefit the economy by creating new markets for the blue hydrogen production chain and management. Since most of the oil exports go to the US, the export of this energy vector could play a bigger role if the energy transition in countries like the US is achieved, increasing the demand and Colombia its production.
By 2020, Colombia had 1.82 billion barrels of proven oil reserves, approximately 13 years of its annual consumption (including exports), was the 18th exporter of oil worldwide, and could increase even 3 more billion if exploration and investment exist [41]. Oil price dynamics are driven by various shareholders such as OPEC nations, supply–demand, and the possible future traded by hedgers and speculators [42]. As CCUS is mostly focused and profitable in oil extraction, the oil price will impact the investment decision and scalability for CCUS projects based on EOR, where several variables must be considered. Likewise, research applied to an oil refinery in Colombia concludes that important options for mitigating emissions are energy efficiency, CCS or CCSU as EOR, among others [43].
CCUS projects should be optimally interconnected with the emitting flue gas plant to minimize deployment costs. The cost of CO2 transportation could be up to 10% of the value of the project if pipelines are the chosen method or even more with other methodologies [34]. To make the most profit from the CO2 emissions, as stated before, implementing Enhanced Oil Recovery (EOR) in the existing and future wells would be the best option. Normally, an oil well can be extracted up to 20% through natural pressure. By waterflooding, another 20% can be recovered, and by using CO2 injection, depending on the type of oil, deepness, and several other conditions, another 10 to 20% could be retrieved, achieving a 50–60% recovery [44]. Therefore, oil companies could sponsor the CCUS project for their benefit in a winning image for avoiding GHG emissions.
In Latin America, only Brazil has developed a CCUS Facility and a pilot and demonstration one. The Petrobras Santos Basin Pre-Salt Oil Field CCS facility capture CO2 from an offshore installation that processes oil and natural gas and reinjects it into three different oil fields for EOR, with a capacity of 4.6 Mt per year. As the entire process occurred in the same place, this oil company did not have to invest much in transportation, storage clusters, or more complex infrastructure; therefore, the profitability should be high [19]. These pilots and demonstrations are critical to assess the future behavior of the CO2 inside and outside the wells. Specific emphasis on measuring if it is any effusion or leakage to the environment should be made before scaling the methodology worldwide.
Considering the previous scenario and its feasibility (socially, environmentally, technologically, and economically), Colombia should implement the technology required to gasify the coal, preferably in a place close to the mining sites or the transportation route of the coal product. Regarding gas, there are five gasifier plants currently operating, two of them with 60% of the country’s supply, located in the Casanare region [45]. The other three are being built on the Caribbean coast (Magdalena, Sucre, and Guajira), the northern part of the country. Geographically, hydrogen production should be done in the northern region where the feedstock can be found.
Colombia has three mountain ranges that emerge from the Andes. This makes the country’s altitude significantly vary over shorter distances. As it is in the Equator, there is no seasonal behavior, but a strong influence of the altitude over the climate, combined with the tropical weather, drives rain and droughts. Therefore, the country’s topography makes interconnection by pipes difficult, even by properly paved roads.
Surpassing the adversities, major pipelines have been built to transport oil and its derivates from the exploitation sites. Between oil and multipurpose pipelines, there are more than 6150 km interconnecting the extraction sites with different clusters and ports [46]. Most of the Casanare, Valle del Cauca, Meta, and the central part of Colombia are interconnected to the Caribbean coast, in Magdalena and Sucre ports. Additionally, more than 4000 km of gas pipelines start in Casanare, Meta, and Cauca regions and finish in Guajira, the upper coastline of the country.
If the preferred feedstock for blue hydrogen production is gas, there could be a chance to support the CO2 transportation infrastructure within the existing gas or oil infrastructure. Of course, gas pipelines should be repurposed, or new ones should be constructed to withstand the higher pressure of transportation of the chemical compound. Normally, the most economical way to transport CO2 is as a supercritical fluid (high density and low viscosity), with pressures above 13 Mpa [47]. Additionally, it should be assessed if the current gas reservoirs can support an EMR process as CCUS to make the whole system profitable. Equally, interconnection from the gas pipelines to the oil exploitation sites should be more developed to apply EOR.
The transport of coal from Guajira to the oil reservoirs in Casanare, being as long as 1500 km, is economically unfeasible because of the volumetric size of the raw material. Therefore, hydrogen production in situ could be the preferred method. Then, the transportation of CO2 products could be supported by the gas infrastructure that reaches this zone of the country. Just like the previous method, new or repurposed pipelines should be acquired.
Having in mind that Colombia is an agricultural country with almost 50 million inhabitants, biomass also has a high potential for blue hydrogen production. Summing up biowaste from the livestock sector, agricultural sector, and urban centers, 126 Mt are collected every year, reaching a potential energy value of 130,000 TJ, or approximately 4120 MW. This process may present large advantages if the technology keeps pushing forward and CCS are used [48]. Therefore, the use of biomass must be taken into account, avoiding the choice of sources with higher emissions [49].
The LCOH forecast in Colombia is shown in Figure 10, depending on the production method and considering only new projects could be developed. Grey hydrogen production by gas is currently the cheapest option, at $1.9/kgH2, and the blue counterparts get as high as $2.4/kgH2. The forecast is not encouraging, and more immediate actions should be taken [3].
In 2021, the government implemented the 2099 policy, which funds three different institutions to foster the utilization of renewable energies and energy efficiency, and creates benefits for the people who research in these areas, as well as deducts taxes for all the parts, elements, and machines such as inverters, PVs, etc. Additionally, the 1931 policy of 2018 encompasses the development of institutions that monitor climate change and consulting organizations that help in the decisions related to emissions and sustainability. Despite the policy developments, the laws are still subtle and short-sighted if the goal is producing 50 kt of blue hydrogen at $2.4/kgH2 by 2030 and having carbon neutrality as the final goal.
The Hydrogen Roadmap for Colombia realizes the lack of normativity and proposes some steps to be considered, such as the incentive of usage of blue hydrogen, the adoption of incentives for CCUS in the market and in new technologies, the possibility of adopting the market prices of CO2 emissions and regulate its taxation [3]. As the previous government is ending its ruling period, timing is paramount to accomplish the goals. Only eight years are left for 2030, and just the roadmap is written, with the 2169 policy requiring a 51% emissions reduction.
From the blue hydrogen perspective, the first step should be to approve the policy to foster the adoption of CCUS and basic CO2 emissions regulation. Then, there should be a strong partnership between the oil and gas companies, such as Empresa Colombiana de Petroleos (Ecopetrol), and the government, to encourage the development of Pilot and Demonstration CCUS facilities in the oil fields. In parallel, the technology for the gasification of coal–hydrogen production should be bid to an expert in the field, comprising the relationships with the raw material suppliers, e.g., Cerrejón. Likewise, the government needs to accurately write and pass the policies that push the whole blue hydrogen–CO2 emissions chain, creating new and attractive economic markets. Only after that basis is accomplished together with the deployment of a strong interconnection, clustering, CO2 storage, and required technologies, a more robust emission taxation should be passed, with a higher and more dynamic cost for the emitting industry.

4. Overview of Green Hydrogen Production in Colombia

As mentioned before, Colombia is a country privileged in its geographical location and natural resources. For example, the mountain ranges foster the coexistence of many different ecosystems at specific heights. The “Paramo” ecosystem, 50% of which is in Colombia, can collect up to 85% of the country’s drinking water. Consequently, hydroelectricity produced in Colombia corresponds to more than 70% [34] of the entire generation, and practically there is no more chance of expansion in this type of production. At the end of 2019, the total installed capacity between hydro and thermoelectric plants was close to 17.4 GW [50].
Just as the water flowing in the rivers was effectively used for Colombia’s electricity needs, new green resources such as the sun and the wind have been studied to support the energy transition. Once more, the outlook is positive in this aspect. In 2004, the first Onshore wind farm was installed in the Guajira region, where the winds reach velocities between 8 m/s to 10 m/s at 80 m, almost double the world average [50]. This northern part of the country can have an installed capacity of 25 GW onshore.
Concerning offshore wind, Figure 11 depicts the wind speed strength on Colombia’s Caribbean coast, where winds reach values greater than 10 m/s at 150 m above sea level. The capacity factors also can achieve values up to 65–69%. On the other hand, Colombia’s west coast only reaches values up to 6 m/s with lower CFs. Likewise, the center of the country has wind resources that can come up with CFs of 60% [50]. It must be noted that when the size of the turbines increases and the technology improves, the capacity factor can increase. For instance, 1.5 MW turbines from 2000 have a CF of 30%, and today’s turbine of 5 MW can reach 38% [50]. Currently, only one 17.5 MW onshore farm is installed, but the plan is to increase the number of wind farms.
Being right in the equator line guarantees that solar radiation will be higher than average. Guajira region and some of the northern part have solar radiation as high as some parts of the Sahara Desert, with estimates close to 6 kWh/m2/day. Other parts of the country reach values between 3.6 kWh/m2/day and 4.7 kWh/m2/day, with sun availability between 4.8 to 12 h. The irradiation map is similar to the one in Figure 11 for the northern part of Colombia. The installed capacity is not fully clear, but it was approximately 180 MW in 2020 and is intended to keep growing [51].
Figure 11. Wind resources in the northern part of Colombia [52].
Energies 15 08862 g011
The National Energy Plan (PNE) considers four different scenarios for developing its energy transition. The most challenging and optimistic (Disruption) includes using hydrogen in transportation and some industries, green hydrogen production, a decarbonization process, using only renewable energies (even nuclear) for electricity consumption, and massive technological development. The pessimistic scenario (Update) still relies on the economic model used nowadays by extraction of fossil fuels, low growth in renewables, and not a significant decarbonization process [53].
It must be considered that the target set in the hydrogen roadmap intends to reach values between 1 to 3 GW of electrolysis installed capacity at prices as low as $1.7/kgH2. Then the “Update” scenario should not be the path to take if the goals of the hydrogen roadmap are the ones to attain. Figure 12 displays the four scenarios, their participation in Colombia’s energy grid, and the share of fossil fuels vs. renewables per year [53].
Today, Colombia does not have a robust electrical infrastructure that interconnects the entire country, which is a primordial challenge to overcome in the short term. Additionally, standalone hydrogen systems (off-grid) are not economically feasible yet in a country without seasons [54]. This could discourage investment in renewables, considering that the strongest gaps of interconnection are in the north of the country, where these sources are stronger. Nevertheless, after a couple of energy auctions made in 2019, for the short term, 1390 MW were awarded for renewable energy: two PV projects of 238 MW and six onshore projects of 1160 MW, all located in the Guajira and Cesar Regions. The other auction, focused on the long-term supply, awarded eight projects (five between offshore and onshore wind and three PV) with a capacity of 1220 MW. Colombia’s first offshore project will be in Barranquilla, with a 350 MW installed capacity [53].
Considering that between 2004 and 2018, few were Colombia’s commitments in the energy transition, it is worth highlighting the various developments that have taken place in studies, dedicated resources, and commitments in the last three years. Under the previous scenario, the country is moving forward to attain the proposed goal of 2500 MW of installed capacity for 2022; by having other projects for the future, the confidence in an energy transition increases. Regarding the price of electricity for long-term projects, it would be approximately 22 to $25/MWh, which is the lowest price with the current technologies and situation of the country [53].
All these efforts are paving the way for green hydrogen production. Colombia realized there are optimal green resources and is heading towards its extraction. Its goal is to be the biggest Latin American exporter country of green hydrogen by 2030. This is a challenging task, considering Chile is forecasted as the strongest country in South America, with the most competitive prices. Colombia only published its Hydrogen Roadmap in the last couple of years and recently started two pilot electrolysis projects in the Magdalena and Bolivar regions [55].
Behind these couple of projects, two oil and gas companies are investing in Colombian energy’s future. Ecopetrol, a company producing hydrogen based on gas, financed a 50 kW PEM electrolyzer system fed by 270 solar PV with the capacity of producing up to 20 kg of H2 per day. Located in Cartagena, besides its gas refinery, this pilot will help them get insight into the system, including maintenance, scalability, and reliability for future projects. The next projects will focus on two electrolyzers feeding hydrogen to refueling stations for transportation [56]. On the other hand, Promigas will use 324 PV panels to produce up to 4.3 kg of H2 per day, with the possibility of expansion to 40 kg of H2 per day. The company focuses this pilot on decentralized production, distributed generation, transportation, and blending with gas processing [55]. Methane-hydrogen blending has proven to be efficient for several applications, including for internal combustion engines, also reducing emissions compared to the natural gas feedstock [57].
As the oil and gas companies have the know-how of fossil fuels extraction and transportation, tied with a good financial capacity, it is expected that the companies would take advantage of the encouraging goals of the government and start building a green hydrogen economy. This could help the energy transition process and give some insight into how Colombia can replace, at least for a percentage, its economic dependence on the export of fossil fuels by using green hydrogen in the future. It is to be noted that the locations chosen by these companies are close to commercial ports, which could benefit them if exports are to be started in the mid-term.
In contrast, if green hydrogen is to be supplied to Colombia, those two locations could take advantage of the existing oil and multipurpose pipeline infrastructures for reaching the urban centers, but at a high cost. The Guajira region would have the same issue, where hydrogen pipelines should have different properties to avoid gas diffusion. Then, an on-site methodology for green hydrogen production should be studied. Hydropower supply for green hydrogen could be an easy option to spot because of its installed capacity in Colombia and the economic benefit of having hydrogen as an energy storage technology. Two options can be followed: transport the hydrogen through pipelines or use the surplus of electricity to a supply point where the electrolysis process can be carried out [48]. The latter could be considered for the future, in parallel with the use of fuel cells for electricity supply under the existing grids.
It should be considered that subsequent processing of hydrogen could follow. Hydrogen can be transformed into energy carriers such as ammonia and e-fuels, including methane, methanol, and liquid hydrocarbons, which are usually produced from fossil fuels [58]. These can be mixed with current fuels to ease the energy transition [59]. In the meantime, more available fuel transportation solutions can exist under this transformation process, which is not the scope of this work, as well as different uses in the industry.
It is worth mentioning that the Colombian government will fund 10 projects as pre-investment studies in the pre-feasibility or feasibility stages for the hydrogen value chain. These projects encompass green hydrogen production, the transportation sector, and hydrogen usage [60]. Most of the hired firms are foreign companies with a subsidiary company or partnership in Colombia, meaning that the knowledge is mostly being imported. Recognizing that Colombia needs inner R & D to succeed in the energy transition, the Science Ministry and the Renewable Energy and Energy Efficiency organization launched a call for projects on hydrogen production with low emissions and carbon capture measurement, among others, with closure in late September 2022 [61]. Similarly, Universidad Nacional de Colombia has been developing different research projects focused on the hydrogen roadmap targets [62], but there is still a long way to go before reaching the demonstration stage. Therefore, the maturity of these technologies in Colombia, as measured by their Technology Readiness Level (TRL), is in their initial steps (1–3).
The Colombian government must continue promoting energy transition and policies to increase investment and local R & D in this area. More importantly, the market needs to be developed to have the required profits to make it a sustainable economy. On the inside, the transportation sector needs substantial investments from the government to switch the current fossil fuel fleet technology and reduce emissions.

5. Conclusions

As climate change becomes more evident, several countries are setting additional goals to reduce emissions and limit the global temperature increase. Population growth and consequent energy consumption need to be supplied following strategies that minimize greenhouse gas emissions. Hydrogen, the most abundant element on earth, is one piece of the puzzle to solve the hard-to-abate industrial and transportation needs.
Several methods can be used to obtain hydrogen, but few have no prejudicial results. Blue hydrogen is a potential opportunity for oil and gas companies, as the CO2 could be used to generate profit from the existing oil reservoirs by giving the chance to extract more from them. More investment should be made in this blue technology, and more pilots should be carried out in the oil and gas-producing countries. Once the profit is assessed and the environmental impacts studied, infrastructure can be constructed, as expected in Colombia’s case. If the previous specifications are met, this country can take advantage of its coal supplies to produce a competitive hydrogen economy. In addition, the government should approve specific policies for the right taxation of CO2 emissions to foster blue hydrogen production together with the green technique.
Even when its emissions are not that extreme, Colombia is a country with an incredible potential to produce green and blue hydrogen. Its natural resources, location, and diversity have significant advantages over most countries, such as high irradiation, wind speed, hydropower, and coal reserves. Future dynamics and success will be limited mostly by the market and government. With the right sum of those two, the 2030 goals for hydrogen production will be attained at competitive prices.

Author Contributions

Conceptualization, S.M.; methodology, S.M. and D.M.F.S.; investigation, S.M.; writing—original draft preparation, S.M.; writing—review and editing, D.M.F.S.; supervision, D.M.F.S. All authors have read and agreed to the published version of the manuscript.

Funding

Fundação para a Ciência e a Tecnologia (FCT, Portugal) is acknowledged for funding a research contract in the scope of programmatic funding UIDP/04540/2020 (D.M.F.S.).

Data Availability Statement

The data presented in this study are available on request from the corresponding author.

Conflicts of Interest

The authors declare no conflict of interest. The funders had no role in the design of the study; in the collection, analyses, or interpretation of data; in the writing of the manuscript; or in the decision to publish the results.

References

  1. da Silva Veras, T.; Mozer, T.S.; da Costa Rubim Messeder dos Santos, D.; da Silva César, A. Hydrogen: Trends, Production and Characterization of the Main Process Worldwide. Int. J. Hydrogen Energy 2017, 42, 2018–2033. [Google Scholar] [CrossRef]
  2. International Energy Agency (IEA). Global Hydrogen Review 2021. Available online: https://iea.blob.core.windows.net/assets/5bd46d7b-906a-4429-abda-e9c507a62341/GlobalHydrogenReview2021.pdf (accessed on 9 May 2022).
  3. Ministerio de Minas y Energía—Gobierno Colombiano. Hoja de Ruta del Hidrógeno en Colombia. Bogotá, Colombia; 2022. Available online: https://www.minenergia.gov.co/static/ruta-hidrogeno/src/document/Hoja%20Ruta%20Hidrogeno%20Colombia_2810.pdf (accessed on 8 May 2022).
  4. Energy Ministery of Chile. Plataforma de Electromovilidad—Conceptos de Hidrógeno Verde. 2018. Available online: https://energia.gob.cl/electromovilidad/hidrogeno-verde/definiciones-generales (accessed on 12 May 2022).
  5. Pareek, A.; Dom, R.; Gupta, J.; Chandran, J.; Adepu, V.; Borse, P.H. Insights into Renewable Hydrogen Energy: Recent Advances and Prospects. Mater. Sci. Energy Technol. 2020, 3, 319–327. [Google Scholar] [CrossRef]
  6. Dincer, I. Green Methods for Hydrogen Production. Int. J. Hydrogen Energy 2012, 37, 1954–1971. [Google Scholar] [CrossRef]
  7. Liu, Y.; Min, J.; Feng, X.; He, Y.; Liu, J.; Wang, Y.; He, J.; Do, H.; Sage, V.; Yang, G.; et al. A Review of Biohydrogen Productions from Lignocellulosic Precursor via Dark Fermentation: Perspective on Hydrolysate Composition and Electron-Equivalent Balance. Energies 2020, 13, 2451. [Google Scholar] [CrossRef]
  8. Kayfeci, M.; Keçebaş, A.; Bayat, M. Chapter 3—Hydrogen production. In Solar Hydrogen Production. Processes, Systems and Technologies; Academic Press: Cambridge, MA, USA, 2019; pp. 45–83. [Google Scholar] [CrossRef]
  9. U.S. Department of Energy; National Energy Technology. Laboratory. Gasification Systems. Available online: https://www.netl.doe.gov/carbon-management/gasification (accessed on 13 May 2022).
  10. Sharma, S.; Agarwal, S.; Jain, A. Significance of Hydrogen as Economic and Environmentally Friendly Fuel. Energies 2021, 14, 7389. [Google Scholar] [CrossRef]
  11. Valverde, M. Hydrogen from Coal. Coal Age; 2021. Available online: https://www.coalage.com/features/hydrogen-from-coal/ (accessed on 24 May 2022).
  12. Onozaki, M.; Watanabe, K.; Hashimoto, T.; Saegusa, H.; Katayama, Y. Hydrogen Production by the Partial Oxidation and Steam Reforming of Tar from Hot Coke Oven Gas. Fuel 2006, 85, 143–149. [Google Scholar] [CrossRef]
  13. U.S. Department of Energy; Energy Efficiency & Renewable Energy. Hydrogen Production: Natural Gas Reforming. Available online: https://www.energy.gov/eere/fuelcells/hydrogen-production-natural-gas-reforming (accessed on 18 May 2022).
  14. Zoppi, G.; Pipitone, G.; Pirone, R.; Bensaid, S. Aqueous Phase Reforming Process for the Valorization of Wastewater Streams: Application to Different Industrial Scenarios. Catal. Today 2022, 387, 224–236. [Google Scholar] [CrossRef]
  15. Pipitone, G.; Zoppi, G.; Pirone, R.; Bensaid, S. A Critical Review on Catalyst Design for Aqueous Phase Reforming. Int. J. Hydrogen Energy 2022, 47, 151–180. [Google Scholar] [CrossRef]
  16. Sanchez, N.; Rodríguez-Fontalvo, D.; Cifuentes, B.; Cantillo, N.M.; Uribe Laverde, M.Á.; Cobo, M. Biomass Potential for Producing Power via Green Hydrogen. Energies 2021, 14, 8366. [Google Scholar] [CrossRef]
  17. Ni, M.; Leung, D.Y.C.; Leung, M.K.H.; Sumathy, K. An Overview of Hydrogen Production from Biomass. Fuel Process. Technol. 2006, 87, 461–472. [Google Scholar] [CrossRef]
  18. Kalinci, Y.; Hepbasli, A.; Dincer, I. Biomass-Based Hydrogen Production: A Review and Analysis. Int. J. Hydrogen Energy 2009, 34, 8799–8817. [Google Scholar] [CrossRef]
  19. International Renewable Energy Agency. Global Hydrogen Trade to Meet the 1.5 °C Climate Goal: Part III—Green Hydrogen Cost and Potential. Abu Dhabi, United Arab Emirates. 2022. Available online: https://www.irena.org/-/media/Files/IRENA/Agency/Publication/2022/May/IRENA_Global_Hydrogen_Trade_Costs_2022.pdf (accessed on 18 May 2022).
  20. Sebbahi, S.; Nabil, N.; Alaoui-Belghiti, A.; Laasri, S.; Rachidi, S.; Hajjaji, A. Assessment of the Three Most Developed Water Electrolysis Technologies: Alkaline Water Electrolysis, Proton Exchange Membrane and Solid-Oxide Electrolysis. Mater. Today 2022, 66, 140–145. [Google Scholar] [CrossRef]
  21. Hussy, C. Water Electrolysis Explained—The Basis for Most Power-to-X Processes. 2022. Available online: https://ptx-hub.org/water-electrolysis-explained (accessed on 5 July 2022).
  22. Santos, A.L.; Cebola, M.-J.; Santos, D.M.F. Towards the Hydrogen Economy—A Review of the Parameters That Influence the Efficiency of Alkaline Water Electrolyzers. Energies 2021, 14, 3193. [Google Scholar] [CrossRef]
  23. Levene, J.I.; Mann, M.K.; Margolis, R.M.; Milbrandt, A. An Analysis of Hydrogen Production from Renewable Electricity Sources. Sol. Energy 2007, 81, 773–780. [Google Scholar] [CrossRef]
  24. Glaister, B.J.; Mudd, G.M. The Environmental Costs of Platinum–PGM Mining and Sustainability: Is the Glass Half-Full or Half-Empty? Miner. Eng. 2010, 23, 438–450. [Google Scholar] [CrossRef]
  25. Kraglund, M.R.; Carmo, M.; Schiller, G.; Ansar, S.A.; Aili, D.; Christensen, E.; Jensen, J.O. Ion-Solvating Membranes as a New Approach towards High Rate Alkaline Electrolyzers. Energy Environ. Sci. 2019, 12, 3313–3318. [Google Scholar] [CrossRef] [Green Version]
  26. Angeles-Olvera, Z.; Crespo-Yapur, A.; Rodríguez, O.; Cholula-Díaz, J.L.; Martínez, L.M.; Videa, M. Nickel-Based Electrocatalysts for Water Electrolysis. Energies 2022, 15, 1609. [Google Scholar] [CrossRef]
  27. Bespalko, S.; Mizeraczyk, J. Overview of the Hydrogen Production by Plasma-Driven Solution Electrolysis. Energies 2022, 15, 7508. [Google Scholar] [CrossRef]
  28. Jovan, D.J.; Dolanc, G. Can Green Hydrogen Production Be Economically Viable under Current Market Conditions. Energies 2020, 13, 6599. [Google Scholar] [CrossRef]
  29. International Energy Agency (IEA). Average Annual Capacity Factors by Technology. 2018. Available online: https://www.iea.org/data-and-statistics/charts/average-annual-capacity-factors-by-technology-2018 (accessed on 5 July 2022).
  30. International Renewable Energy Agency. Renewable Power Generation Costs in 2020 Abu Dhabi, United Arab Emirates. 2021. Available online: https://www.irena.org/-/media/Files/IRENA/Agency/Publication/2021/Jun/IRENA_Power_Generation_Costs_2020.pdf (accessed on 15 September 2022).
  31. Hargrave, M. Investopedia.Weighted Average Cost of Capital (WACC) Explained with Formula and Example. 8 August 2022. Available online: https://www.investopedia.com/terms/w/wacc.asp (accessed on 30 June 2022).
  32. International Renewable Energy Agency. Hydrogen from Renewable Power: Technology Outlook for the Energy Transition. Abu Dhabi, United Arab Emirates. 2018. Available online: https://www.irena.org/-/media/Files/IRENA/Agency/Publication/2018/Sep/IRENA_Hydrogen_from_renewable_power_2018.pdf (accessed on 30 June 2022).
  33. International Energy Agency (IEA). Putting CO2 to Use. Creating Value from Emissions. 2019. Available online: https://iea.blob.core.windows.net/assets/50652405-26db-4c41-82dc-c23657893059/Putting_CO2_to_Use.pdf (accessed on 19 May 2022).
  34. Tapia, J.F.D.; Lee, J.-Y.; Ooi, R.E.H.; Foo, D.C.Y.; Tan, R.R.A. Review of Optimization and Decision-Making Models for the Planning of CO2 Capture, Utilization and Storage (CCUS) Systems. Sustain. Prod. Consum. 2018, 13, pp. 1–15. [CrossRef]
  35. Global CCS Institute. Global status of CCS 2020. Available online: https://www.globalccsinstitute.com/wp-content/uploads/2021/03/Global-Status-of-CCS-Report-English.pdf (accessed on 15 May 2022).
  36. Hydrocarbon Engineering, Axens White Paper. Carbon Capture and Storage, a Necessary Tool to Fight Climate ChangeAxens: Houston, TX, USA. 2021. Available online: https://ppweb-media.s3.eu-west-1.amazonaws.com/whitepapers/files/Axens_WP_CCS_2022_EN.pdf (accessed on 15 May 2022).
  37. Promigas. Informe del Sector Gas Natural. 2021. Available online: http://52.247.87.160:52345/SiteAssets/ISGN%20COL%202021.pdf (accessed on 27 May 2022).
  38. Unidad de Planeación Minero Energética. El Carbón Colombiano Fuente de Energía Para el Mundo. Bogota, Colombia; 2007. Available online: http://www.upme.gov.co/docs/cadena_carbon.pdf (accessed on 23 June 2022).
  39. Unidad de Planeación Minero Energética. Zonas Carboníferas de Colombi. Bogota, Colombia; 2007. Available online: http://www.upme.gov.co/guia_ambiental/carbon/areas/zonas/indice.htm (accessed on 27 June 2022).
  40. International Energy Agency (IEA). Colombia. 2021. Available online: https://www.iea.org/countries/colombia (accessed on 28 June 2022).
  41. Lenton, C. Colombia’s Oil, Natural Gas Reserves Said Rapidly Dwindling. Natural Gas Intelligence. 2021. Available online: https://www.naturalgasintel.com/colombias-oil-natural-gas-reserves-said-dwindling-rapidly/ (accessed on 27 May 2022).
  42. Kosakowski, P. What Determines Oil Prices? Dotdash Meredith. 2021. Available online: https://www.investopedia.com/articles/economics/08/determining-oil-prices.asp#toc-the-bottom-line (accessed on 27 May 2022).
  43. Yáñez, É; Meerman, H.; Ramírez, A.; Castillo, É; Faaij, A. Fully Integrated CO2 Mitigation Strategy for an Existing Refinery: A Case Study in Colombia. Appl. Energy 2022, 313, 118771. [Google Scholar] [CrossRef]
  44. Nwidee, L.N.; Theophilus, S.; Barifcani, A.; Sarmadivaleh, M.; Iglauer, S. EOR Processes, Opportunities and Technological Advancements. In Chemical Enhanced Oil Recovery (cEOR)—A Practical Overview; Romero-Zeron, L., Ed.; IntechOpen: London, UK, 2016. [Google Scholar] [CrossRef] [Green Version]
  45. Suarez, A.L. El País se Alista para Contar con Cuatro Plantas Regasificadoras. Portafolio, 2020. Available online: https://www.portafolio.co/economia/gas-natural-colombia-se-alista-para-contar-con-cuatro-plantas-regasificadoras-545352(accessed on 25 June 2020).
  46. Cenit. Descripción de la Red. 2015. Available online: https://cenit-transporte.com/que-hacemos/ (accessed on 29 June 2022).
  47. Kenton, C.; Silton, B. Repurposing Natural Gas Lines: The CO2 Opportunity. ADL Ventures. 2020. Available online: https://adlventures.com/repurposing-natural-gas-lines-the-co2-opportunity/ (accessed on 28 June 2022).
  48. Castiblanco, O.; Cárdenas, D.J. Producción de Hidrógeno y Su Perspectiva En Colombia: Una Revisión. Gest. Ambient. 2020, 23, 299–311. [Google Scholar] [CrossRef]
  49. Moreno, J.; Cobo, M.; Barraza-Botet, C.; Sanchez, N. Role of Low Carbon Emission H2 in the Energy Transition of Colombia: Environmental Assessment of H2 Production Pathways for a Certification Scheme. Energy Convers. Manag. X 2022, 16, 100312. [Google Scholar] [CrossRef]
  50. Pinilla, Á. Á. Notas de Lectura—Curso Electivo Energía Eólica; Departamento de Ingeniería Mecánica: Bogota, Colombia, 2020; Available online: https://tinyurl.com/an7fyvxe (accessed on 30 June 2022).
  51. Deutsche Gesellschaft für Internationale Zusammenarbeit (GIZ) GmbH. Implementación de Fuentes No Convencionales de Energías Renovables (FNCER) en el Sector Minero Colombiano. Bonn, Germany; 2021; Available online: https://ser-colombia.org/wp-content/uploads/2021/02/FNCER-en-el-sector-minero-Colombia-1.pdf (accessed on 30 June 2022).
  52. The Renewables Consulting Group & ERM. Hoja de Ruta Para el Despliegue de la Energía Eólica Costa Afuera en Colombia. 2021. Available online: https://www.minenergia.gov.co/static/ruta-eolica-offshore/src/document/Colombia%20Offshore%20Wind%20Roadmap%20VE.pdf (accessed on 23 June 2022).
  53. Unidad de Planeación Minero Energética. Plan Energético Nacional 2020–2050: La Transformación Energética Que Habilita el Desarrollo Sostenible. Bogota, Colombia; 2020. Available online: https://www1.upme.gov.co/DemandayEficiencia/Documents/PEN_2020_2050/Plan_Energetico_Nacional_2020_2050.pdf (accessed on 4 July 2022).
  54. Gracia, L.; Casero, P.; Bourasseau, C.; Chabert, A. Use of Hydrogen in Off-Grid Locations, a Techno-Economic Assessment. Energies 2018, 11, 3141. [Google Scholar] [CrossRef] [Green Version]
  55. Portafolio. Promigas y Ecopetrol Arrancan Con Los Pilotos De Hidrógeno. 2022. Available online: https://www.portafolio.co/negocios/empresas/promigas-y-ecopetrol-arrancan-con-los-pilotos-de-hidrogeno-563063 (accessed on 7 July 2022).
  56. Forbes. Promigas Activa Electrolizador Que Inyecta Hidrógeno Verde en Las Redes De Hidrógeno. 2022. Available online: https://forbes.co/2022/03/18/negocios/promigas-activa-electrolizador-que-inyecta-hidrogeno-verde-en-las-redes-de-hidrogeno-verde/ (accessed on 7 July 2022).
  57. Makaryan, I.A.; Sedov, I.V.; Salgansky, E.A.; Arutyunov, A.V.; Arutyunov, V.S. A Comprehensive Review on the Prospects of Using Hydrogen–Methane Blends: Challenges and Opportunities. Energies 2022, 15, 2265. [Google Scholar] [CrossRef]
  58. Mallouppas, G.; Ioannou, C.; Yfantis, E.A. A Review of the Latest Trends in the Use of Green Ammonia as an Energy Carrier in Maritime Industry. Energies 2022, 15, 1453. [Google Scholar] [CrossRef]
  59. Siemens Energy. Hydrogen Solutions. 2020. Available online: https://www.siemens-energy.com/global/en/offerings/renewable-energy/hydrogen-solutions.html/ (accessed on 7 July 2022).
  60. Minenergia. El Gobierno Financiará 10 Proyectos de Estudios Para el Desarrollo de Hidrógeno Verde y Azul en Colombia por Más de $6500 Millones. 2022. Available online: https://www.minenergia.gov.co/es/sala-de-prensa/noticias-index/el-gobierno-financiar%C3%A1-10-proyectos-de-estudios-para-el-desarrollo-de-hidr%C3%B3geno-verde-y-azul-en-colombia-por-m%C3%A1s-de-6500-millones/ (accessed on 9 November 2022).
  61. Minciencias. Convocatoria para el Apoyo de Proyectos en: Medición de Captura y Secuestro de Carbono y Procesos de Generación de Hidrógeno de Bajas Emisiones. 2022. Available online: https://minciencias.gov.co/convocatorias/innovacion-y-productividad/convocatoria-para-el-apoyo-proyectos-en-medicion-captura-y (accessed on 10 November 2022).
  62. National University of Colombia (UNAL). Avanza con Pasos Firmes en la Hoja de Ruta del Hidrógeno. 2022. Available online: http://agenciadenoticias.unal.edu.co/detalle/unal-avanza-con-pasos-firmes-en-la-hoja-de-ruta-del-hidrogeno (accessed on 10 November 2022).
Figure 1. Hydrogen demand by sectors in 2 different scenarios listed as (a) announced pledge scenarios stated by governments and (b) net-zero emission scenario by 2050 [2].
Energies 15 08862 g001
Figure 2. Hydrogen production by the coal gasification process [8]. Reprinted with permission from Elsevier.
Energies 15 08862 g002
Figure 3. Green (electrolysis) and blue hydrogen production in different scenarios [2].
Energies 15 08862 g003
Figure 4. Simplified scheme of the water electrolysis process [21].
Energies 15 08862 g004
Figure 5. LCOH produced by different means vs. generation technology ratio and CF for NZE scenario [19].
Energies 15 08862 g005
Figure 6. Comparison of hydrogen production costs with different technologies and scenarios [2].
Energies 15 08862 g006
Figure 7. Forecast for CO2 future global demand (a): average growth of 1.7% yearly; (b) 2015 demand by sector [33].
Energies 15 08862 g007
Figure 8. CCUS structure with different storage and utilization paths [34]. Reprinted with permission from Elsevier.
Energies 15 08862 g008
Figure 9. Coal reservoirs map in Colombia, by state (adapted from [39]).
Energies 15 08862 g009
Figure 10. LCOH of coal and natural gas for blue and grey H2 production [3].
Energies 15 08862 g010
Figure 12. Evolution of the energy mix in Colombia, including (a) the share of renewable energy, accounting for nuclear and hydrogen, and (b) the share of fossil fuels [53].
Energies 15 08862 g012
Table 1. Techno-economic characteristics of alkaline and PEM electrolyzers [33].
Electrolyzer TechnologyAlkalinePEM
Unit2017202520172025
EfficiencykWh electricity per kg H251495852
Efficiency (LHV)%65685764
Lifetime stackOperating hours80,00090,00040,00050,000
CAPEX-total system cost (incl. power supply and installation costs$/kW7504801200700
OPEX% of initial CAPEX/year2222
CAPEX-stack replacement$/kW340215420210
Typical output pressurebarAtmospheric153060
System lifetimeYears2020
Publisher’s Note: MDPI stays neutral with regard to jurisdictional claims in published maps and institutional affiliations.