Article

Intelligent Identification of Cavitation State of Centrifugal Pump Based on Support Vector Machine

1
School of Energy and Power Engineering, North China University of Water Resources and Electric Power, Zhengzhou 450045, China
2
Research Center of Fluid Machinery Engineering and Technology, Jiangsu University, Zhenjiang 212013, China
*
Author to whom correspondence should be addressed.
Energies 2022, 15(23), 8907; https://doi.org/10.3390/en15238907
Submission received: 2 November 2022 / Revised: 20 November 2022 / Accepted: 22 November 2022 / Published: 25 November 2022

Abstract

:
In order to perform intelligent identification of the various stages of cavitation development, a micro high-speed centrifugal pump was used as a research object for vibration signal analysis and feature extraction for normal, incipient cavitation, cavitation and severely cavitated operating states of the pump at different temperatures (25 °C, 50 °C and 70 °C), based on support vector machines to classify and identify the eigenvalues in different cavitation states. The results of the study showed that the highest recognition rate of the individual eigenvalues of the time domain signals, followed by time frequency domain signals and finally frequency domain signals, was achieved in the binary classification of whether cavitation occurred or not. In the multi-classification recognition of the cavitation state, the eigenvalues of the time domain signals of the four monitoring points, the time frequency domain signals of the monitoring points in the X-direction of the inlet pipe and the Y-direction of the inlet pipe are combined, and the combined eigenvalues can achieve a multi-classification recognition rate of more than 94% for the cavitation state at different temperatures, which is highly accurate for the recognition of the cavitation state of centrifugal pumps.

1. Introduction

Cavitation is a multiphase flow phenomenon containing complex phase changes and is widely present in the actual operation of hydraulic machinery, especially centrifugal pumps. The development of cavitation to a certain stage will reduce the pump performance, and the collapse of the bubbles will produce large numbers of micro-jets. This phenomenon impacts the pump’s overflow components causing damage, which seriously affects operating system stability [1,2,3,4]. Therefore, the identification and real-time monitoring of the cavitation state can control the operating condition of the centrifugal pump in a timely manner and prevent operational faults, which is of great significance for the safety and stability of a fluid transfer operation system. The automobile cooling water pump is a special centrifugal pump that operates at relatively high speed and high temperature, and in this environment cavitation often appears. It is very important for the stable operation of the automobile cooling system to identify the cavitation state of the circulating pump at different temperatures.
Many scholars have conducted studies on cavitation monitoring and identification. Farhat et al. [5] collected vibration signals from a hydraulic turbine during cavitation, extracted features and performed cavitation state identification using statistical methods and frequency domain analysis. In order to improve accuracy of recognition, Xue et al. [6] extracted features from the optimal frequency range of vibration signals collected under the cavitation operation of a centrifugal pump and obtained the optimal hyperplane for classifying cavitation states by training with a support vector machine (SVM). McKee et al. [7] proposed a methodology based upon adaptive octave bands, principal component analysis and statistical data to detect cavitation occurrence in a centrifugal pump. Azizi et al. [8] proposed a hybrid eigenvalue selection algorithm that uses empirical modal decomposition for the eigenvalue selection of signals and feeds the selected eigenvalues into a generalized regression neural network for recognition. It was found that the selected eigenvalues not only reduce the number of eigenvalues needed and improve the accuracy of recognition, but also determine the optimal eigen modal function for cavitation recognition. Giorgi et al. [9,10] collected pressure pulsation signals and transient photographs of the cavitation flow field behind the orifice, Artificial neural networks were used to effectively extract the frequency band features of different cavitation states at different temperatures, and wavelet decomposition was used to extract the frequency features of the pressure pulsation signals, comparing and analyzing the effect of two intelligent algorithms, artificial neural networks and least squares support vector machines, on the recognition of cavitation states. Sun et al. [11] used the motor current signal (MCSA) analysis technique, using the Hilbert–Huang transform (HHT), to improve the accuracy and reliability of feature extraction based on cavitation characteristics. Yang et al. [12] proposed a condition monitoring scheme using statistical feature evaluation and support vector machines (SVM) to detect cavitation conditions in the butterfly valves of flow control valves in pumping stations, classifying normal and cavitation conditions in control valves. Cao et al. [13] proposed a deep learning-based cavitation state recognition method for centrifugal pumps, in which vibration signals at the pump worm casing were collected under three operating conditions, improved octave band and time frequency features were constructed, and the feature sets were input into a deep neural network to classify the four cavitation states. The use of machine learning methods for fault diagnosis is a current frontier and hot topic in the discipline. Ge et al. [14,15,16,17] conducted an experimental study on the effect of temperature on the hydrodynamic cavitation flow in venturi tubes to analyze and compare the cavitation intensity and state changes at different flow rates and temperatures, and to classify the cavitation flow states due to thermodynamic effects by dynamic model analysis, which was later justified by Wu et al. [18]. However, application in pump operation condition monitoring is still relatively small, and how to carry out the identification of cavitation efficiently and accurately still needs to be examined in depth.
The focus of this study is on the monitoring and identification of the different cavitation states of centrifugal pumps at different temperatures (25 °C, 50 °C and 70 °C) based on support vector machines (SVM). The vibration signals under different cavitation states are extracted [19], the extracted eigenvalues are used to train the support vector machine and the grid search method is used to find the optimal parameters of the support vector machine, to establish the centrifugal pump cavitation state monitoring model and verify the validity of the model and to provide a theoretical basis for the monitoring and diagnosis of the centrifugal pump operation state.

2. Experimental Steps

Model Pump Parameters

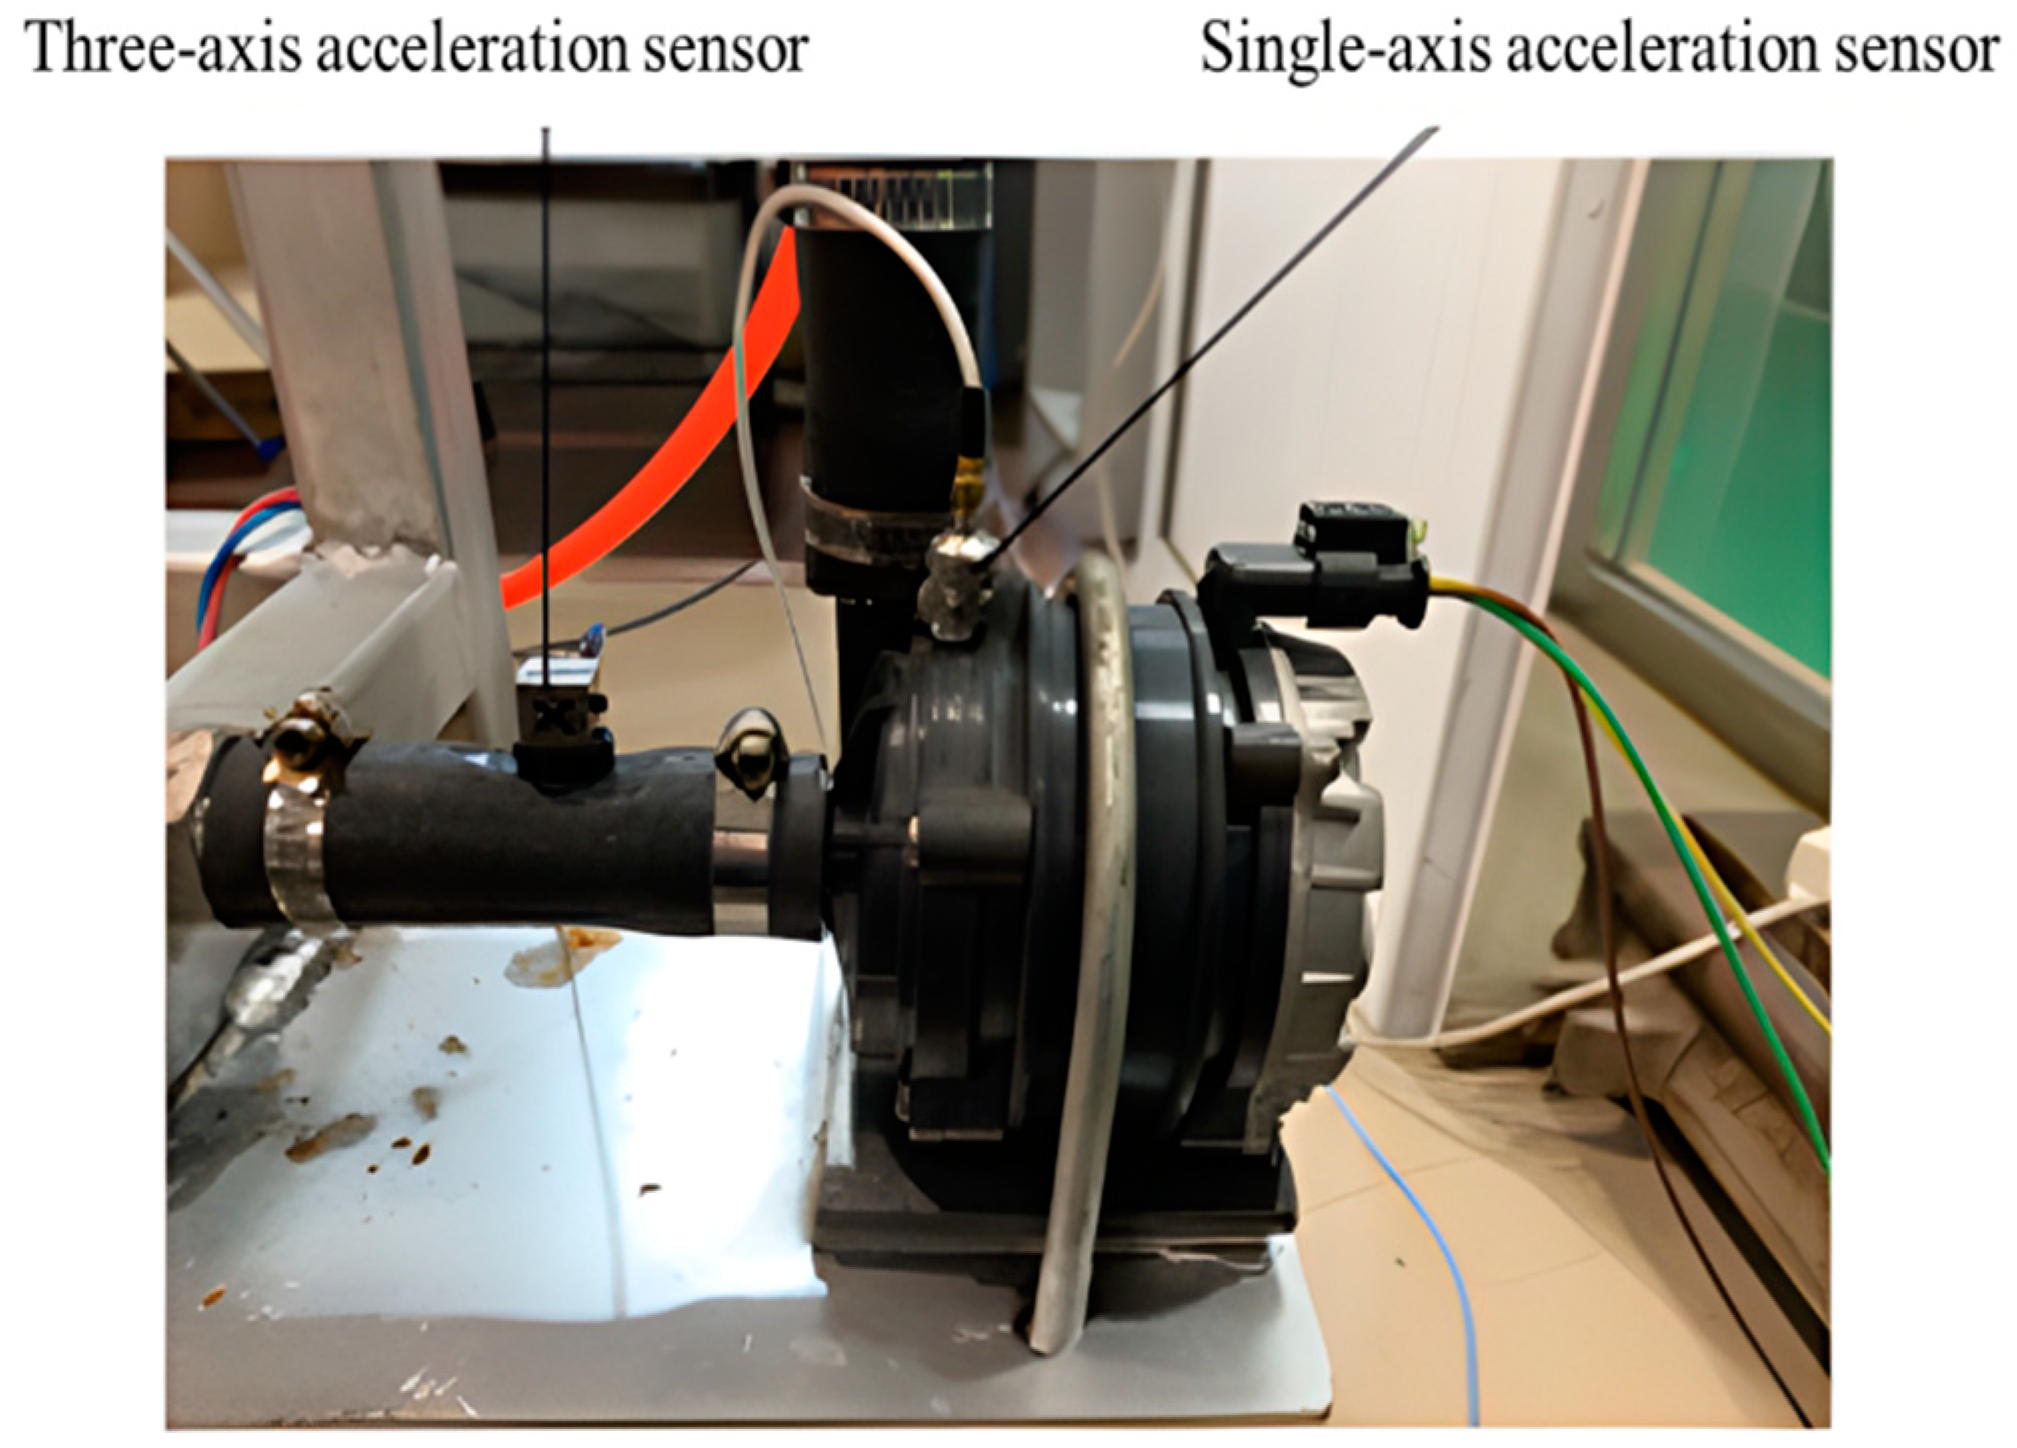
In order to obtain the original signals of different cavitation states, a centrifugal pump cavitation performance test rig was built, including a vacuum pump, heating tank, solenoid valve, electromagnetic flow meter, inlet and outlet pressure sensors, PSW30-36 DC power supply and test pump, as shown in Figure 1. The test pump is a miniature high-speed centrifugal pump with a specific speed of 81, and its design parameters are: design head Hd = 7.54 m, design flow rate Qd = 1.25 m3/h, design speed n = 4800 r/min. The vibration signal acquisition module consists of a PCB352A60 single-axis acceleration sensor at the snail casing spacer, a PCB356B21 triaxial acceleration sensor at the inlet pipe and an NI USB-4472 acquisition card. The NI USB-4472 acquisition card for the composition, vibration acceleration sensor arrangement as shown in Figure 2.
The test was carried out using a PMW pulse frequency generator and a vacuum pump to regulate the operating conditions of the pump, collecting performance parameters and vibration signals at three temperatures (25 °C, 50 °C and 70 °C) at a flow rate of 1.0 Qd under four operating conditions: normal operation, incipient cavitation (1% drop in head), cavitation (3% drop in head) and severe cavitation (6% drop in head). The sampling frequency was set to 12.8 kHz, with a sampling time of 1s per set, and a total of 300 sets of samples were taken for each state.
The external characteristics of the pump can be calculated by using the head coefficient ψ as follows, which is extracted from the studies conducted by Asad et. al. [20,21,22,23]:
ψ = g H u 2 2 / 2
where H is the head corresponding to the different working conditions; u 2 is the exit circumferential speed of the impeller.
The cavitation number is a dimensionless parameter characterizing the cavitation state and is calculated as:
σ = p i n p v 0.5 ρ u 2 2
where p i n is the centrifugal pump inlet pressure; p v is the saturated vapor pressure of the liquid at the corresponding temperature.
Figure 3 shows the cavitation performance curve of a centrifugal pump at a rated speed of 4800 r/min with a medium temperature of 25 °C. As can be seen from the graph, the head coefficient remains almost constant at the initial stage, and as the cavitation number slowly decreases, the head coefficient suddenly plummets when a critical point is reached. The cavitation number corresponding to a 3% drop in head is defined as the critical cavitation number. In engineering, when the head drops by 3%, cavitation already occurs at the impeller inlet of the centrifugal pump, and the degree of cavitation can already affect the performance of the pump.

3. Signal Analysis and Feature Extraction

Support vector machines usually require multiple eigenvalues to describe the fault form of a device, and then classify the device faults in a space consisting of eigenvalues. The accuracy of the eigenvalue extraction has a significant impact on the accuracy of the fault classification and hence the need for effective eigenvalue extraction methods.

3.1. Time Domain Feature Extraction

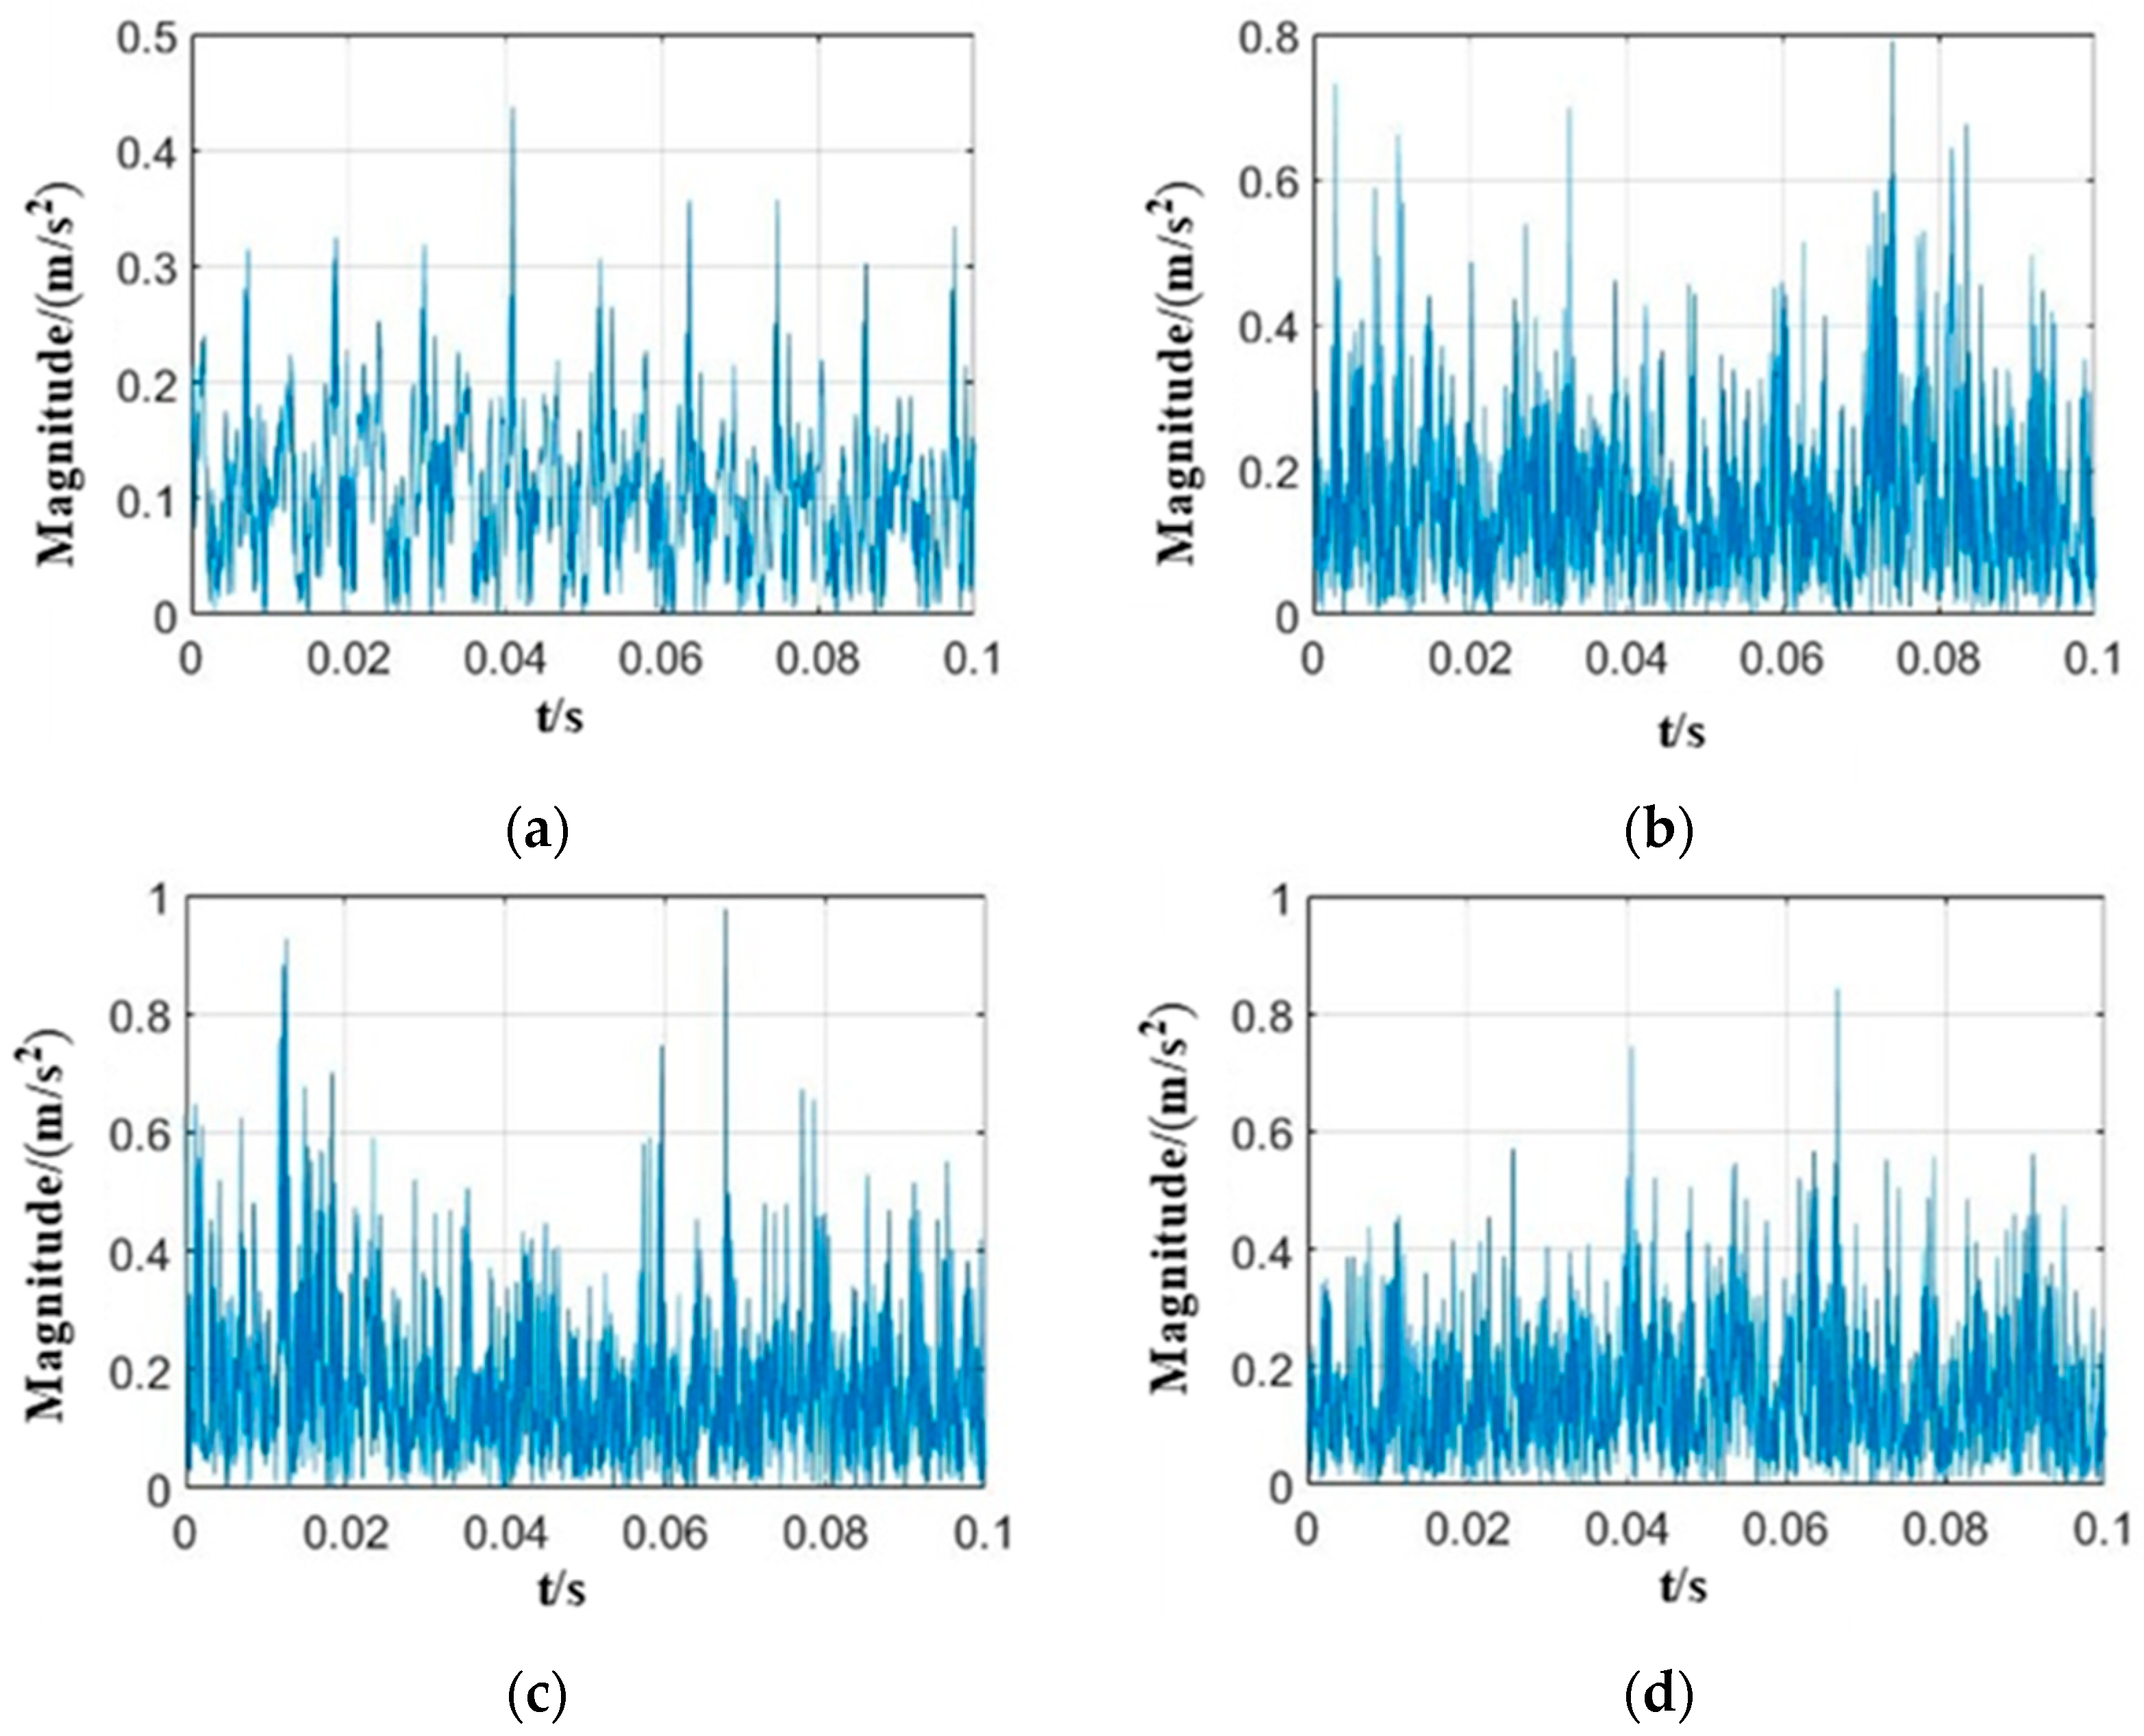
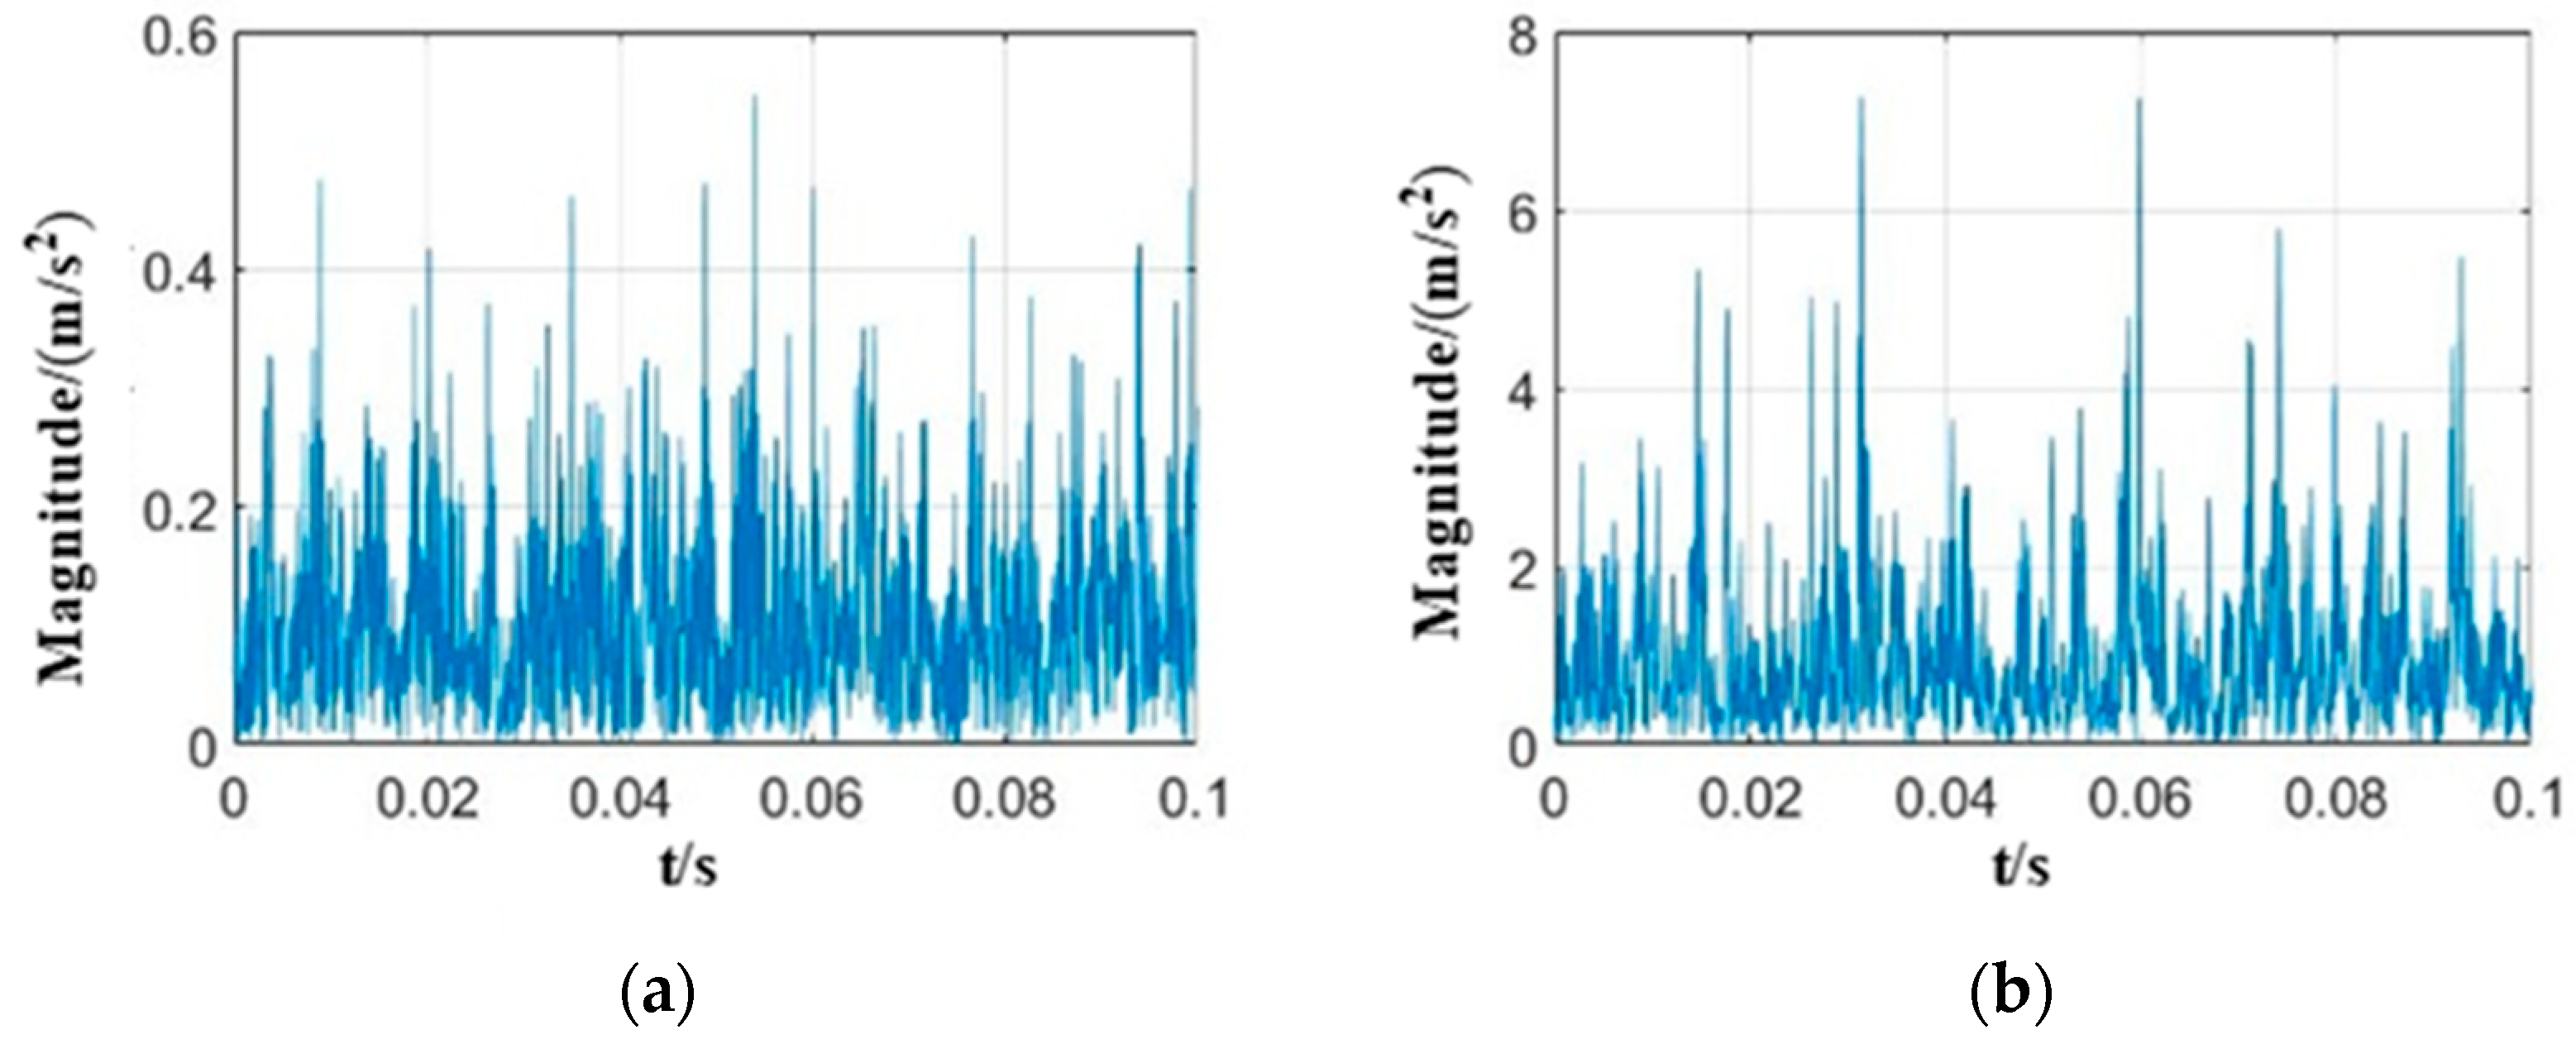
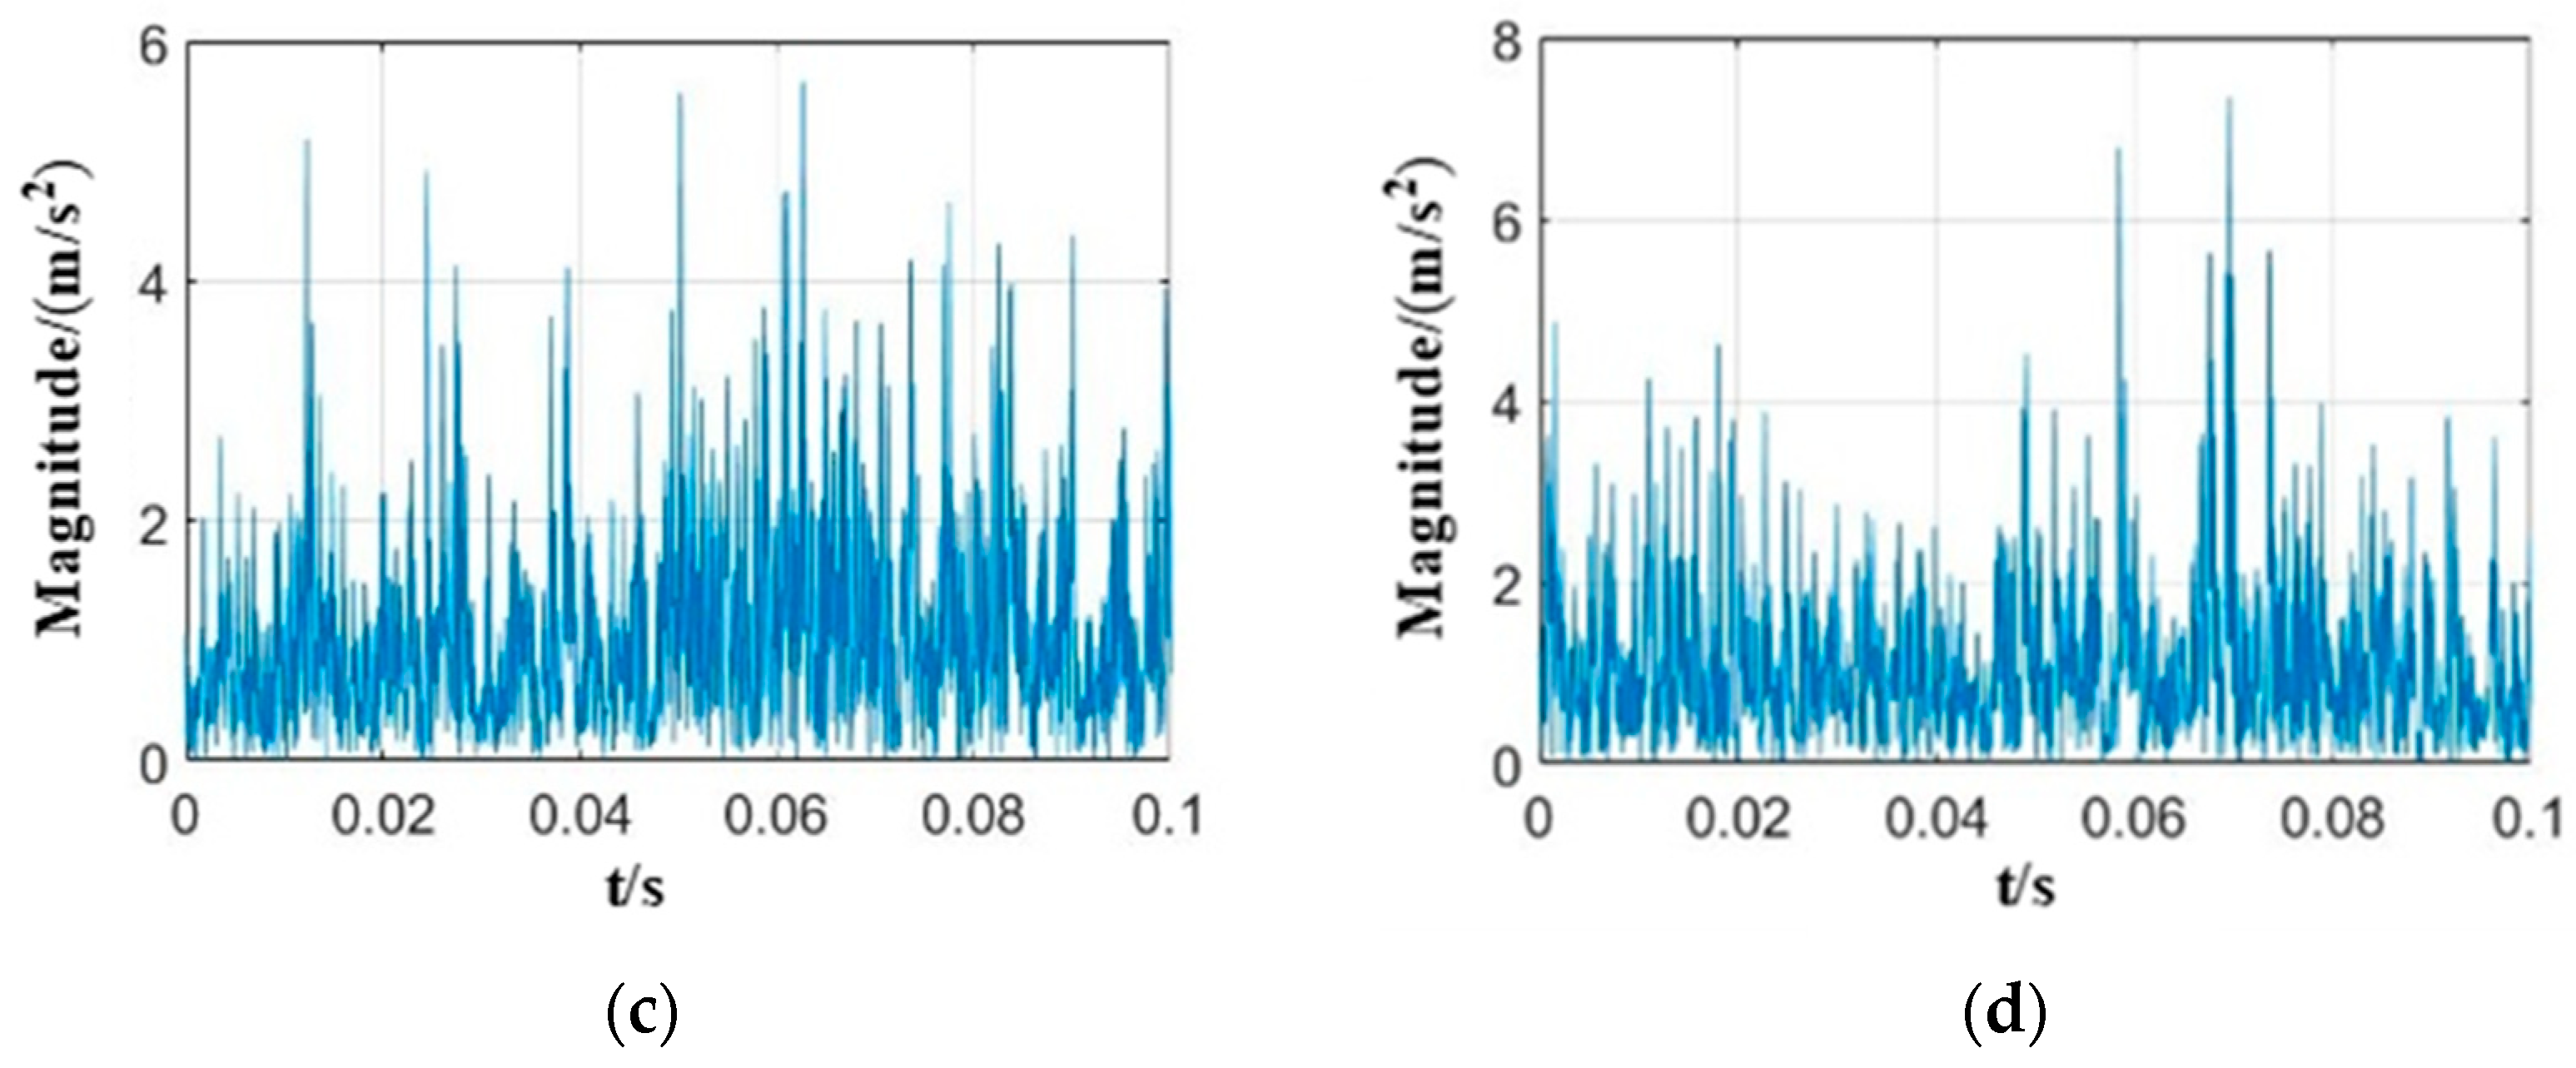
In order to extract the eigenvalues of the centrifugal pump under different cavitation conditions, the vibration signals at the X-direction of the pump inlet pipe and at the tongue of the volute at 25 °C and rated speed of 5400 r/min were used as examples for time domain analysis. Figure 4 and Figure 5 show the time domain diagrams for the X-direction of the pump inlet pipe and the volute tongue, respectively. From the diagrams, it can be seen that there is a large difference in magnitude and degree of change between the normal operation and cavitation phases, while the changes in the incipient cavitation, cavitation and severe cavitation phases are relatively small, so the identification of cavitation occurrence will be easier than the identification of the cavitation state.
Due to the different vibration magnitudes of the centrifugal pump when operating under different cavitation conditions, the mean value, standard deviation, peak factor, kurtosis factor and skewness factor were chosen as the time domain signal characteristic values. The mean value is an indicator of the trend in the concentration of the signal; the standard deviation indicates the degree of dispersion of the signal; the peak factor indicates the presence of a shock; the kurtosis factor reflects the response to a shock signal; and the skewness factor reflects the degree of asymmetry of the mean, as follows:
(1)
Mean value
μ = 1 n i = 1 n x i
(2)
Standard deviation
S = i = 1 n ( x i μ ) 2 n 1
(3)
Peak factor
P A R = x p e a k 1 n 1 n x i 2
where x p e a k is the peak value.
(4)
Kurtosis factor
K = { n ( n + 1 ) ( n 1 ) ( n 2 ) ( n 3 ) i = 1 n ( x i μ σ ) 4 } 3 ( n 1 ) 2 ( n 2 ) ( n 3 )
(5)
Skewness factor
χ = n ( n 1 ) ( n 2 ) i = 1 n ( x i μ σ ) 3  

3.2. Frequency Domain Feature Extraction

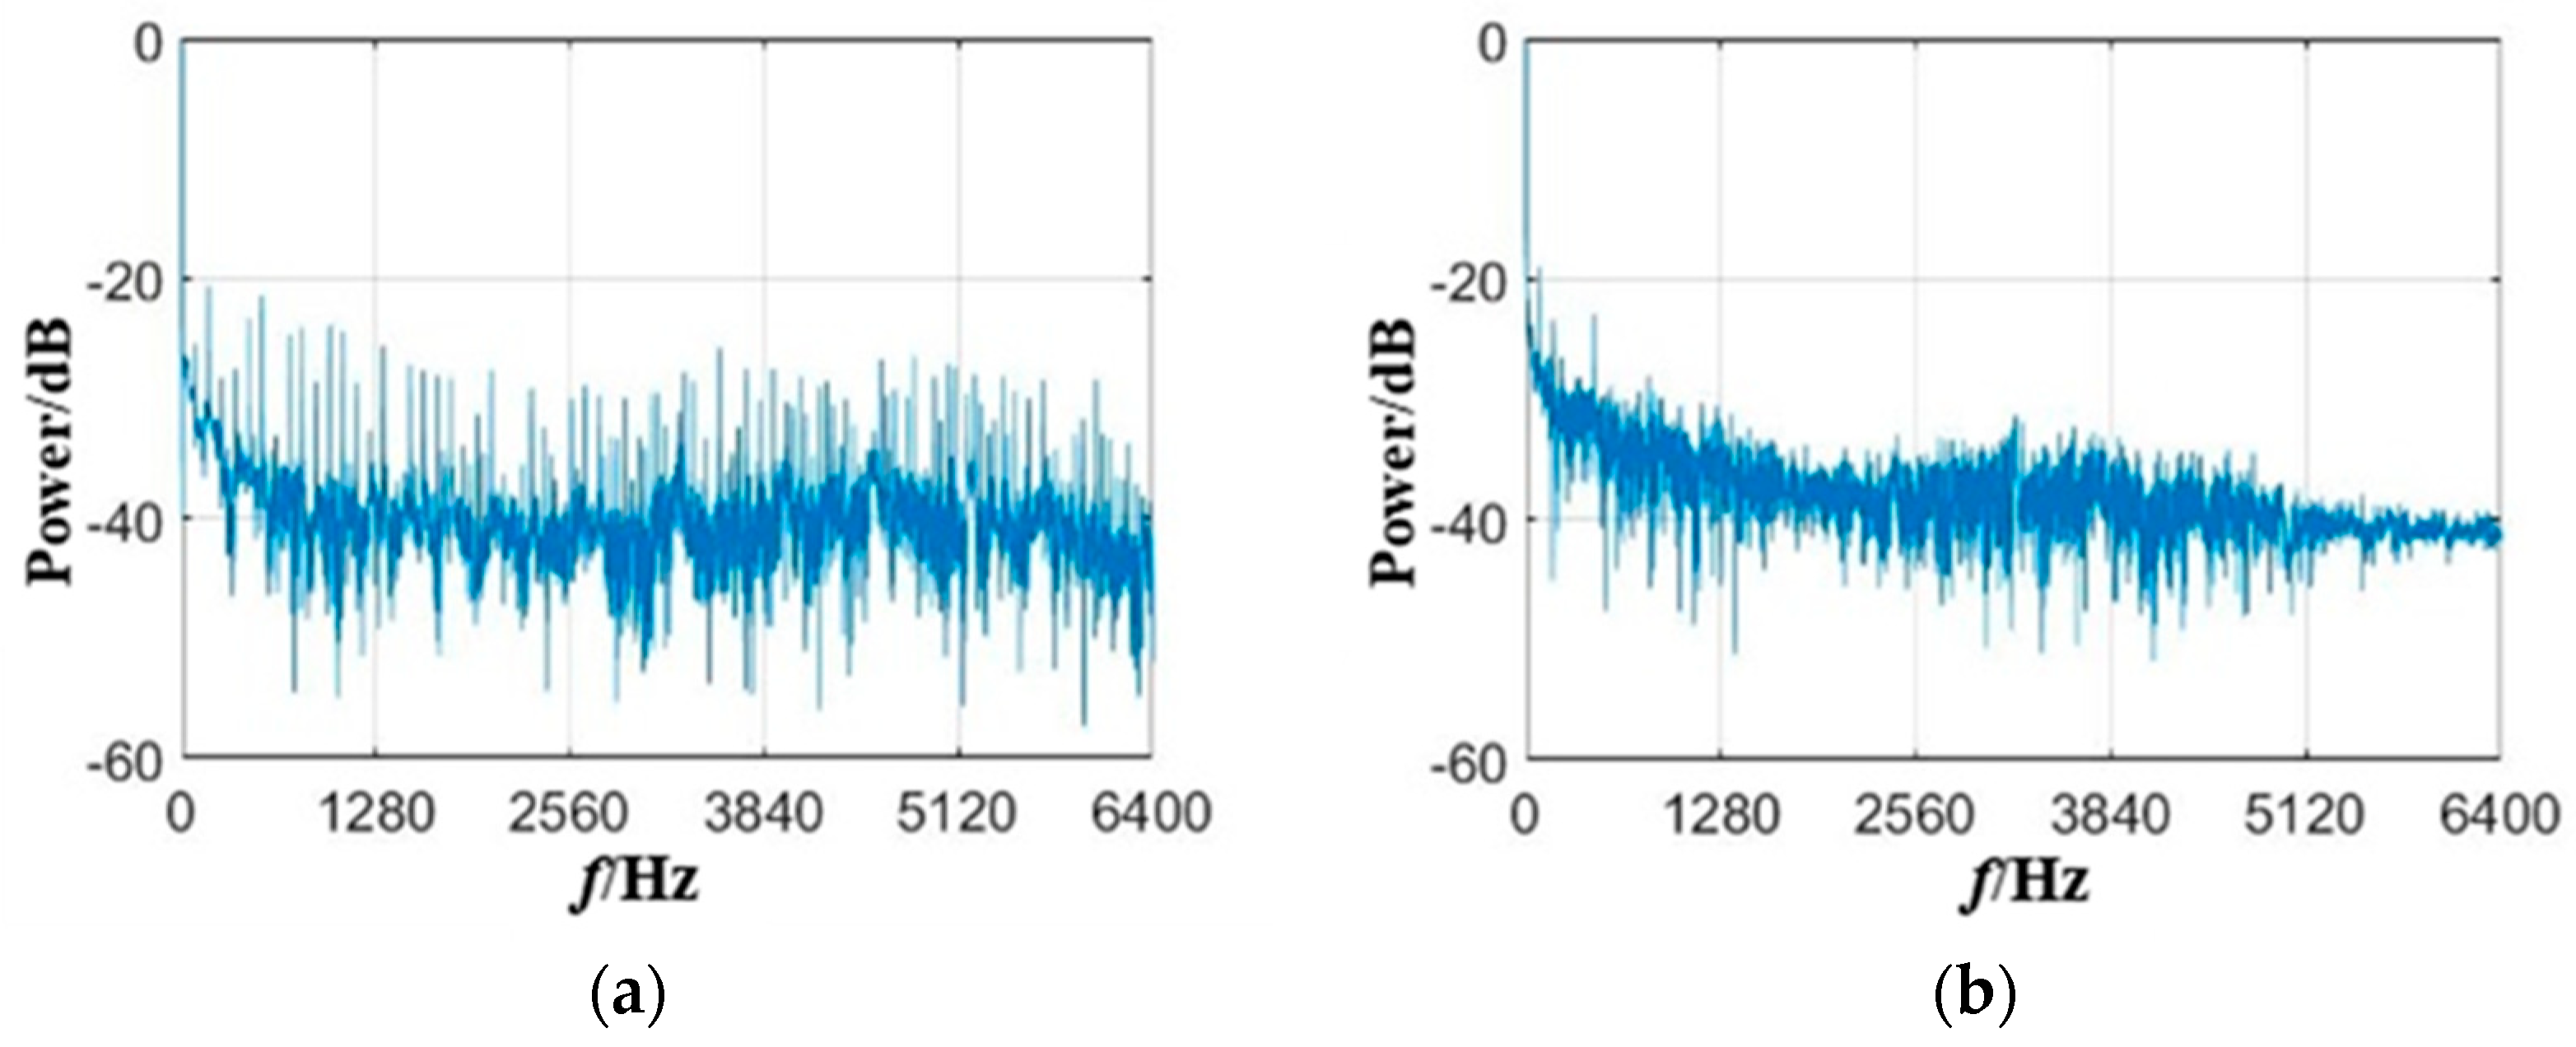
In order to extract the characteristic values of centrifugal pump under different cavitation conditions, the vibration signals in X-direction of pump inlet pipe and volute tongue are analyzed in frequency domain under the condition of 25 °C and rated speed 5400 r/min. The power spectrum was obtained using the Fourier transform of the autocorrelation function, and the ordinates were taken logarithmically (10log). Figure 6 and Figure 7 are the power spectra of the X-direction of the pump inlet pipe and the volute tongue, respectively. It can be seen from the diagrams that the amplitude and dispersion of the power are different under different operating conditions, so this feature can be used as the state characteristic value of the centrifugal pump at operating conditions.
Different cavitation conditions have different frequency components. When the power of each component changes, the center of gravity of the power spectrum will change accordingly. Therefore, the change of the center of gravity position and the dispersion degree of the power distribution can be used to describe the change of the signal frequency domain characteristics [24], specifically:
(1)
Center of gravity frequency
F C = 0 f S ( f ) d f 0 S ( f ) d f
(2)
Mean square frequency
M S F = 0 f 2 S ( f ) d f 0 S ( f ) d f
(3)
Frequency variance
V F = 0 ( f F C ) 2 S ( f ) d f 0 S ( f ) d f = M S F F C 2
By discretizing the signal x(n), the above equation can be rewritten as:
F C = i = 1 N f i p i i = 1 N p i
M S F = i = 1 N f i 2 p i i = 1 N p i
V F = M S F F C 2
where f i is the corresponding frequency of the power spectrum and p i is the corresponding amplitude of each frequency.

3.3. Time Frequency Domain Feature Extraction

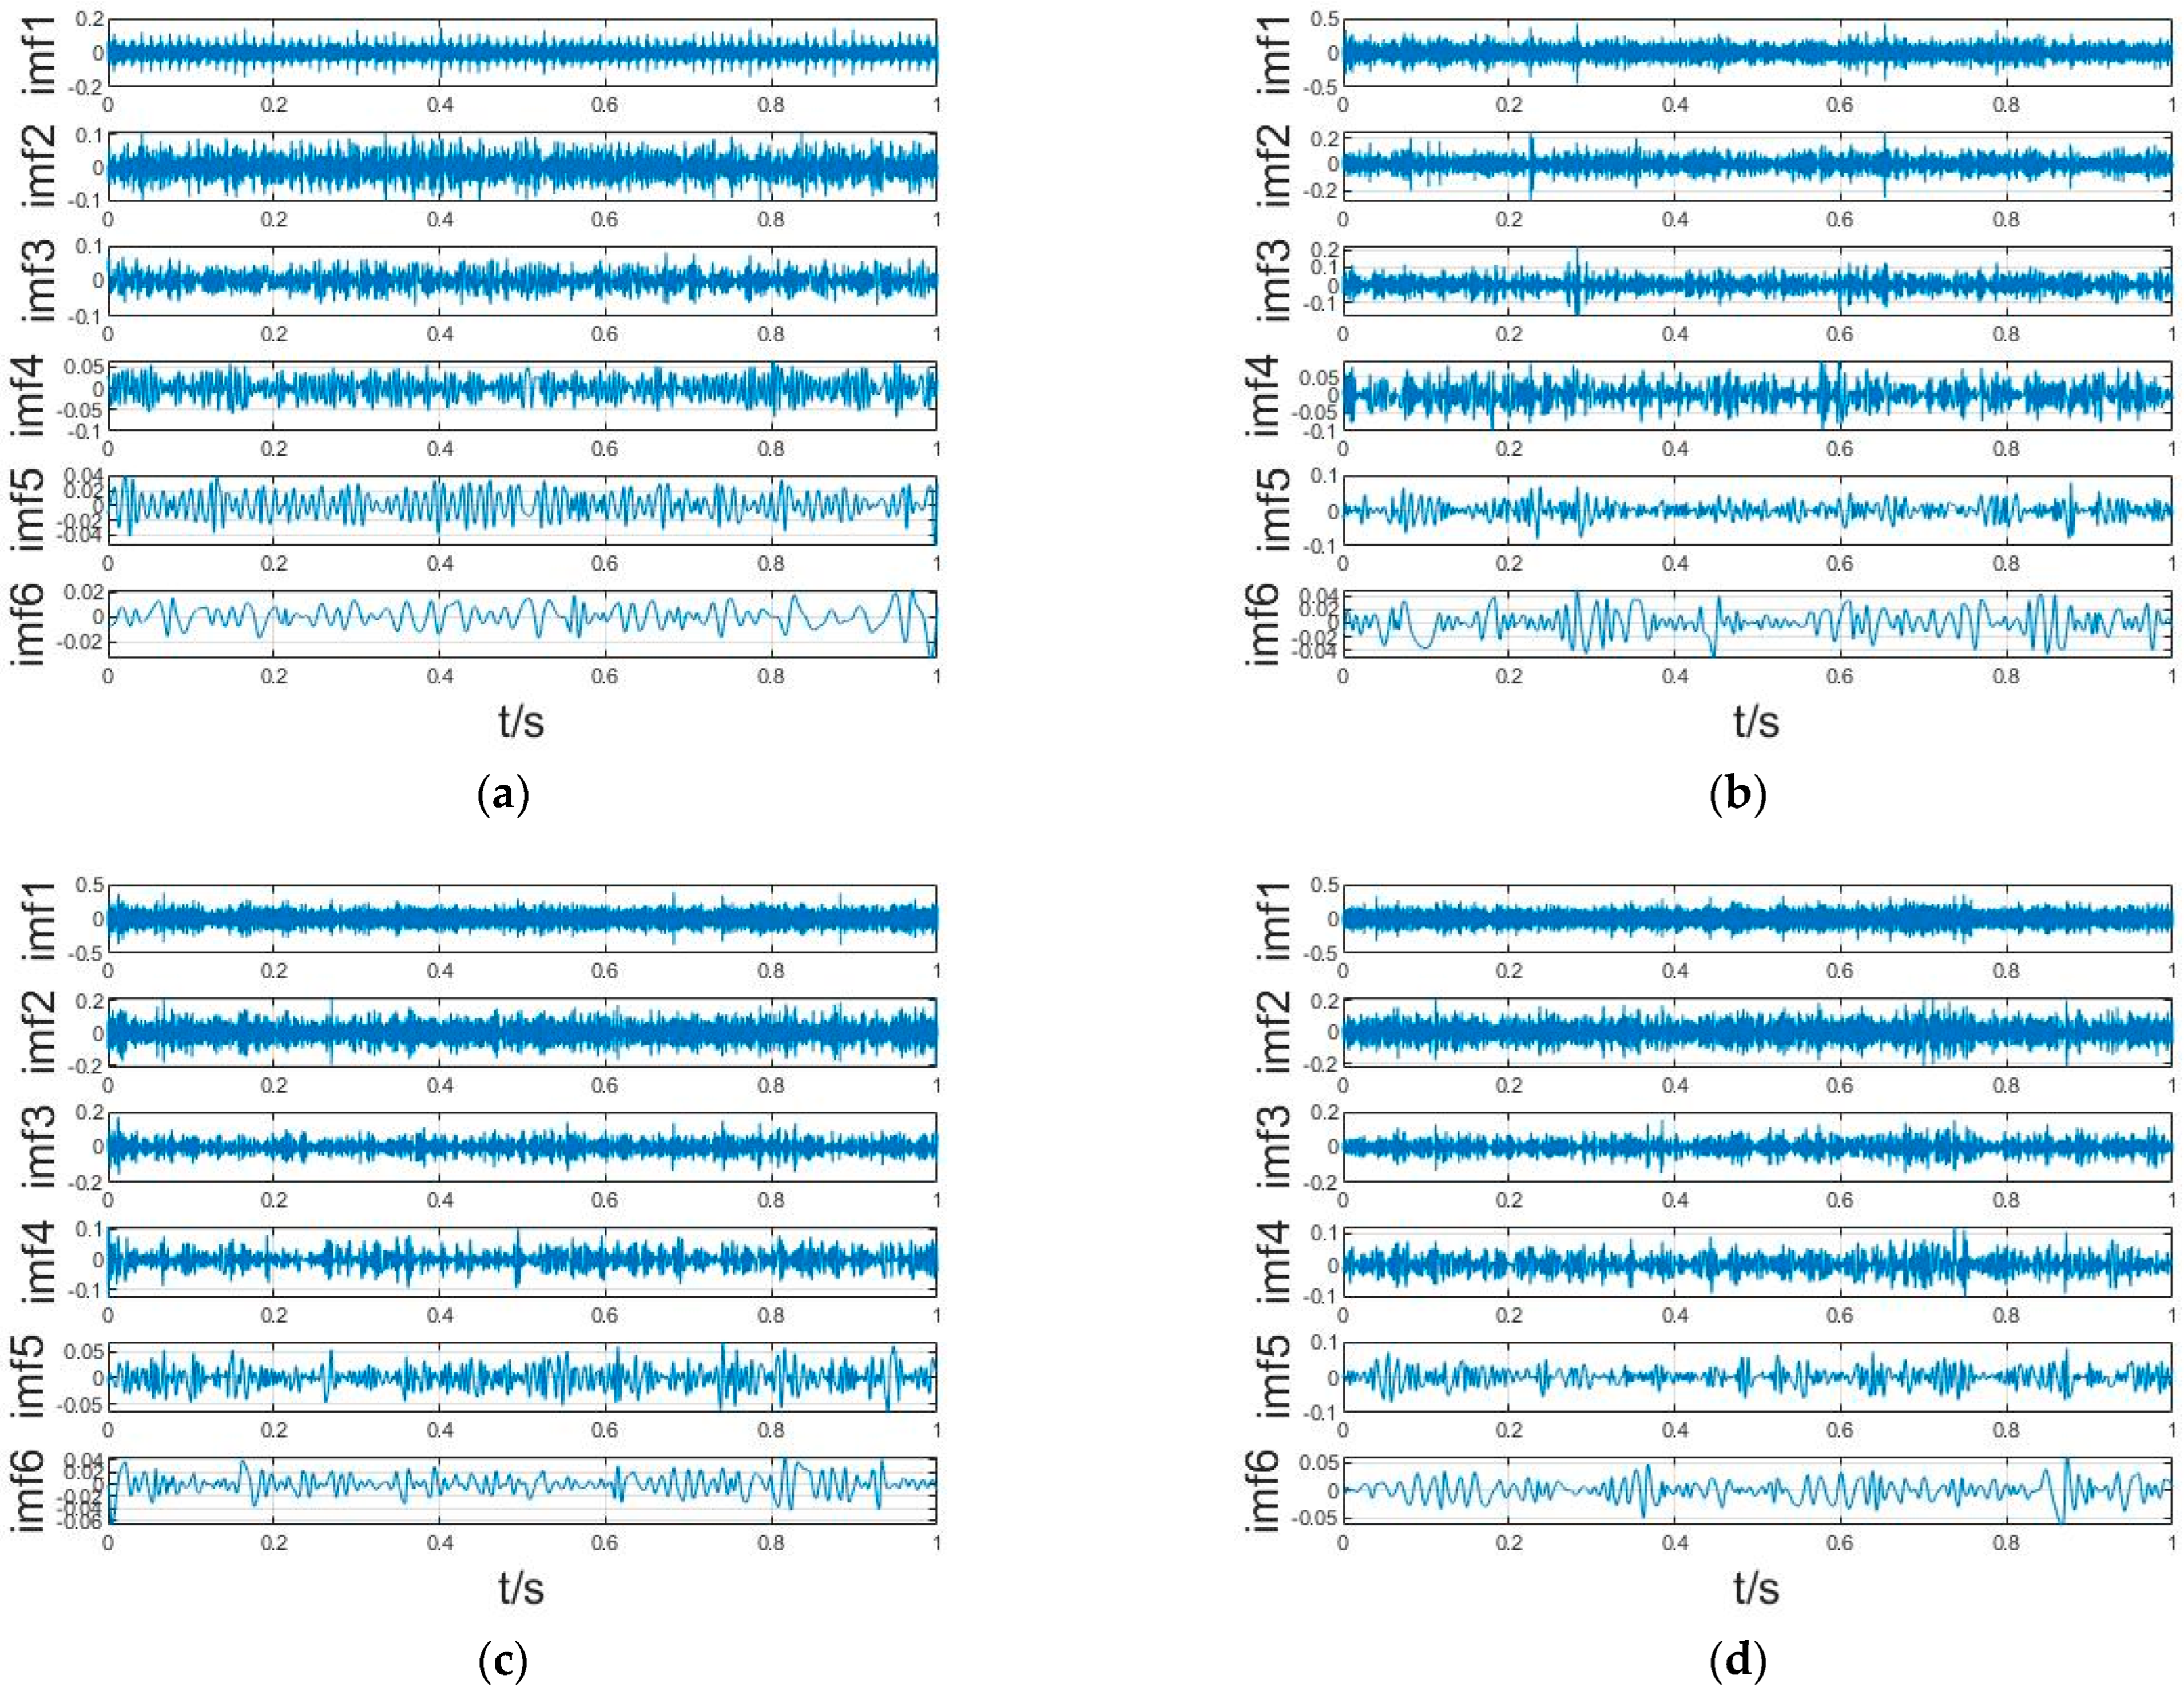
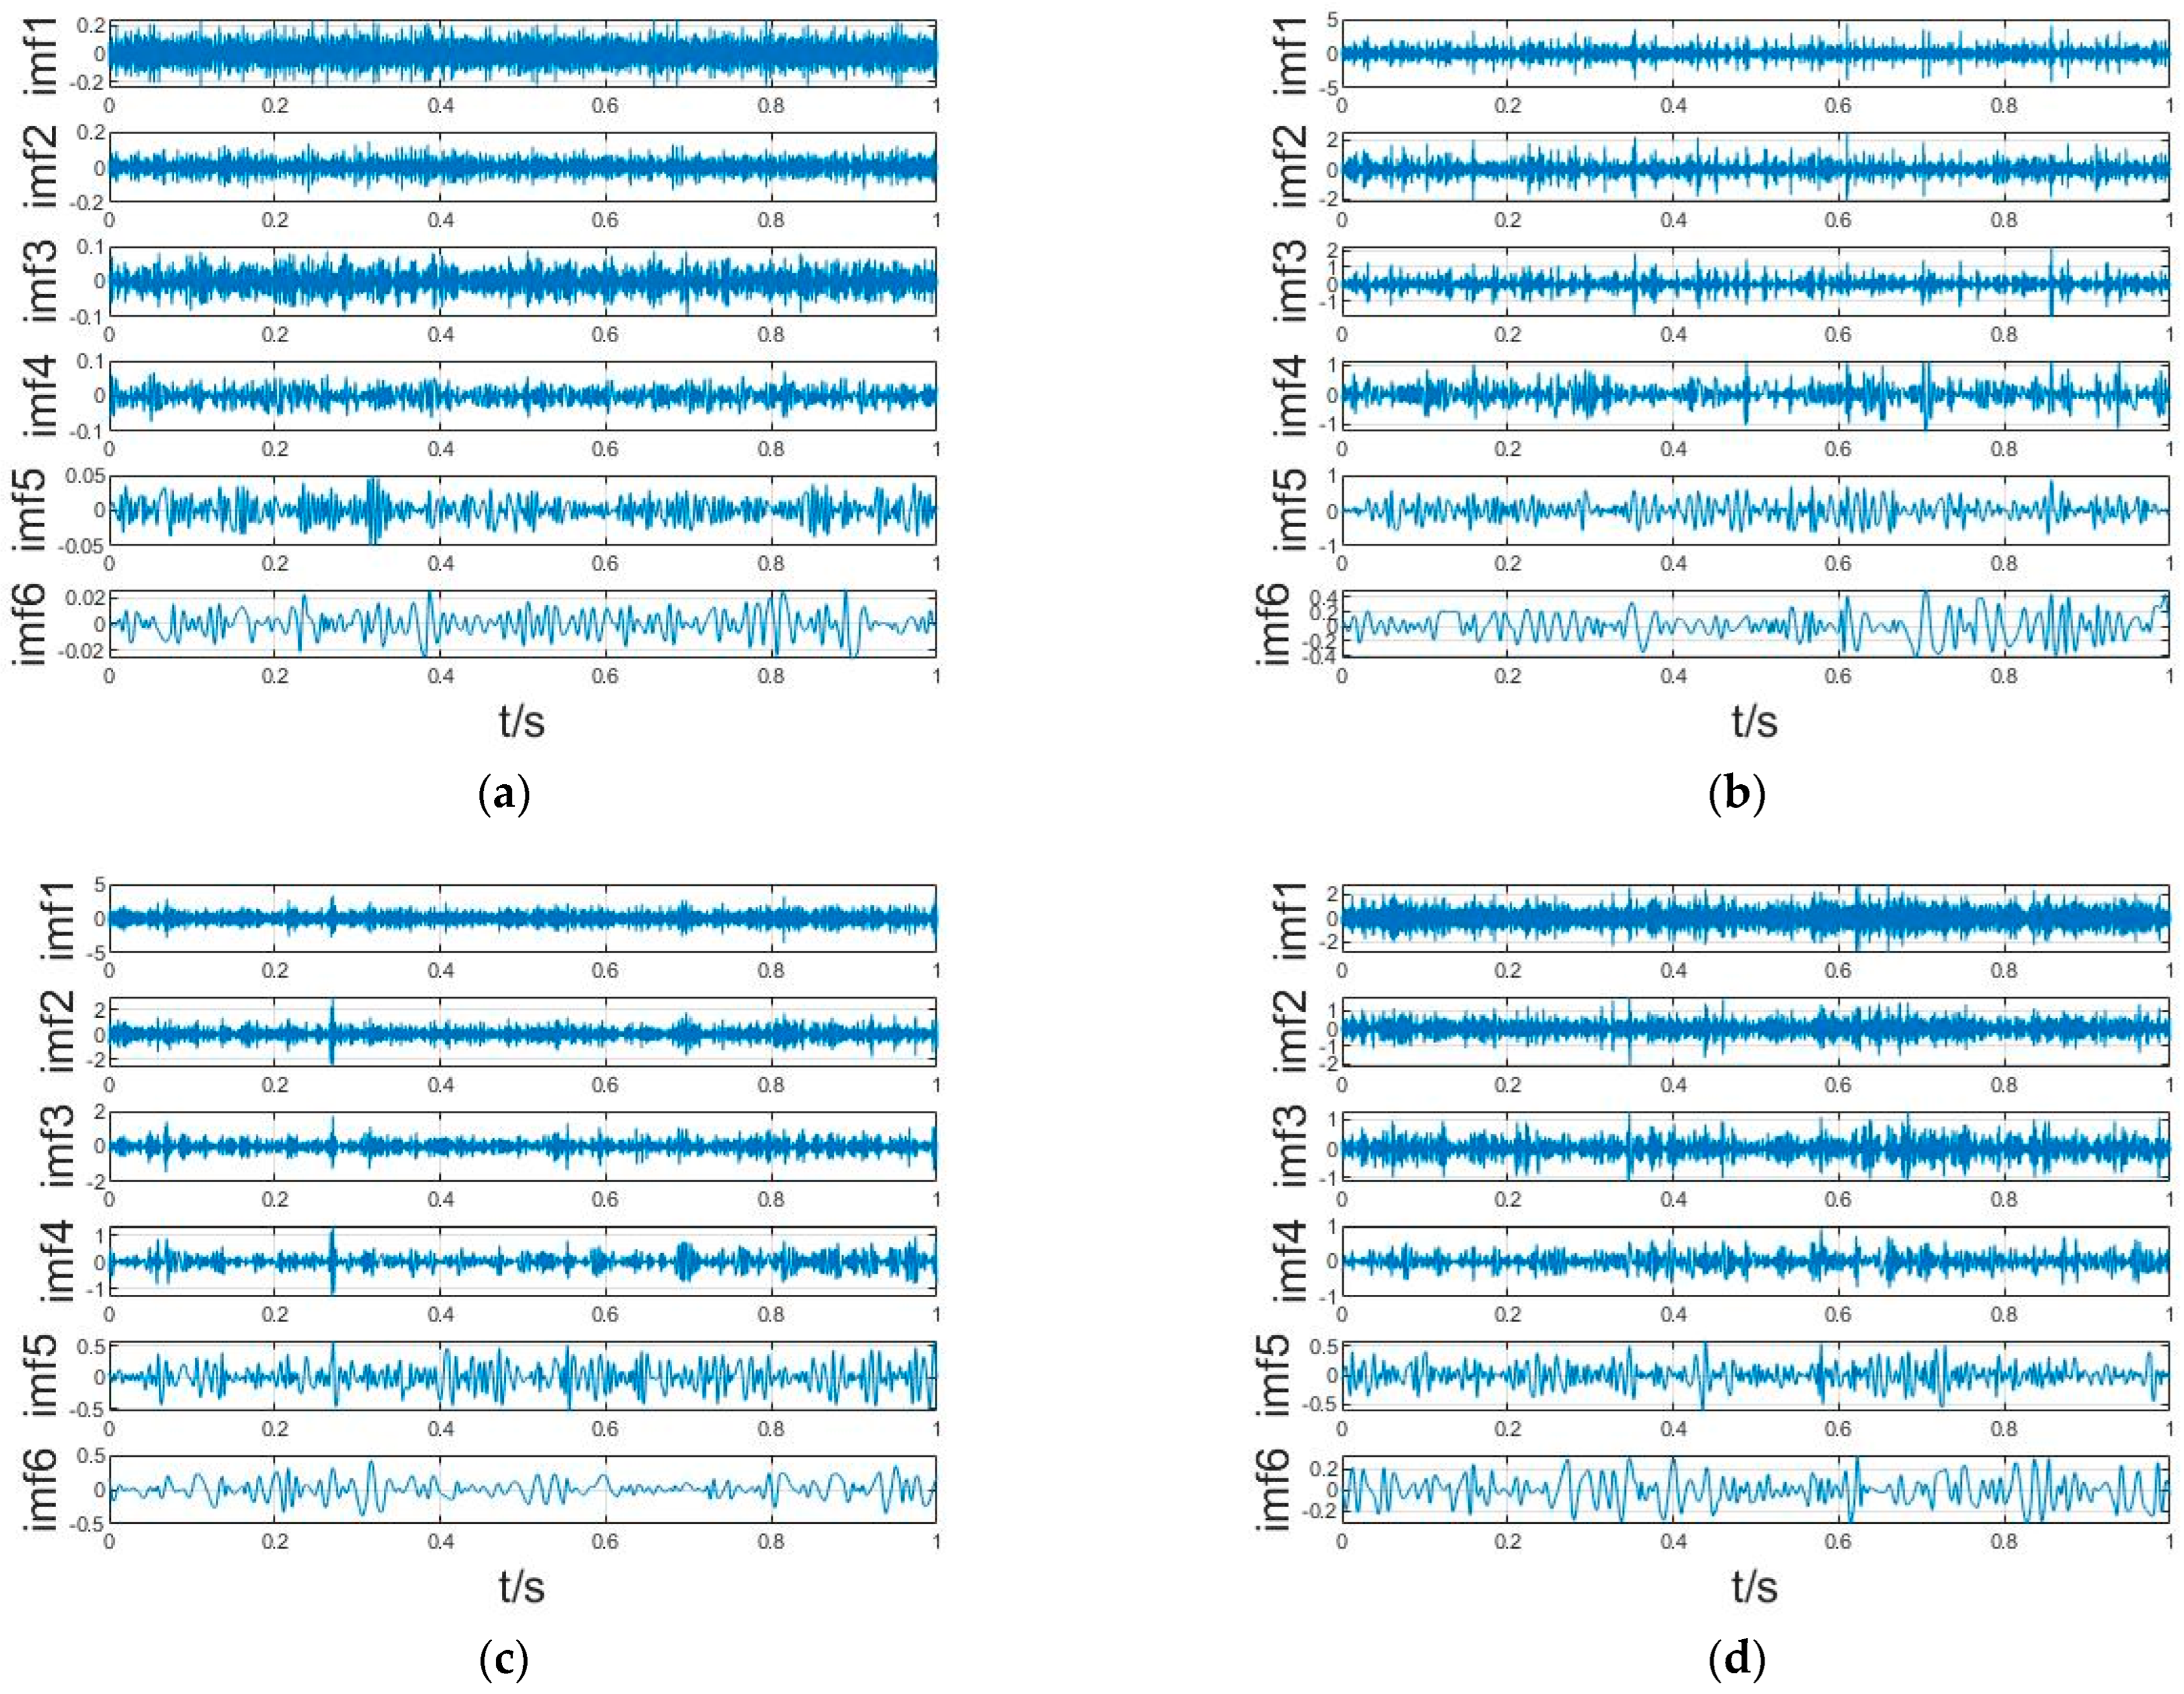
During the operation, the vibration signals of the centrifugal pump under different operating conditions are complex and contain many components, so the empirical mode decomposition (EMD) can be used to process these signals. The empirical mode decomposition at different operating conditions of the centrifugal pump was carried out. It is found that the number of decomposed intrinsic mode functions (IMF) is not fixed under different operating conditions, most of which are 6–10. Taking 25 °C and 5400 r/min as an example, Figure 8 and Figure 9 show the intrinsic modal functions of the first six layers of the centrifugal pump in the X-direction of the pump inlet pipe and at the pump volute tongue in normal operation, incipient cavitation, cavitation and severe cavitation for four operating conditions, respectively. By comparing the IMF of the first six layers, it can be found that the amplitude of the six first layers obtained by EMD is different. The magnitude of the amplitude is a manifestation of the energy size, indicating that the energy of the six first layers is different. Therefore, the IMF energy of each layer is different under different operating conditions, which can be used as an eigenvalue to identify the operating state of the centrifugal pump.
IMF Energy:
E = i = 1 n | a i ( t ) | 2
where a i ( t ) is a function of the magnitude of each IMF.
Energy ratio p i indicates the percentage of the i-th IMF component to the sum of the energies of all IMF components.
p i = E i E
where E is the sum of all IMF component energies.

4. Intelligent Recognition of Cavitation States Based on Support Vector Machines

4.1. The Theory of Support Vector Machines

The support vector machine (SVM) is a classification algorithm that can project linearly indistinguishable data in a low-dimensional space to construct a hyperplane in a high-dimensional space to achieve linearly divisible data. Support vector machines have the advantages of good generalization, small sample requirements and low parameter settings, and can solve problems such as high dimensionality and non-linearity [25].
Assuming that the training sample set is { ( x 1 , y 1 ) , ( x 2 , y 2 ) , ( x n , y n ) } , where x i R d , y i ( 1 , 1 ) , −1 and 1 represent two classes of samples that can be correctly distinguished by ω T x + b = 0 classification surface, establishes the optimization problem as follows:
min ω , b 1 2 ω T ω + C i = 1 n ξ i
s . t .   y i ( ω T x i + b ) 1 ξ i , ξ i 0 , i = 1 , 2 , n
where ω is the normal vector; b is the constant term; C is the penalty factor; and ξ i is the slack variable.
Finding the solution of the optimal normal vector ω and the constant term b gives the optimal classification surface. In order to transform Equation (13) into a quadratic programming problem, the corresponding Lagrange function is introduced and the classification problem becomes:
L ( ω , b , λ ) = 1 2 ω T ω + C i = 1 N ξ i i = 1 N α i [ y i ( ω T x i + b ) 1 + ξ i ] i = 1 N β i ξ i
where α i , β i is a Lagrange multiplier, α i 0 , β i 0 .
According to the pairwise principle, Equation (14) can become:
max α L ( α ) = i = 1 n α i 1 2 i = 1 , j = 1 n α i α j y i y j ϕ ( x i ) ϕ ( x j )
s . t . i = 1 n y i α i = 0 , 0 α i C , i = 1 , 2 , , n
where ϕ ( x i ) ϕ ( x j ) = K ( x i , x j ) is the kernel function.
For linearly indistinguishable problems, support vector machines need to introduce kernel functions to project data from low-dimensional space to high-dimensional space to achieve linearly divisible purposes. In this study, the Radical Basis Kernel Function (RBF) [26] is chosen to build the classification model, whose expressions are:
K ( x i , x j ) = exp ( g x i x j 2 )
where g is the kernel function parameter.
After substitution of the kernel function, the final classification decision function is obtained as:
f ( x ) = sgn [ i = 1 N α i y i K ( x i x j ) + b ]
The support vector is the sample point of α i > 0 in the solution process, which can be found by substituting any support vector into Equation (18).

4.2. Support Vector Machine-Based Binary Classification

Three hundred sets of data from normal operation and three hundred sets of data when cavitation occurred were selected for the accuracy calculation of the Support Vector Machine cavitation monitoring model. In this study, 80% of the data were used as training samples and the remaining 20% were used as test samples to test the accuracy of the support vector machine. After feature extraction of the data by the method described in the previous section and inputting the feature values into a support vector machine, the feature values are normalized and, by normalization, are able to be mapped to between (0, 1) for infinite data. The normalization process is formulated as follows:
x i = x i min ( x ) max ( x ) min ( x )
where max(x) and min(x) are the maximum and minimum values in the eigenvalues, respectively.
The accuracy of the support vector machine is influenced by the penalty factor C and the kernel function parameter g. In order to improve the accuracy of the support vector machine, suitable parameters are selected to optimize the support vector machine. [27]. Figure 10 shows the contour plot of the average recognition rate of the kurtosis factor, center of gravity frequency, and IMF1 energy share at 25 °C and 5400 r/min using the grid search method at 3-CV [28,29].
From Figure 10, it can be seen that different optimal parameter combinations (C, g) are obtained for different feature values, and different (C, g) combinations have different accuracy rates. The grid search method obtains the average accuracy of each node in the grid by substituting it into the support vector machine, and it can be seen that the average recognition rates of the kurtosis factor, center of gravity frequency and IMF1 energy share are 98.8889%, 83.5185% and 100%, respectively, at which time the corresponding optimal parameter sets are (0.03125, 29.8597), (1.0718, 3.7321), (0.03125, 0.03125).
Table 1, Table 2 and Table 3 show the recognition rates of the time domain signal feature extraction, frequency domain signal feature extraction and time frequency domain signal feature extraction of the eigenvalues for normal operation and cavitation occurrence at the four monitoring points at temperatures of 25 °C, 50 °C and 70 °C and a speed of 5400 r/min, respectively. As can be seen from Table 1, for the identification of cavitation occurrence, the recognition rate of the five eigenvalues extracted from the time domain signal features is high, and the overall recognition rate can reach over 90%; as can be seen from Table 2, the overall recognition rate of the three eigenvalues extracted from the frequency domain features is lower than that of the time domain signal; as can be seen from Table 3, the recognition rate of the eigenvalues extracted from the time frequency domain method is in between that of the time domain signal and the frequency domain signal. The recognition rate of the first layer of energy share is the highest, with all but a few points reaching 96% or more, and the recognition rate of the sixth layer of energy share is the worst. Overall, the three types of eigenvalues are able to identify whether cavitation occurs well.

4.3. Support Vector Machine-Based Multiclassification

In practice, the operating state of a centrifugal pump, in addition to its normal operating state, can be classified as incipient cavitation, cavitation and severe cavitation, depending on the intensity of the cavitation. It is not enough to use support vector machines for binary classification, but a multi-classification study is needed to more accurately identify the operating state of the centrifugal pump.
A total of 1200 sets of data, 300 sets each for normal operation, incipient cavitation, cavitation and severe cavitation, were collected from the experiment, and the training and test samples were set up in a ratio of 8:2 to carry out the support vector machine multi-classification. In order to reduce the impact of different eigenvalues on the accuracy, the time domain eigenvalues, the frequency domain eigenvalues and the time frequency domain eigenvalues were combined. Table 4, Table 5 and Table 6 show the accuracy of the combined time domain eigenvalues, the combined frequency domain eigenvalues and the combined time and frequency domain eigenvalues for normal pump operation, incipient cavitation, cavitation and severe cavitation at different temperatures. As can be seen from Table 4, the average accuracy of the five eigenvalues of the time domain signal for the identification of the cavitation running state is not very different, all at around 85%; as can be seen from Table 5, the identification accuracy of the three eigenvalues of the frequency domain signal is low and not suitable for the identification of the cavitation state; as can be seen from Table 6, the identification rate of the combined time and frequency domain eigenvalues for the cavitation state is between the combined time domain eigenvalues and the combined frequency domain eigenvalues, with the highest identification rate in the Y-direction of the inlet pipe and the lowest identification rate in the Z direction of the inlet pipe.
In order to improve the recognition rate of the cavitation state multi-classification support vector machine, the time domain eigenvalues at the four monitoring points and the time, and frequency domain eigenvalues at the monitoring points in the X and Y-directions of the inlet pipe with high recognition rate were selected and combined. The combined eigenvalues were used to train the support vector machine. Table 7 shows the multi-classification recognition rates for the four operating conditions of the centrifugal pump at different temperatures: normal operation, incipient cavitation, cavitation and severe cavitation.
As can be seen in Table 7, the trained support vector machine has a high recognition rate for multiple classifications at all three temperature scenarios, reaching over 94% and even 100% at 70 °C. Temperature has an effect on the accuracy of the multiclassification recognition of the cavitation states, and this is related to the criteria used to determine the state in which cavitation occurs. Therefore, the combination of feature values with high recognition rates can significantly improve the accuracy of centrifugal pump cavitation monitoring recognition.

5. Conclusions

This study proposes a cavitation monitoring and identification technique for centrifugal pumps based on support vector machines. The vibration signals of centrifugal pumps at different operating states at different temperatures (25 °C, 50 °C and 70 °C) are analyzed and extracted by means of feature extraction, and the extracted feature values are then used to train support vector machines to carry out classification and identification studies on subsequent test samples, leading to the following conclusions:
  • The overall temperature has little effect on the cavitation recognition rate and is related to the criteria used to determine the state in which cavitation occurs; the location of the monitoring point has an effect on the accuracy of the monitoring, which is related to the direction of the vibration and the location of the monitoring at the same monitoring point.
  • In dichotomous classification, the recognition accuracy of individual feature values was highest for time domain signals, followed by time frequency-domain and finally frequency-domain signals, which was related to the extracted feature values; in multi-classification, the individual feature values were combined to improve the recognition accuracy and the highest recognition rate was found for time domain signals, followed by time frequency-domain signals and finally frequency-domain signals.
  • In order to improve the recognition accuracy of multiple classification, the combination of the feature values of the time domain signal at the four monitoring points and the time and frequency domain signal at the monitoring points in the X and Y-directions of the inlet pipe can effectively improve the recognition accuracy, which can reach 100% recognition at a maximum accuracy of 70 °C.
  • In terms of recognition accuracy, the intelligent recognition of the cavitation status of centrifugal pumps based on support vector machines can better identify whether cavitation has occurred and the cavitation status.

Author Contributions

Data curation, X.H.; Validation, Y.S.; Formal analysis, K.W. and C.S.; Resources, Q.S.; Funding acquisition, Q.S.; Investigation, X.H. and K.W.; Supervision, Q.S.; Writing—original draft, X.H.; Writing—review and editing, A.A. All authors have read and agreed to the published version of the manuscript.

Funding

This research was funded by the National Natural Science Foundation of China (51976079, 12002136), the financial support of the National Key R&D Program of China (2020YFC1512403), and the Research Project of the State Key Laboratory of Mechanical System and Vibration (MSV202201). And The APC was funded by the financial support of the National Key R&D Program of China (2020YFC1512403).

Data Availability Statement

The data supporting this study’s findings are available within the article.

Acknowledgments

The authors gratefully acknowledge the National Natural Science Foundation of China (51976079, 12002136), the financial support of the National Key R&D Program of China (2020YFC1512403), and the Research Project of the State Key Laboratory of Mechanical System and Vibration (MSV202201).

Conflicts of Interest

The authors declare no conflict of interest.

References

  1. Roland, L.; Gerhard, R. Cavitation research at the Institute of Hydraulic Engineering and Water Resources Management. In Proceedings of the International Conference on Hydrodynamics, Wuxi, China, 30 October–3 November 1994; pp. 263–271. [Google Scholar]
  2. Laborde, R.; Chantrel, P.; Mory, M. Tip clearance and tip vortex cavitation in an axial flow pump. J. Fluids Eng. 1997, 119, 680–685. [Google Scholar] [CrossRef]
  3. Oba, R.; Yasu, S. Spatial cavitation-nuclei measurement by means of laser velocimeter. Rep. Inst. High Speed Mech. 1978, 310, 47–54. [Google Scholar]
  4. Tabar, M.T.S.; Poursharifi, Z. An experimental study of tip vortex cavitation inception in an axial flow pump. Int. J. Mech. Mechatron. Eng. 2011, 5, 86–89. [Google Scholar]
  5. Farhat, M.; Bourdon, P.; Gagne, J.; Remillard, L. Improving hydro turbine profitability by monitoring cavitation aggressiveness. In Proceedings of the CEA Electricity 99 Conference and Exposition, Vancouver, BC, Canada, 29–31 March 1999. [Google Scholar]
  6. Xue, H.; Li, K.; Wang, H.; Chen, P. Sequential Diagnosis Method for Rotating Machinery Using Support Vector Machines and Possibility Theory. In Proceedings of the International Conference on Intelligent Computing, Nanning, China, 28–31 July 2013; Springer: Berlin/Heidelberg, Germany, 2013. [Google Scholar]
  7. McKee, K.K.; Forbes, G.L.; Mazhar, I.; Entwistle, R.; Hodkiewicz, M.; Howard, I. A vibration cavitation sensitivity parameter based on spectral and statistical methods. Expert Syst. Appl. 2015, 42, 67–78. [Google Scholar] [CrossRef] [Green Version]
  8. Azizi, R.; Attaran, B.; Hajnayeb, A.; Ghanbarzadeh, A.; Changizian, M. Improving accuracy of cavitation severity detection in centrifugal pumps using a hybrid feature selection technique. Measurement 2017, 108, 9–17. [Google Scholar] [CrossRef]
  9. Giorgi, M.G.; Bello, D.; Ficarella, A. An artificial neural network approach to investigate cavitating flow regime at different temperatures. Measurement 2014, 47, 971–981. [Google Scholar] [CrossRef]
  10. Giorgi, M.G.; Ficarella, A.; Lay-Ekuakille, A. Cavitation Regime Detection by LS-SVM and ANN with Wavelet Decomposition Based on Pressure Sensor Signals. IEEE Sens. J. 2015, 15, 5701–5708. [Google Scholar] [CrossRef]
  11. Sun, H.; Si, Q.; Chen, N.; Yuan, S. HHT-based feature extraction of pump operation instability under cavitation conditions through motor current signal analysis. Mech. Syst. Signal Process. 2020, 139, 106613. [Google Scholar] [CrossRef]
  12. Yang, B.S.; Hwang, W.W.; Ko, M.H.; Lee, S.-J. Cavitation detection of butterfly valve using support vector machines. J. Sound Vib. 2005, 287, 25–43. [Google Scholar] [CrossRef]
  13. Cao, Y.; Ming, Y.; He, G.; Su, Y. Cavitation state recognition of centrifugal pumps based on deep learning. J. Xi’an Jiaotong Univ. 2017, 51, 165–172. [Google Scholar]
  14. Ge, M.; Petkovšek, M.; Zhang, G.; Jacobs, D.; Coutier-Delgosha, O. Cavitation dynamics and thermodynamic effects at elevated temperatures in a small Venturi channel. Int. J. Heat Mass Transf. 2021, 170, 120970. [Google Scholar] [CrossRef]
  15. Ge, M.; Zhang, G.; Petkovšek, M.; Long, K.; Coutier-Delgosha, O. Intensity and regimes changing of hydrodynamic cavitation considering temperature effects. J. Clean. Prod. 2022, 338, 130470. [Google Scholar] [CrossRef]
  16. Ge, M.; Sun, C.; Zhang, G.; Coutier-Delgosha, O.; Fan, D. Combined suppression effects on hydrodynamic cavitation performance in Venturi-type reactor for process intensification. Ultrason. Sonochem. 2022, 86, 106035. [Google Scholar] [CrossRef]
  17. Ge, M.; Manikkam, P.; Ghossein, J.; Subramanian, R.K.; Coutier-Delgosha, O.; Zhang, G. Dynamic mode decomposition to classify cavitating flow regimes induced by thermodynamic effects. Energy 2022, 254, 124426. [Google Scholar] [CrossRef]
  18. Wu, K.; Ali, A.; Feng, C.; Si, Q.; Chen, Q.; Shen, C. Numerical Study on the Cavitation Characteristics of Micro Automotive Electronic Pumps under Thermodynamic Effect. Micromachines 2022, 13, 1063. [Google Scholar] [CrossRef]
  19. Wang, H.; Chen, P. Intelligent diagnosis method for a centrifugal pump using features of vibration signals. Neural Comput. Appl. 2009, 18, 397–405. [Google Scholar] [CrossRef]
  20. Ali, A.; Si, Q.; Wang, B.; Yuan, J.; Wang, P.; Rasool, G.; Shokrian, A.; Ali, A.; Zaman, M.A. Comparison of empirical models using experimental results of electrical submersible pump under two-phase flow: Numerical and empirical model validation. Phys. Scr. 2022, 97, 065209. [Google Scholar] [CrossRef]
  21. Qiaorui, S.; Ali, A.; Biaobiao, W.; Wang, P.; Bois, G.; Jianping, Y.; Kubar, A.A. Numerical Study on Gas-Liquid Two Phase Flow Characteristic of Multistage Electrical Submersible Pump by Using a Novel Multiple-Size Group (MUSIG) Model. Phys. Fluids 2022, 34, 063311. [Google Scholar] [CrossRef]
  22. Ali, A.; Yuan, J.; Deng, F.; Wang, B.; Liu, L.; Si, Q.; Buttar, N. Research Progress and Prospects of Multi-Stage Centrifugal Pump Capability for Handling Gas–Liquid Multiphase Flow: Comparison and Empirical Model Validation. Energies 2021, 14, 896. [Google Scholar] [CrossRef]
  23. Ali, A.; Si, Q.; Yuan, J.; Shen, C.; Cao, R.; AlGarni, T.S.; Awais, M.; Aslam, B. Investigation of energy performance, internal flow and noise characteristics of miniature drainage pump under water–air multiphase flow: Design and part load conditions. Int. J. Environ. Sci. Technol. 2022, 19, 7661–7678. [Google Scholar] [CrossRef]
  24. Zhang, L.Q.; Zhu, L.M.; Zhong, B.L. Study on the features of some specific parameters utilized for machine condition monitoring. Chin. J. Vib. Shock. 2001, 20, 20–25. [Google Scholar]
  25. Shervani-Tabar, M.T.; Ettefagh, M.M.; Lotfan, S.; Safarzadeh, H. Cavitation intensity monitoring in an axial flow pump based on vibration signals using multi-class support vector machine. Proc. Inst. Mech. Eng. Part C J. Mech. Eng. Sci. 2018, 232, 3013–3026. [Google Scholar] [CrossRef]
  26. Rapur, J.S.; Tiwari, R. Experimental Time-Domain Vibration-Based Fault Diagnosis of Centrifugal Pumps Using Support Vector Machine. ASCE-ASME J. Risk Uncertain. Eng. Syst. Part B Mech. Eng. 2017, 3, 044501. [Google Scholar] [CrossRef]
  27. Fayed, H.A.; Atiya, A.F. Speed up grid-search for parameter selection of support vector machines. Appl. Soft Comput. 2019, 80, 202–210. [Google Scholar] [CrossRef]
  28. Hsu, C.W.; Chang, C.C.; Lin, C.J. A Practical Guide to Support Vector Classification. 2003. Available online: https://www.csie.ntu.edu.tw/~cjlin/papers/guide/guide.pdf (accessed on 24 April 2021).
  29. Lameski, P.; Zdravevski, E.; Mingov, R.; Kulakov, A. SVM Parameter Tuning with Grid Search and Its Impact on Reduction of Model over-Fitting. Rough Sets, Fuzzy Sets, Data Mining, and Granular Computing; Springer: Cham, Switzerland, 2015; pp. 464–474. [Google Scholar]
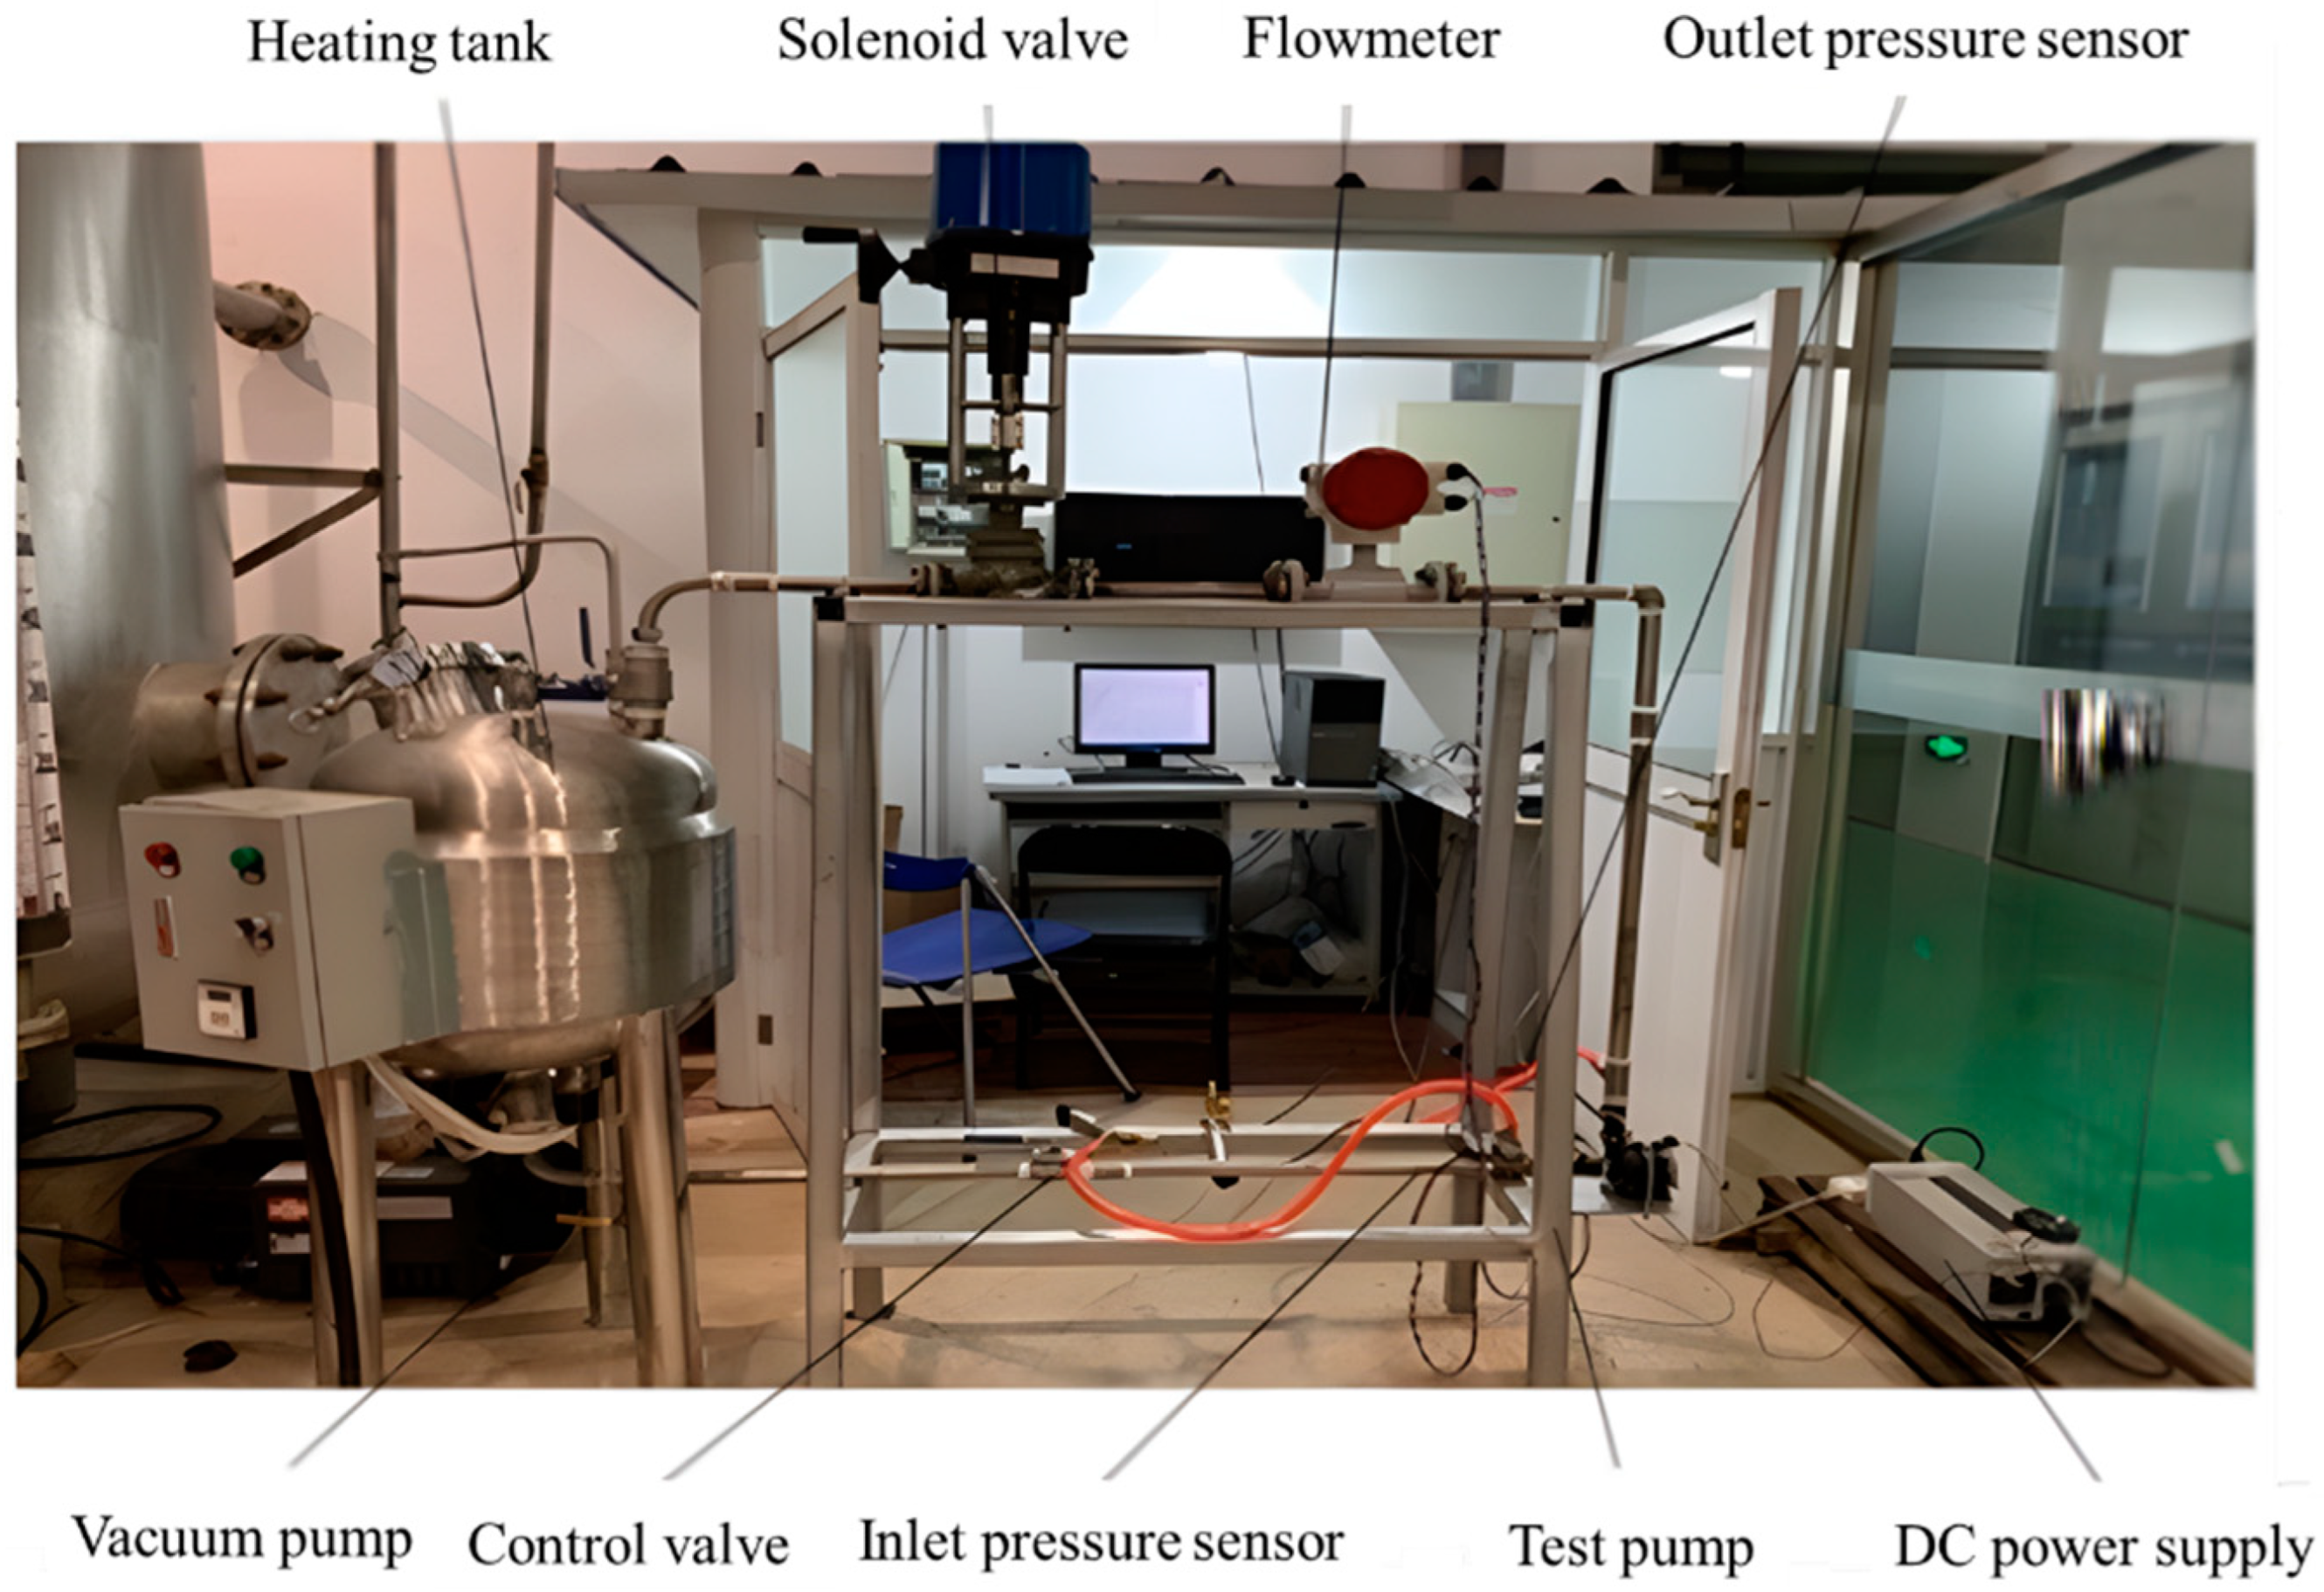
Figure 1. Experimental set-up diagram.
Energies 15 08907 g001
Figure 2. Sensor arrangement diagram.
Energies 15 08907 g002
Figure 3. Cavitation performance curve.
Energies 15 08907 g003
Figure 4. Time domain waveform in X-direction of the pump inlet pipe. (a) normal operation. (b) incipient cavitation. (c) cavitation. (d) severe cavitation.
Energies 15 08907 g004
Figure 5. Time domain waveform of pump volute tongue. (a) normal operation. (b) incipient cavitation. (c) cavitation. (d) severe cavitation.
Energies 15 08907 g005aEnergies 15 08907 g005b
Figure 6. Power spectrum in X-direction of the pump inlet pipe. (a) normal operation. (b) incipient cavitation. (c) cavitation. (d) severe cavitation.
Energies 15 08907 g006
Figure 7. Power spectrum of the pump volute tongue. (a) normal operation. (b) incipient cavitation. (c) cavitation. (d) severe cavitation.
Energies 15 08907 g007aEnergies 15 08907 g007b
Figure 8. EMD in X-direction of the pump inlet pipe. (a) normal operation. (b) incipient cavitation. (c) cavitation. (d) severe cavitation.
Energies 15 08907 g008
Figure 9. The EMD of the pump volute tongue. (a) normal operation. (b) incipient cavitation. (c) cavitation. (d) severe cavitation.
Energies 15 08907 g009
Figure 10. Average recognition rate contour map. (a) Kurtosis factor. (b) Center of gravity frequency. (c) IMF1 energy.
Energies 15 08907 g010
Table 1. Accuracy of time domain eigenvalue classification.
Recognition Accuracy
TemperatureEigenvalueInlet Pipe X-DirectionInlet Pipe Y-DirectionInlet Pipe Z-DirectionVolute Tongue
Mean value 100%100%100%100%
standard deviation 100%100%100%100%
25 °CPeak factor 100%95%98.3333%98.3333%
Kurtosis factor 86.6667%100%100%100%
Skewness factor100%100%100%100%
Mean value 100%98.3333%100%100%
standard deviation 100%100%100%100%
50 °CPeak factor 100%96.6667%98.3333%100%
Kurtosis factor 98.3333%100%100%100%
Skewness factor98.3333%100%100%98.3333%
Mean value 100%100%100%100%
standard deviation 96.6667%100%100%100%
70 °CPeak factor 100%100%100%98.3333%
Kurtosis factor 100%100%100%65%
Skewness factor100%100%100%45%
Table 2. Accuracy of frequency-domain eigenvalue classification.
Recognition Accuracy
TemperatureEigenvalueInlet Pipe X-DirectionInlet Pipe Y-DirectionInlet Pipe Z-DirectionVolute Tongue
Center of gravity frequency78.3333%53.3333%76.6667%86.6667%
25 °CMean Square Frequency75%51.6667%78.3333%86.6667%
Frequency variance83.3333%80%65%66.6667%
Center of gravity frequency46.6667%51.6667%71.6667%80%
50 °CMean Square Frequency50%48.3333%63.3333%80%
Frequency variance85%58.3333%88.3333%60%
Center of gravity frequency61.6667%53.3333%61.6667%65%
70 °CMean Square Frequency65%53.3333%65%60%
Frequency variance71.6667%63.3333%80%51.6667%
Table 3. Accuracy of time frequency domain eigenvalue classification.
Recognition Accuracy
TemperatureEigenvalueInlet Pipe X-DirectionInlet Pipe Y-DirectionInlet Pipe Z-DirectionVolute Tongue
25 °CIMF1100%98.3333%100%100%
IMF2100%96.6667%100%96.6667%
IMF3100%96.6667%88.3333%88.3333%
IMF4100%95%60%90%
IMF5100%76.6667%91.6667%96.6667%
IMF651.6667%81.6667%98.3333%95%
50 °CIMF1100%100%100%76.6667%
IMF2100%100%100%100%
IMF391.6667%48.3333%100%100%
IMF455%100%100%73.3333%
IMF591.6667%100%53.3333%100%
IMF666.6667%100%95%63.3333%
70 °CIMF185%100%96.6667%100%
IMF2100%100%93.3333%93.3333%
IMF361.6667%100%95%100%
IMF498.3333%100%91.6667%100%
IMF575%100%73.3333%100%
IMF673.3333%100%98.3333%48.3333%
Table 4. Accuracy of multi-classification recognition of time domain combined eigenvalues.
Recognition Accuracy
TemperatureInlet Pipe X-DirectionInlet Pipe Y-DirectionInlet Pipe Z-DirectionVolute Tongue
25 °C84.1667%92.5%86.6667%88.3333%
50 °C83.3333%80%85.8333%73.3333%
70 °C84.1667%80.8333%80%94.1667%
Average recognition accuracy83.8889%84.4444%84.1667%85.2778%
Table 5. Accuracy of multi-classification recognition of frequency domain combined eigenvalues.
Recognition Accuracy
TemperatureInlet Pipe X-DirectionInlet Pipe Y-DirectionInlet Pipe Z-DirectionVolute Tongue
25 °C50.8333%37.5%43.3333%40%
50 °C43.3333%23.3333%40.8333%33.3333%
70 °C36.6667%33.3333%40.8333%35.8333%
Average recognition accuracy43.6111%31.3889%41.6666%36.3889%
Table 6. Accuracy of multi-classification recognition of time frequency domain combined eigenvalues.
Recognition Accuracy
TemperatureInlet Pipe X-DirectionInlet Pipe Y-DirectionInlet Pipe Z-DirectionVolute Tongue
25 °C85%85.8333%65.8333%87.5%
50 °C77.5%68.3333%75%82.5%
70 °C75%87.5%62.5%55.8333%
Average recognition accuracy79.1667%80.5555%67.7778%75.2778%
Table 7. Accuracy of multi-classification recognition of combined eigenvalues.
Recognition Accuracy
Temperature25 °C50 °C70 °C
Recognition accuracy94.1667%95%100%
Publisher’s Note: MDPI stays neutral with regard to jurisdictional claims in published maps and institutional affiliations.