Article

Chemometric Classification and Geochemistry of Crude Oils in the Eastern Fukang Sag, Junggar Basin, NW China

1
Research Institute of Experiment and Testing, Karamay 834000, China
2
School of Energy Resources, China University of Geosciences, Beijing 100083, China
3
Key Laboratory of Marine Reservoir Evolution and Hydrocarbon Accumulation Mechanism, Ministry of Education, China University of Geosciences, Beijing 100083, China
*
Author to whom correspondence should be addressed.
Energies 2022, 15(23), 8921; https://doi.org/10.3390/en15238921
Submission received: 25 October 2022 / Revised: 17 November 2022 / Accepted: 21 November 2022 / Published: 25 November 2022
(This article belongs to the Special Issue Advances in Petroleum Geology and Unconventional Oil and Gas)

Abstract

:
Thirty oil samples collected from the eastern Fukang Sag were analyzed geochemically for their biomarkers and carbon isotopic compositions. The chemometric methods of principal component analysis and hierarchical cluster analysis, employed to thirteen parameters indicating source and depositional environment, classified the oil samples into three genetically distinct oil families: Family A oils were mainly derived from lower aquatic organisms deposited in a weakly reducing condition of fresh–brackish water, Family B oils came from a source containing predominantly terrigenous higher-plant organic matter laid down in an oxidizing environment of fresh water, and Family C oils received sources from both terrigenous and marine organic matter deposited in a weakly oxidizing to oxidizing environment of brackish water. Indirect oil–source correlations implied that Family A oils were probably derived from Permian source rocks, Family B oils originated mainly from Jurassic source rocks, and Family C oils had a mixed source of Carboniferous and Permian. Biomarker maturity parameters revealed that all three families of oils were in the mature stage. However, Family A oils were relatively less mature than Family B and Family C oils.

1. Introduction

Oil–oil correlation and oil–source correlation are important contents in the field of oil and gas geochemistry. They play an important role in deeply understanding the relationship between reservoirs, establishing petroleum systems, and guiding oil and gas exploration [1]. It is generally believed that the more parameters are used for correlation, the more reliable the study results will be [2]. Conventional oil–source correlation is generally based on spectrum similarity and a combination of biomarker parameters (e.g., cross plots of two parameters). However, due to the multiplicity of biomarker parameters and the complexity of geological processes, many contradictory conclusions are sometimes drawn. For oil–oil and oil–source correlation based on chemometric methods, due to introducing the idea of dimensionality reduction in mathematics, the influence of multiple variables can be comprehensively considered simultaneously in the familiar two-dimensional or three-dimensional charts [3,4]. Thereinto, hierarchical cluster analysis (HCA) and principal component analysis (PCA) are two common and well-established chemometric methods, and they are widely applied in geochemical studies [5,6,7,8,9,10,11,12]. Principal component analysis is a multivariate statistical method by dimensionality reduction to transfer multiple possibly relevant variables into a smaller number of uncorrelated variables (principal components), so that these principal components can reflect the most information of the original data. However, it should be noted that principal component analysis is often a means to an end and cannot be regarded as the result of studies; thus, it needs to combine with other statistical methods (e.g., regression analysis, cluster analysis, discriminant analysis) to solve practical problems. Hierarchical clustering is the most widely used method in cluster analysis. The idea of hierarchical clustering is as follows: first, the samples or variables are regarded as one class and the most similar classes are merged according to the distance or similarity between the classes, then the similarity between the new class and other classes is calculated and the most similar classes are selected to be merged. The process continues until all samples (or variables) are merged into one class. The principle of oil family classification is similar, which makes it suitable for using hierarchical cluster analysis.
The Junggar Basin of northwestern China is one of the most petroliferous Paleozoic basins in China (Figure 1a), and abundant oil and gas resources have been found in the northwest, hinterland, south, and east of the basin [13,14]. It has a triangular geometry with an area of about 135,000 km2 [15]. The Fukang Sag is located in the east of the Junggar Basin (Figure 1b) and is the largest hydrocarbon generation sag in this basin [16]. There are mainly three sets of source rocks, namely Carboniferous, Permian, and Jurassic, which provide sufficient oil sources for reservoir formations of the study area [15,17]. In the eastern Junggar Basin, the Carboniferous sedimentary environment is mainly a marine–continental alternative deposition. The lower Carboniferous is dominated by marine facies and marine–continental transitional facies clastic rocks, while the upper Carboniferous is deposited with marine–continental transitional facies with volcanic rocks, continental clastic rock, and local coal seams or coal lines [18,19]. The organic matter type of Carboniferous source rocks is mainly type Ⅱ and Ⅲ kerogen, and the maturity of organic matter is from low to high [20]. The Permian source rock is the best source rock in the Eastern Junggar Basin, with high organic matter abundance and good organic matter type (mainly type Ⅱ and partly type Ⅲ), which was deposited in fresh-to-semisaline continental lakes dominated by algae and bacteria organic matters [21,22]. The source rock was in the stage of mature to highly mature. The Jurassic coal-bearing strata were formed in oxic to suboxic freshwater conditions, and the organic matter of Jurassic source rock is primarily type III, primarily derived from terrestrial higher plants. The evolution stage of Jurassic source rock is generally from low maturity to medium maturity [16,23]. Therefore, source-related and/or depositional environment-related parameters can be used to distinguish oils from different sources [1,24]. Due to the development of multiple sets of source rocks and the complexity of the tectonic evolution in the study area, the oil and gas properties in the area are diverse and the oil–source relationship is complex [25,26]. Hence, the conventional oil–oil correlation method brings on extensive workload and with multiplicity of solutions occasionally. In view of the above problems, we try to use PCA and HCA methods with multiparameter biomarkers to classify genetically related oil families (oil–oil correlation) in the study area. The purpose of this study was to provide a chemometric method for oil family classification and make clear the differences in source input, depositional environment, and thermal maturity of the oils, which may lead to the identification of petroleum systems in the study area.

2. Samples and Methods

2.1. Samples

In this study, thirty crude oil samples from different depths and reservoirs in eastern Fukang Sag were selected for analysis of biomarker compositions. Please note that these oil samples were selected from a larger sample pool. The extensively biodegraded oils were excluded because biomarkers can be seriously affected by this secondary process, which may affect the accuracy of the analysis results. Therefore, selected oil samples were nonbiodegraded or only slightly biodegraded (n-alkanes distributions of some of the samples were affected), ensuring that the linear isoprenoids, terpanes, and steranes in crude oil were well preserved. The crude oil separation into saturated and aromatic fractions by column chromatography were conducted as described by Jiang et al. (2021) [27]. The oil sample information and geochemical data are provided in Table 1, and the well locations of these samples are shown in Figure 1c.

2.2. Experimental Methods

Gas chromatography (GC) analysis of the saturated fraction was carried out on a HP 6890N gas chromatograph with a HP-5MS capillary column (30 m × 0.25 mm × 0.25 μm), and nitrogen as the carrier gas. The GC oven temperature was initially held at 100 °C for 0.1 min, then raised to 310 °C at 4.2 °C/min, and finally held at 310 °C for 8 min.
Gas chromatography–mass spectrometry (GC–MS) analysis of the saturated fraction was performed using a Thermo Fisher Trace 1300-ISQ 7000 GC–MS system equipped with an DB-5MS fused silica capillary column (30 m × 0.25 mm × 0.25 μm film thickness). The GC operating conditions were as follows: the initial temperature was held at 100 °C for 3 min, heated to 300 °C at 2.6 °C/min, and held for 10 min. Helium was used as the carrier gas. The injector temperature was set to 300 °C. The mass spectrometer was run in the selected ion mode, monitoring ion mass-to-charge ratio (m/z) 177, 191, 205, 217, 218, 221, 231, 259, 400, 412, and 414. Biomarker ratios used in this study were calculated by measuring the appropriate peak heights.
The stable carbon isotope compositions of the whole oils and their saturate and aromatic fractions were carried out on a Thermo Fisher MAT-253 instrument coupled to a Flash EA 1112. The combustion furnace was operated at 980 °C. The stable carbon isotope values are reported relative to the Pee Dee Belemnite (PDB) standard with an error of less than 0.1‰. Samples were tested at least twice and take the average value as the final result.

2.3. Computational Methods

In this study, two chemometric methods, PCA and HCA, were used to reveal the genetic relationship between crude oil samples in the eastern Fukang Sag. They were completed with the SPSS software version 22.0 (IBM Inc., Armonk, NY, USA). PCA was conducted through the SPSS factor analysis module, since there is no menu option specially set for PCA in SPSS. The parameters used in PCA are described in the following section. The hierarchical clustering of Q-type cluster analysis (sample cluster) was employed in this study.

3. Results

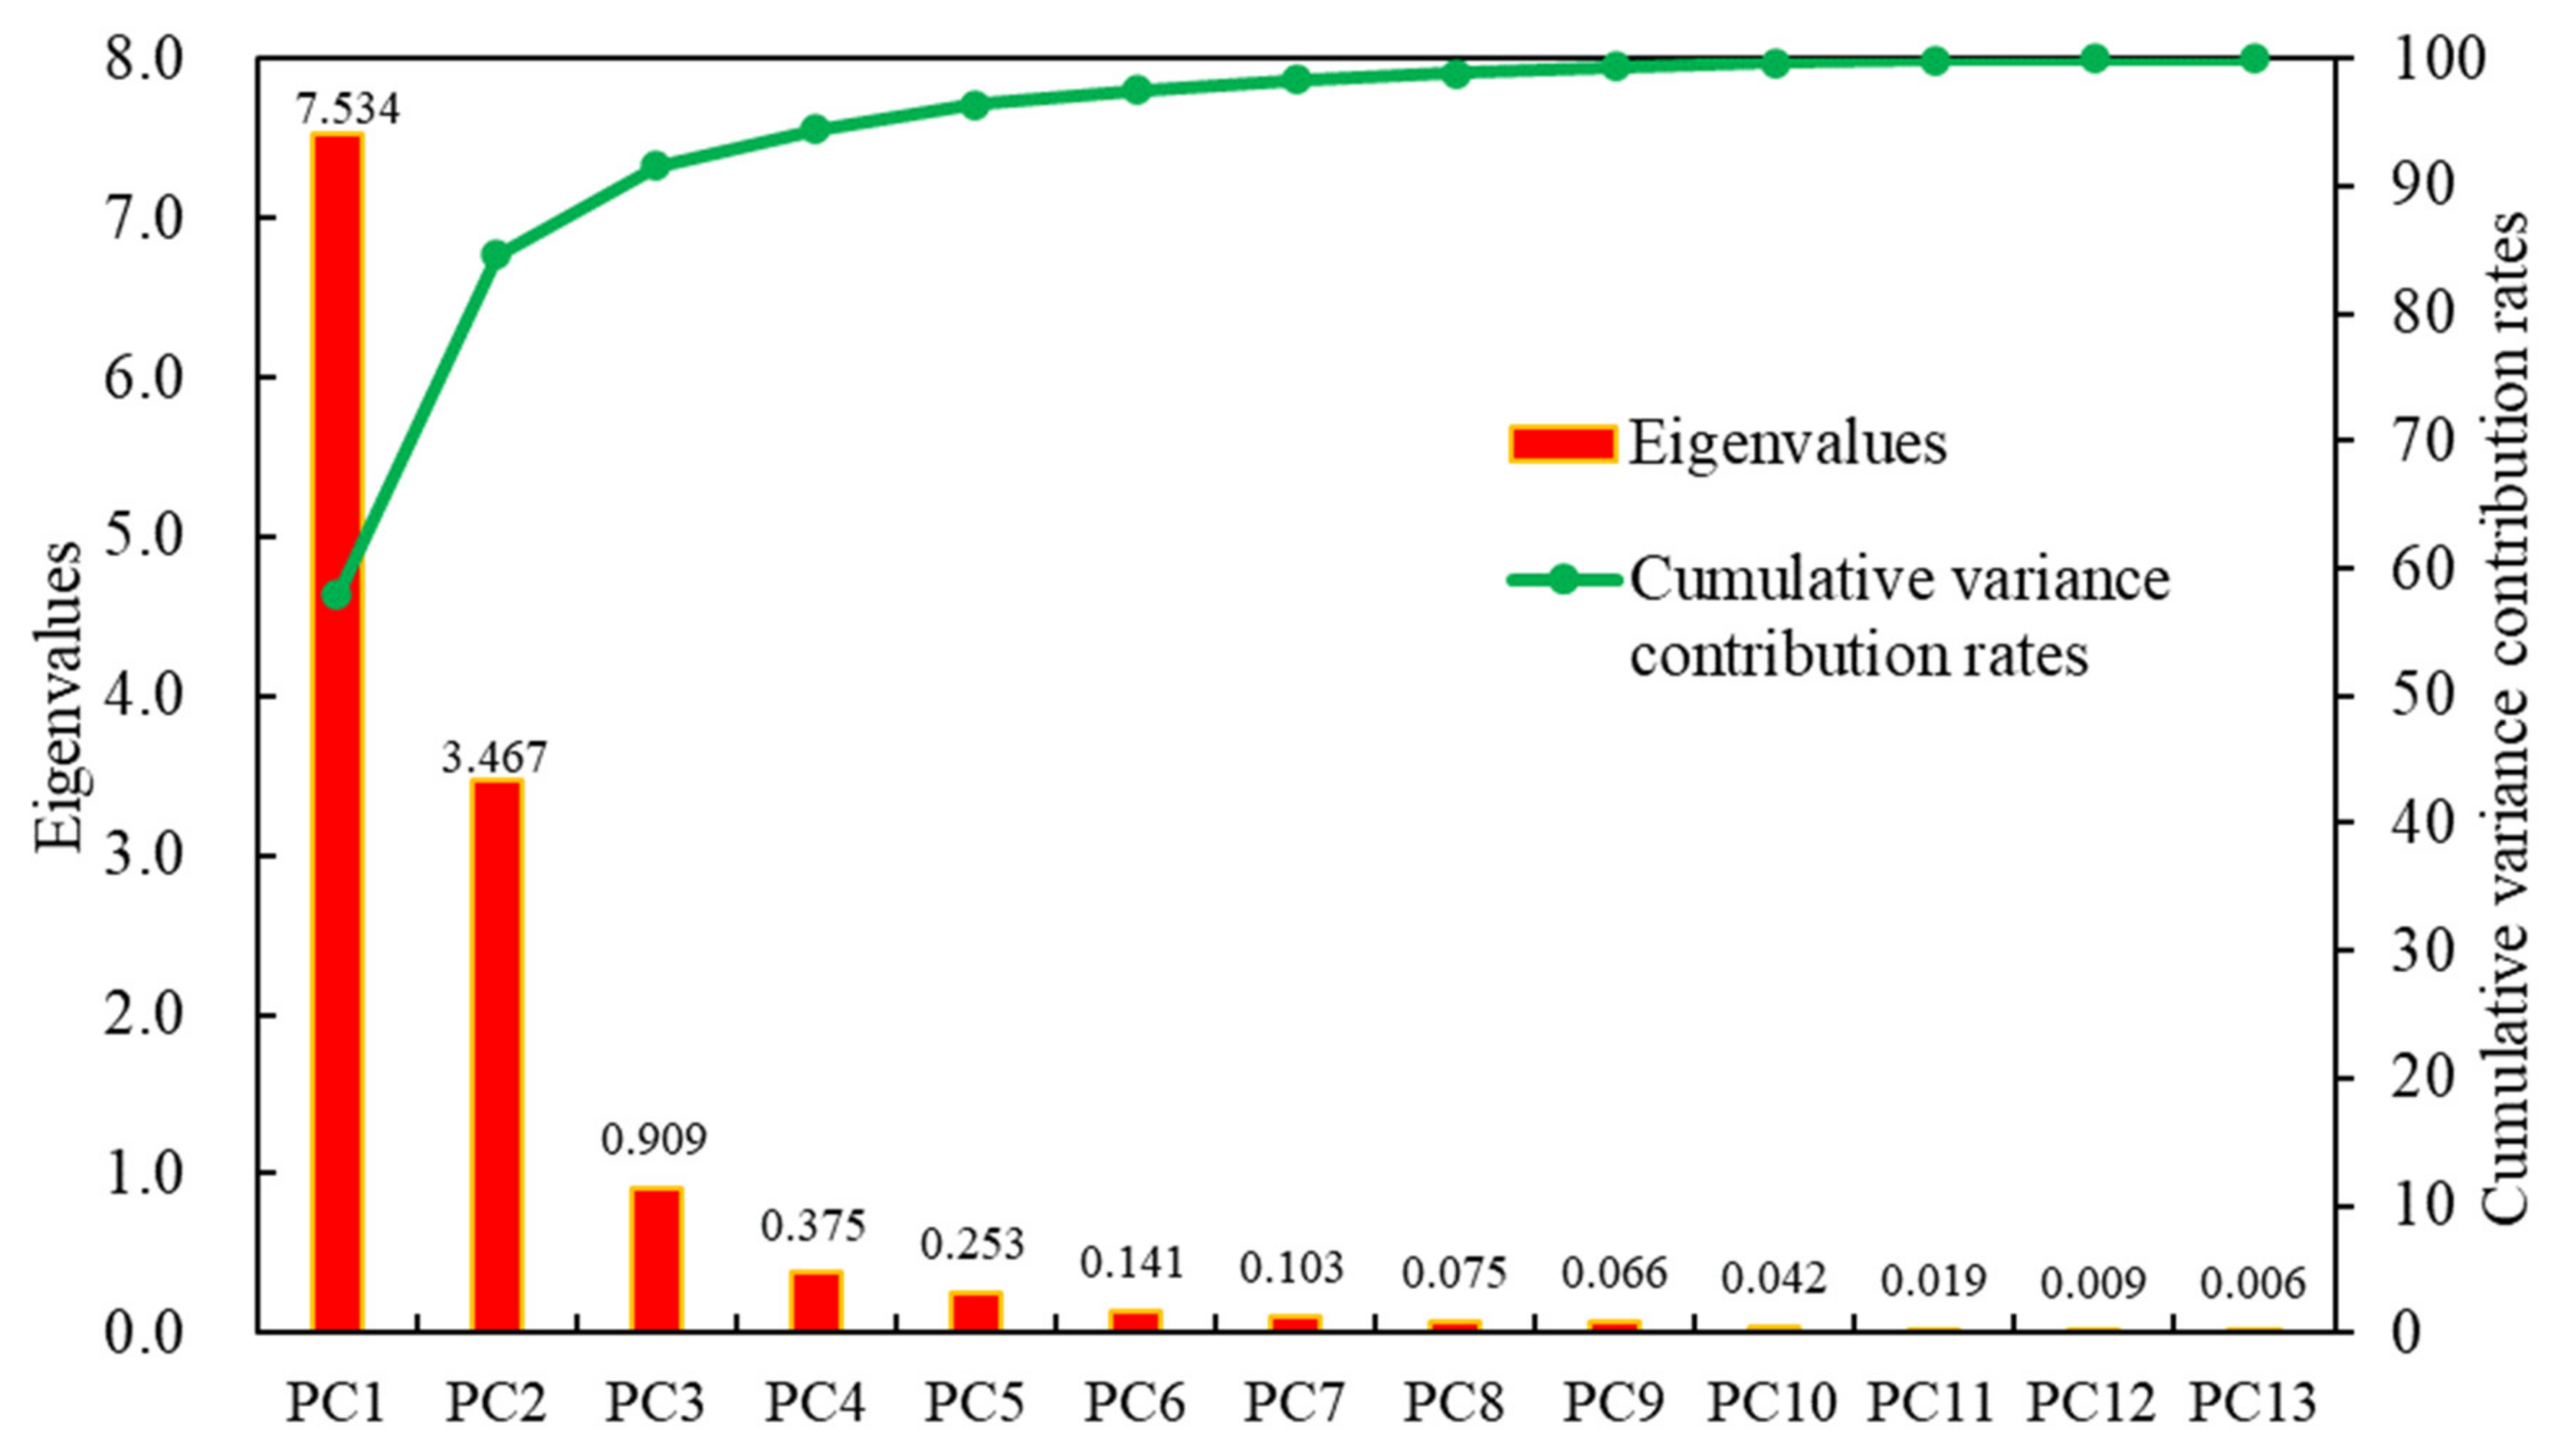
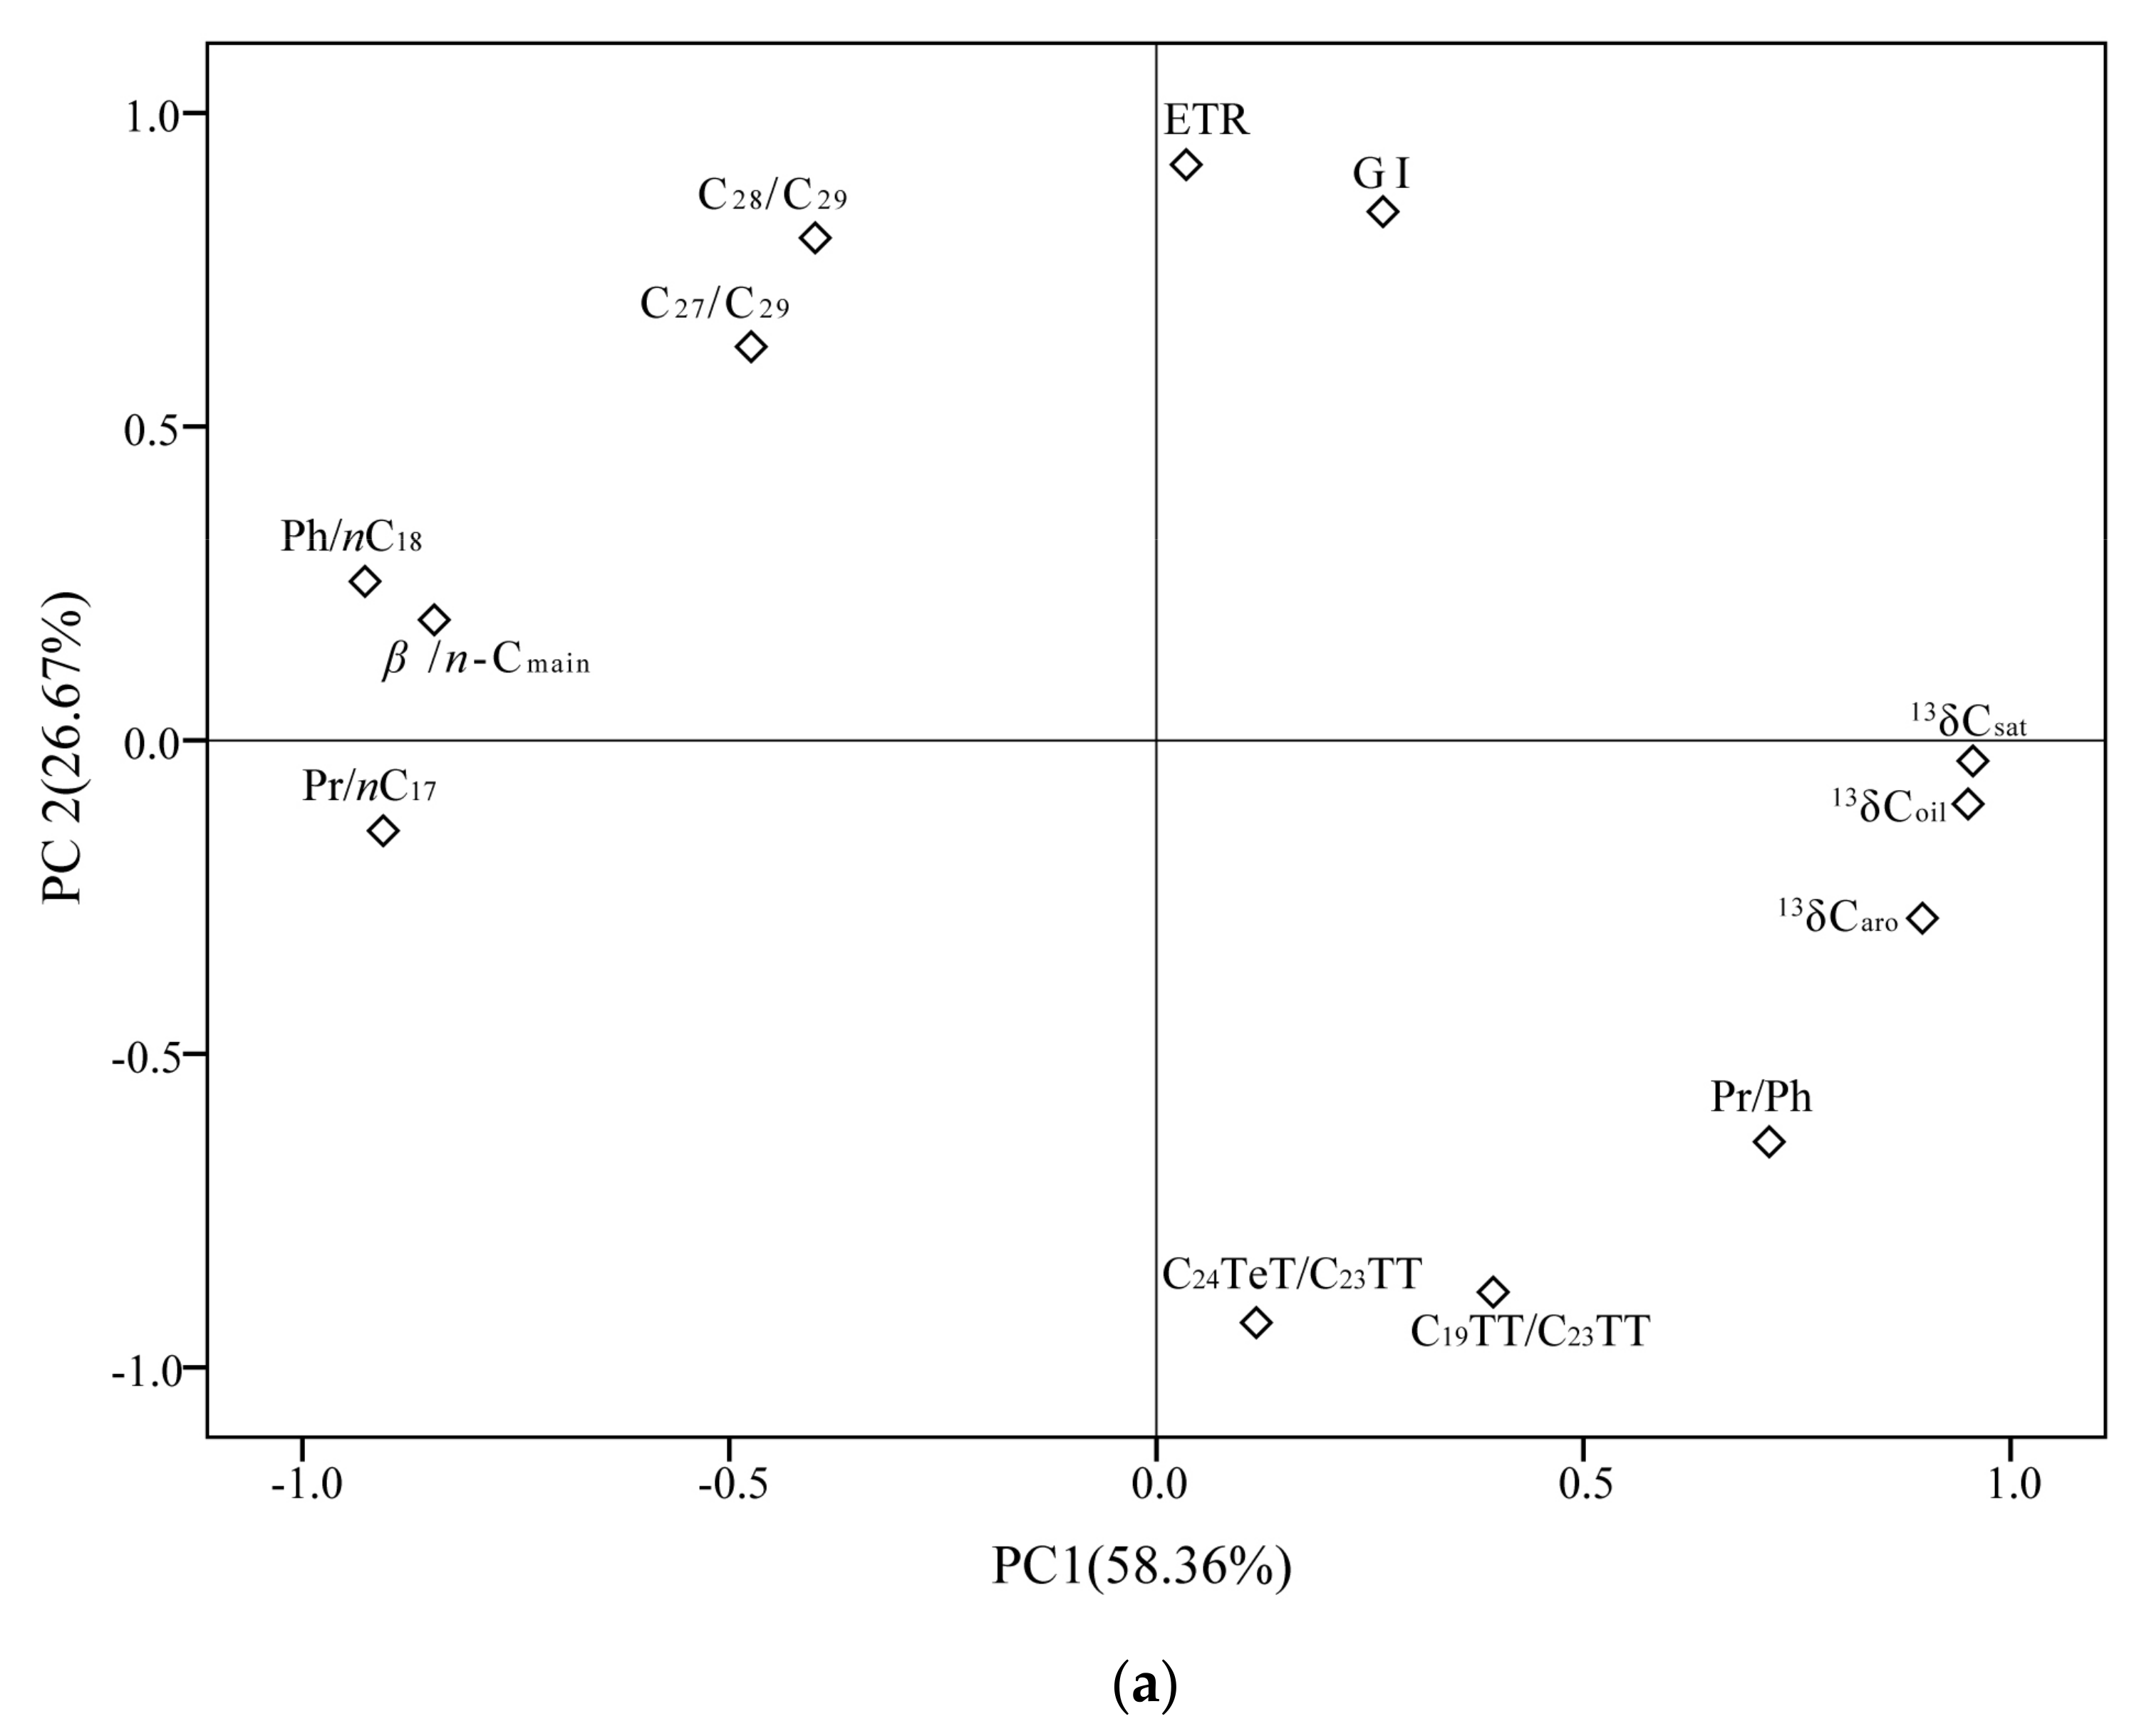
3.1. Principal Component Analysis (PCA)

3.1.1. Parameters Selection

The carbon isotopic composition of crude oil and its fractions have been used widely for oil–oil and oil–source correlation studies, as well as an indicator of the depositional environment [28]. Generally, crude oil from the same source can cause 2~3‰ variations in stable carbon isotope value (δ13C) due to different maturity [2,29]. In addition, the isotopic composition of crude oil is not easily affected by biodegradation [30]. In this study, the carbon isotopic ratios of saturated and aromatic fractions of the oil samples range widely from −25.95‰ to −32.68‰ and −25.77‰ to −31.15‰, respectively, far beyond what could be affected by maturity and biodegradation, and it indicates that the studied oil samples are derived from more than one source [5]. Therefore, the carbon isotope values can be effective parameters for chemometric analysis.
Biomarkers are defined as organic compounds found in sedimentary rocks or oils in which a sufficient part of the carbon skeleton has been preserved [7]. These compounds, including steranes and terpanes, are sensitive to the properties of source rocks, such as depositional conditions (e.g., salinity, anoxicity, oxicity, etc.), lithology, organic matter type and quality, and maturity. Thus, biomarkers can be used for oil–oil correlation [6]. Biomarkers that can be easily affected by secondary processes (e.g., biodegradation and migration) were excluded. Besides that, in order to avoid the influence of maturity on crude oil classification, some parameters closely related to maturity were also not employed, e.g., Ts/Ts + Tm, C29sterane20S/(20S + 20R), C29 steraneαββ/(ααα + αββ), etc. Therefore, combined with the previous studies on the oil–oil and oil–source correlation in this area [13,16,25,26,31,32], we finally selected ten source-related and sedimentary environment-related parameters and three stable carbon isotope values: δ13Coil, δ13Csat, δ13Caro, Pr/Ph, Pr/nC17, Pr/nC18, C19 tricyclic terpane/C23 tricyclic terpane (C19TT/C23TT), C24 tetracyclic terpane/C23 tricyclic terpane (C24TeT/C23TT), ETR, Ga/C30H, αααC27(20R)/αααC29(20R) and αααC28(20R)/αααC29(20R), which are commonly applied in chemometric studies [33,34].
In PCA, data selection and preprocessing are important factors in the success of principal component analysis [35]. Actually, there is a large difference in the measuring scales between biomarkers and carbon isotope ratios. Hence, in order to eliminate the effects of magnitude and dimension, it is necessary to preprocess the raw data (data normalization) to ensure an equal weight for each parameter. In this study, we use the minimum–maximum normalization method to make the value of each parameter in the interval of [0, 1]. As shown in the constructed correlation matrix (Table 2), there is a strong correlation between these variables. These selected parameters can be useful data for principal component analysis.

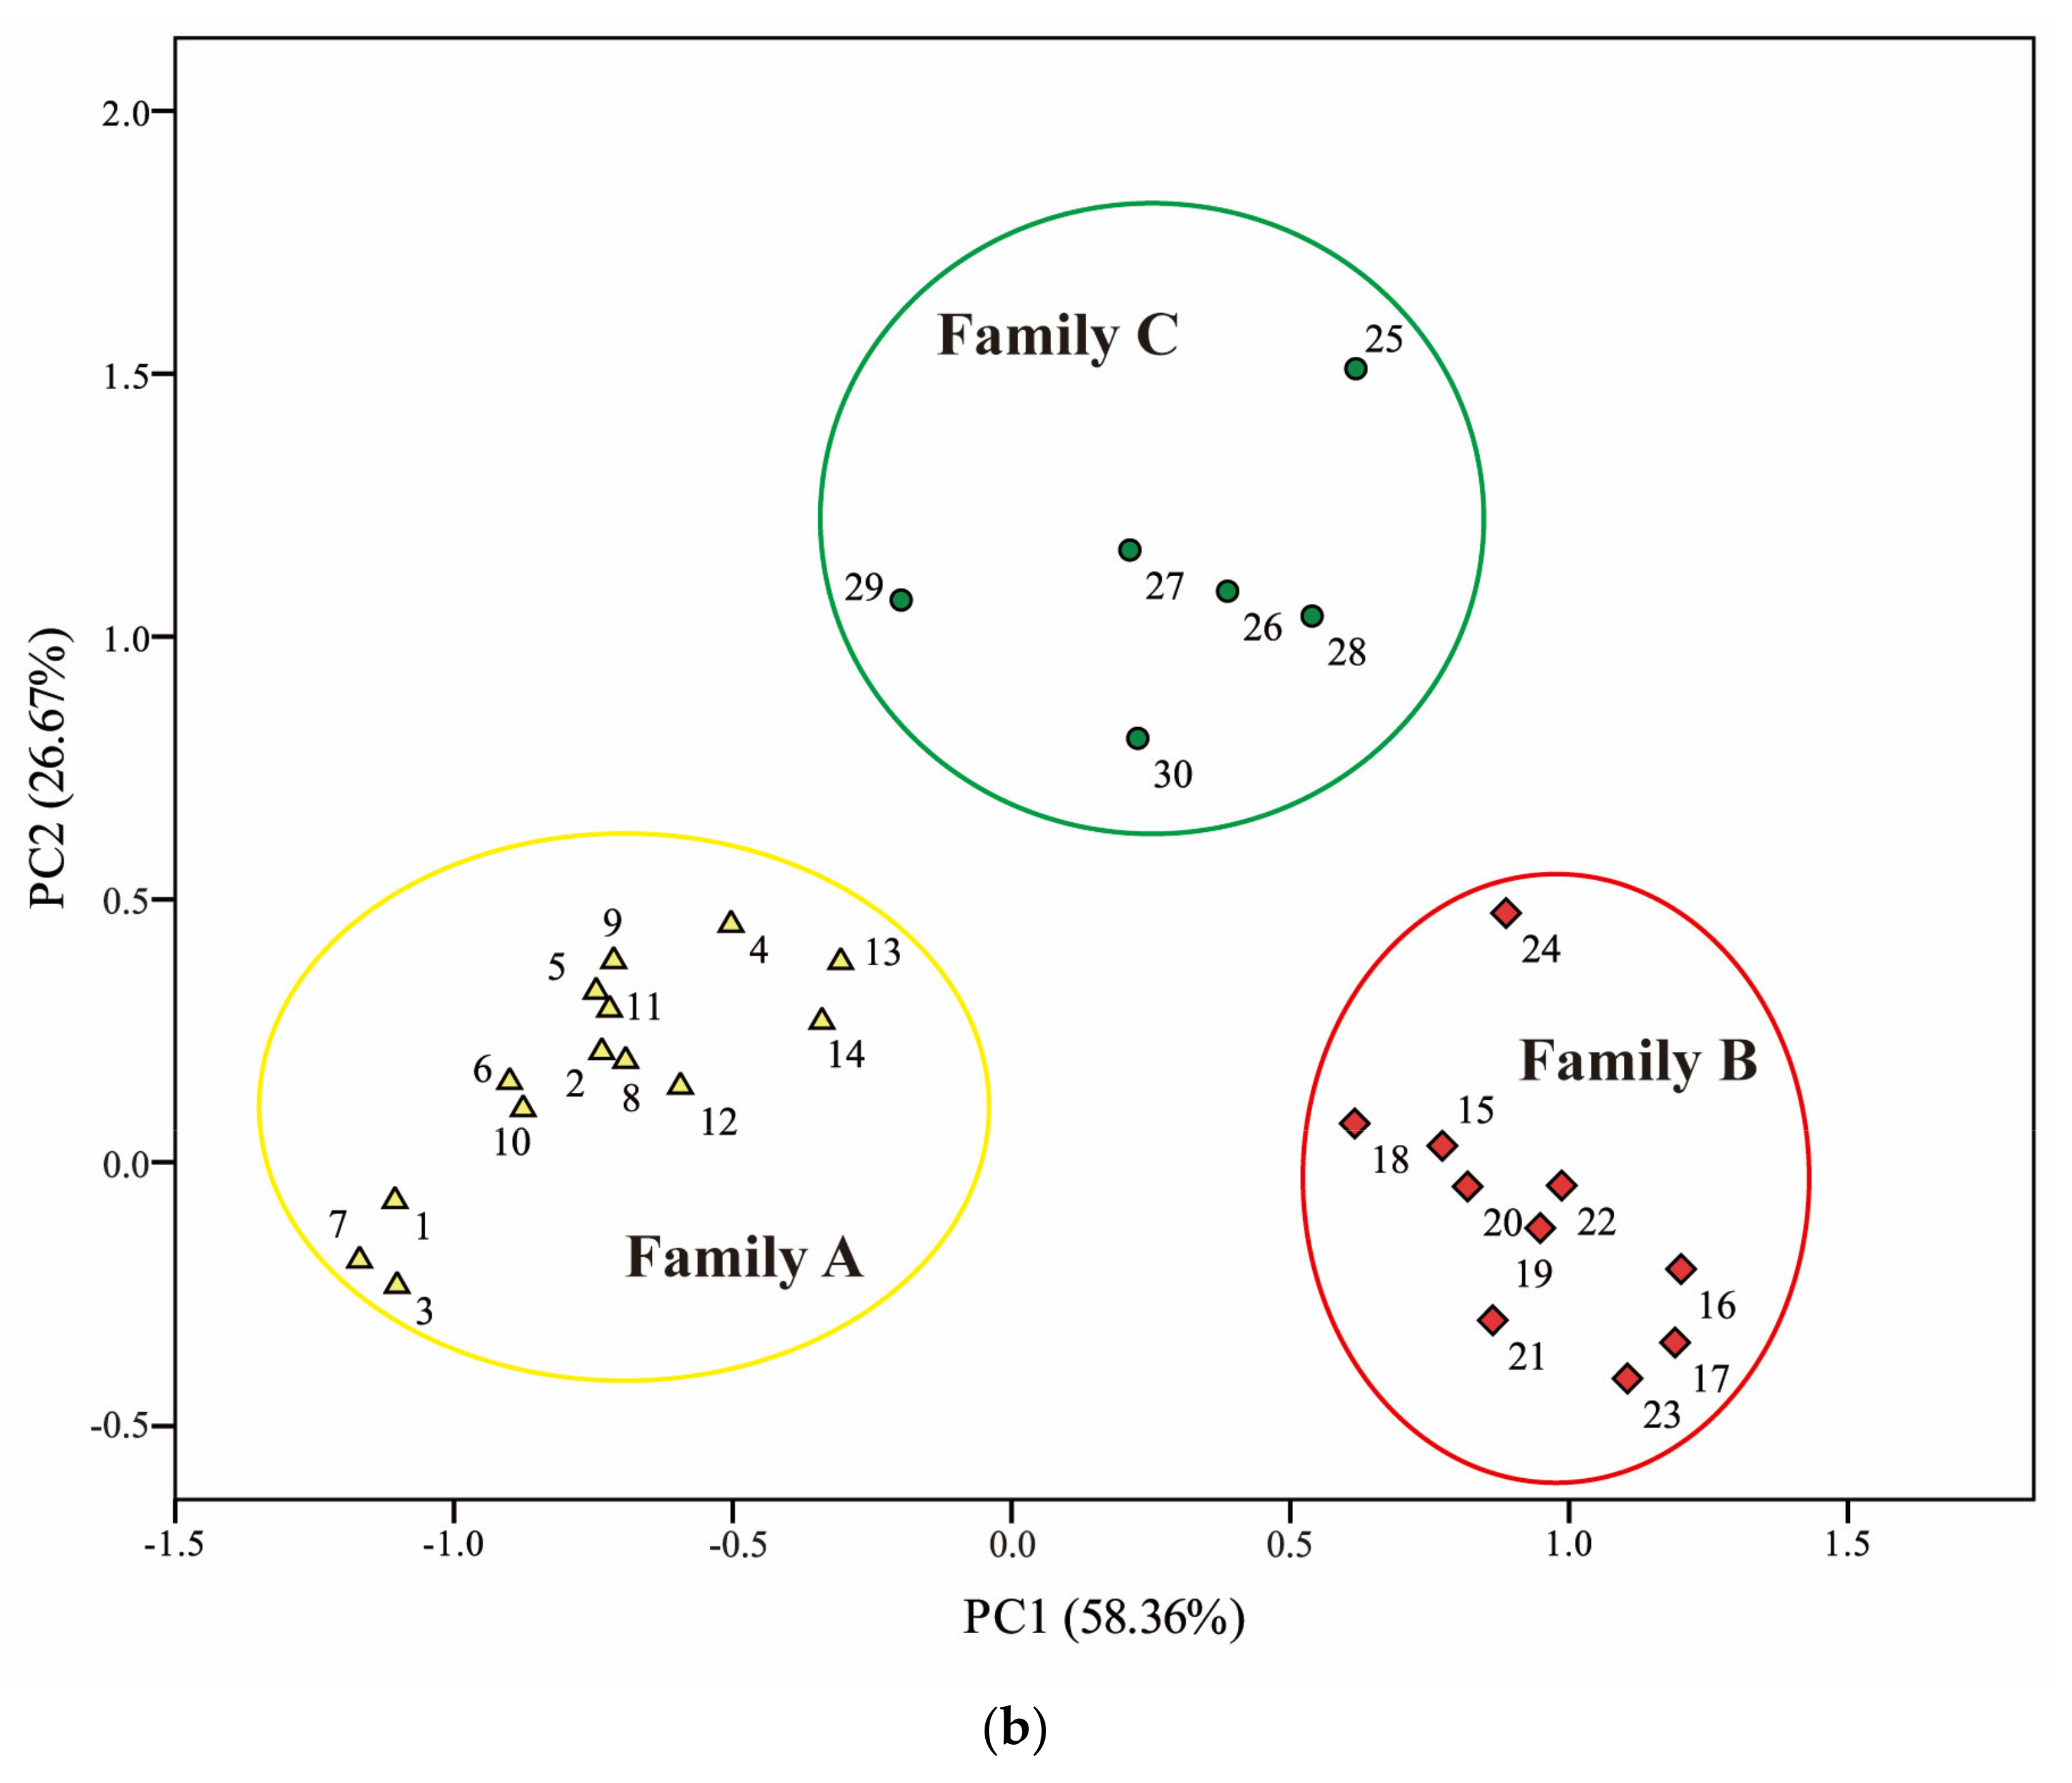
3.1.2. Principal Component Scores

In PCA, after standardizing the original data and calculating the correlation matrix, the KMO and Bartlett’s test are generally used to adjudge the appropriate usage of principal component analysis [36]. According to Kaiser’s research, KMO > 0.7 is middling to perform factor analysis, and KMO > 0.8 is meritorious. The KMO value of this study is 0.808 (Bartlett’s test of sphericity: approximately χ2 = 613.618, d.f. = 78, significance = 0.000); therefore, the selected parameters are appropriate to carry out the principal component analysis. It is generally believed that when the cumulative variance accounts for 85% of the total variances, most information of the original data can be reflected [37]. Accordingly, the selected 13 variables are extracted into two components (PC1 and PC2) for oil family classification. PC1 (58.36%) and PC2 (26.67%) account for 85.03% of the total variance in the dataset (Figure 2), which could basically represent the geochemical information of these crude oil samples.
In fact, one of the advantages of PCA is that nearly every result can be represented graphically. Through calculating the principal component values of each sample (the detailed procedures of calculation may refer to Wang and Ma, 2018), the loading and score plots of PC1 vs. PC2 are obtained. By comparing the loading and score plots, the geochemical parameters responsible for groupings become apparent. As shown in Figure 3a,b, the studied oil samples in the eastern Fukang Sag can be easily classified into three families: Family C oils have high positive values for PC2, meaning that they have the highest ETR and GI values and the lowest C24TeT/C23TT value. Oils from Families A and B have mostly negative values for PC2, but Family B oils have positive values for PC1, meaning that they have high C19TT/C23TT and Pr/Ph ratios and heavy carbon isotope values (δ13Coil, δ13Csat, and δ13Caro), whereas Family A oils have negative values for PC1, and this indicates that they have the highest Pr/nC17, Ph/nC18, β/n-Cmain, C27/C29, and C28/C29 ratios. It can therefore be expected that PC1 is sensitive to sources of organic matter.

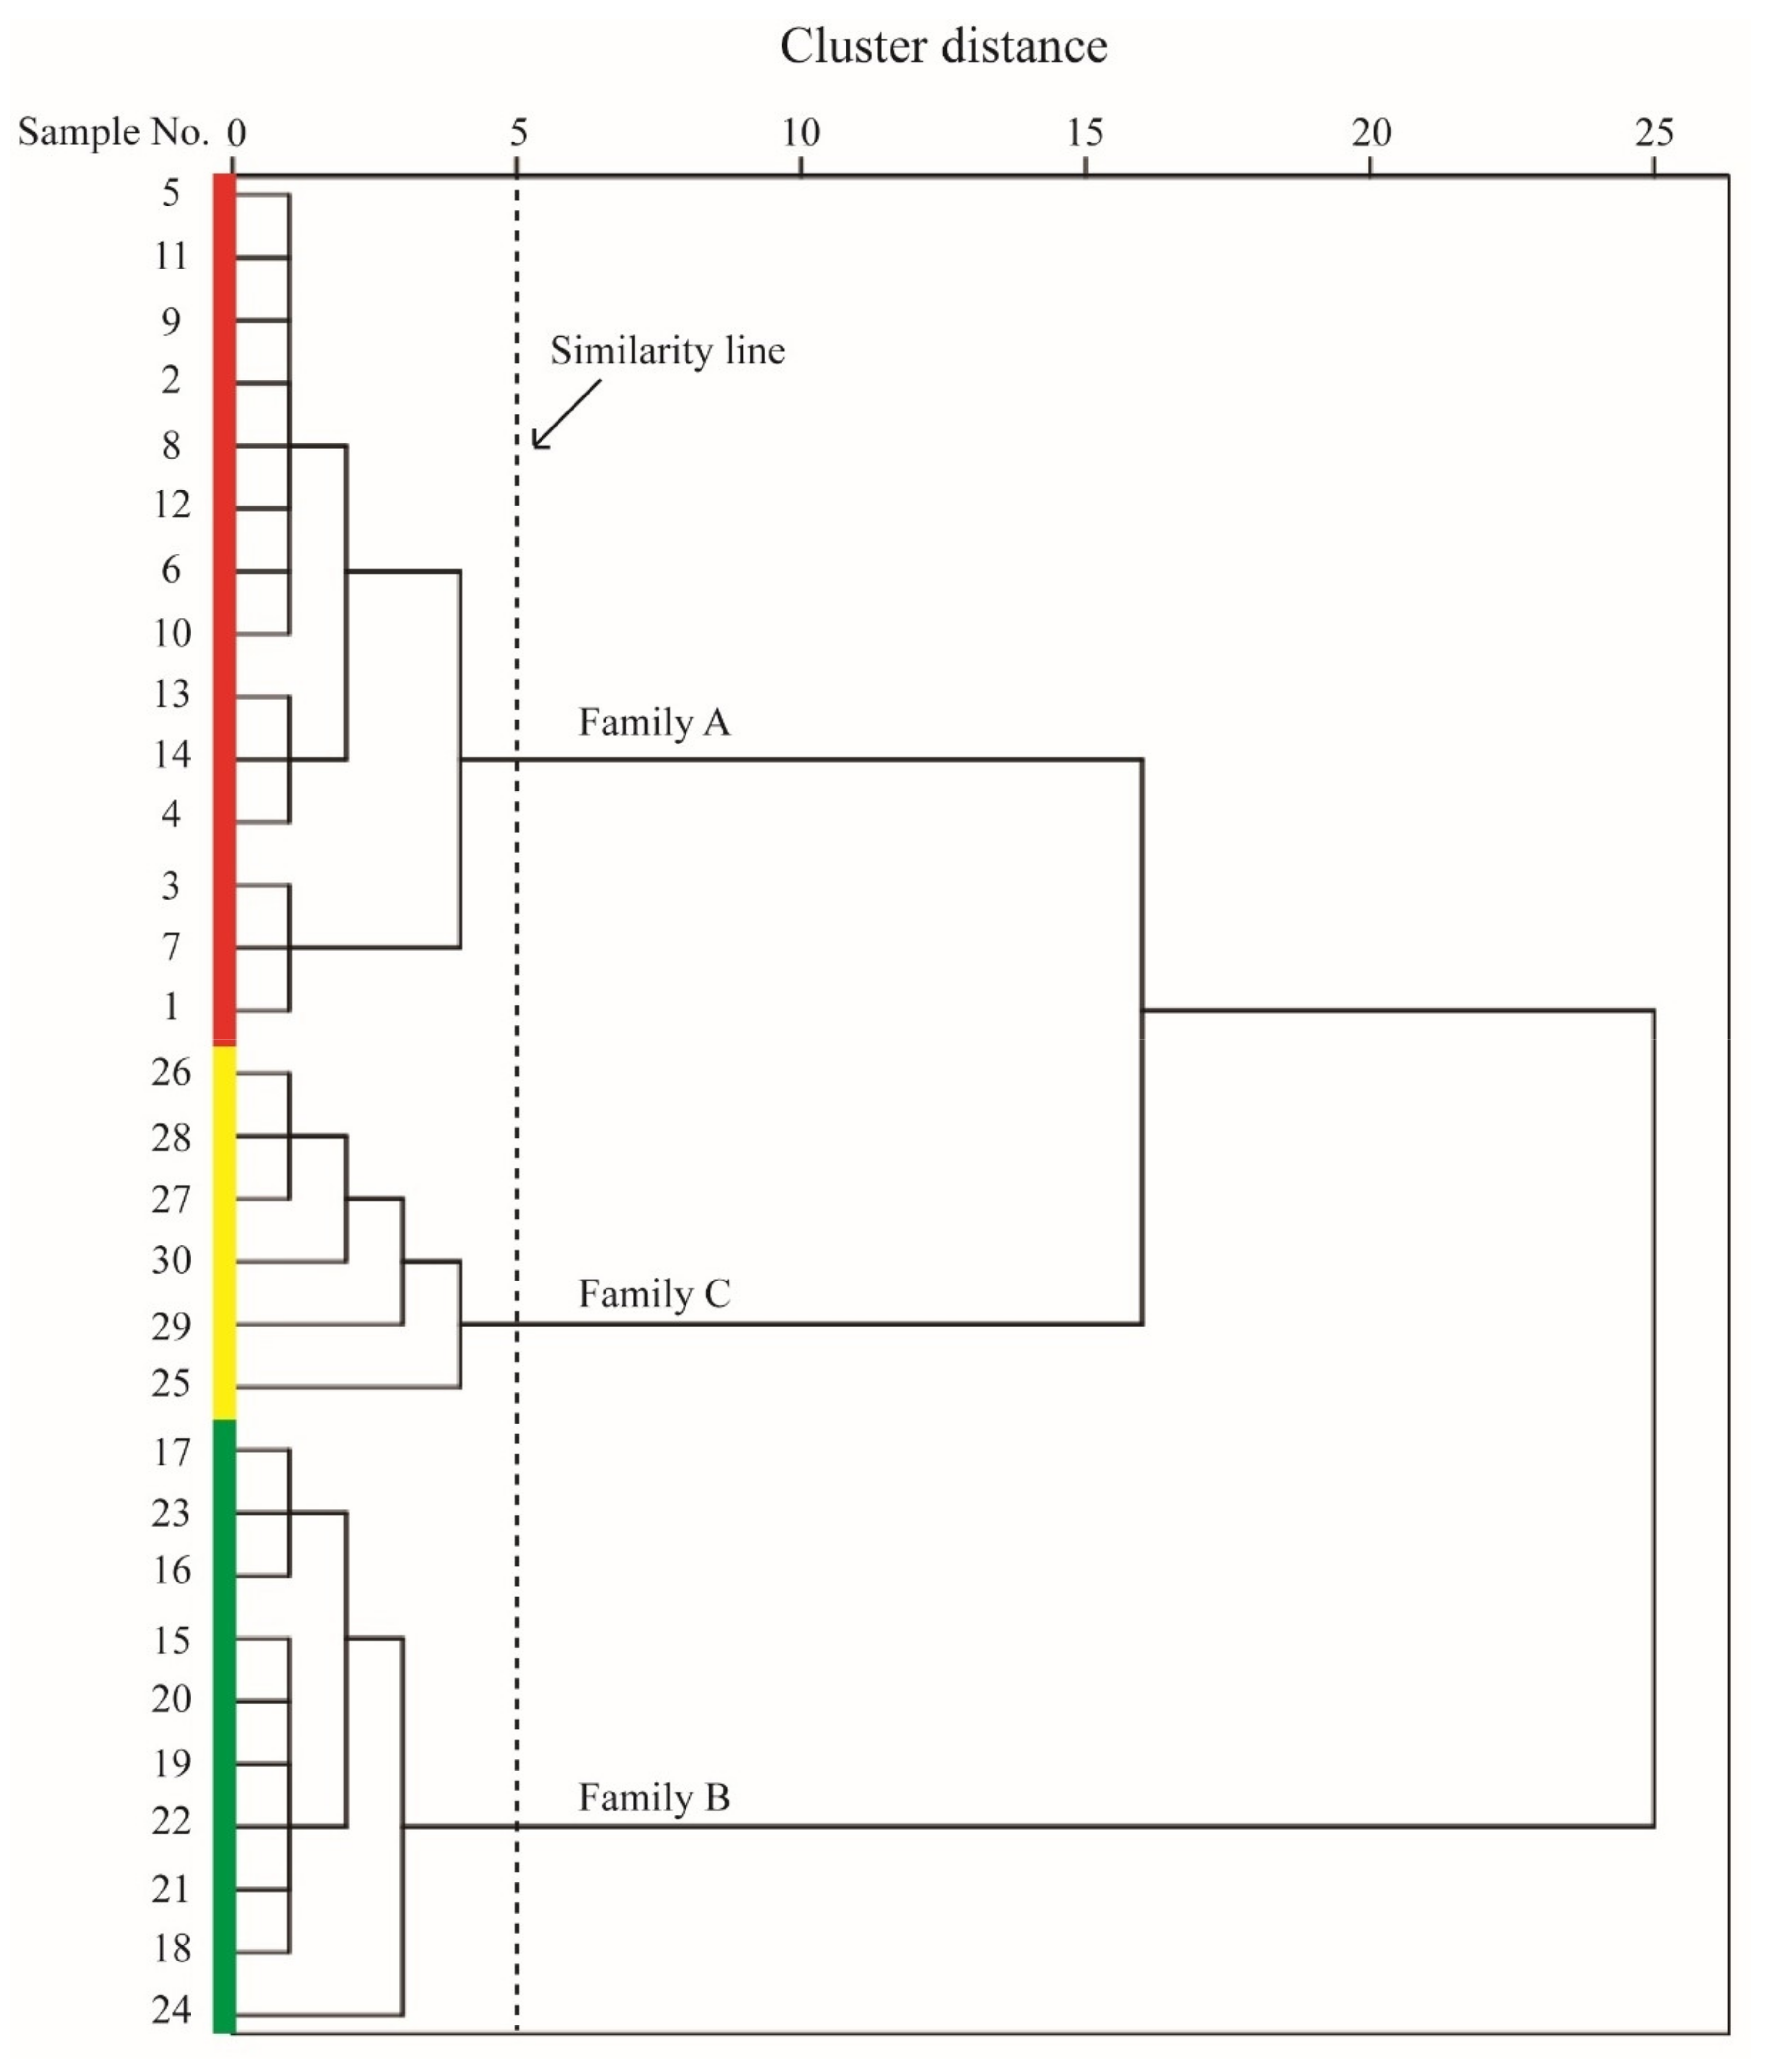
3.2. Hierarchical Cluster Analysis (HCA)

In this study, principal component scores (PC1 and PC2) were used to replace the original variables for sample clustering. In HCA, the square Euclidean distance and within-groups linkage method were used. The distance between samples is described by the standard data of 0~25. The shorter the distance is, the better the correlation is. The clustering analysis results were represented by a dendrogram (Figure 4), and the studied oil samples were separated into three genetically different oil families with the cluster distance of 5. Fourteen oil samples are included in Family A, ten oil samples constitute Family B and Family C contains six oil samples.

4. Discussion

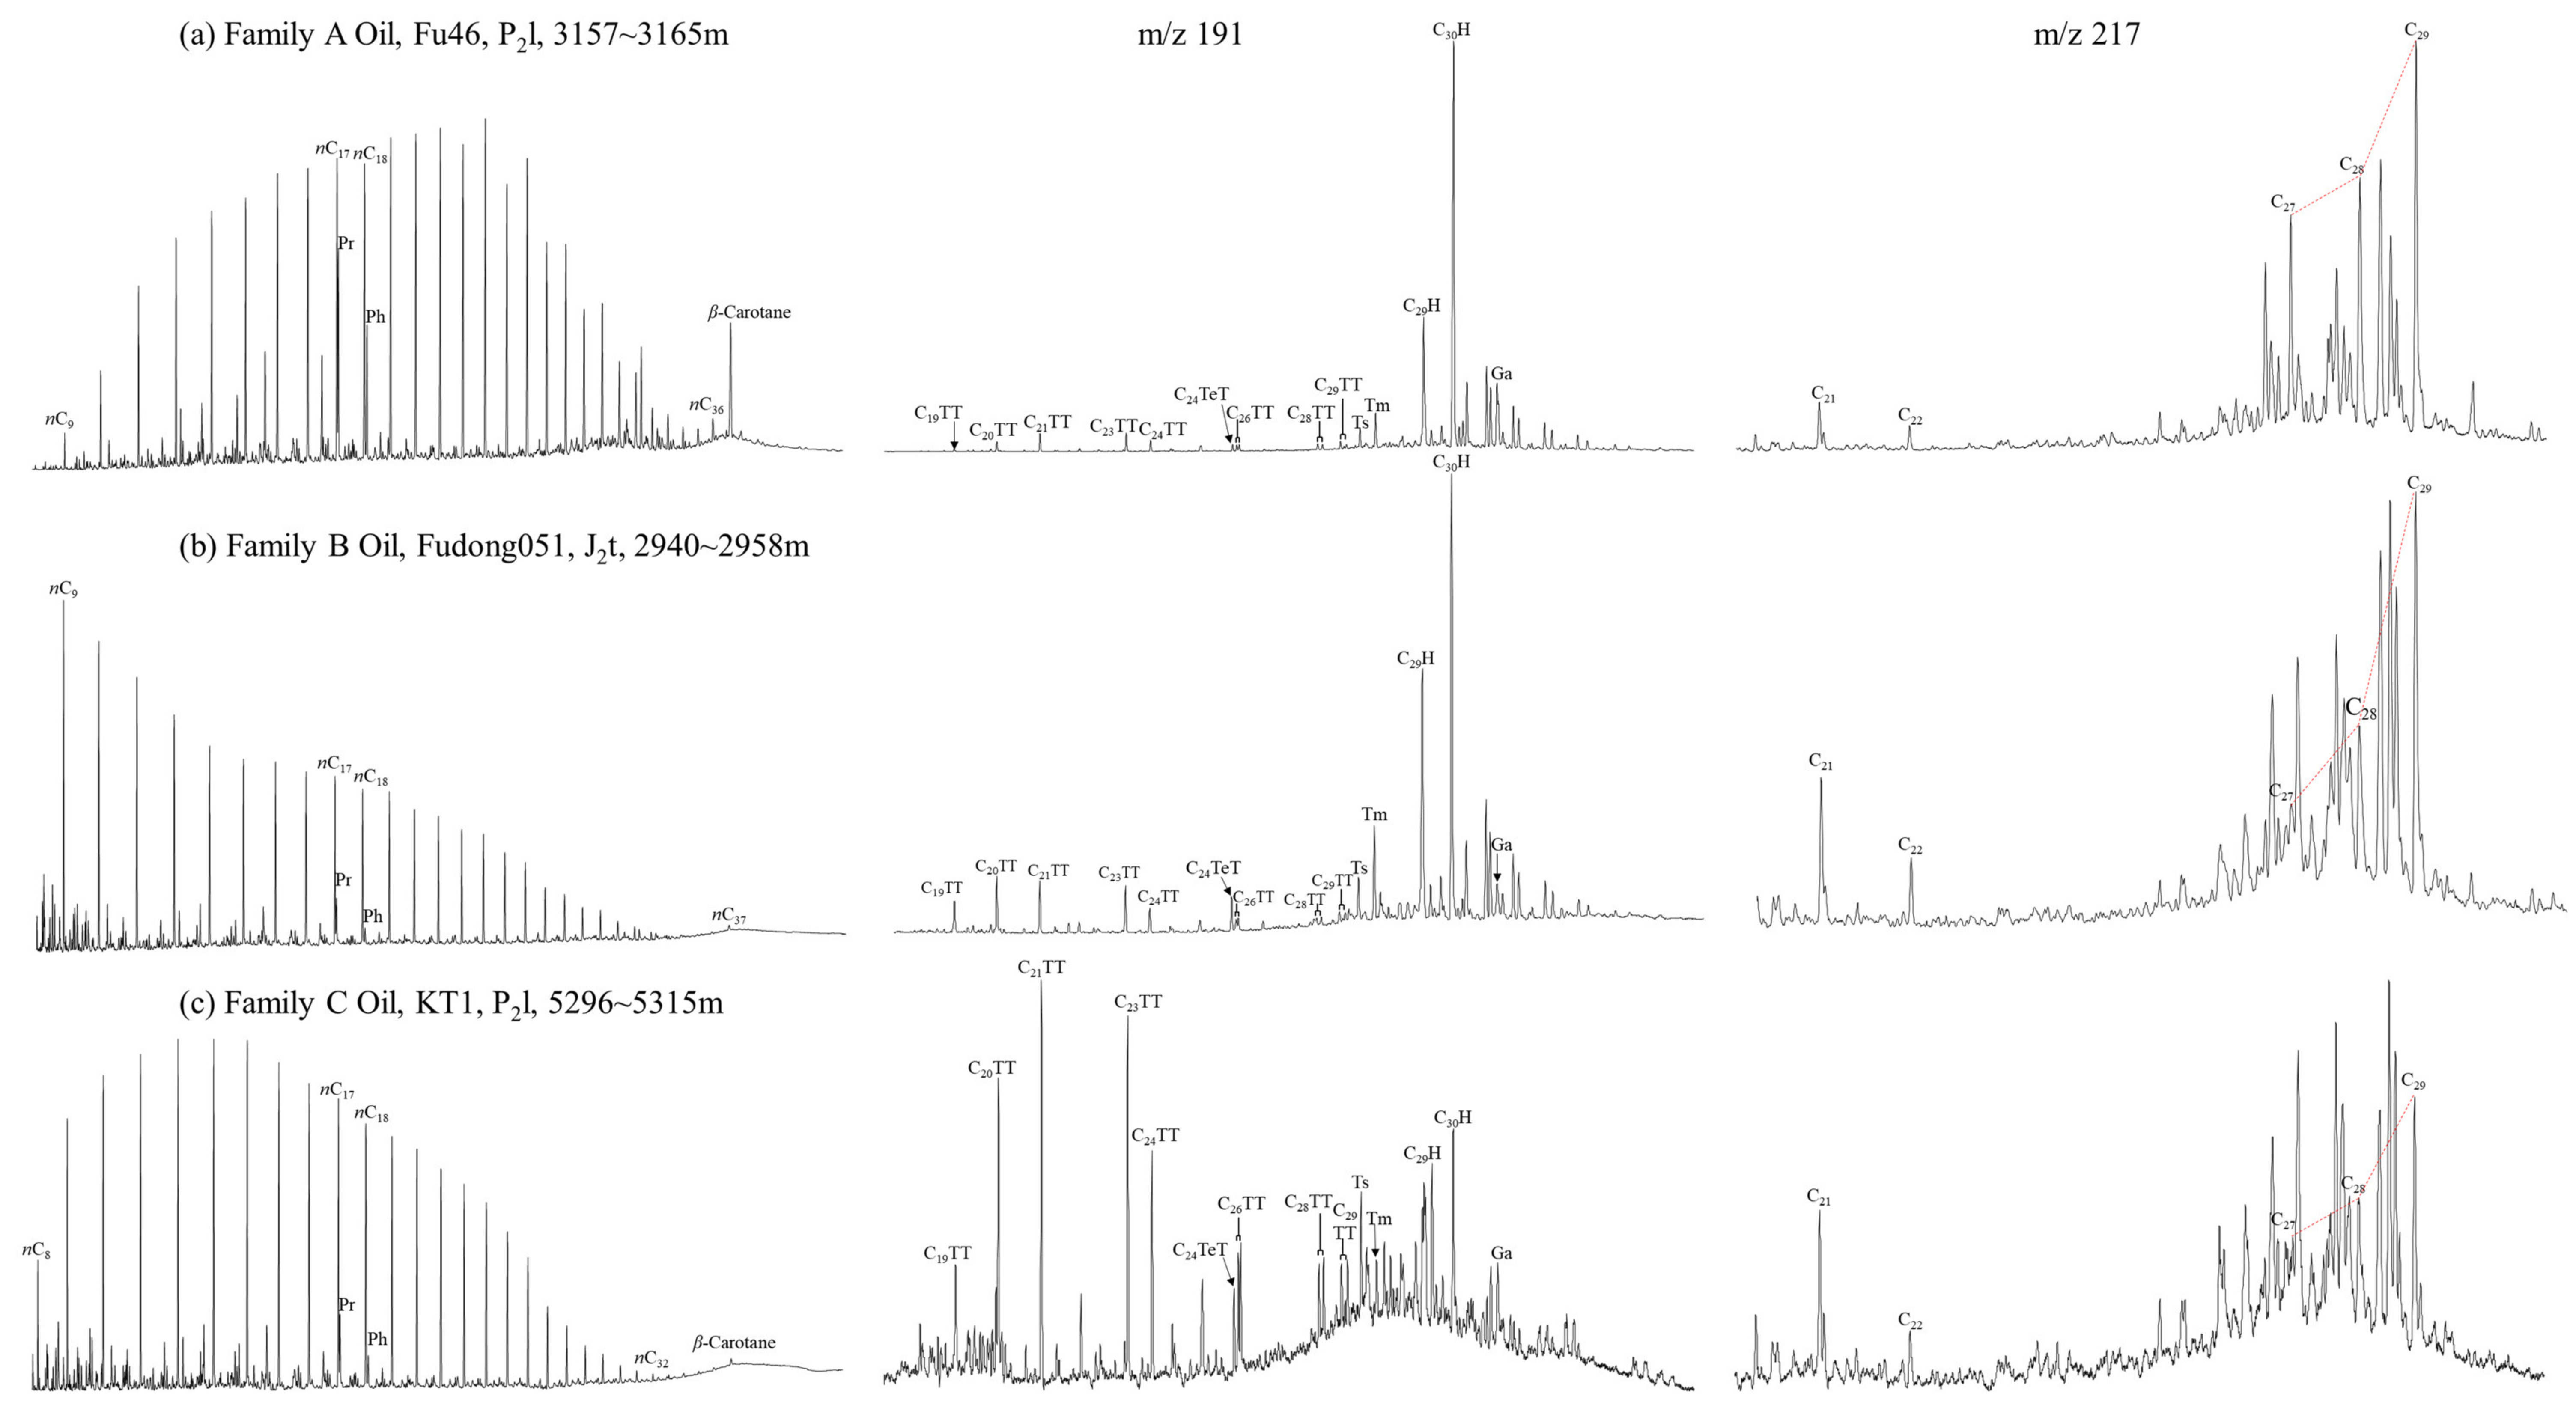
4.1. Geochemical Characteristics of Oil Families

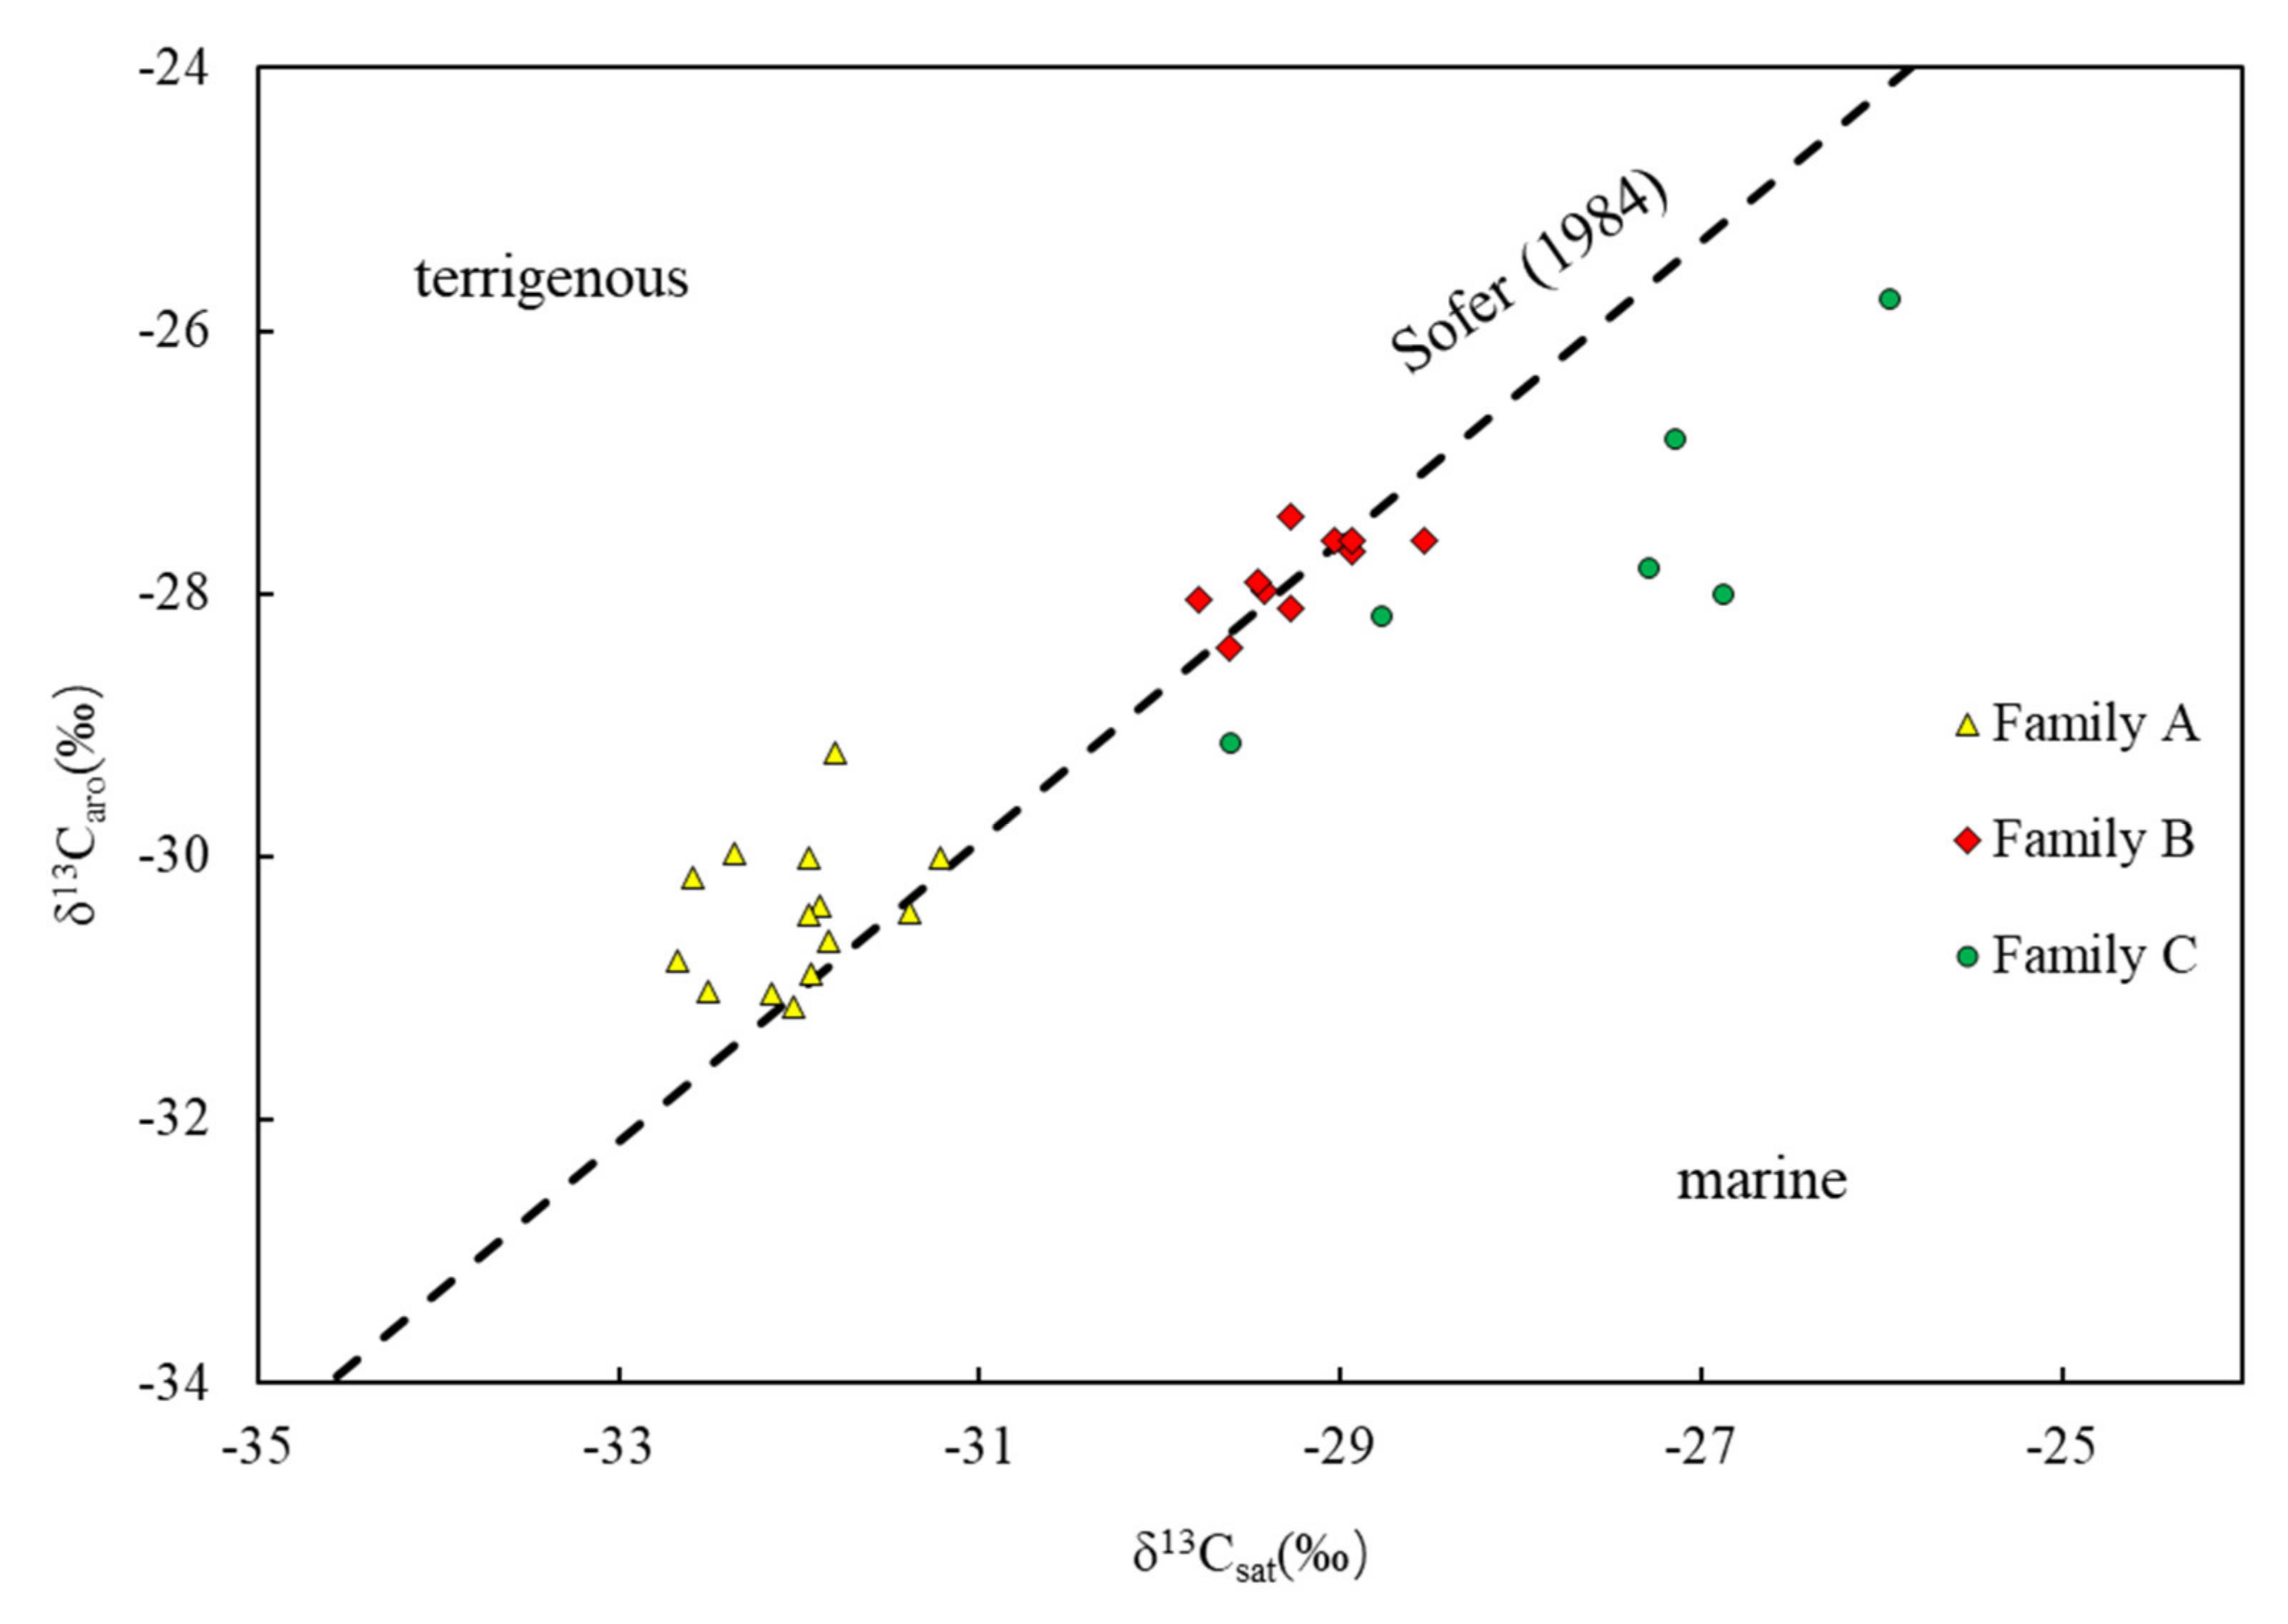
4.1.1. Sources of Organic Matter

Family C oils have the heaviest carbon isotope values, indicating the contribution of potential marine organic sources (Figure 5), whereas Family A and B oils have relatively high δ13C values that reflect terrigenous organic matter input. The C19TT is mainly derived from diterpenoids produced by vascular plants [1]. Hence, it is generally used as an indicator of terrigenous higher plants, along with C24TeT [38,39]. The oil samples in Family B showed notably higher ratios of C19TT/C23TT (0.46~1.03) and C24TeT/C23TT (0.46~1.00) than those of Family A and Family C. Generally, C27 and C28 regular steranes are derived from lower aquatic organisms, while C29 is associated with higher plants [38,40], but it should be noticed that there are many algae (e.g., brown algae, some species of green algae) that contain significant quantities of C29 sterols [12,41]. Hao et al. (2011) proposed that in the Junggar Basin, high C28/C29 sterane ratios indicate algal organic matter with little or no contribution from higher-plant organic matter. Family A exhibited high ratios of C27/C29 (0.23~0.53) and C28/C29 (0.55~0.85), while the ratios of Family B ranged from 0.17 to 0.23 and from 0.30 to 0.42, respectively. Family C showed the middle values of C27/C29 ααα20R sterane (0.28~0.44) and C28/C29 ααα20R sterane (0.44~0.86). Pr/Ph, Pr/nC17, and Ph/nC18 are commonly used to reflect the oxidation reduction nature of depositional environments and the source of organic matter [42,43]. As shown in Figure 6, the source of the Family B oils is mainly type Ⅲ kerogen with considerable terrigenous higher plant input, whereas that of the Family A and C oils is mixed type Ⅱ and Ⅲ kerogen. β-carotane is believed to originate from cyanobacteria and algae [13]. Family A oils are characterized by high ratios of β/n-Cmain (0.11~0.69), while the ratio of Family B and C is very low, ranging from 0~0.05 and 0~0.07, respectively. Collectively, the above discussed parameters suggest that Family A oils are derived from source rock containing predominately algal organic matter, while the source rocks for Family B and C oils have a large contribution from terrigenous higher-plant organic matter. For Family C, a possible contribution of marine organic matter is also indicated.

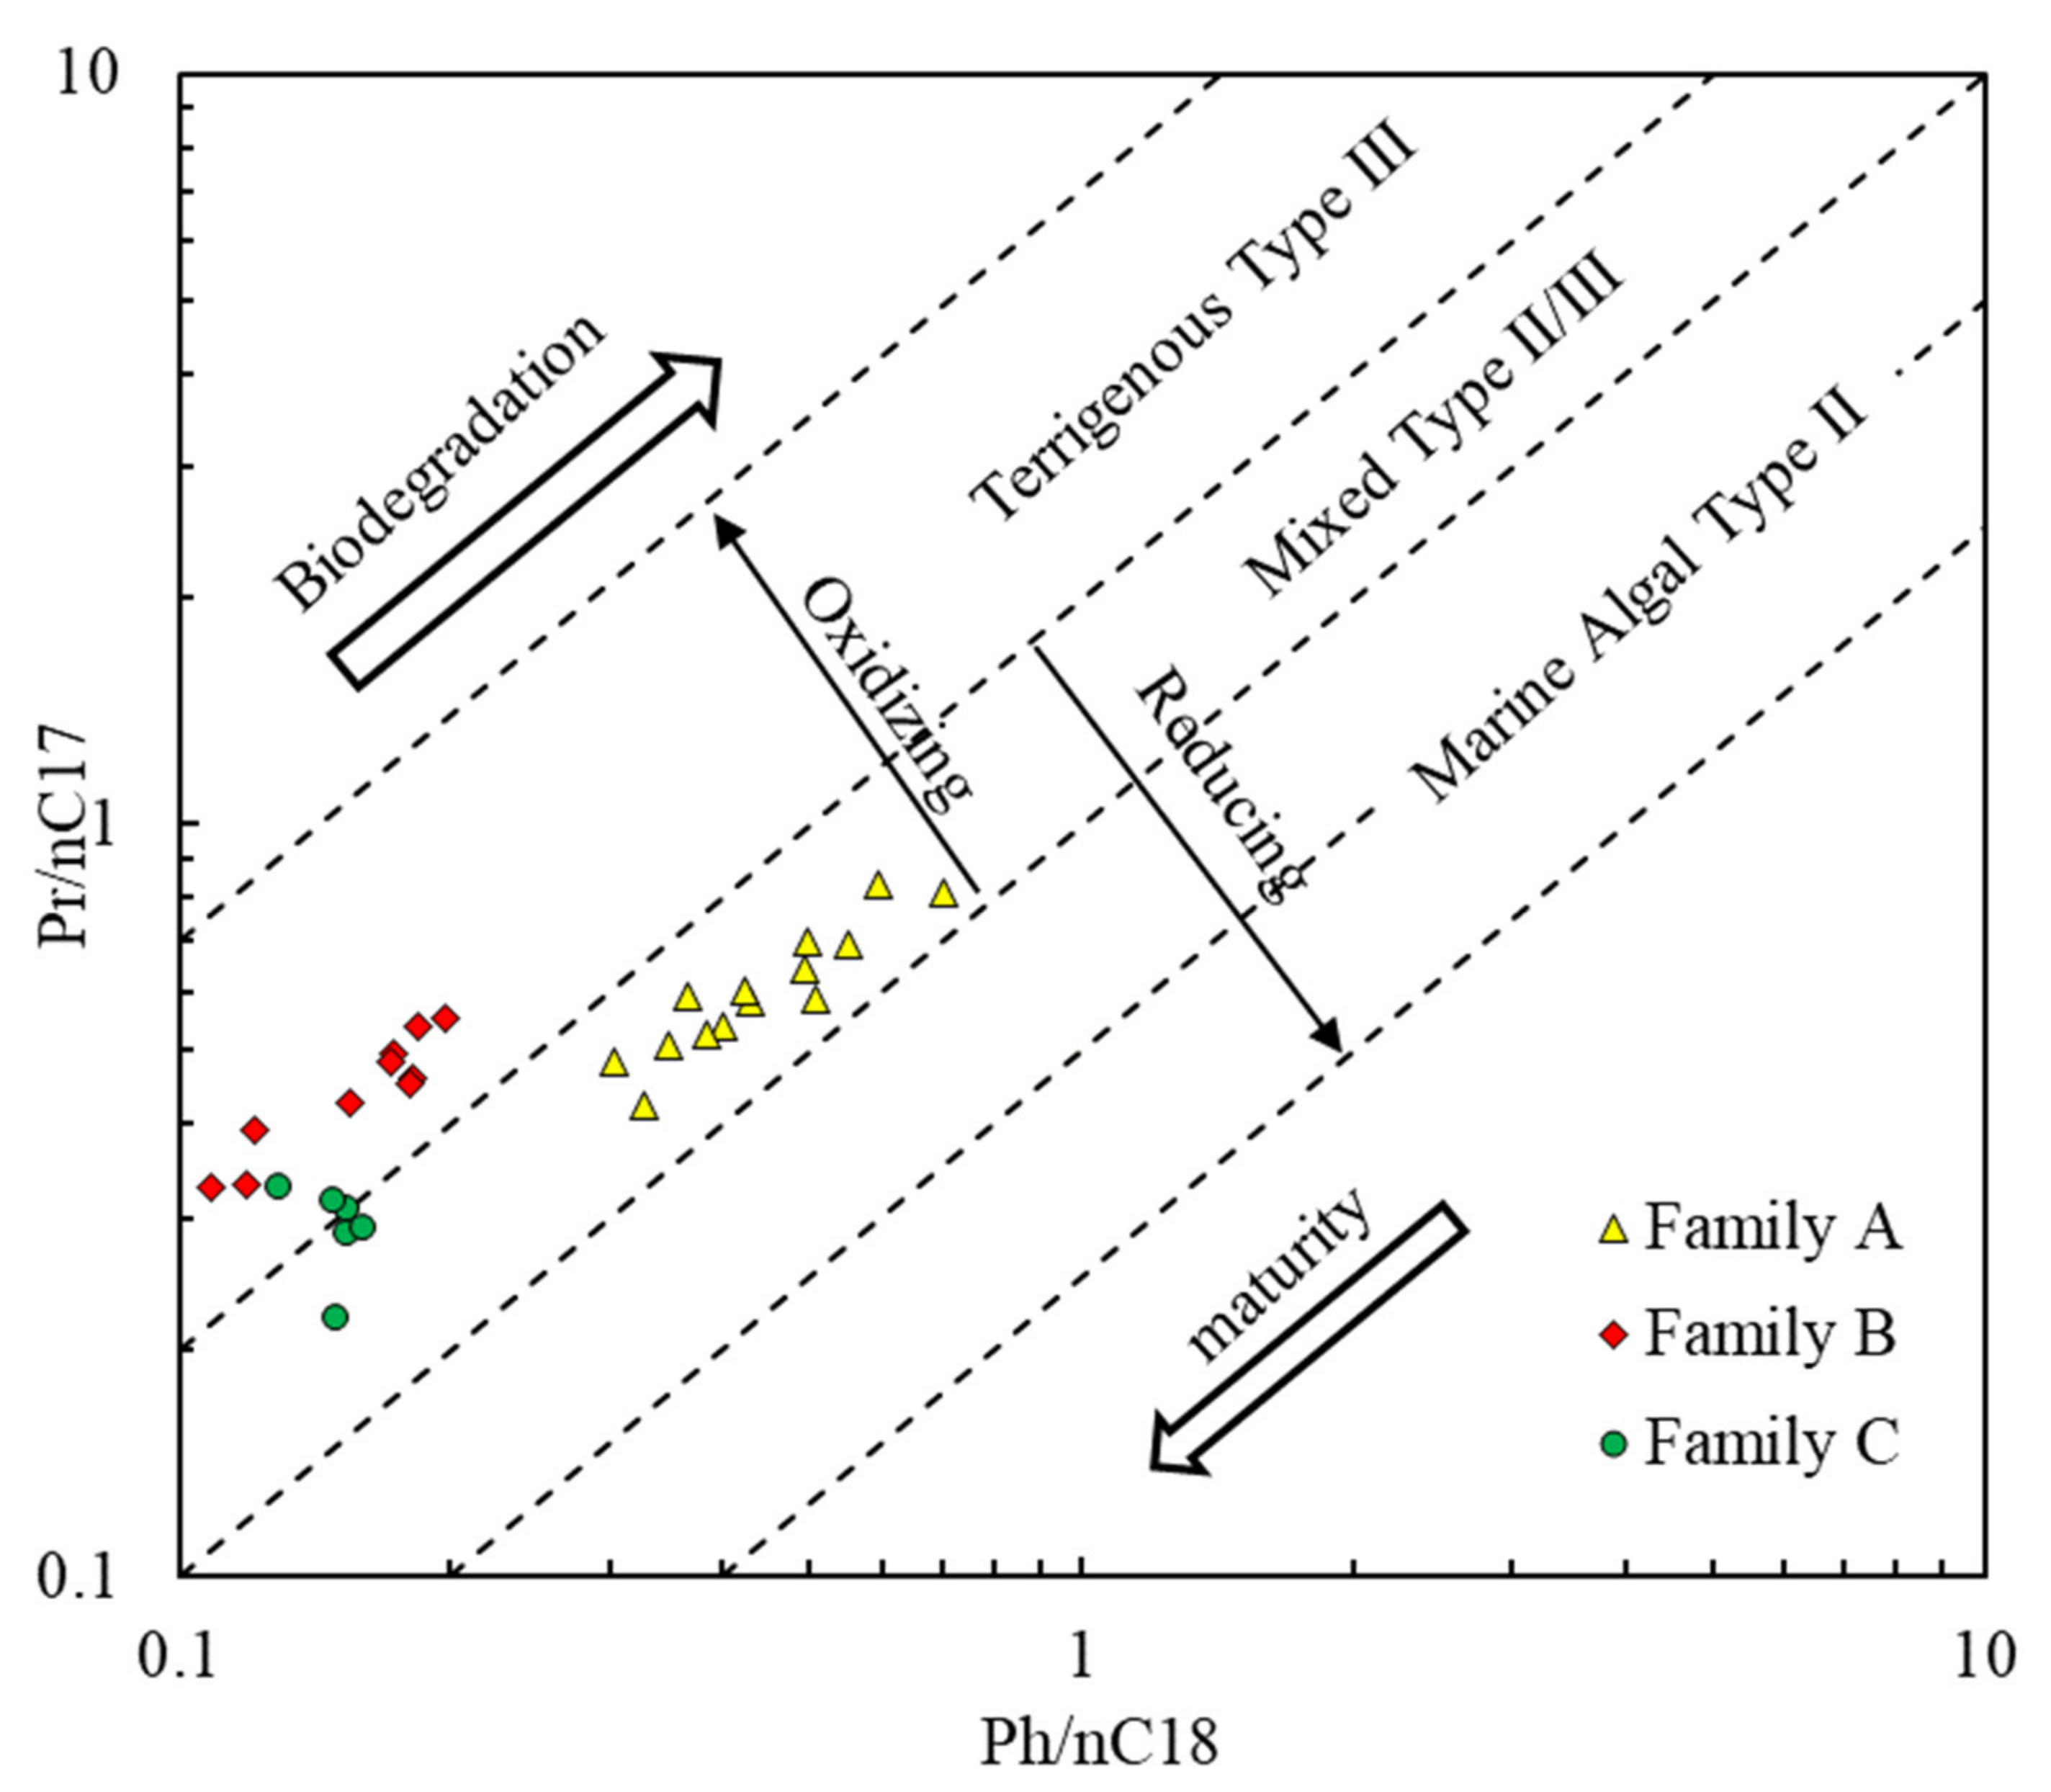
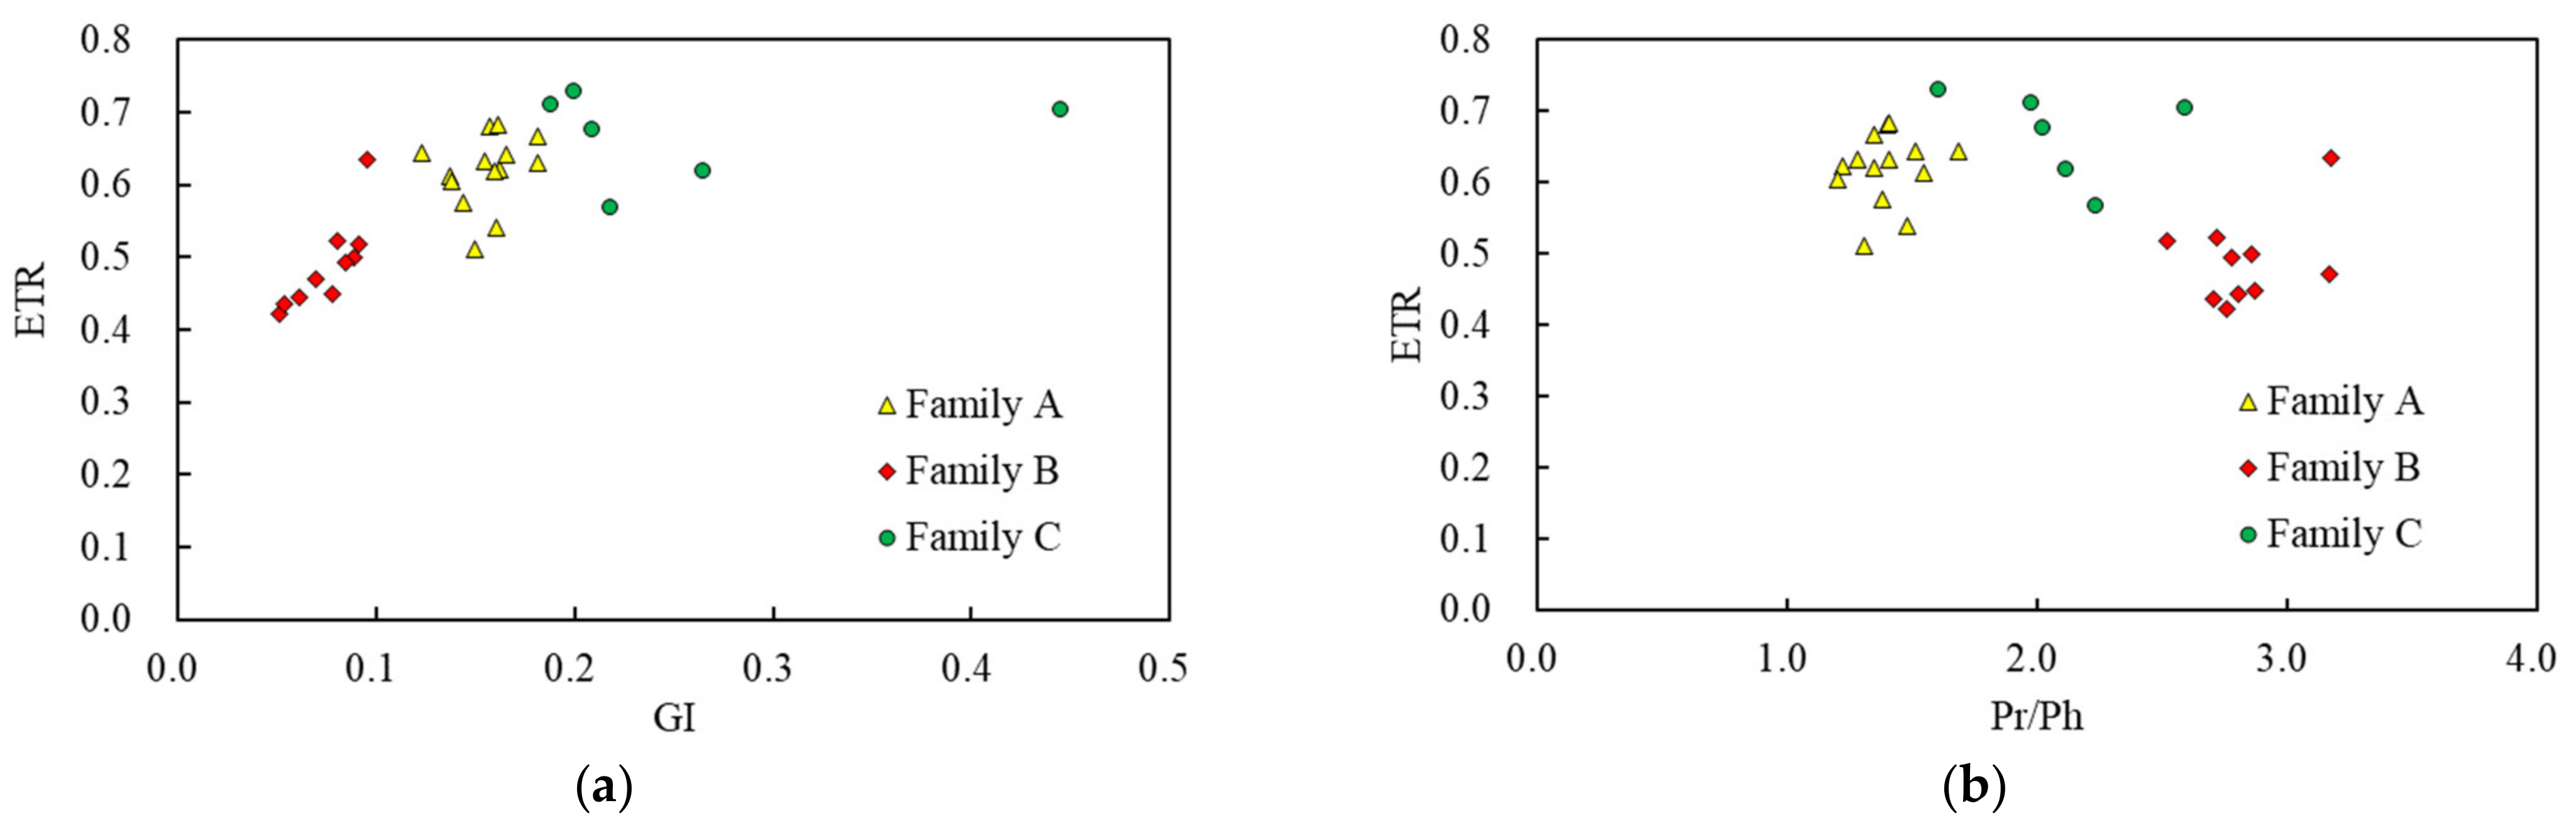
4.1.2. Depositional Environment

Oil samples of Family A and Family C have Pr/Ph ratios ranging from 1.61~2.59 and 1.20~1.69, respectively, which indicates that Family A is more partial to an oxidizing environment than Family C. However, Family B oils display the highest Pr/Ph ratio (2.52~3.17), suggesting deposition in an obviously oxidizing environment (Figure 6). In addition, β-carotane is a reliable indicator of reducing environments [44]. Family A oils contain abundant β-carotane, while in oils from Family B and Family C, β-carotane was detected in traces or absent (Figure 7). This suggests that the source rock of Family A oils was deposited in a more reductive environment compared to Family B and Family C oils. Generally, the GI ratio is a good indicator of water salinity or column stratification [41]. The value of GI of Family C oils (0.19~0.45) is much higher than that of Family A (0.12~0.18) and B (0.05~0.10), reflecting high salinity or strong column stratification of the source rock for Family C oils (Figure 8). The ETR (extended tricyclic terpane ratio) is similar to GI, which can be an effective indicator of the water salinity during sediment deposition [1,45]. The values of ETR of Family A, B, and C range from 0.51~0.68, 0.44~0.63 and 0.57~0.73, respectively, which is consistent with the variation trend of GI. Consequently, Family A oils were deposited in a weakly oxidizing to weakly reducing environment of fresh–brackish water, Family C oils were deposited in a weakly oxidizing to oxidizing environment with a relatively elevated salinity, and the oil samples in Family B were formed in an oxidizing sedimentary environment of fresh water.

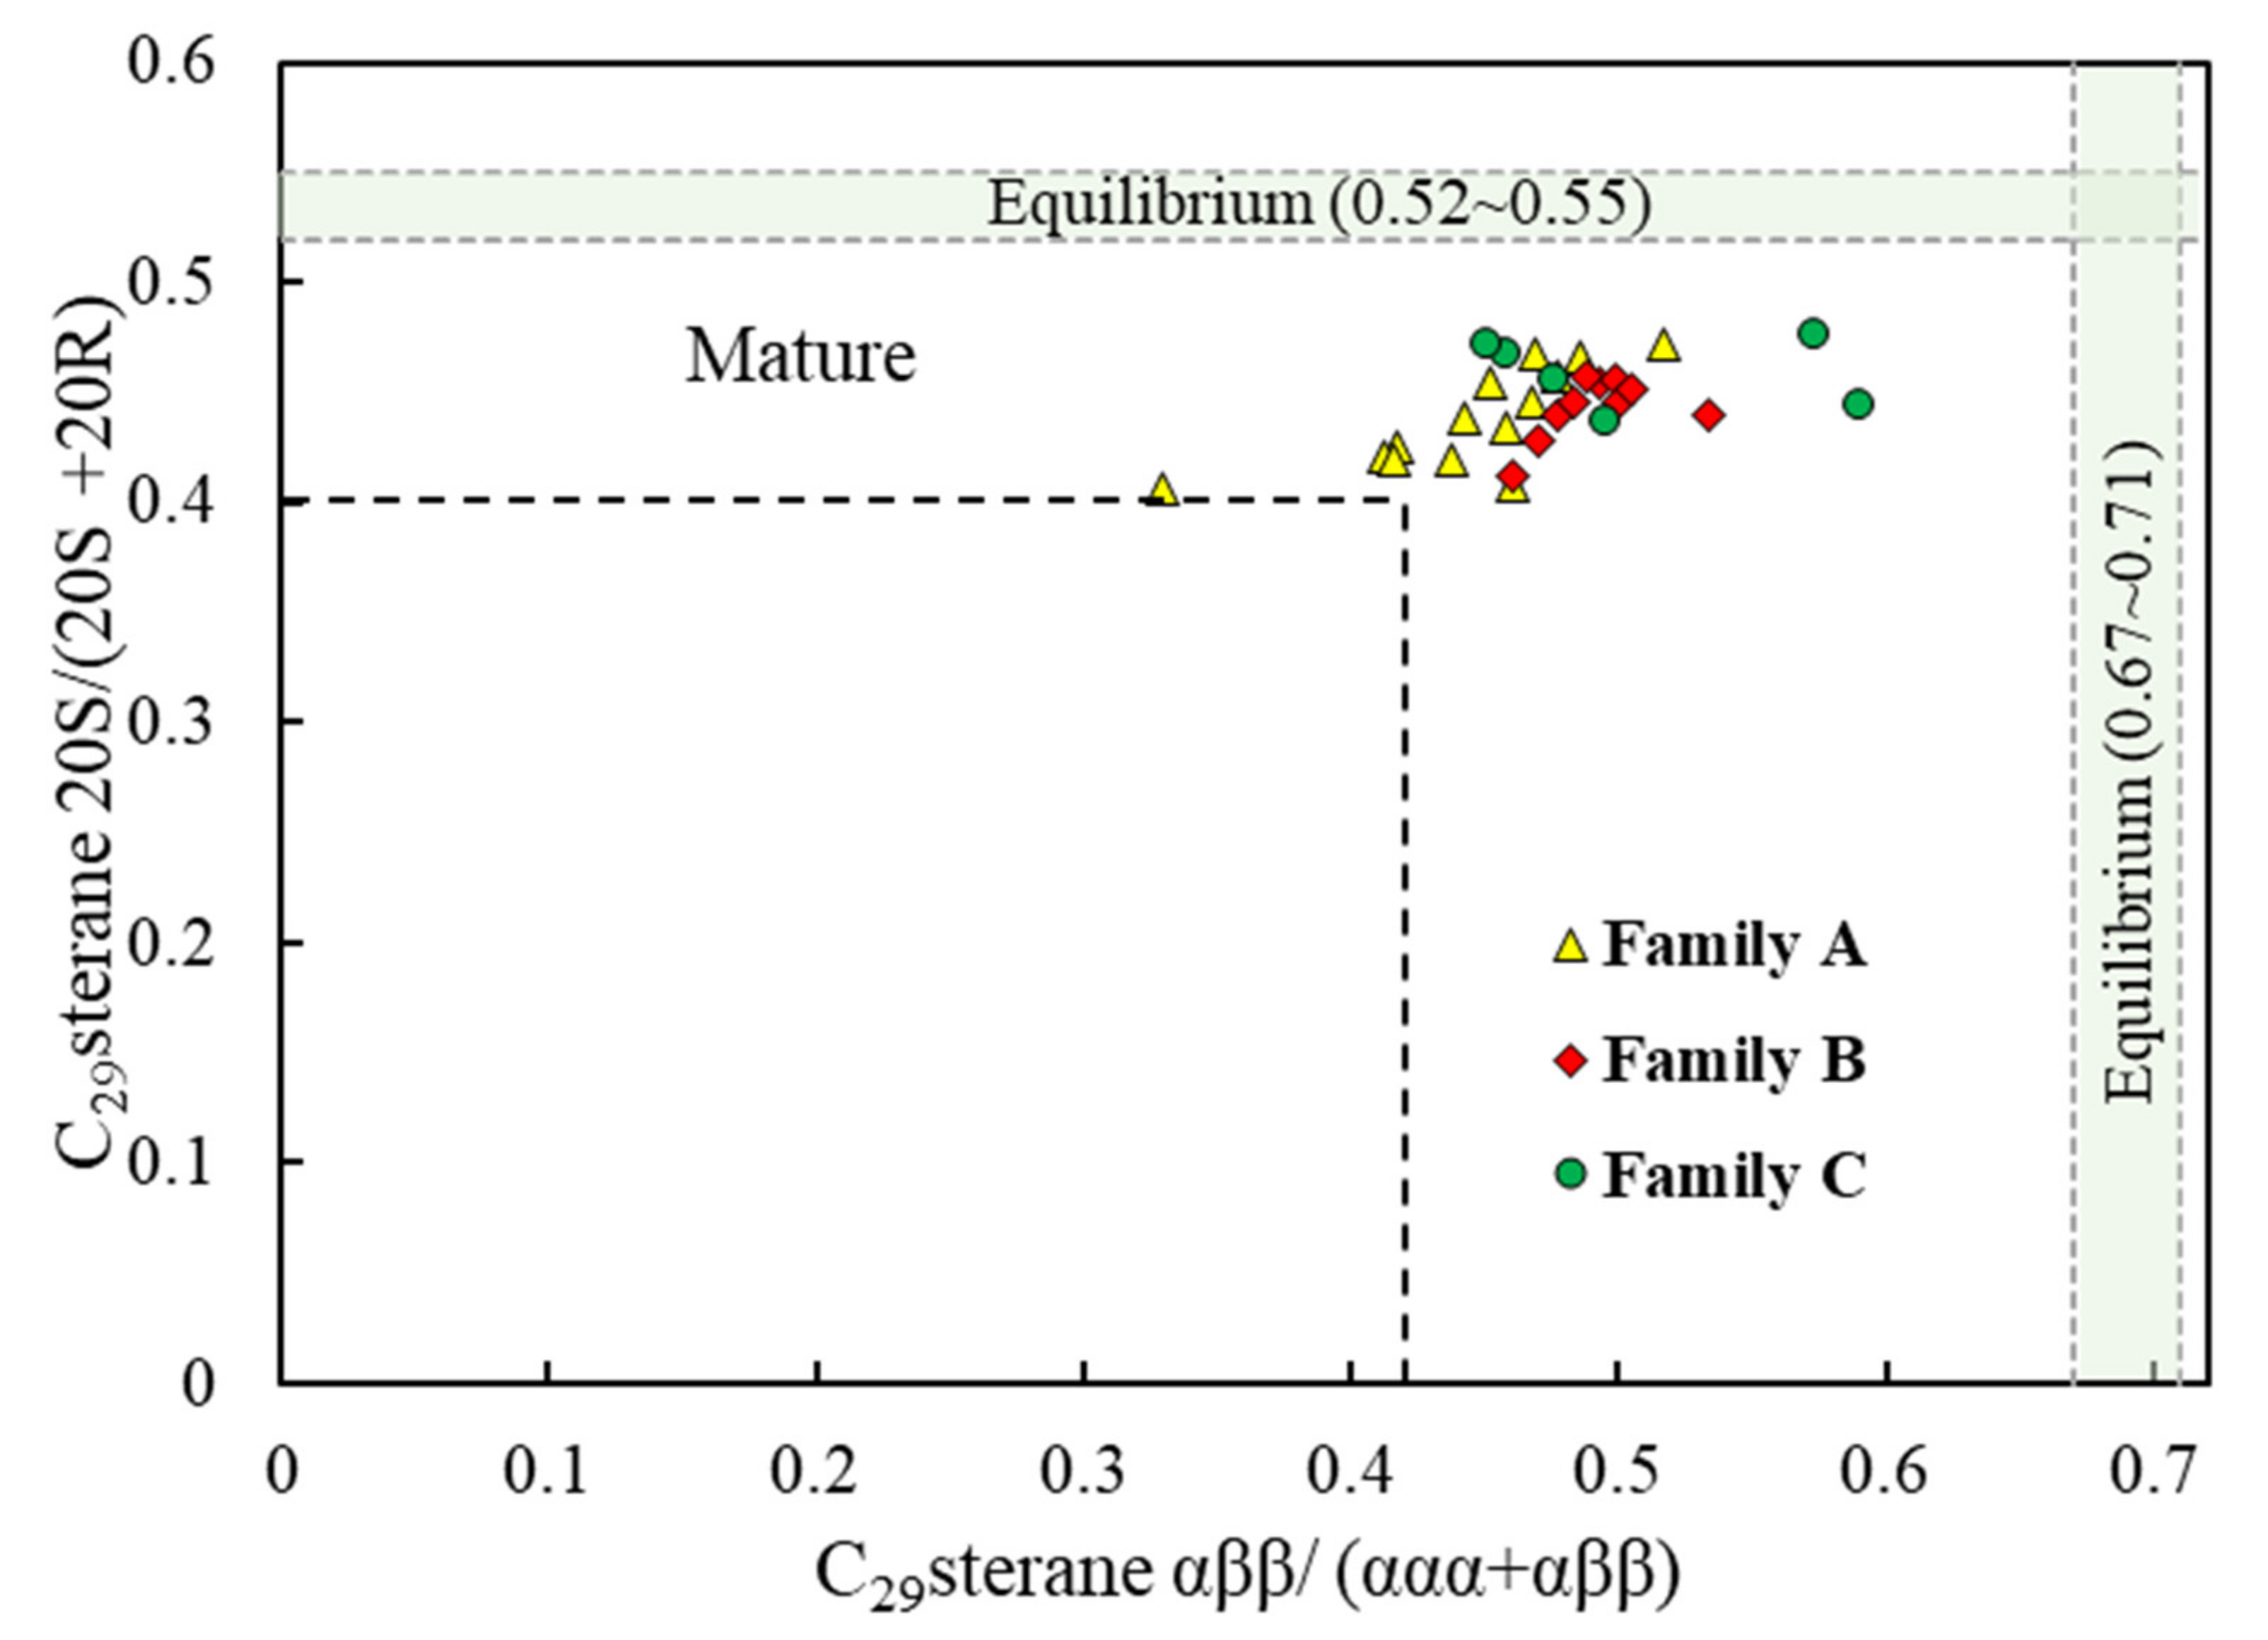
4.1.3. Thermal Maturity

The thermal maturity of crude oil can be assessed by saturated biomarkers [1,2]; hopane and sterane isomerization ratios are widely used. C3122S/(22S + 22R) homohopane ratio is usually used as a qualitative indicator of immaturity since the transformation quickly reaches equilibrium (about 0.6% Ro), and the equilibrium value of it is 0.57~0.62 [46]. As shown in Table 3, most of the C3122S/(22S + 22R) homohopane ratios in three oil families are within the range of endpoint values, which indicates the examined oil samples are at least in the mature stage. The C2920S/(20S + 20R) sterane ratio is generally crossplotted against the C29αββ/(ααα + αββ) sterane ratio to evaluate thermal maturity [47]. The values of these two ratios in studied oils were in a narrow range of 0.41 to 0.48 and 0.33 to 0.59, respectively. Therefore, these oils were within the oil generation window, and Family A oils seem to be generated at a slightly lower maturity (Figure 9). The M/H value generally decreases with the increasing extent of maturation and is a sensitive indicator at the immature–low mature stage [2,48]. In this study, the M/H ratio of all three oil families varies from 0.12~0.28 and is much lower than immature source rocks (0.8). Therefore, it may indicate that these oil samples have at least entered the mature stage [49]. Furthermore, the Ts/Tm ratio can also reflect maturity to a certain extent, and it increases with increasing maturity, although it also depends on diagenetic conditions [46]. Hence, the Ts/Tm ratio may be more precise on reflecting maturity for samples from the same facies. Family B oils have higher Ts/Tm values (0.38~0.61) than those of Family A oils (0.22~0.59). However, for Family C, the range of Ts/Tm ratio is abnormally wide (0.26~2.87), which might be related to the paleoenvironment and/or some specific lithologies [50].

4.2. Potential Source Rocks for the Families

Actually, direct oil–source rock correlation was not achieved in this study due to the lack of source rock samples. However, the source rock can be inferred by published geochemical characteristics of source rock and oil data in the study area [8]. As discussed above, three oil families were identified in this study, implying the presence of at least three different major source rocks. First, there is a general consensus that the carbon isotope value of crude oil originating from Permian source rocks is less than −30‰ in the light of previous studies [16,51]. The carbon isotope values of Family A oils were light, with δ13C from −30.66‰ to −32.23‰, which is consistent with Permian-derived crude oil (Table 4). Furthermore, Family A oils and Permian-derived crude oil shared very similar characteristics of saturated hydrocarbon biomarkers: Pr/Ph ratios within the range of 1~2, richness in β-carotane, gammacerane (GI = 0.13~0.55) and C28 and C29 steranes, tricyclic terpane distributions with a feature of C20 TT < C21 TT > (or≈) C23 TT [25,26,52] (Figure 7). Therefore, it can be concluded that Family A oils were derived from the Permian source rock. Family B oils had δ13C values in the range of −28.17~−29.14‰, which suggests a source of Jurassic [16,53]. Furthermore, the biomarkers of Family B oils were characterized as follows: Pr/Ph > 2.5, a value of Pr/nC17 much higher than Ph/nC18, a low value of GI, tricyclic terpane distributions of most oils with features of C20 TT > C21 TT > C23 TT, C27-C28-C29 regular steranes showing a strong dominance of the C29 sterane over C27, and exhibiting a “ascending” or “reverse L”-shaped pattern that is similar to the biomarker characteristics of Jurassic-derived crude oil [16,23]. Accordingly, from the comprehensive analysis of stable carbon isotope values and biomarkers, Family B oils mainly come from Jurassic source rocks. Family C oils have heavy carbon isotope values (−25.72~−29.39‰); the difference in δ13C up to 3.6‰ indicates more than one source rock for Family C oils. Moreover, based on the result from Figure 5, Family C oils contain marine organic matter; therefore, we can draw a preliminary conclusion that Family C oils have the contribution of Carboniferous source rocks [17,26]. In addition, the biomarker characteristics of Family C oils are as follows: Pr/Ph ratio range from 1.61~2.59, a value of Pr/nC17 higher than Ph/nC18, trace β-carotane, high ratios of GI and ETR, very high content of C29 sterane, tricyclic terpane distribution of most oils showing a trend of C20 TT < C21 TT > C23 TT, some biomarker characteristics being similar to Family A oils (Figure 10). The HCA dendrogram of Figure 4 also reflected the relevance of Family A and Family C oils. Hence, Permian source rocks might be another source of Family C oils.

5. Conclusions

Chemometric methods (PCA and HCA) provide an effective supplement to conventional oil–oil correlation. Based on the PCA and HCA of 13 source-related and depositional environment-related biomarker ratios and stable carbon isotope ratios, the crude oil samples in the study area can be divided into three families: Family A oils had low ratios of Pr/Ph, C19/C23 TT, and C24TeT/C23TT, and relatively high ratios of GI, ETR, β/n-Cmain, C27/C29, and C28/C29 ααα20R sterane, suggesting that Family A oils came from the source rock deposited under weakly oxidizing to weakly reducing conditions in a fresh–brackish water environment, with microalgae having been the dominant source of organic matter. Permian source rock was the most likely source. Family B oils were characterized by high ratios of Pr/Ph, C19TT/C23TT, and C24TeT/C23TT, low ratios of C27/C29 ααα20R sterane, C28/C29 ααα20R sterane, GI, ETR, and β/n-Cmain, all of which indicated that the organic matter was derived from a dominant contribution of terrigenous higher plants and deposited under the oxidizing environment of fresh water. They mainly came from Jurassic source rocks. Family C oils had the heaviest carbon isotope values, high ratios of Pr/Ph, GI, and ETR, and low ratios of β/n-Cmain, which indicates that the source rock of oils was deposited in a weakly oxidizing to oxidizing environment of brackish water, with both terrigenous and marine organic input. These findings suggest that Family C oils have a mixed source of Carboniferous and Permian source rocks. Maturity-related parameters indicated that all three families of crude oil were expelled from source rocks in the main phase of the “oil window”, and the maturity of the parent organic matter of Family A was slightly lower than that of Family B and C.

Author Contributions

Conceptualization, E.L. and D.H.; methodology, E.L., Y.L., and D.H.; software, Y.L. and X.H.; investigation, J.M. and X.G.; writing—original draft preparation, E.L. and Y.L.; writing—review and editing, E.L., J.M., Y.Z., and X.G.; visualization, B.X.; supervision, D.H.; project administration, E.L. and B.X. All authors have read and agreed to the published version of the manuscript.

Funding

This research received no external funding.

Conflicts of Interest

The authors declare no conflict of interest.

References

  1. Peters, K.E.; Walters, C.C.; Moldowan, J.M. The Biomarker Guide, 2nd ed.; Cambridge University Press: New York, NY, USA, 2005. [Google Scholar]
  2. Peters, K.E.; Moldowan, J.M. The Biomarker Guide: Interpreting Molecular Fossils in Petroleum and Ancient Sediments; Prentice Hall: Englewood Cliffs, NJ, USA, 1993. [Google Scholar]
  3. Wang, Y.P.; Zhang, F.; Zou, Y.R.; Zhan, Z.W. Chemometrics reveals oil sources in the Fangzheng Fault Depression, NE China. Org. Geochem. 2016, 102, 1–13. [Google Scholar] [CrossRef]
  4. Wang, Y.P.; Zhou, Y.R.; Shi, J.T.; Shi, J. The application of chemometrics in oil-oil and oil-source rock correlations: Current situation and future prospect. J. Nat. Gas Geosci. 2018, 29, 452–467. [Google Scholar]
  5. Eneogwe, C.; Ekundayo, O. Geochemical correlation of crude oils in the NW Niger Delta, Nigeria. J. Petrol. Geol. 2003, 26, 95–103. [Google Scholar] [CrossRef]
  6. Gürgey, K. Correlation, alteration, and origin of hydrocarbons in the GCA, Bahar, and Gum Adasi fields, western South Caspian Basin: Geochemical and multivariate statistical assessments. Mar. Petrol. Geol. 2003, 20, 1119–1139. [Google Scholar] [CrossRef]
  7. Zumberge, J.E.; Russell, J.A.; Reid, S.A. Charging of Elk Hills reservoirs as determined by oil geochemistry. AAPG Bull. 2005, 89, 1347–1371. [Google Scholar] [CrossRef] [Green Version]
  8. He, M.; Moldowan, J.M.; Nemchenko-Rovenskaya, A.; Peters, K.E. Oil families and their inferred source rocks in the Barents Sea and northern Timan-Pechora Basin, Russia. AAPG Bull. 2012, 96, 1121–1146. [Google Scholar] [CrossRef]
  9. Wang, Y.; Peters, K.E.; Moldowan, J.M.; Bird, K.J.; Magoon, L.B. Cracking, mixing, and geochemical correlation of crude oils, North Slope, Alaska Crude Oils, North Slope, Alaska. AAPG Bull. 2014, 98, 1235–1267. [Google Scholar] [CrossRef]
  10. Mashhadi, Z.S.; Rabbani, A.R. Organic geochemistry of crude oils and Cretaceous source rocks in the Iranian sector of the Persian Gulf: An oil–oil and oil–source rock correlation study. Int. J. Coal Geol. 2015, 146, 118–144. [Google Scholar] [CrossRef]
  11. Alizadeh, B.; Alipour, M.; Chehrazi, A.; Mirzaie, S. Chemometric classification and geochemistry of oils in the Iranian sector of the southern Persian Gulf Basin. Org. Geochem. 2017, 111, 67–81. [Google Scholar] [CrossRef]
  12. Lin, X.H.; Zhan, Z.W.; Zou, Y.R.; Sun, J.N.; Peng, P.A. Geochemically Distinct Oil Families in the Gudong Oilfield, Zhanhua Depression, Bohai Bay Basin, China. ACS Omega 2020, 5, 26738–26747. [Google Scholar] [CrossRef]
  13. Hao, F.; Zhang, Z.; Zou, H.; Zhang, Y.; Yang, Y. Origin and mechanism of the formation of the low-oil-saturation Moxizhuang field, Junggar Basin, China: Implication for petroleum exploration in basins having complex histories. AAPG Bull. 2011, 95, 983–1008. [Google Scholar] [CrossRef]
  14. Gong, S.; Zhou, S.; Li, J.; Fu, D.L.; Wang, B.; Li, Y.J. Comparisons of geochemical characteristics of Carboniferous and Permian main source rocks in Junggar Basin. Nat. Gas Geosci. 2013, 24, 1005–1015. [Google Scholar]
  15. Song, Y.; Wang, X.; Guo, X.; Liu, C.; Li, H.; Liu, D. Analysis on causes of differences in physical properties of Jurassic crude oil around Fukang depression, Junggar Basin. Petrol. Sci. Technol. 2020, 38, 75–82. [Google Scholar] [CrossRef]
  16. Chen, Z.; Xie, J.; Qiao, R.; Qiu, L.; Yang, Y.; Wen, Z.; Xu, Y.; Tang, Y. Geochemistry and accumulation of Jurassic oil in the central Junggar Basin, western China. J. Petrol. Sci. Eng. 2022, 216, 110855. [Google Scholar] [CrossRef]
  17. Yang, B.; Yan, Z.M.; You, Q.M.; Han, J.; Guan, Q.; Reng, J.L.; Wang, J.Y. Geochemical characteristics of carboniferous crude oil in Jundong Area. Xinjiang Petrol. Geol. 2002, 23, 478. [Google Scholar]
  18. Zhao, Y.; Tan, K.; Wang, P.; Guo, X.; Qi, W. Geochemical Characteristics of Carboniferous Source Rocks and Distribution in the Eastern Part of Junggar Basin. Nat. Gas Geosci. 2011, 22, 753–759. [Google Scholar]
  19. Yang, F.; Song, Y.; Chen, H.; Gong, D.; Bian, B.; Liu, H. Evaluation of Carboniferous Songkaersu Formation source rocks and gas-source correlation in the Fukang Sag of eastern Junggar Basin. Nat. Gas Geosci 2019, 30, 1018–1026. [Google Scholar]
  20. Yu, S.; Wang, X.; Xiang, B.; Liao, J.; Wang, J.; Li, E.; Yan, Y.; Cai, Y.; Zou, Y.; Pan, C. Organic geochemistry of Carboniferous source rocks and their generated oils from the Eastern Junggar Basin, NW China. Org. Geochem. 2014, 77, 72–88. [Google Scholar] [CrossRef]
  21. Bai, H.; Pang, X.; Kuang, L.; Wan, Z.; Pang, H.; Wang, X.; Jia, X.; Song, X. Depositional environment, hydrocarbon generation and expulsion potential of the middle Permian Pingdiquan source rocks based on geochemical analyses in the eastern Junggar Basin, NW China. Aust. J. Earth Sci. 2017, 64, 497–518. [Google Scholar] [CrossRef]
  22. Shi, J.; Zou, Y.; Yu, J.; Liu, J. Paleoenvironment of organic-rich shale from the Lucaogou Formation in the Fukang Sag, Junggar Basin, China. Nat. Gas Geosci. 2018, 29, 1138–1150. [Google Scholar]
  23. Qiao, J.; Liu, L.; Shang, X. Deposition conditions of the Jurassic lacustrine source rocks in the East Fukang Sag, Junggar Basin, NW China: Evidence from major and trace elements. Geol. J. 2020, 55, 4936–4953. [Google Scholar] [CrossRef]
  24. Peters, K.E.; Hostettler, F.D.; Lorenson, T.D.; Rosenbauer, R.J. Families of Miocene Monterey crude oil, seep, and tarball samples, coastal California. AAPG Bull. 2008, 92, 1131–1152. [Google Scholar] [CrossRef]
  25. Jiang, C.X. Origins of the Jurassic oils in the east and peripheral areas of Fukang Depression in the Junggar Basin. Master Dissertation, China University of Petroleum (East China), Qingdao, China, 2016. [Google Scholar]
  26. Liu, H.; Li, H.; Xiang, H.; Wang, X.; Du, S. Geochemistry, genesis and distribution of crude oils in the Fukang fault zones and their periphery in Junggar Basin. Nat. Gas Geosci. 2020, 31, 258–267. [Google Scholar]
  27. Jiang, W.; Yiming, A.; Li, H.; Chen, J.; Li, Z. Geochemical characteristics and identification of mixed crude oil of the Baikouquan Formation Lower Wuerhe Formation on the East slope of the Mahu Sag, Junggar Basin. Geochimica 2021, 50, 185–198. [Google Scholar]
  28. Sofer, Z. Stable carbon isotope compositions of crude oils: Application to source depositional environments and petroleum alteration. AAPG Bull. 1984, 68, 31–49. [Google Scholar]
  29. Schoell, M. Recent advances in petroleum isotope geochemistry. Org. Geochem. 1984, 6, 645–663. [Google Scholar] [CrossRef]
  30. Clayton, J.L.; Yang, J.; King, J.D.; Lillis, P.G.; Warden, A. Geochemistry of oils from the Junggar basin, northwest China. AAPG Bull. 1997, 81, 1926–1944. [Google Scholar]
  31. Chen, J.; Liang, D.; Wang, X.; Zhong, N.; Song, F.; Deng, C.; Shi, X.; Jin, T.; Xiang, S. Mixed oils derived from multiple source rocks in the Cainan oilfield, Junggar Basin, Northwest China. Part I: Genetic potential of source rocks, features of biomarkers and oil sources of typical crude oils. Org. Geochem. 2003, 34, 889–909. [Google Scholar] [CrossRef]
  32. Chen, J.; Deng, C.; Liang, D.; Wang, X.; Zhong, N.; Song, F.; Shi, X.; Xiang, S. Mixed oils derived from multiple source rocks in the Cainan oilfield, Junggar Basin, Northwest China. Part II: Artificial mixing experiments on typical crude oils and quantitative oil–source correlation. Org. Geochem. 2003, 34, 911–930. [Google Scholar] [CrossRef]
  33. Peters, K.E.; Scott Ramos, L.; Zumberge, J.E.; Valin, Z.C.; Scotese, C.R.; Gautier, D.L. Circum-Arctic petroleum systems identified using decision-tree chemometrics. AAPG Bull. 2007, 91, 877–913. [Google Scholar] [CrossRef]
  34. Peters, K.E.; Wright, T.L.; Ramos, L.S.; Zumberge, J.E.; Magoon, L.B. Chemometric recognition of genetically distinct oil families in the Los Angeles basin, California. AAPG Bull. 2016, 100, 115–135. [Google Scholar] [CrossRef]
  35. Wang, D.H.; Ma, Y.M. Multivariate Statistical Analysis and SPSS Application, 2nd ed.; East China University of Science and Technology Press: Shanghai, China, 2018. [Google Scholar]
  36. Tzeng, G.H.; Chiang, C.H.; Li, C.W. Evaluating intertwined effects in e-learning programs: A novel hybrid MCDM model based on factor analysis and DEMATEL. Expert Syst. Appl. 2007, 32, 1028–1044. [Google Scholar] [CrossRef]
  37. Gu, H.; Ma, F.; Guo, J. Hydrochemistry, multidimensional statistics, and rock mechanics investigations for Sanshandao Gold Mine, China. Arab. J. Geosci. 2017, 10, 62. [Google Scholar] [CrossRef]
  38. Philp, R.P.; Gilbert, T.D. Biomarker distributions in Australian oils predominantly derived from terrigenous source material. Org. Geochem. 1986, 10, 73–84. [Google Scholar] [CrossRef]
  39. Hanson, A.D.; Zhang, S.C.; Moldowan, J.M.; Liang, D.G.; Zhang, B.M. Molecular organic geochemistry of the Tarim Basin, northwest China. AAPG Bull. 2000, 84, 1109–1128. [Google Scholar]
  40. Osorno, J.; Rangel, A. Geochemical assessment and petroleum systems in the Sinú-San Jacinto Basin, northwestern Colombia. Mar. Petrol. Geol. 2015, 65, 217–231. [Google Scholar] [CrossRef]
  41. Moldowan, J.M.; Seifert, W.K.; Gallegos, E.J. Relationship between petroleum composition and depositional environment of petroleum source rocks. AAPG Bull. 1985, 69, 1255–1268. [Google Scholar]
  42. Didyk, B.M.; Simoneit, B.R.T.; Brassell, S.T.; Eglinton, G. Organic geochemical indicators of palaeoenvironmental conditions of sedimentation. Nature 1978, 272, 216–222. [Google Scholar] [CrossRef]
  43. Peters, K.E.; Fraser, T.H.; Amris, W.; Rustanto, B.; Hermanto, E. Geochemistry of crude oils from eastern Indonesia. AAPG Bull. 1999, 83, 1927–1942. [Google Scholar]
  44. Jiang, Z.S.; Fowler, M.G. Carotenoid-derived alkanes in oils from northwestern China. Org. Geochem. 1986, 10, 831–839. [Google Scholar] [CrossRef]
  45. Holba, A.G.; Ellis, L.; Dzou, I.L.; Hallam, A.; Masterson, W.D.; Francu, J.; Fincannon, A.L. Extended tricyclic terpanes as age discriminators between Triassic, Early Jurassic and Middle−Late Jurassic oils. In Proceedings of the 20th International Meeting on Organic Geochemistry, Nancy, France, 10–14 September 2001. [Google Scholar]
  46. Waples, D.W.; Machihara, T. Application of Sterane and Triterpane Biomarkers in Petroleum Exploration. Bull. Can. Petrol. Geol. 1990, 38, 357–380. [Google Scholar]
  47. Justwan, H.; Dahl, B.; Isaksen, G.H. Geochemical Characterization and Genetic Origin of Oils and Condensates in the South Viking Graben, Norway. Mar. Petrol. Geol. 2006, 23, 213–239. [Google Scholar] [CrossRef]
  48. Mackenzie, A.S.; Patience, R.L.; Maxwell, J.R.; Vandenbroucke, M.; Durand, B. Molecular parameters of maturation in the Toarcian shales, Paris Basin, France—I. Changes in the configurations of acyclic isoprenoid alkanes, steranes and triterpanes. Geochim. Cosmochim. Acta 1980, 44, 1709–1721. [Google Scholar] [CrossRef]
  49. Katz, B.; Richards, D.; Long, D.; Lawrence, W. A new look at the components of the petroleum system of the South Caspian Basin. J. Petrol. Sci. Eng. 2000, 28, 161–182. [Google Scholar] [CrossRef]
  50. Philp, R.P.; Fan, Z. Geochemical investigation of oils and source rocks from Qianjiang Depression of Jianghan Basin, a terrigenous saline basin, China. Org. Geochem. 1987, 11, 549–562. [Google Scholar] [CrossRef]
  51. Wang, L.; Chen, S.; Zhang, H.; Zou, X.; Zhan, P.; Lu, J. Geochemical characteristic and origin of solid bitumen in the Jurassic and Triassic sandstone reservoir of Santai Area, Junggar Basin, NW China. Petrol. Sci. Technol. 2016, 34, 539–545. [Google Scholar] [CrossRef]
  52. Qu, Y.; Tao, H.; Ma, D.; Wu, T.; Qiu, J. Biomarker characteristics and geological significance of middle and upper Permian source rocks in the southeastern Junggar Basin. Petrol. Sci. Technol. 2019, 37, 2066–2080. [Google Scholar] [CrossRef]
  53. Chen, J.Q.; Pang, X.Q.; Pang, H. Lateral migration of Jurassic Toutunhe Formation in Fudong slope, Junggar Basin. Earth Sci. 2016, 41, 821–831. [Google Scholar]
Figure 1. (a) Location of the Junggar Basin in China, (b) location of the study area, (c) distribution of crude oil samples in the eastern Fukang Sag, (d) generalized stratigraphic column of the study area (modified from Jiang, 2016 and Bai et al., 2017).
Energies 15 08921 g001
Figure 2. Eigenvalues and cumulative variance contribution rates of principal components in the crude oil samples from the eastern Fukang Sag.
Energies 15 08921 g002
Figure 3. Principal component analysis of 13 source-related and depositional environment-related parameters vs. 30 oil samples from the eastern Fukang Sag. (a) Loading plot and (b) scores plot, showing the existence of three genetically distinct families. Samples and descriptions of the parameters as in Table 1.
Energies 15 08921 g003aEnergies 15 08921 g003b
Figure 4. Result of hierarchical cluster analysis of thirty crude oil samples in the eastern Fukang Sag, showing the identification of three genetic oil families (dashed similarity line).
Energies 15 08921 g004
Figure 5. Plot of stable carbon isotope values of saturated versus aromatic fractions for identified oil families from the Fukang Sag. The Sofer (1984) line (δ13Caro = 1.14δ13Csat + 5.46) is used to separate oils generated from terrigenous and marine source rocks.t think i.
Energies 15 08921 g005
Figure 6. Plot of Pr/nC17 vs. Ph/nC18 ratios of crude oils in the Fukang Sag (after Peters et al., 1999).
Energies 15 08921 g006
Figure 7. Typical gas chromatograms of saturated hydrocarbons and partial mass chromatograms of terpanes (m/z = 191) and steranes (m/z = 217) for the studied oil samples. Ts = 18α(H)-trinorneohopane; Tm = 17α(H)-trinorhopane; Ga = gammacerane; C29H = C29αβ-norhopane; C30H = C30αβ-hopane; C21 = pregnane; C22 = homopregnane.
Energies 15 08921 g007
Figure 8. Correlations between depositional environment-related biomarker ratios, reflecting the depositional environment difference of three oil families. (a) GI vs. ETR, (b) Pr/Ph vs. ETR.
Energies 15 08921 g008
Figure 9. Thermal maturity of the studied oil samples based on sterane isomerization ratios.
Energies 15 08921 g009
Figure 10. Correlations between biomarker parameters of three oil families. (a) C27/C29 ααα20R sterane vs. C24TeT/C23TT, (b) C28/C29 ααα20R sterane vs. C19TT/C23TT.
Energies 15 08921 g010
Table 1. Basic information and geochemical parameters of crude oil in the eastern Fukang Sag.
Sample No.WellFm.Depth (m)δ13Coil
(‰)
δ13Csat
(‰)
δ13Caro
(‰)
Pr/PhPr/nC17Ph/nC18β/n-CmainC19TT/C23TTC24Te/C23TTGIETRC27/C29C28/C29Oil Family
1F46P2l3157~3165−32.23−32.15−31.051.480.700.500.67 0.120.360.160.540.530.63A
2SQ12P3wt2902~2926−31.73−32.59−30.161.550.590.370.30 0.190.290.140.610.420.67
3B307P3wt2266~2270−31.65−32.36−29.981.310.830.600.69 0.190.430.150.510.510.66
4XQ5T2k2382~2392−30.97−31.39−30.421.400.420.330.18 0.160.450.160.680.300.74
5F19T2k2368~2371−31.49−31.89−30.371.410.540.400.31 0.200.390.180.630.330.85
6T31J2t2301.5~2348.6−31.87−32.03−31.151.220.580.510.30 0.130.470.160.620.410.71
7T62T2k2790~2795−31.86−32.68−30.81.200.810.710.55 0.160.450.140.600.390.69
8F006P3wt2770~2780−31.09−31.93−30.891.280.640.490.14 0.180.390.150.630.240.77
9F25P3wt2775~2783−31.45−31.84−30.641.410.520.380.22 0.190.400.160.680.340.81
10B403C2b2756.5~2769−31.33−31.95−30.451.350.690.550.38 0.120.410.160.620.320.75
11B418J2t1873~1907−31.51−32.51−31.031.350.580.430.11 0.180.420.180.670.280.79
12B418E1773~1779−31.32−31.95−30.011.380.600.420.17 0.150.440.140.580.390.62
13F010P3w2756~2779−30.66−31.22−30.011.690.480.300.19 0.170.310.170.640.250.55
14F43P3w3132~3214−31.56−31.8−29.211.510.510.350.15 0.180.330.120.640.230.56
15XQ12J2t2359~2371−28.49−29.28−28.112.720.460.180.070.510.640.080.520.200.30B
16FD021J2x3620~3625−28.46−28.94−27.683.170.390.120.03 0.860.920.070.470.200.30
17F32J2t3277~3286−28.43−29.03−27.62.750.430.160.01 0.930.940.050.420.170.28
18FD9J2t2813~2879−29.09−29.62−28.422.520.450.180.04 0.510.610.090.520.210.42
19FD052J2t3038~3047−29.05−29.28−27.422.860.500.170.04 0.860.720.090.500.170.38
20FD052J2t2963~2974−28.65−29.42−27.982.780.480.170.05 0.690.660.080.490.210.38
21B97J1s3583~3595−29.14−29.78−28.042.810.550.200.04 0.760.730.060.440.190.32
22FD051J2t2940~2958−28.57−29.46−27.912.870.330.120.05 0.670.730.080.450.180.38
23FD16J1s2350~2354−28.17−28.93−27.62.700.540.180.05 1.031.000.050.440.230.32
24FD2J2t3191~3229−28.25−28.54−27.593.170.330.110.00 0.460.460.100.630.190.35
25KT1P2l5296~5315−25.72−25.95−25.772.590.330.130.05 0.290.220.450.700.370.52C
26XQ2C2b2527~2552−26.56−26.87−28.022.020.280.1500.200.430.210.680.310.71
27XQ114C2b2490~2513−27.2−27.28−27.821.980.290.160.02 0.180.320.190.710.320.81
28XQ10T1j2042~2044−27.09−27.14−26.842.120.310.150.02 0.230.210.260.620.280.44
29F19T1j2673~2680−29.39−29.6−29.141.610.220.150.02 0.250.330.200.730.440.86
30F30C3218~3248−28.55−28.77−28.182.230.320.150.03 0.250.380.220.570.330.77
Notes: Fm. = formation; sat = saturated fraction; aro = aromatic fraction; Pr/Ph= pristane/phytane; β/n-Cmain = β-carotane/main peak carbon of n-alkanes; C19TT/C23TT = /C19 tricyclic terpane/C23 tricyclic terpane; C24Te/C23TT = C24 tetracyclic terpane/C23 tricyclic terpane; GI = gammacerane/C30 hopane; ETR = (C28TT + C29TT)/(C28TT + C29TT + Ts); C27/C29 = 5α, 14α, 17α, 20R-cholestane/5α, 14α, 17α, 20R-24-ethyl-cholestane; C28/C29 = 5α, 14α, 17α, 20R-24-methyl-cholestane/5α, 14α, 17α, 20R-24-ethyl-cholestane.
Table 2. Correlation matrix of the thirteen geochemical variables.
Variablesδ13Coilδ13Csatδ13CaroPr/PhPr/nC17Ph/nC18C27/C29C28/C29C19TT/C23TTC24TeT/C23TTGIETRβ/n-Cmain
δ13Coil1
δ13Csat0.9901
δ13Caro0.9330.9221
Pr/Ph0.7540.7180.8541
Pr/nC17−0.769−0.796−0.675−0.5281
Ph/nC18−0.853−0.849−0.859−0.8270.8851
C27/C29−0.436−0.375−0.501−0.6890.3690.5801
C28/C29−0.474−0.427−0.658−0.8430.1700.5390.6521
C19TT/C23TT0.4700.4140.6180.840−0.215−0.587−0.681−0.8211
C24TeT/C23TT0.2290.1640.3330.643−0.002−0.336−0.590−0.6950.9131
GI0.2210.2740.088−0.317−0.2350.0350.4870.483−0.591−0.7431
ETR−0.111−0.052−0.299−0.579−0.2060.1950.4090.751−0.793−0.8320.6871
β/n-Cmain−0.735−0.710−0.693−0.6530.8200.8650.7230.395−0.491−0.2980.0460.0391
Absolute linear correlations >0.500 are highlighted. Descriptions of the parameters are provided in Table 1.
Table 3. Maturity-related parameters of crude oil in the East Fukang Sag.
Sample No.WellFm.Depth (m)C2920S/(20S + 20R)C29αββ/(ααα + αββ)C3122S/(22S + 22R)Ts/TmM/HOil Family
1F46P2l3157~31650.410.330.570.590.16A
2SQ12P3wt2902~29260.470.470.570.460.13
3B307P3wt2266~22700.410.460.590.380.14
4XQ5T2k2382~23920.440.440.580.220.18
5F19T2k2368~23710.470.490.570.290.18
6T31J2t2301.5~2348.60.430.420.580.230.16
7T62T2k2790~27950.420.410.610.300.17
8F006P3wt2770~27800.450.450.570.270.17
9F25P3wt2775~27830.450.470.580.250.16
10B403C2b2756.5~27690.420.440.570.220.17
11B418J2t1873~19070.420.420.550.210.19
12B418E1773~17790.430.460.570.460.15
13F010P3w2756~27790.470.520.530.590.14
14F43P3w3132~32140.460.480.580.53 0.12
15XQ12J2t2359~23710.450.490.570.510.17B
16FD021J2x3620~36250.410.460.570.350.21
17F32J2t3277~32860.430.470.580.380.22
18FD9J2t2813~28790.460.500.580.450.17
19FD052J2t3038~30470.440.480.570.440.18
20FD052J2t2963~29740.460.490.570.470.18
21B97J1s3583~35950.440.530.580.460.17
22FD051J2t2940~29580.450.480.580.460.18
23FD16J1s2350~23540.450.500.580.540.17
24FD2J2t3191~32290.450.500.560.610.18
25KT1P2l5296~53150.440.590.412.070.17C
26XQ2C2b2527~25520.460.480.630.260.28
27XQ114C2b2490~25130.470.460.560.280.18
28XQ10T1j2042~20440.480.570.442.870.14
29F19T1j2673~26800.470.450.600.330.17
30F30C3218~32480.440.500.600.740.16
C3122S/(22S + 22R) = 17α(H),21β(H)-C31 hopane22S/(22S + 22R); M/H = C30 moretane/C30 hopane.
Table 4. Geochemical characteristics of crude oils from the potential source rocks in the study area for preliminary oil–source rock correlation (data from References [16,17,26,51]).
ParametersCarboniferousPermianJurassic
δ13C>−26‰<−30‰>−28‰
Pr/Ph>21~2>2.5
C27-C28-C29 regular steranes“ascending” or “reverse L”-shaped, C29 >> C28 >> C27“ascending” type, abundance in C28 and C29“ascending” or “reverse L”-shaped, C29 >> C28 >> C27
C19-C21-C23 TT“descending” type“ascending” or “mountain peak” type“descending” type
Gammacerane/C30Hopane>0.2>0.1<0.1
β-carotanenot detectedabundantnot detected
Publisher’s Note: MDPI stays neutral with regard to jurisdictional claims in published maps and institutional affiliations.

