1. Introduction
Throughout the last three decades, automotive manufacturers have been positively influenced by hydrogen and fuel cell (FC) technology. The main goal of car manufacturers can be highlighted as minimizing fuel consumption and exhaust emissions, while improving the limits of autonomy, energy efficiency, and adaptation to the latest technologies [
1,
2]. Therefore, electrically assisted propulsion systems are added to vehicles, calling them electric vehicles (EVs). ALT: Several of the automotive industry’s greatest challenges can be narrowed down to minimizing fuel consumption and exhaust emissions, while simultaneously improving the limits of autonomy, energy efficiency, and technological integration. In trying to achieve these goals, electrically assisted propulsion systems are implemented instead of conventional internal combustion engines, transforming ICE vehicles into electric vehicles (EVs). Battery electric vehicles (BEVs) and hydrogen fuel cell electric vehicles (FCEVs) have become the main focus of researchers and manufacturers [
3]. The FCEV’s merits are zero emissions (water only), faster fueling, quieter driving, better fuel economy and efficiency, and easy maintenance [
4]. However, FCEVs face several drawbacks, such as limited range, underdeveloped hydrogen stations infrastructure, storage and safety challenges, high sale prices, and even less recognition and popularity [
5,
6].
The energy generated by a fuel cell can directly supply the vehicle’s traction engine or can be stored in an auxiliary system (battery and/or ultracapacitor). Without an existing means of energy storage, regenerative braking cannot exist. Increasing the speed leads to a sudden increase in power, which is generally provided by the auxiliary power system [
7,
8]. If this power is generated directly by the FC, it can reduce the lifetime of the FC components. This issue can be solved by integrating a hybrid energy storage module [
9,
10]. If an FCEV is hybridized with a lithium-ion battery, ultracapacitor, etc., this type of vehicle is described as a fuel cell hybrid electric vehicle (FCHEV) [
11,
12,
13]. Following the experimental studies of an FCHEV operating in a New European Driving Cycle (NEDC), four levels of vehicle operation on a timeframe are highlighted: maintaining the load (56.5%), start–stop (33%), high power (5.8%), and idle (4.7%) [
14]. For this reason, the operation lifetime of an FC in a transport application is much shorter than in a stationary application, mainly due to idling conditions (high voltage) and start/stop conditions that dramatically decrease the performance of the FC [
15].
The context of the application of FCs in the field of transportation is specific to the type of integration. Thus, the required power of a vehicle is in the range of 100 kW–1 MW (for example, 200 kW for buses and trolleys, 600 kW for trams, and 1 MW for locomotives). Assuming a 50% hybridization, the power of the FC generator on board should be about 100–400 kW [
16]. However, constructing a single fuel cell stack (FCS) with such power capabilities encounters technical implementation difficulties. To overcome this impediment, a reasonable solution is to combine several connected fuel cell stacks (modules) in different configurations to reach the desired output. Furthermore, in the design phase of the FCHEV, the following criteria must be considered: high efficiency, increased reliability, easy maintenance, better safety, compactness of the power supply system, and various operation modes of the FC. Other power storage systems are also required, due to the transient slow power response of the FC and to the condition of compliance with the driving profile (NEDC, Extra Urban Driving Cycle (EUDC), etc.) [
17].
Transportation applications require a lot of power. Increasing the power of a fuel cell stack is achieved by increasing the number of single cells (higher voltage) and the active area (higher current). However, long fuel cell stacks may be subject to uneven reaction gas flow and temperature within the assembly, which may in turn cause possible malfunctions [
18]. Another disadvantage is that the weakest cell will always limit the stack’s power. Additionally, since the cells are connected in series, the failure of a single cell leads to the unavailability of the entire stack [
19].
An attractive solution is to combine several FC stacks to remove all of these impediments, thus building a power architecture with several elementary assemblies. By combining them, the power of each stack must be individually managed while considering a possible gap between their performance. The powertrain’s architecture should consider the different methods of connecting the power components (in series and/or in parallel), with the proper choice of electronic power converters being essential [
20].
Currently, the available research presents different concepts of segmentation of a set of fuel cells (FCs). Thus, [
21] shows a method and a device for monitoring the performance of fuel cells grouped in series. Four variants are given based on the voltage measurement at the group level and their comparison with reference voltages, which trigger alarms to stop the fuel supply at certain thresholds. In [
22], a device is disclosed consisting of two FCs in tandem with an auxiliary storage system. A controller is configured to adjust the power flow according to the motor power demand. The first FC provides power output to the DC bus, while the second FC is used to provide additional power to the motor transitions in the acceleration phase. One work [
23] refers to a hybrid fuel cell system with a multi-fuel-cell structure that maintains the FC voltage below the auxiliary storage system voltage (ultracapacitor). Therefore, during vehicle braking, the amount of energy recovered is stored entirely in the ultra-capacitor, with the advantage of improving fuel efficiency. It has been shown that the optimum consumption of a set of fuel cells is obtained while operating in the field of maximum efficiency (usually 30–40% of maximum power). Another proven rule is that the average power consumed by the engine of an electric vehicle traveling according to an NEDC driving profile is about 20–25% of the maximum power, while the energy recovered from braking is 8–10% and the consumption of hydrogen per 100 km traveled is approximately 0.85 kg (FCEV) [
24]. It is also known that fast transient and start–stop cycles in the operation of an FCS can cause an inadequate fuel supply, causing the voltage to drop below the critical level of 0.6 V, accelerating the degradation of the catalyst and the membrane [
25,
26,
27].
The performance of the FCs depends on their power level and the architecture of the entire powertrain [
13,
28]. FC systems with multiple fuel cell stacks could show improved performance compared to conventional fuel cell systems [
29]. Moreover, the solution of stacking several fuel cells allows for a modular design of the entire system, with FCs being able to be replaced separately as they can be isolated. The total power therefore depends only on the number of FCs. If an FCS fails, the FC system will only lose partial power, maintaining the system’s overall reliability. When the system has more than one stack, there are different possibilities for power distribution, allowing for better efficiency to be achieved for various tasks (a multi-stack FC system provides more optimal power points) [
30]. Moreover, a multi-stack FC system is easier to integrate physically into the entire application [
31].
However, the issue of using several stacks of FCs for FCHEV supply leads to some constraints: (1) the operation of the entire fuel cell stack; (2) the choice of interconnection of the elementary stacks and the coupling to the FC converter in such a way that, in case of a temporary failure, the stack in question can be isolated; (3) the control method of the starting sequence of the FCHEV; and (4) energy management of the FCHEV powertrain.
Therefore, the design of the programmable electrical coupling device at the interface of the FC power converter must be fault tolerant. This is a critical issue in the overall power management of the entire powertrain. Fault tolerance allows operators to manage the possible faults of a set of FCs, so that the FCHEV remains operational, even at a lower power capacity [
20,
32].
Segmenting an FC system into several independent modules has the following advantages: modular design of the entire FC system, with fuel cell stacks that can be replaced separately, as they can be isolated; the operating mode of the fuel cell stacks to maintain usage at peak efficiency (or better fuel economy); fault tolerance in case of malfunction (drying/flooding) of a fuel cell stack, monitored by voltage drop (increasing the standard lifetime of the fuel cell); and avoiding the operation of the fuel cell stack in improper operating conditions (maximum load, start–stop cycles, idling, etc.).
This paper aims to evaluate the technical feasibility of an FCHEV (consisting of two stacks of fuel cells as the main power source and an auxiliary storage system of lithium-ion batteries) for applications in the field of off-road vehicles in the range of 120–150 kW.
The novelty and main contributions of this research study are as follows:
- -
An innovative and cheap coupling mode of the FCs is proposed, using a single converter and a single current control input generated by FCS, as opposed to other similar but expensive solutions proposed;
- -
The design of a power distribution unit (PDU) for coupling FCS1 and FCS2 to a one-way power converter is presented;
- -
An innovative starting sequence of a hybrid electric vehicle powered by a two-stack fuel cell system is proposed;
- -
A rule-based control algorithm that determines the power reference value produced by the two fuel cell systems to track the point of maximum efficiency is presented;
- -
The software for monitoring, commanding and controlling the operation of FCHEV is detailed;
- -
The proposed solution is experimentally validated.
Thus, the paper is structured as follows:
Section 2 presents the powertrain architecture for an off-road vehicle, emphasizing the device connecting the two fuel cell systems. The off-road vehicle startup sequence and power flow control methods are explained in
Section 3. In
Section 4, the experimental results of FCHEV for two EUDC driving cycles are reported and discussed. Finally, the conclusions are drawn in
Section 5.
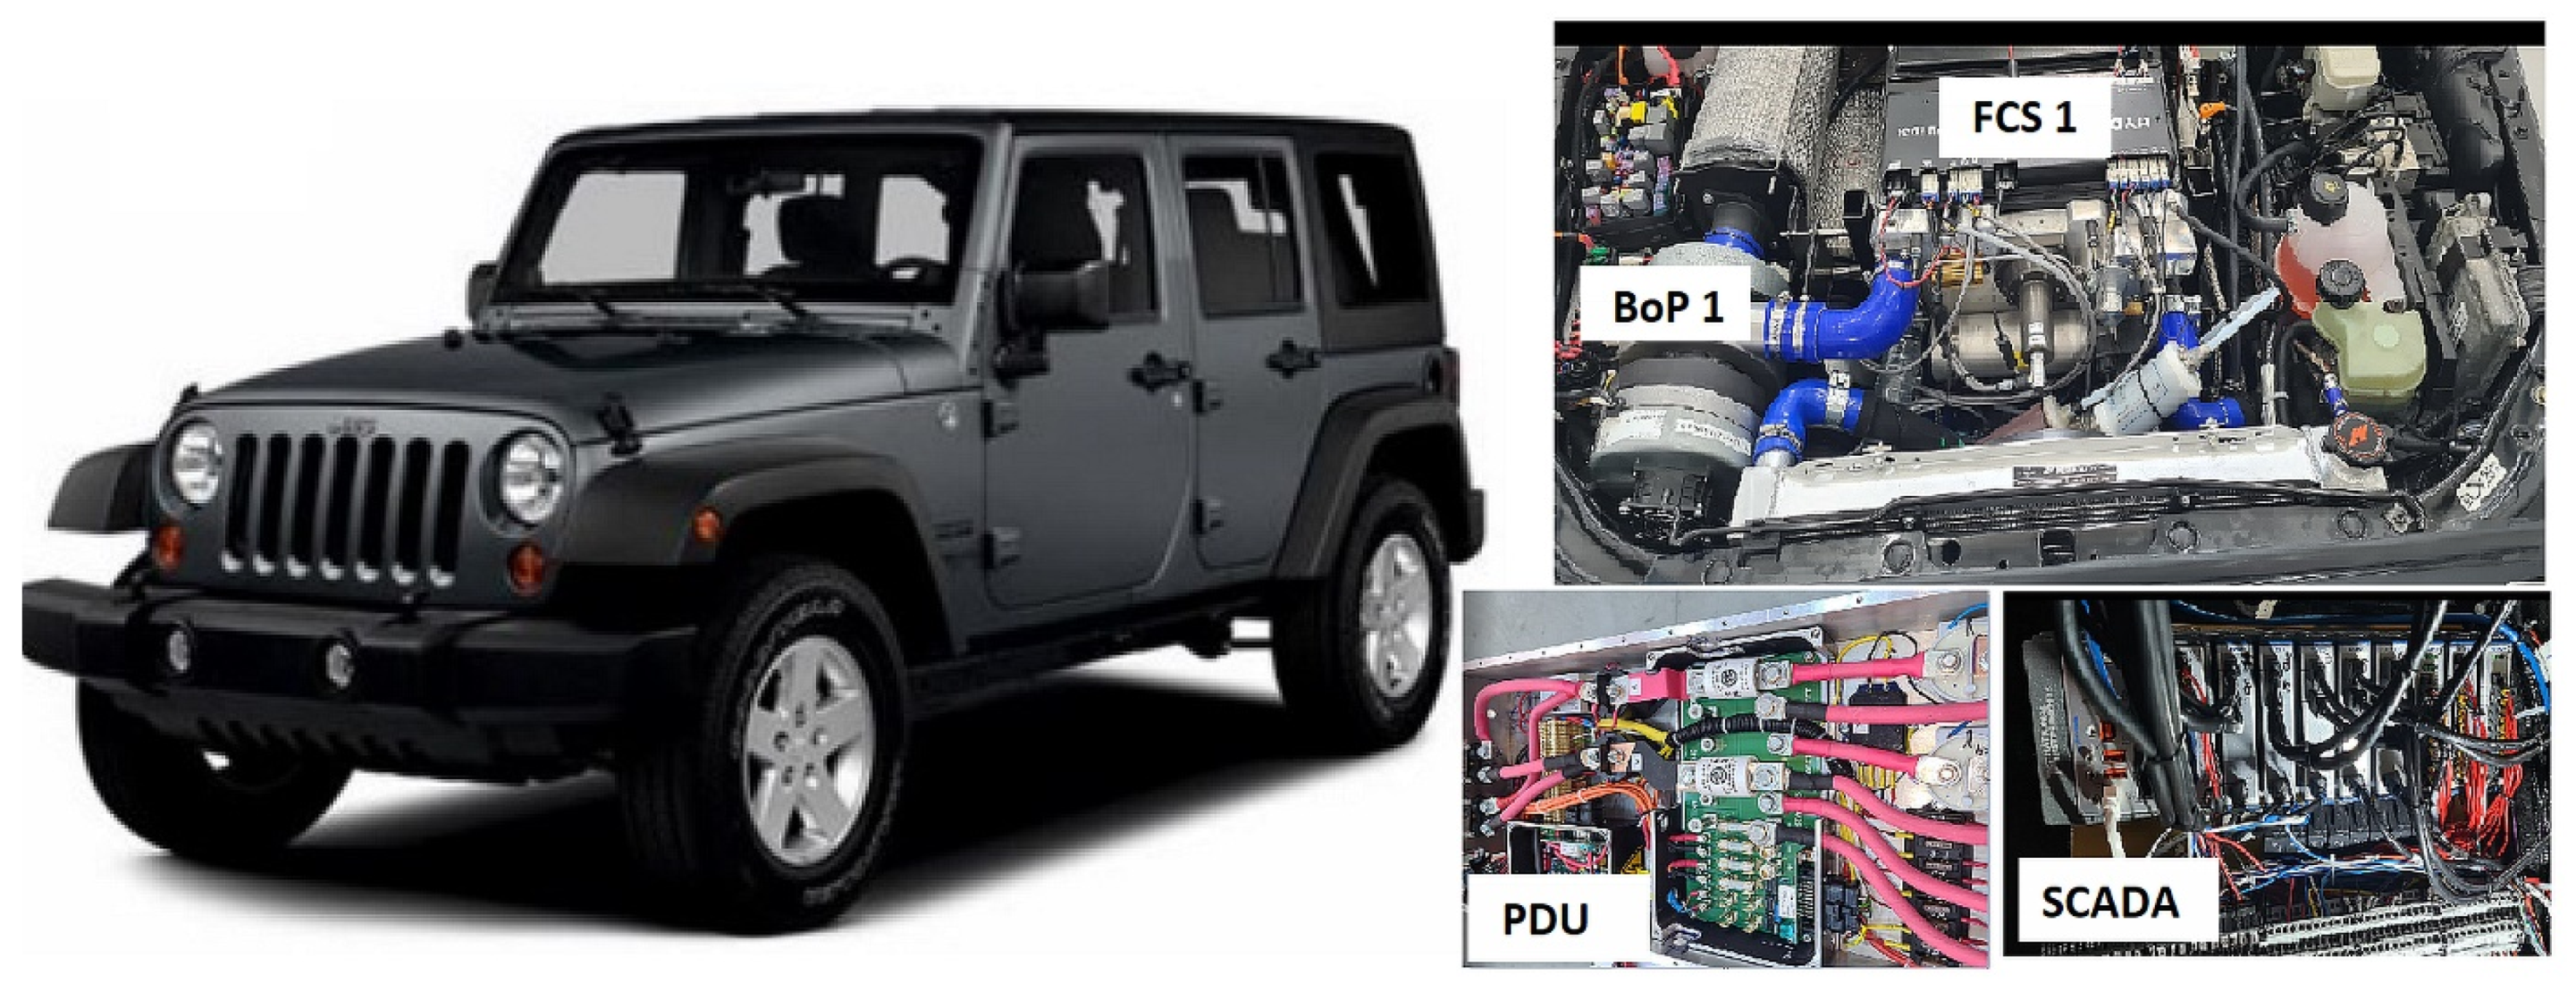
2. Off-Road Vehicle Powertrain Architecture
The characteristics of the off-road vehicle studied in this paper are a total mass of 2060 kg, a frontal surface of 3.1 m
2, a wheel diameter of 0.8 m, an aerodynamic coefficient of 0.3, and a friction coefficient of 0.001. The vehicle’s maximum speed was designed at 130 km/h, with an acceleration from 0 to 100 km/h in 15 s and a range of 500 km. The hydrogen quantity is approx. 7 kg, stored at a pressure of 700 bar. In [
33], the powertrain was developed and simulated for several driving cycles.
Figure 1 shows images from the construction of the off-road vehicle.
The architecture of the powertrain consists of a PEM fuel cell power system (60 kW), a lithium-ion battery system (38.2 kWh), a 12 V and 24 V battery system for powering electronic devices (2 kWh), and two electric motors (continuous power 2 × 50 kW) for vehicle motion. The above components are interconnected, using DC/DC converters, DC/AC inverters, various power distribution units, and pre-charge circuits.
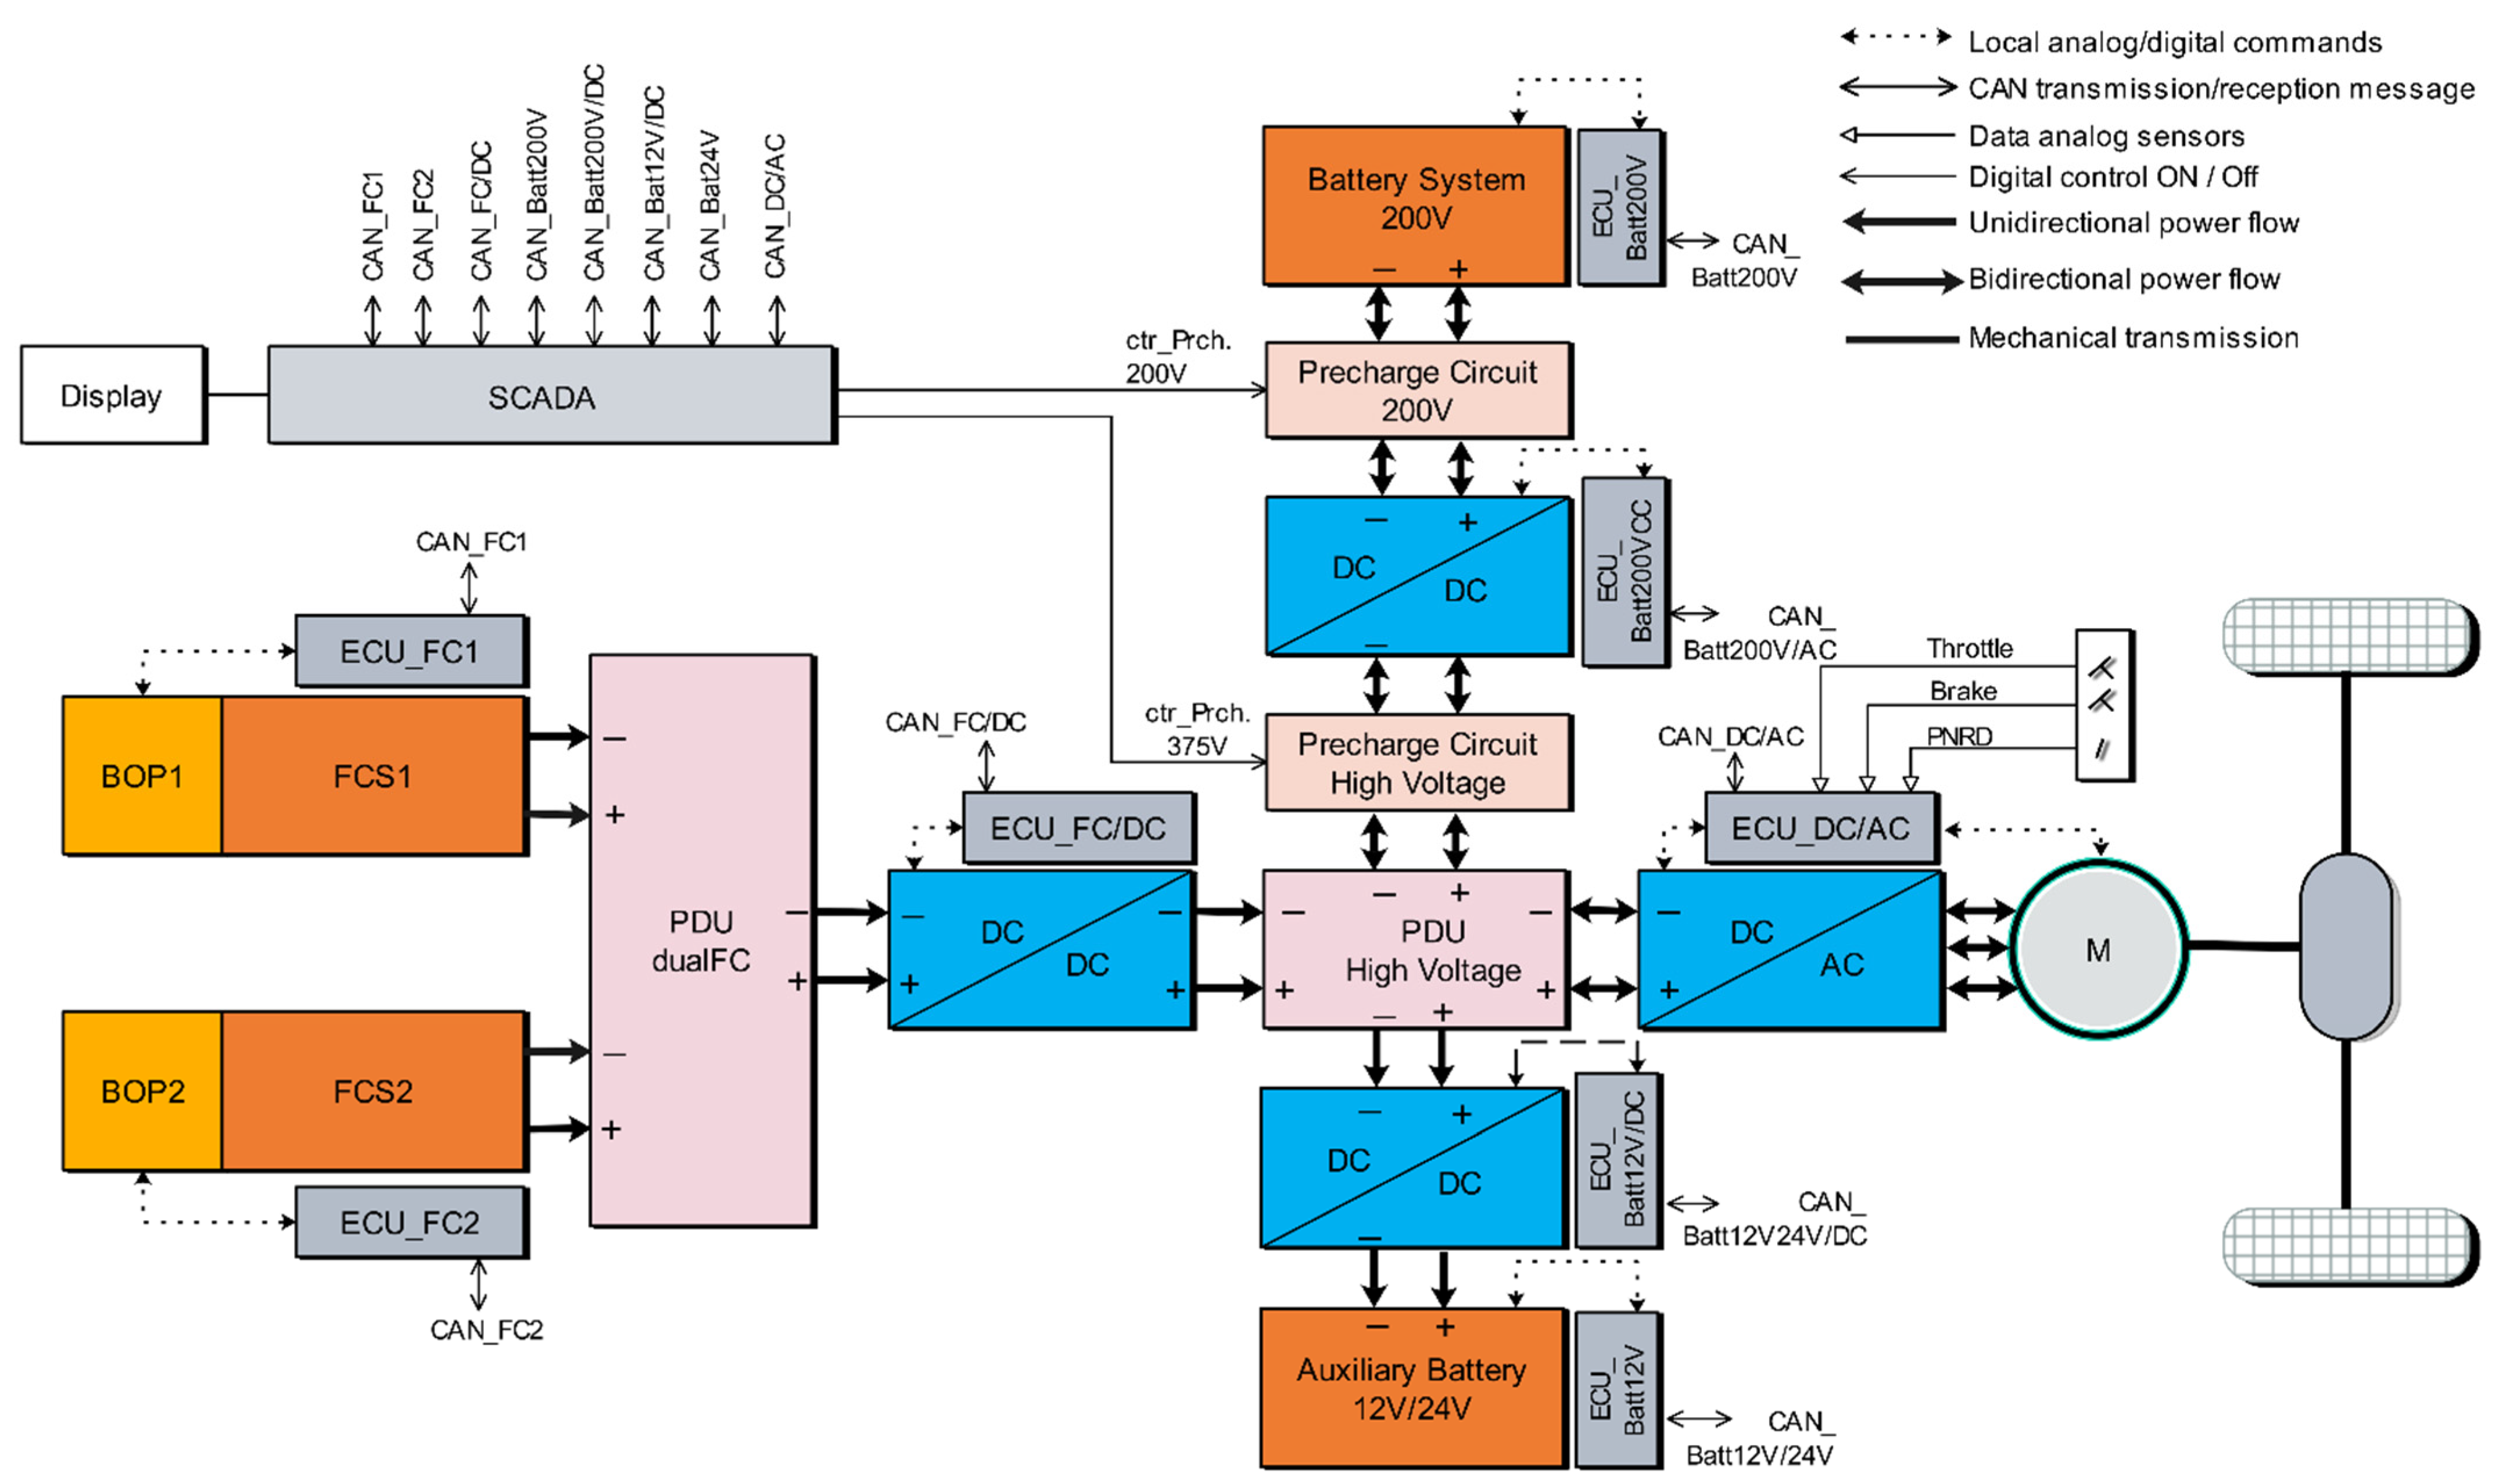
The block diagram of the electric vehicle in a hybrid configuration with a fuel cell/battery system (FCHEV) is shown in
Figure 2. The system consists of two fuel cell systems (FCS). Both systems (FCS1 and FCS2) have their own command and control subsystems (BoP1 and BoP2) to supply the required quantities of reactants (air and hydrogen) at optimal parameters. The gas supply subsystem consists of a number of pumps, valves, radiators, fans, and supply lines. These components are monitored and controlled by a local electronic control unit (ECU). The ECU is interconnected with the SCADA (platform hardware and software NI) via CAN bus data communication. The ECU receives commands from the SCADA and the current reference values generated by each FCS system. The ECU ensures the optimal temperature, pressure, and flow values to produce the necessary electric current. The BoP system and the monitoring and control system were described in our patent [
34,
35].
The two fuel cell systems are identical, with a useful power of 30 kW each, and they are composed of 120 single cells each. The voltage for each stack is in the range of 60–110 V, and the maximum current is 500 A. The FCS1 and FCS2 systems are connected to a PDU_dualFCs programmable device. Depending on the stack’s coupling method at the PDU_dualFCs output, the voltage range is between 60 and 220 V. The disadvantage of the fuel cells is that the output voltage varies greatly, especially when the engine load changes. Therefore, the FC/DC converter is used to provide a constant voltage on the high-voltage DC bus. In addition, the FC/DC converter plays an essential role in the energy management system. This FC/DC converter is locally controlled by its own ECU_FC/DC, with the data being transmitted externally on a communication line with SCADA. The DC/DC converter has a ripple current/voltage at values below 0.2% of the total value of the controlled current/voltage, which is very important for the safe operation of fuel cell stacks.
The 200 V battery system (HVBatt) is an auxiliary energy storage system made of lithium/ion cells. The battery voltage ranges from 144 to 201.6 V, with a maximum discharge current of 500 A, a maximum charging current of 250 A, and a capacity of 38.2 kWh. This battery system is used to maintain a constant voltage on the 375 V DC bus, providing maximum power during acceleration and recovering energy through braking. The output power of the battery system is controlled directly by an HVBatt/DC converter. In order to protect the power switches from the fast input currents side, a pre-charge circuit between the battery system and the converter is used to limit the current for a short period of time. The SCADA unit controls this process by comparing the voltage before and after the pre-charge circuit. The relay connects the battery to the HVBatt/DC converter when the voltage is approximately the same on both sides.
Currently, the FCS1, FCS2 and HVBatt are interconnected at the PDU375V input via the power circuits and converters. However, these components require a 12 V/24 V voltage. Therefore, the FCHEV is additionally equipped with a 2 kWh battery system, providing the necessary power during startup. The 12 V/24 V battery is controlled by a local system that transmits information to the SCADA central system via CAN lines. The 12 V/24 V battery is charged by the HVBatt via a Bat12 V/DC converter, controlled by the ECU Batt/12 V, ensuring good operating conditions of the 12 V/24 V battery.
The power supply for the two wheel-hub electric motors on the vehicle’s rear axle is independently controlled by two DC/AC inverters. The power is supplied to the DC 375 V bus via a power distribution unit (PDU), and the motors are controlled by a local ECU DC/AC control system, which helps set the FCHEV in motion in accordance to the received signals (throttle position; brake; transmission gear selector; Park, Reverse, Neutral, and Drive (PRND) unit, etc.).
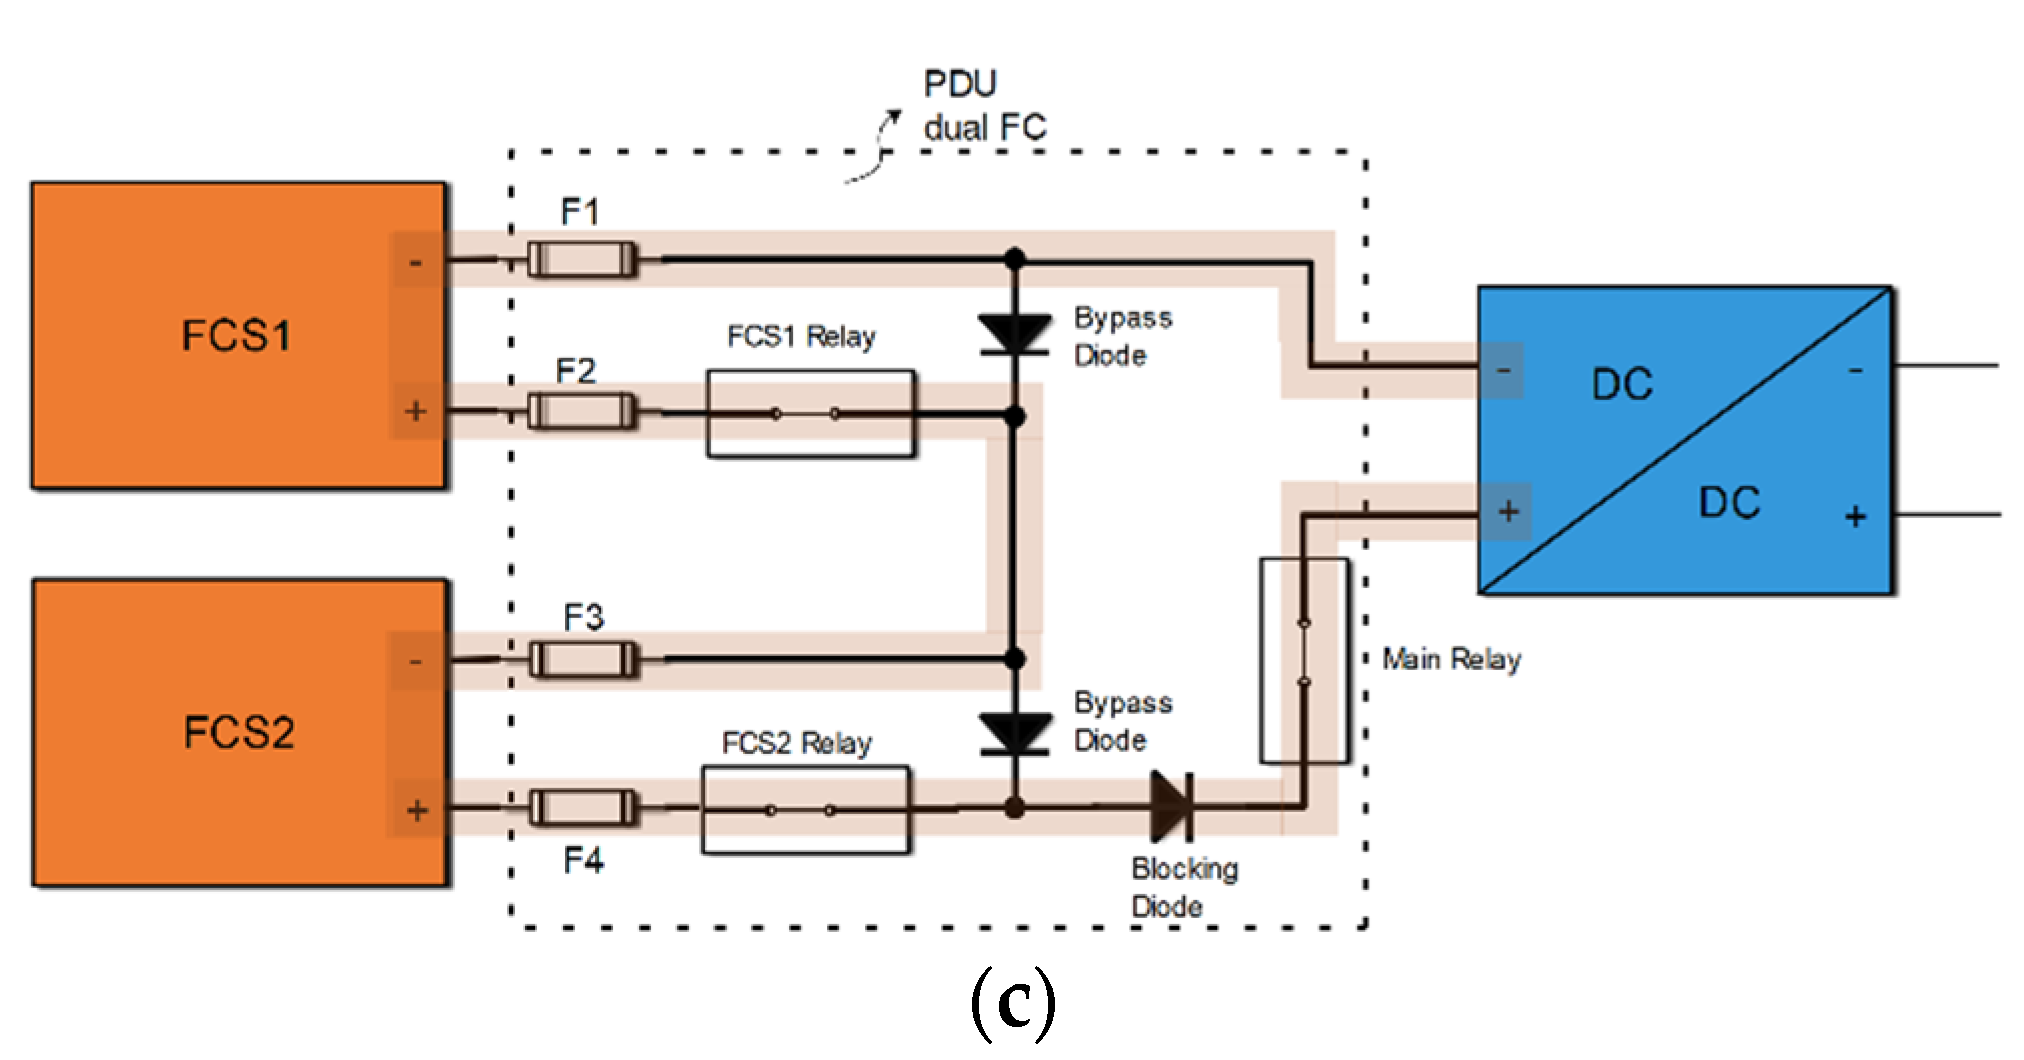
The PDU_dualFCS device is a power distribution unit that connects the two FCS in series or individually at the input of a unidirectional power converter in order to adapt the output voltage to the DC-bus voltage. The PDU_dualFCS is built from two bypass diodes, one blocking diode and several power switches. This principle of the series architecture of several fuel cell modules allows us to disconnect one module and bypass it through a bypass diode, thus ensuring current continuity. Such a series architecture is considered simple and cheap to implement because it uses a single converter to connect to the DC bus [
36,
37,
38]. However, a disadvantage of this series interconnection method is that it does not allow us to control the FCSs separately; both FCSs provide the same electric current [
37,
38,
39,
40]. Schottky-type diodes are used in the power path to prevent accidental discharge of reverse currents, together with several 500 A fuses for avoiding high currents. Such a solution where anti-parallel bypass diodes were used to isolate a faulty module was also discussed in [
39].
In our application, the FCS can be controlled by SCADA through CAN messages, which, following an energy management algorithm, decide which FCS operates and at what current.
Figure 3a shows the electrical connection of the first fuel cell system (FCS1) with a dedicated converter interface. The route is highlighted in orange. The FCS1 electronic control unit switches FCS1 relay. Operating conditions are met. Due to the potential generated at the FCS1 terminals, the bypass diode of FCS1 is blocked. The FCS2 is switched off with the FCS2 relay disconnected. The electrical route bypasses the FCS2 via the bypass diode. There is also a reverse current-blocking diode, and it is the main relay for safety conditions on the electrical route.
Figure 3b shows the electrical connection for the second fuel cell system (FCS2) at the unidirectional converter interface. In this case, the FCS1 is switched off and FCS2 generates the power. The electric route is highlighted in orange.
Figure 3c shows the electrical series connection of the two fuel cell systems, FCS1 and FCS2, with the converter interface. The direction of power flow is highlighted in
Figure 3c. Since both systems are on, it causes both bypass diodes to be blocked. Thus, the entire fuel cell system’s power is directed to the converter’s input, at a voltage between 120 and 240 volts and a current of up to 500 amps.
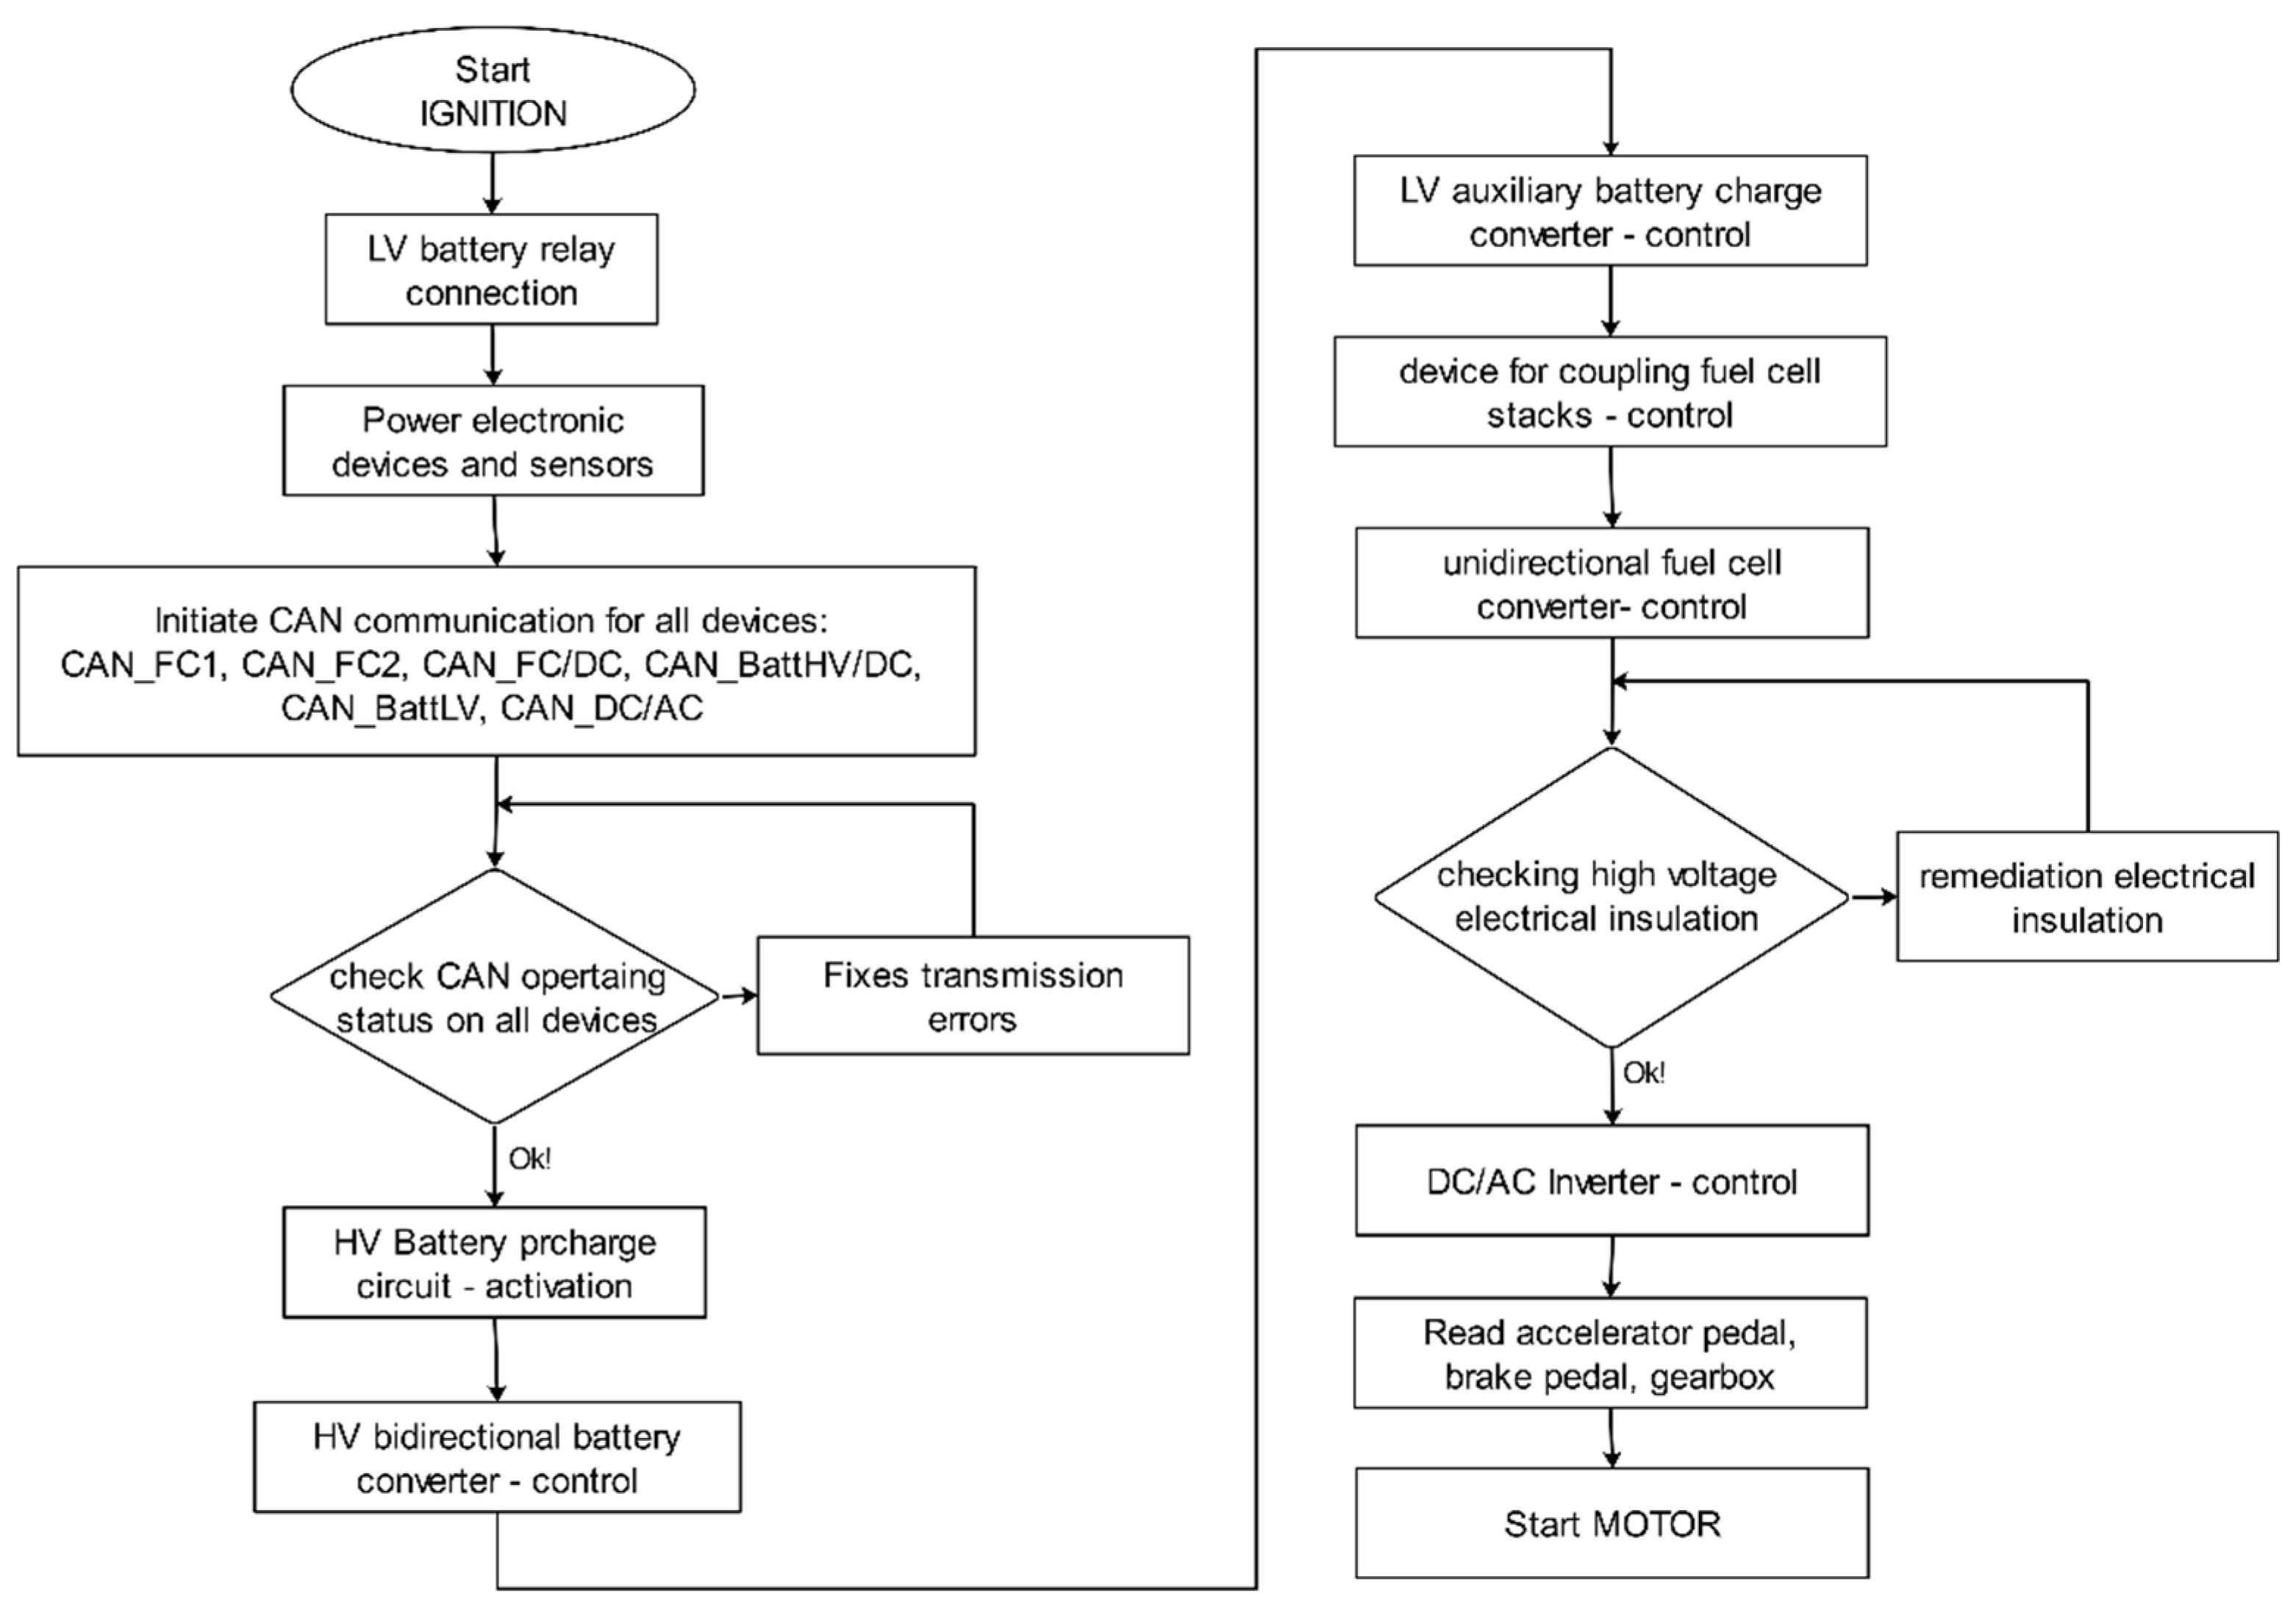
3. FCHEV Powertrain Control Methods
Figure 4 shows the starting sequence of the FCHEV. When the key is turned on the Ignition onboard the FCHEV, the 12-volt battery relays are connected, which connect the power supply to the low-voltage systems. Next, the SCADA initiates the CAN communication protocol with all local electronic control systems and then checks the status of each subsystem on the CAN lines and their readiness. If transmission errors are present, the process is restarted in the CAN communication re-initialization stage. If communication is in order, the system proceeds to the next stage. The battery output is connected to the converter after the HighVolt pre-charge protection circuit is activated. After the pre-charge phase at the input of the BatHV/DC converter, the power is provided by the high-volt battery system. The converter’s control method is shown in
Figure 5. It ensures that the converter safely charges the low-voltage battery. After the high-voltage bus is guaranteed, a voltage of 375 V is supplied, and the low-voltage batteries are charged from the large battery, the coupling device of the fuel cell stacks is configured. The control algorithm that configures PDU_dualFCS is shown in
Figure 6. A unidirectional converter controls the energy produced by the fuel cell stacks. The control method is shown in
Table 1.
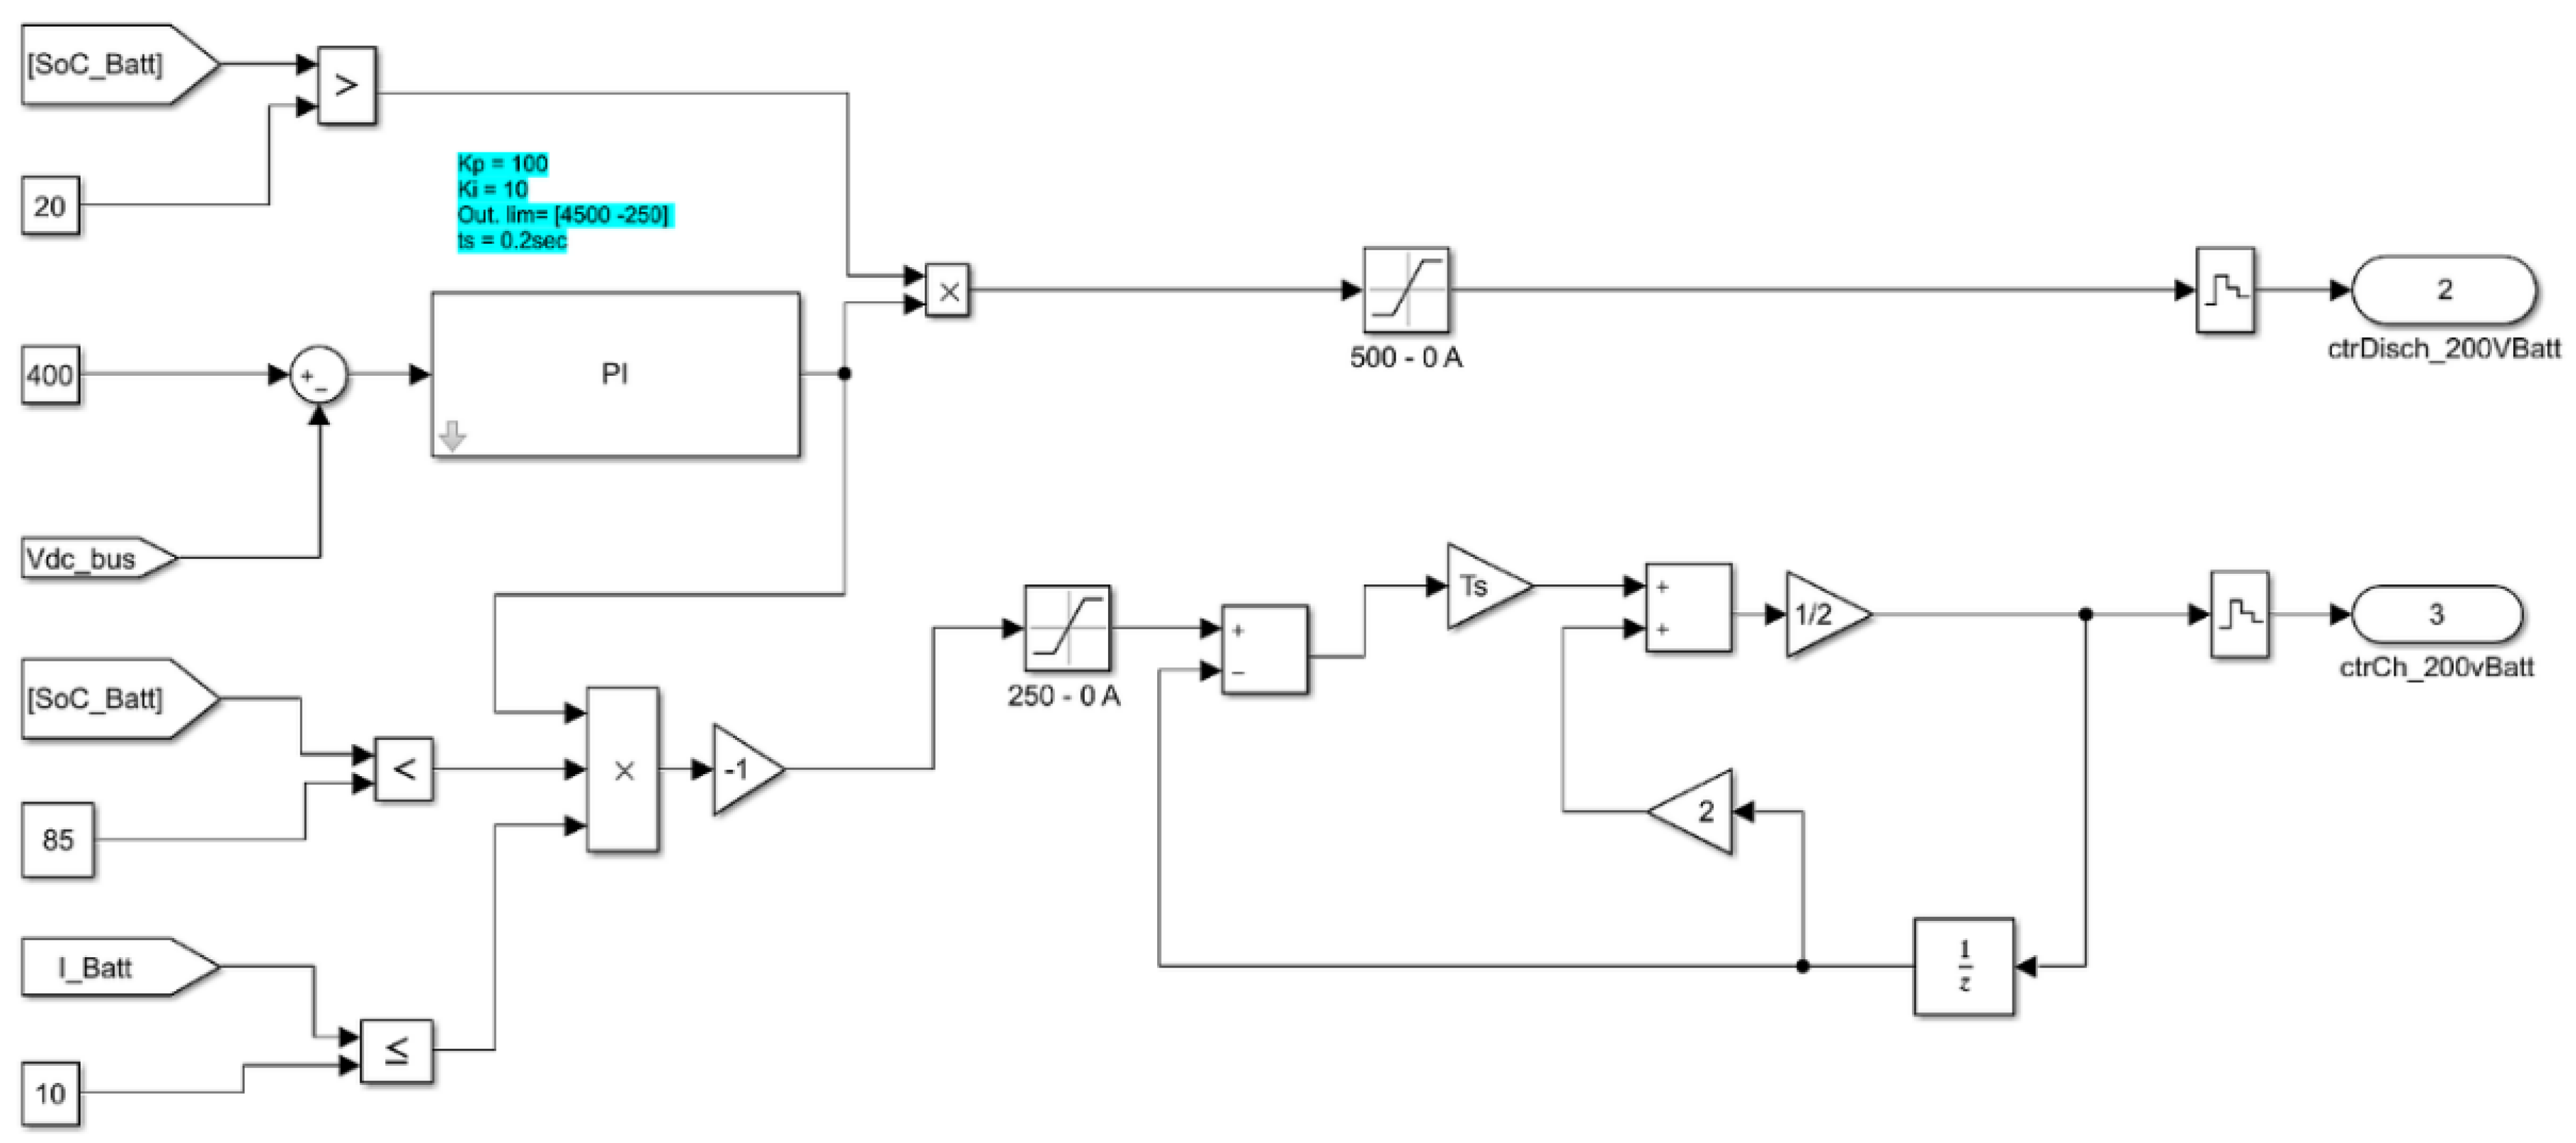
Figure 5 shows the control method of the charge and discharge current of the 200 V battery system. The control method uses a PI-type controller that inputs the battery state of charge (SoC) and the pre-set voltage on the 375 V DC bus. The controller compares the measured voltage to the pre-set value. In case of a negative value, the PI controller calculates the discharging current value from 0 to 500 A. Conversely, in the case of a positive value, the PI controller calculates the charging current value in the range of 0–250 A. The increase in voltage over 375 volts is mainly due to the recovered energy from braking that must be redirected to the battery. A drop below 375 volts occurs in the phases of sudden acceleration of the vehicle. The PI controller samples the information every 100 milliseconds, quickly checking the current value provided by the Bat200 V/DC converter depending on the situation. The control method runs in SCADA and transmits the CAN current value to the HV/DC converter. If the SoC value is below/above the reference threshold, i.e., below 20% and above 90%, the battery system is switched off. The PI regulator is tuned online and maintains the voltage value on the DC bus within ±0.2% of the set value.
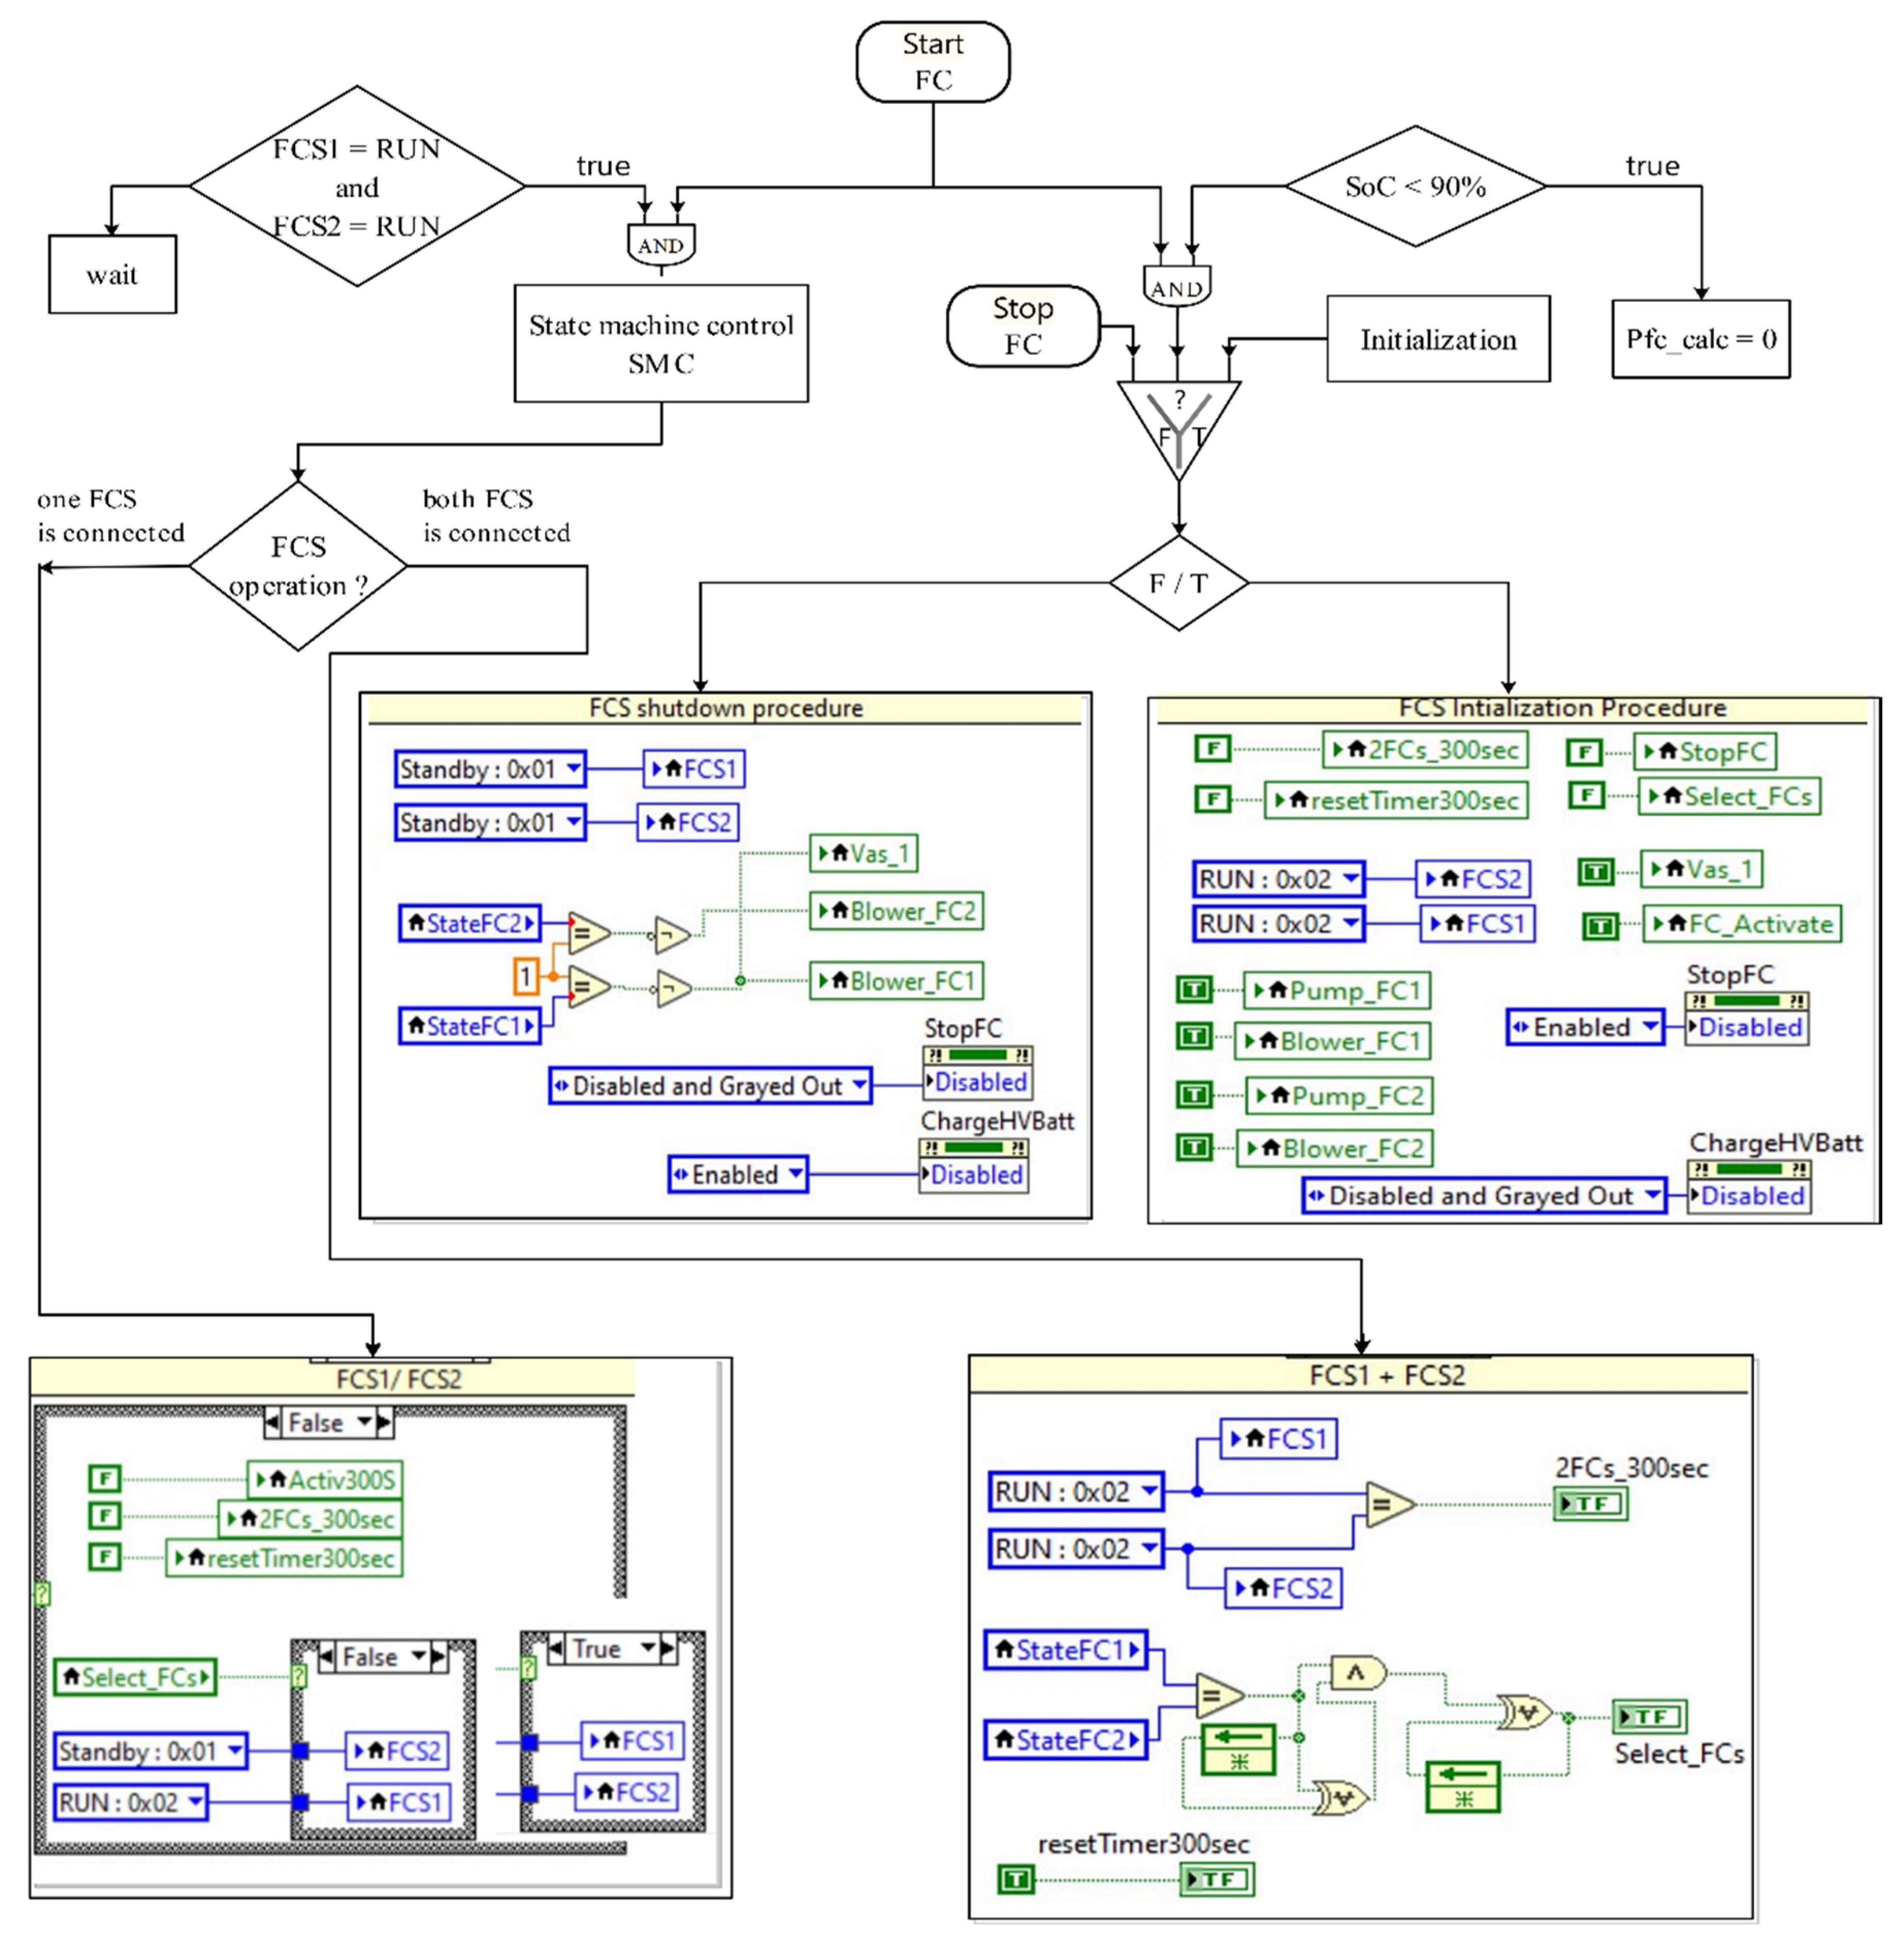
Figure 6 shows a control method for commissioning the two-fuel cell system. Both fuel cell systems are controlled remotely via CAN. The baud rate of the messages is 250 Kb/s. The SCADA system has specific CAN communication modules to communicate with fuel cell systems. The software is implemented in LabVIEW. FCSs are switched on and off by two buttons on the synoptic interface of the monitor. The buttons are
Start_FC and
Stop_FC, which the driver operates by touching the monitor.
Both fuel cell systems have an initialization procedure that is executed when the “Start_FC” button is active (logic 1) and SoC < 90%. The procedure consists of sending commands to run FCS1 and FCS2, opening the hydrogen valves, activating the converter, initializing the air blowers, starting the water pumps for cooling, and setting several flags in the software. Commands are passed through software via local variables. The idle time of the fuel cells is approximately 20 s. When both fuel cells have met the initialization conditions, the SCADA runs the SMC algorithm (
Figure 7), which decides to connect one fuel cell or both fuel cells.
This control method ensures that the two fuel cell systems are configured for peak fuel cell efficiency and an approximately equal runtime, and it runs a time-tested procedure for verifying the operation of the stacks in real time.
This method provides more redundancy than systems with a single stack. This redundancy is used to enable fault-tolerant operation. Faults are more common in fuel cells but can also occur in the power converter. Common defects in fuel cells are drying, flooding, and cell poisoning. This way, the segmentation of the FC system allows for the detection of faults within certain limitations (flooding and drying of the fuel cell).
This control method is run in SCADA and switches the relays on/off, as described above. The method does not implicitly control the power provided by the two stacks; the power management of the fuel cell is controlled in
Figure 7, where the two stacks are seen as one fuel cell system.
Table 1 shows a control method based on 11 rules. These rules determine the reference power of the FCS depending on the amount of power stored in the battery system and the energy consumed by the load (motor) in different driving conditions of the vehicle (acceleration and speed). This type of strategy increases the operating time of the FCS in a high-efficiency range. Due to the storage capacity of the battery system, the fuel cell operates in a quasi-stationary regime. The advantage of the interconnection architecture of the two FCS depends on the load power and the battery state of charge. Both FCSs can work in series, simultaneously with one FCS, or no FCS (pure battery) in case the SoC value of the battery is very high and the load power is very low.
The minimum, optimum, and maximum power values of the fuel cell system and the value of the battery state of charge are selected based on the efficiency map and the current and voltage limits: The control method uses a hysteresis controller for switching between states, thus avoiding oscillations.
As shown, the algorithm’s output is the current reference value to be generated by the FCS. The current reference was calculated by dividing the FCS’s power by the voltage value. The FCS’s power is conditioned by a power ramp (1 kW/s up and 4 kW/s down) to avoid oxygen starvation of the fuel cell due to sudden load changes. The maximum power generated by the propulsion system (FCS/Batt) is 116 kW, of which 110 kW is the maximum power consumed by the electric motor, and 6 kW is the auxiliary power available to supply the electrical components. The air-supply compressor, a big power consumer, is fed directly from the FCS terminals. The fuel cell system cannot satisfy the dramatic change in electric power demands during sudden acceleration or the vehicle going uphill.
Additionally, power fluctuations will damage fuel cell stacks and shorten their lifespan. Therefore, the FCS is combined with a battery system to increase the power density and meet the power requirements of the load. The average power of the battery system in our application is 56 kW (3.89 V per cell, 300 A current).
The state machine control aims to determine the reference power of FCS in cases of state change. According to the state division of the battery SoC and the load shown in
Table 1, the state machine control is divided into 11 states (rules) to optimize the FCS output. In State 1, the vehicle operates purely electrically powered by the battery. This state would have a very low probability of operation below 1%. In States 2 and 3, the vehicle operates with only one FCS because the battery has enough energy to support a motor load of up to 60 kW. This way, the fuel cell operation at voltages close to OCV is avoided, as it can destroy the platinum catalyst by overheating. A percentage of up to 7% is possible to operate the FCS at the optimal power of a single FCS (approx. 10.8 kW).
Both FCSs operate in series for States 4–11. In State 4, when the power consumed by the motor is lower than the optimal power of the FCS (21.7 kW) and the SoC has a value between 55% and 80%, then the FCS power reference is equal to the minimum value of 11.4 kW. This value is sufficient to support the load, and the FCS efficiency is relatively high (53.0%). In States 5 and 6, the FCS operates at the maximum efficiency of the entire fuel cell system (53.4%), having a power value of 21.7 kW. For States 7, 8, and 9, the FCS power reference is determined by a maximum function. This function calculates the maximum value between the optimal FCS value and the difference between the load power minus 25% of the optimal battery power. According to the algorithm, the FCS only works at constant power levels. In this way, a fuel reduction and an increase in the fuel cell life are obtained. Switching from one level to another level of power is controlled by a ramp power controller, with a ramp-up to 1 kW/s and a ramp-down to 4 kW/s.
Typically, the vehicle runs in States 4–9 (about 85%) for EUDC and FTP driving cycles. FCS works at maximum power only in State 11, which is very rare, below 5%, only when the battery system is fragile and the energy consumed by the engine is very high (climbing, sudden acceleration).
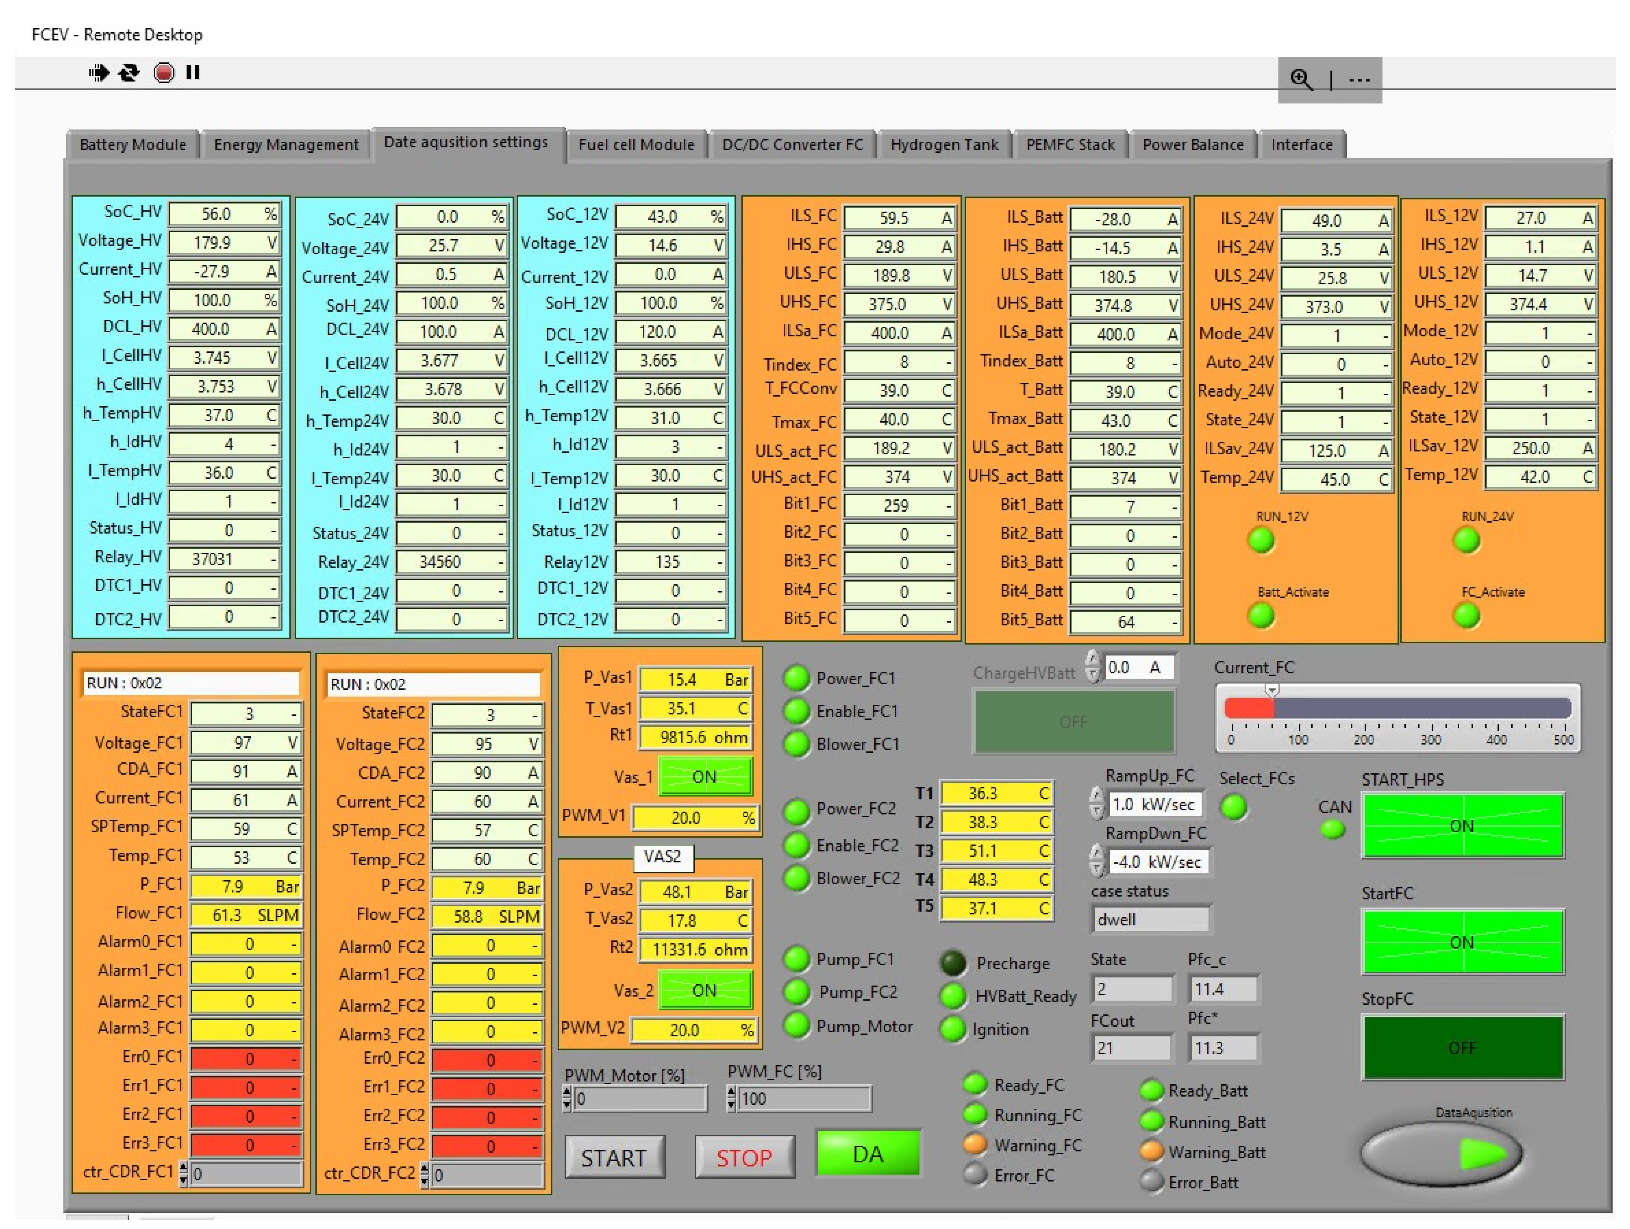
Figure 7 shows the software program interface, in which the monitoring and control parameters are observed.
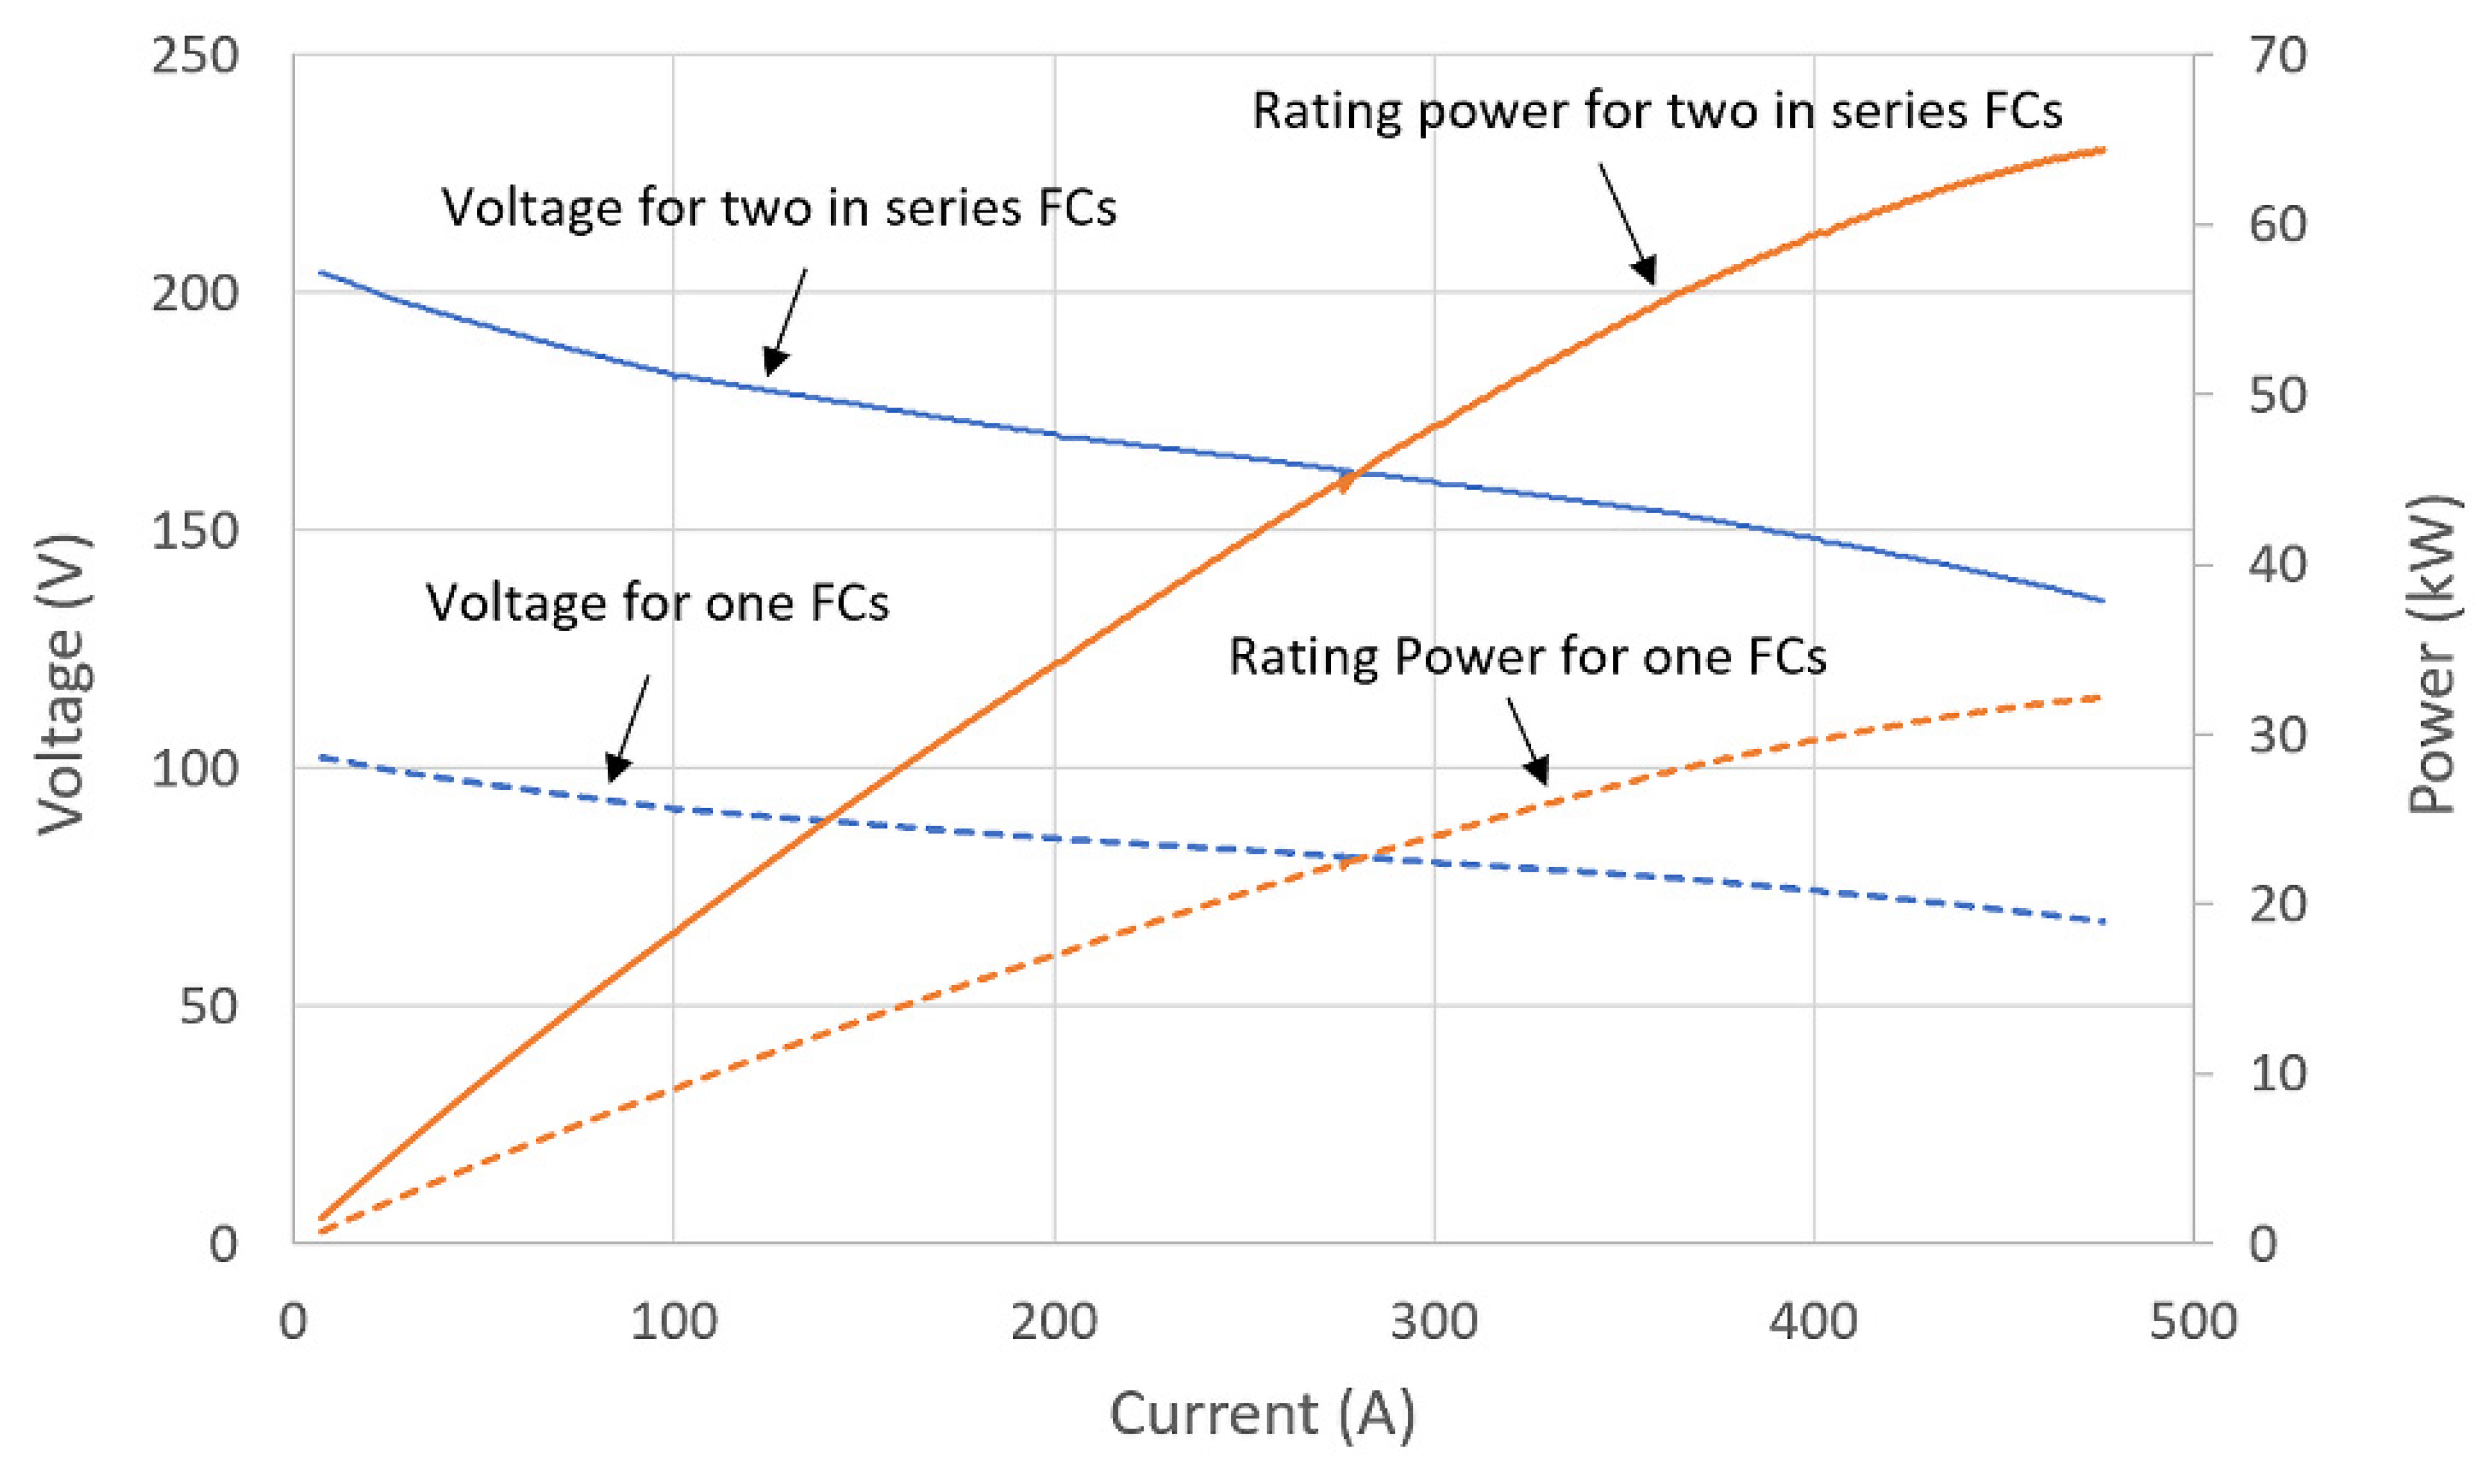
The PDU_dualFCs device allows for the coupling of one or both fuel cell systems, considering several constraints due to the faulty operation of a stack. For example, if there is a significant 10% decrease in the voltage of one FCS below the voltage/current operating characteristic (
Figure 8), then the functionality of that fuel cell stack is taken over by the other stack by coupling the relays on that route. At the same time, the defective stack is reconditioned by purging the anodic and cathodic compartments, reaching the optimal voltage parameters. The main reasons for the drop in voltage are insufficient gas supply due to flooding and drying of the membrane and poisoning with pollutants, especially the carbon monoxide (CO) of the platinum catalyst.
The energy management strategy is established starting from the voltage/current and efficiency/power characteristics for a single and two fuel cell stacks in series.
Figure 8 shows the voltage (power)/current characteristic for both cases over the entire operating range. These V(P)/I characteristics are stored in the SCADA memory and are compared with the instantaneous voltage values relative to the total power spectrum.
The energy efficiency of a fuel cell system is defined as the ratio of the total electrical energy produced to the energy produced by burning hydrogen. The hydrogen energy is calculated at a temperature of 25 °C and a pressure of 101.3 kPa. The efficiency characteristic does not include the power consumption of fans, coolant recirculation pumps, and the efficiency of DC/DC converters. By definition, it follows that high-efficiency fuel cell operation is equivalent to fuel cell operation with low fuel consumption.
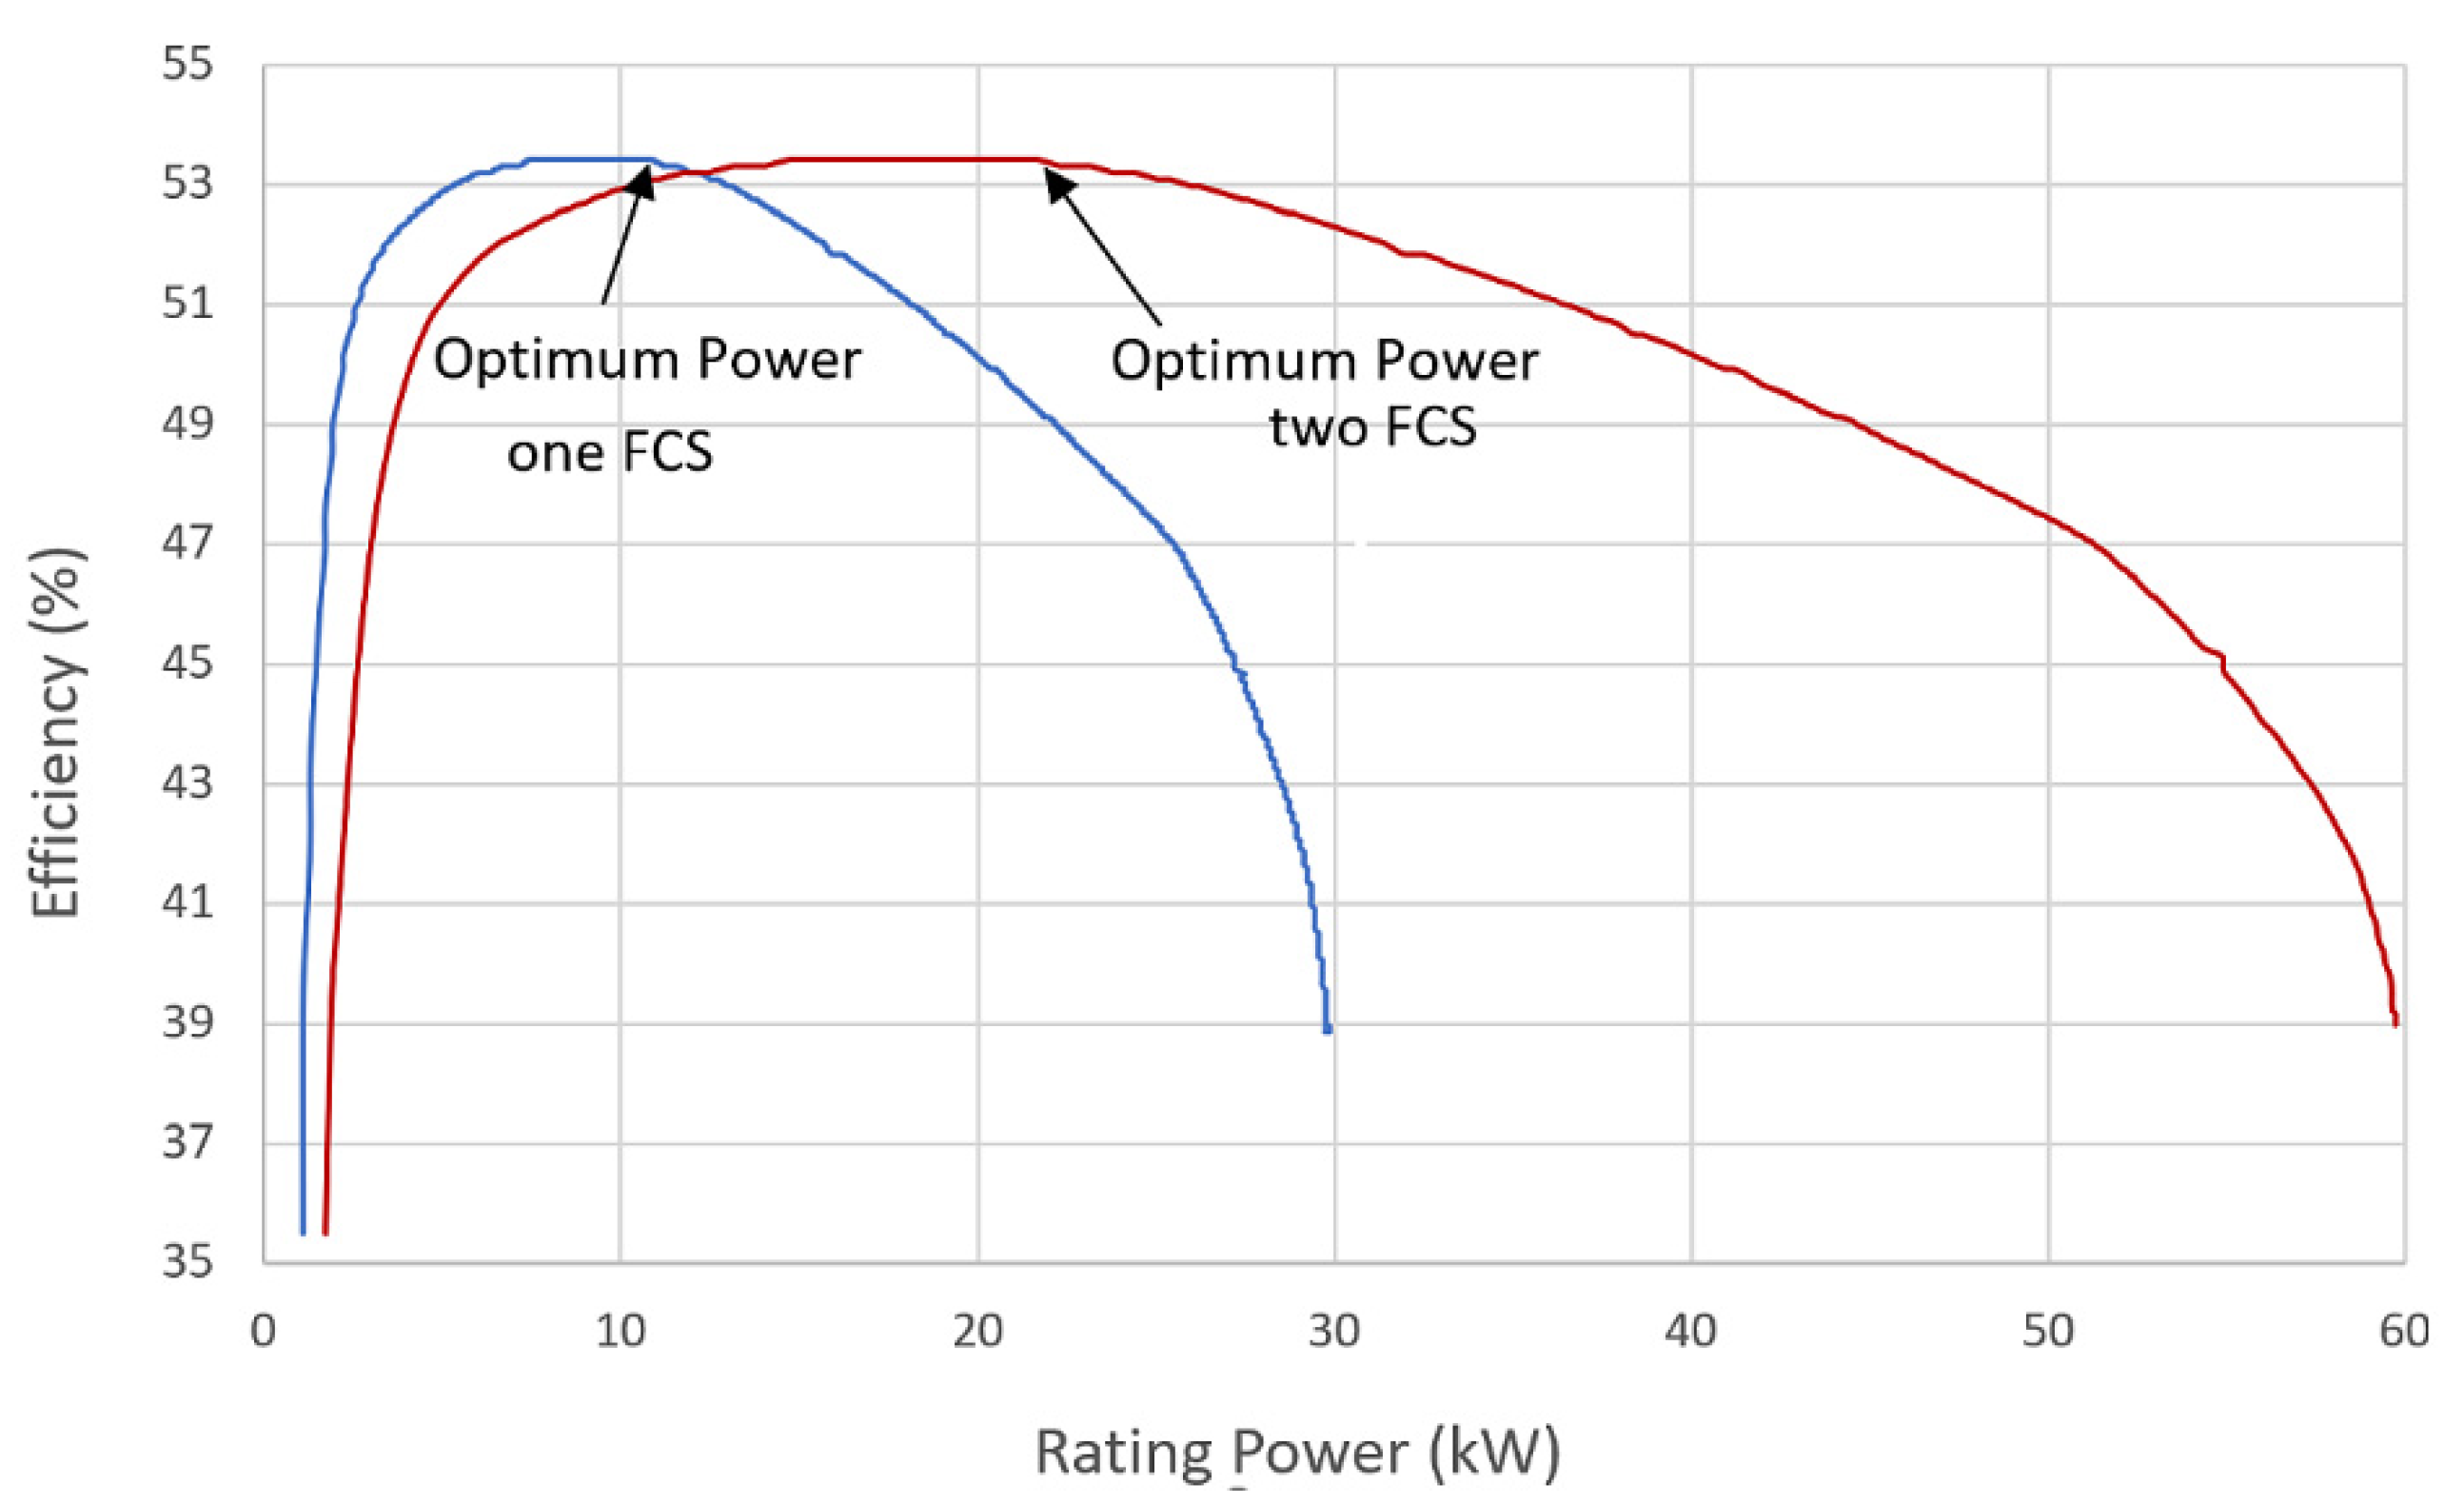
Figure 9 shows the efficiency/power characteristic for a single stack (blue) or both stacks connected in series (red) over the entire power range. This characteristic is essential because it indicates the point where the maximum efficiency is found, which is associated with the minimum hydrogen consumption. As can be seen, the maximum efficiency is located on a plateau and has a value of 53.4%. In the case of using stacks connected in series, we have an optimal power of 21.7 kW, and in the case of using a single stack, the optimal power is 11.4 kW. For both cases, the optimum power was selected as the leftmost point on the maximum efficiency plateau, thus benefiting from maximum efficiency.
The startup time of each fuel cell stack is approximately 20 s, i.e., from “off” to “ready for operation”. This delay comes from starting the auxiliary reactant feed subsystem. The hydrogen consumption for a single stack to produce maximum power is 500 SLPM (45 g), respectively 2000 SLPM (2.57 kg) of air. Two Bronkhorst electronic flow regulators measure the hydrogen flow, using the SLPM measurement unit. The hydrogen is dry and has a purity of over 99.98%. The oxidant used is ambient air compressed by an air compressor and measured by the air flowmeter. The coolant is deionized water. The FCs’ local ECU allows CAN bus communication with the CAN 2.0 A (11-bit) standard.
4. Results and Discussion
Currently, the best solutions available for marketing electric vehicles are divided into two categories: vehicles with large fuel cell systems and very small batteries and vehicles powered exclusively by large batteries. The innovative approach of a modular fuel cell system hybridized with a battery system combines these two categories into a complete system that takes advantage of many synergies. Preliminary studies have shown that an FCHEV could significantly reduce powertrain costs compared to pure fuel cell or pure battery systems, while better meeting all efficiency and driving performance requirements. Type II is the most known hybridization topology for fuel cell vehicles with battery systems [
41].
The FCHEV model was simulated in Simulink, whereby the FCS’s maximum power was 60 kW, and the battery’s maximum power was 90 kW. The characteristics of the vehicle are presented in
Section 2. The vehicle speed was limited to 130 km/h in order to protect the power sources against overload. The two electric motors that actuate the vehicle are mounted in the wheel hubs and can develop a peak power of 2 × 75 kW.
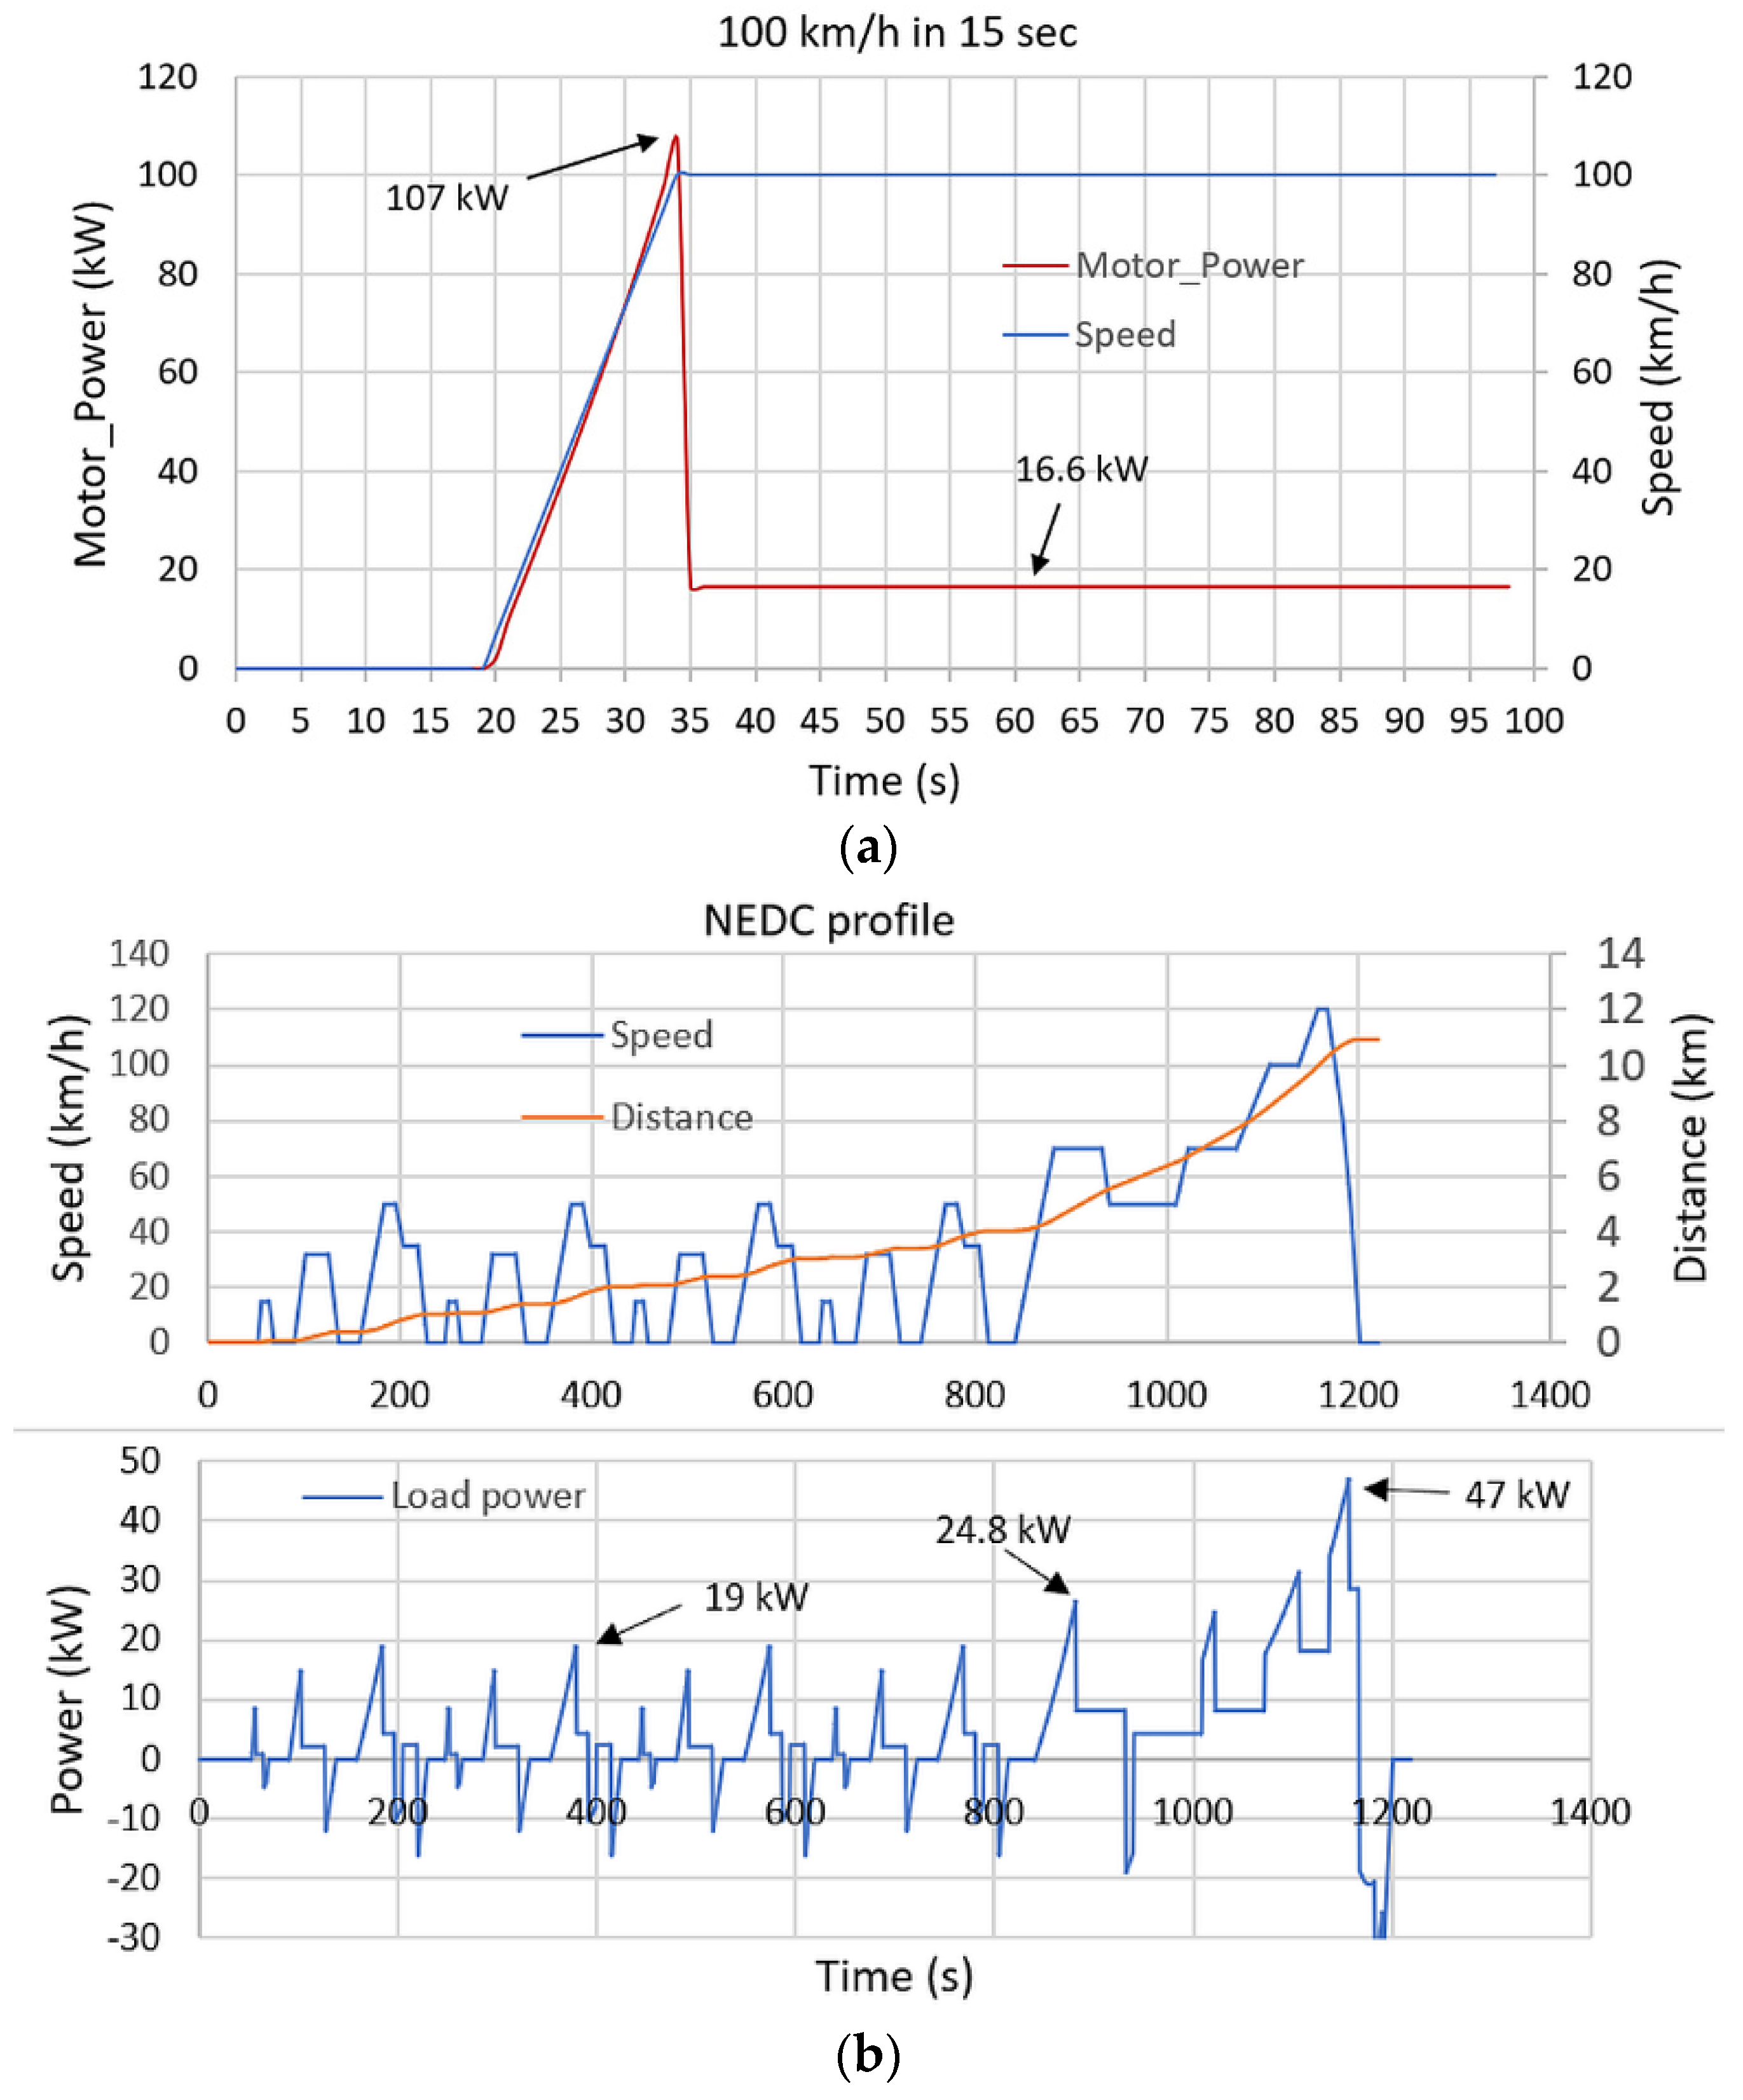
Figure 10a shows the FCHEV model simulation, through which the vehicle reaches a speed of 100 km/h in 15 s. To obtain this speed profile, the electric motors show a consumption of up to 107 kW during acceleration and 16.6 kW cruising at a speed of 100 km/h.
Two driving cycles are analyzed to evaluate vehicle performance: the New European Driving Cycle (NEDC) and the FTP-75 driving cycle. The NEDC cycle consists of four urban driving cycles and an extra-urban portion. The distance traveled is approximately 11 km in 1180 s to reach an average speed of 34 km/h and a maximum speed of 120 km/h.
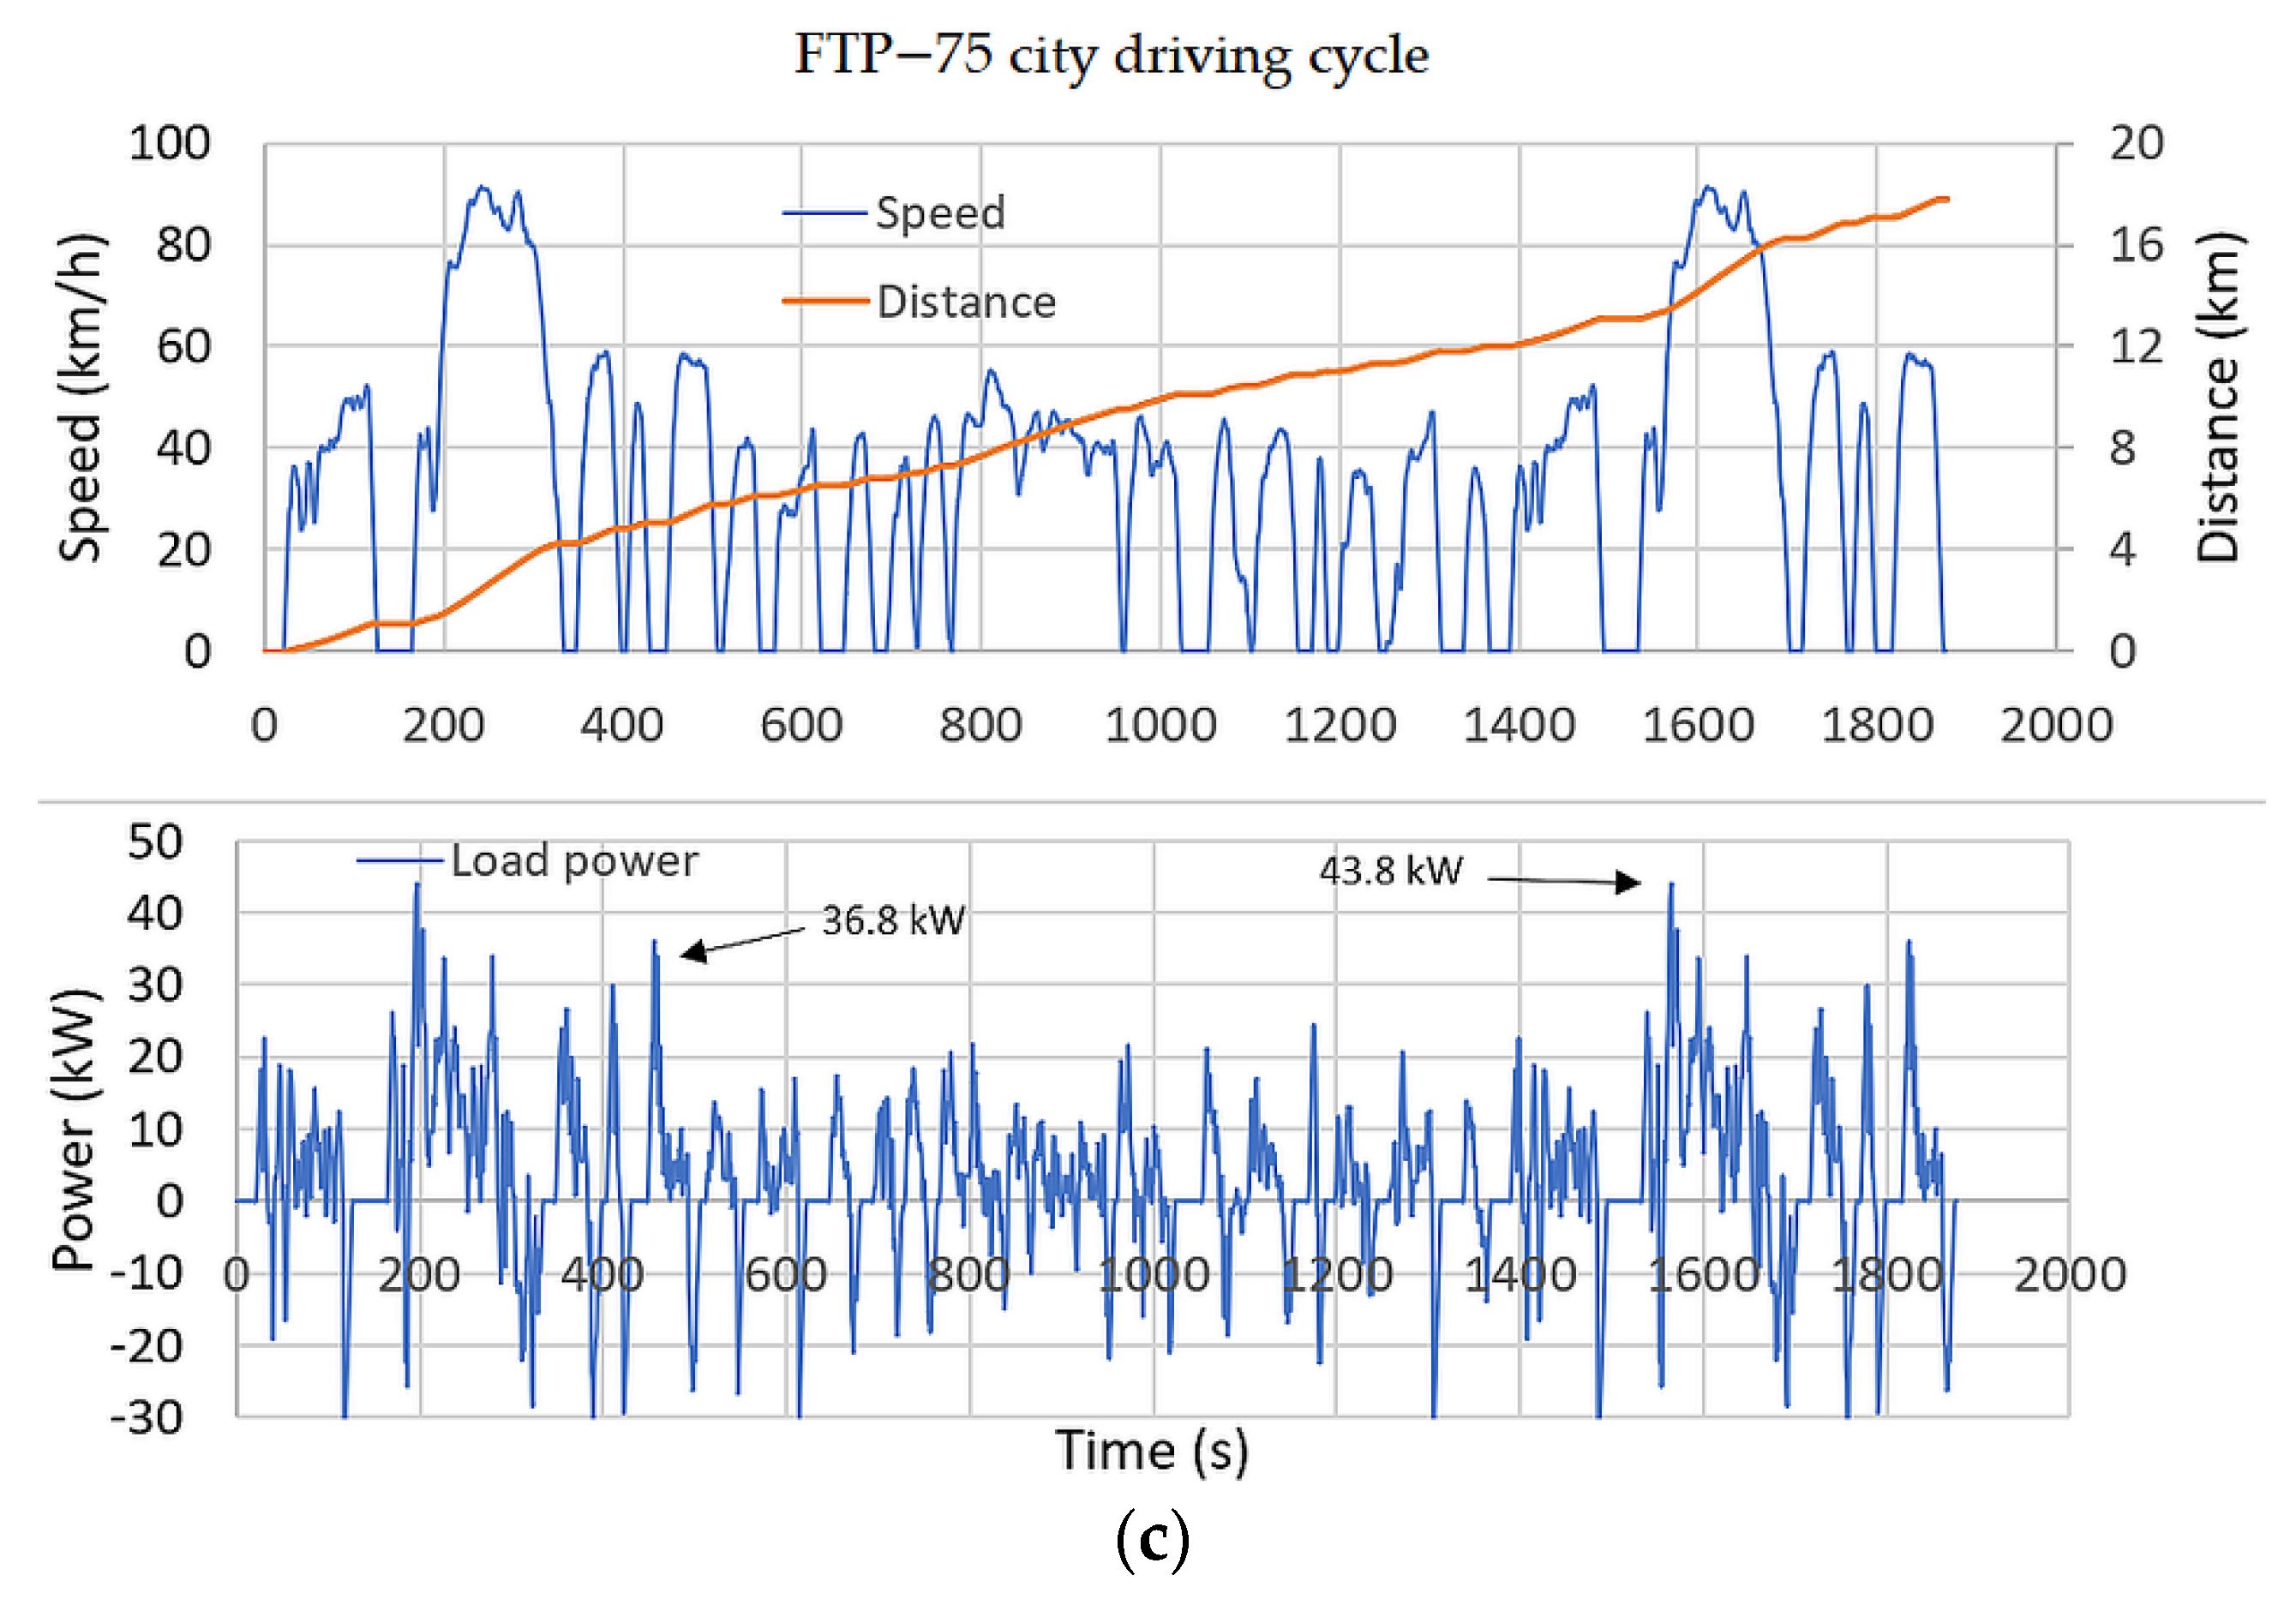
Figure 10b shows the NEDC cycle and the power required by the motors to support the speed profile. The FTP-75 cycle is primarily an urban cycle, with a small section of highway driving. The distance traveled is approximately 17.77 km in 1874 s for an average speed of 34.1 km/h and a maximum speed of 91.25 km/h. The hydrogen consumption, battery state of charge (SoC), and power distribution are the major factors used when comparing the performance of vehicles in these two driving cycles.
Figure 10c shows the FTP-75 cycle and the power required by the motors to support the speed profile.
The objectives of the energy management strategy are (1) for the FCS to operate as much as possible in the optimal area; (2) for the FCS dynamic response to be limited due to the physical constraints regarding the sudden increase and decrease of the energy requirement; (3) for the battery current to be maintained between the charging and discharging limit values; (4) for the voltage on the DC bus to be kept constant in order to increase the motor efficiency; (5) and, most importantly, to ensure efficient power distribution to meet the driving cycle condition and load demand.
Real experimental tests of the FCHEV powertrain were conducted with the off-road vehicle on a lift. The load power was emulated with a programmable electronic load that dissipated the power consumed by the electric motors to respect the vehicle speed for the two driving cycles (
Figure 10a, NEDC; and
Figure 10b, FTP-75).
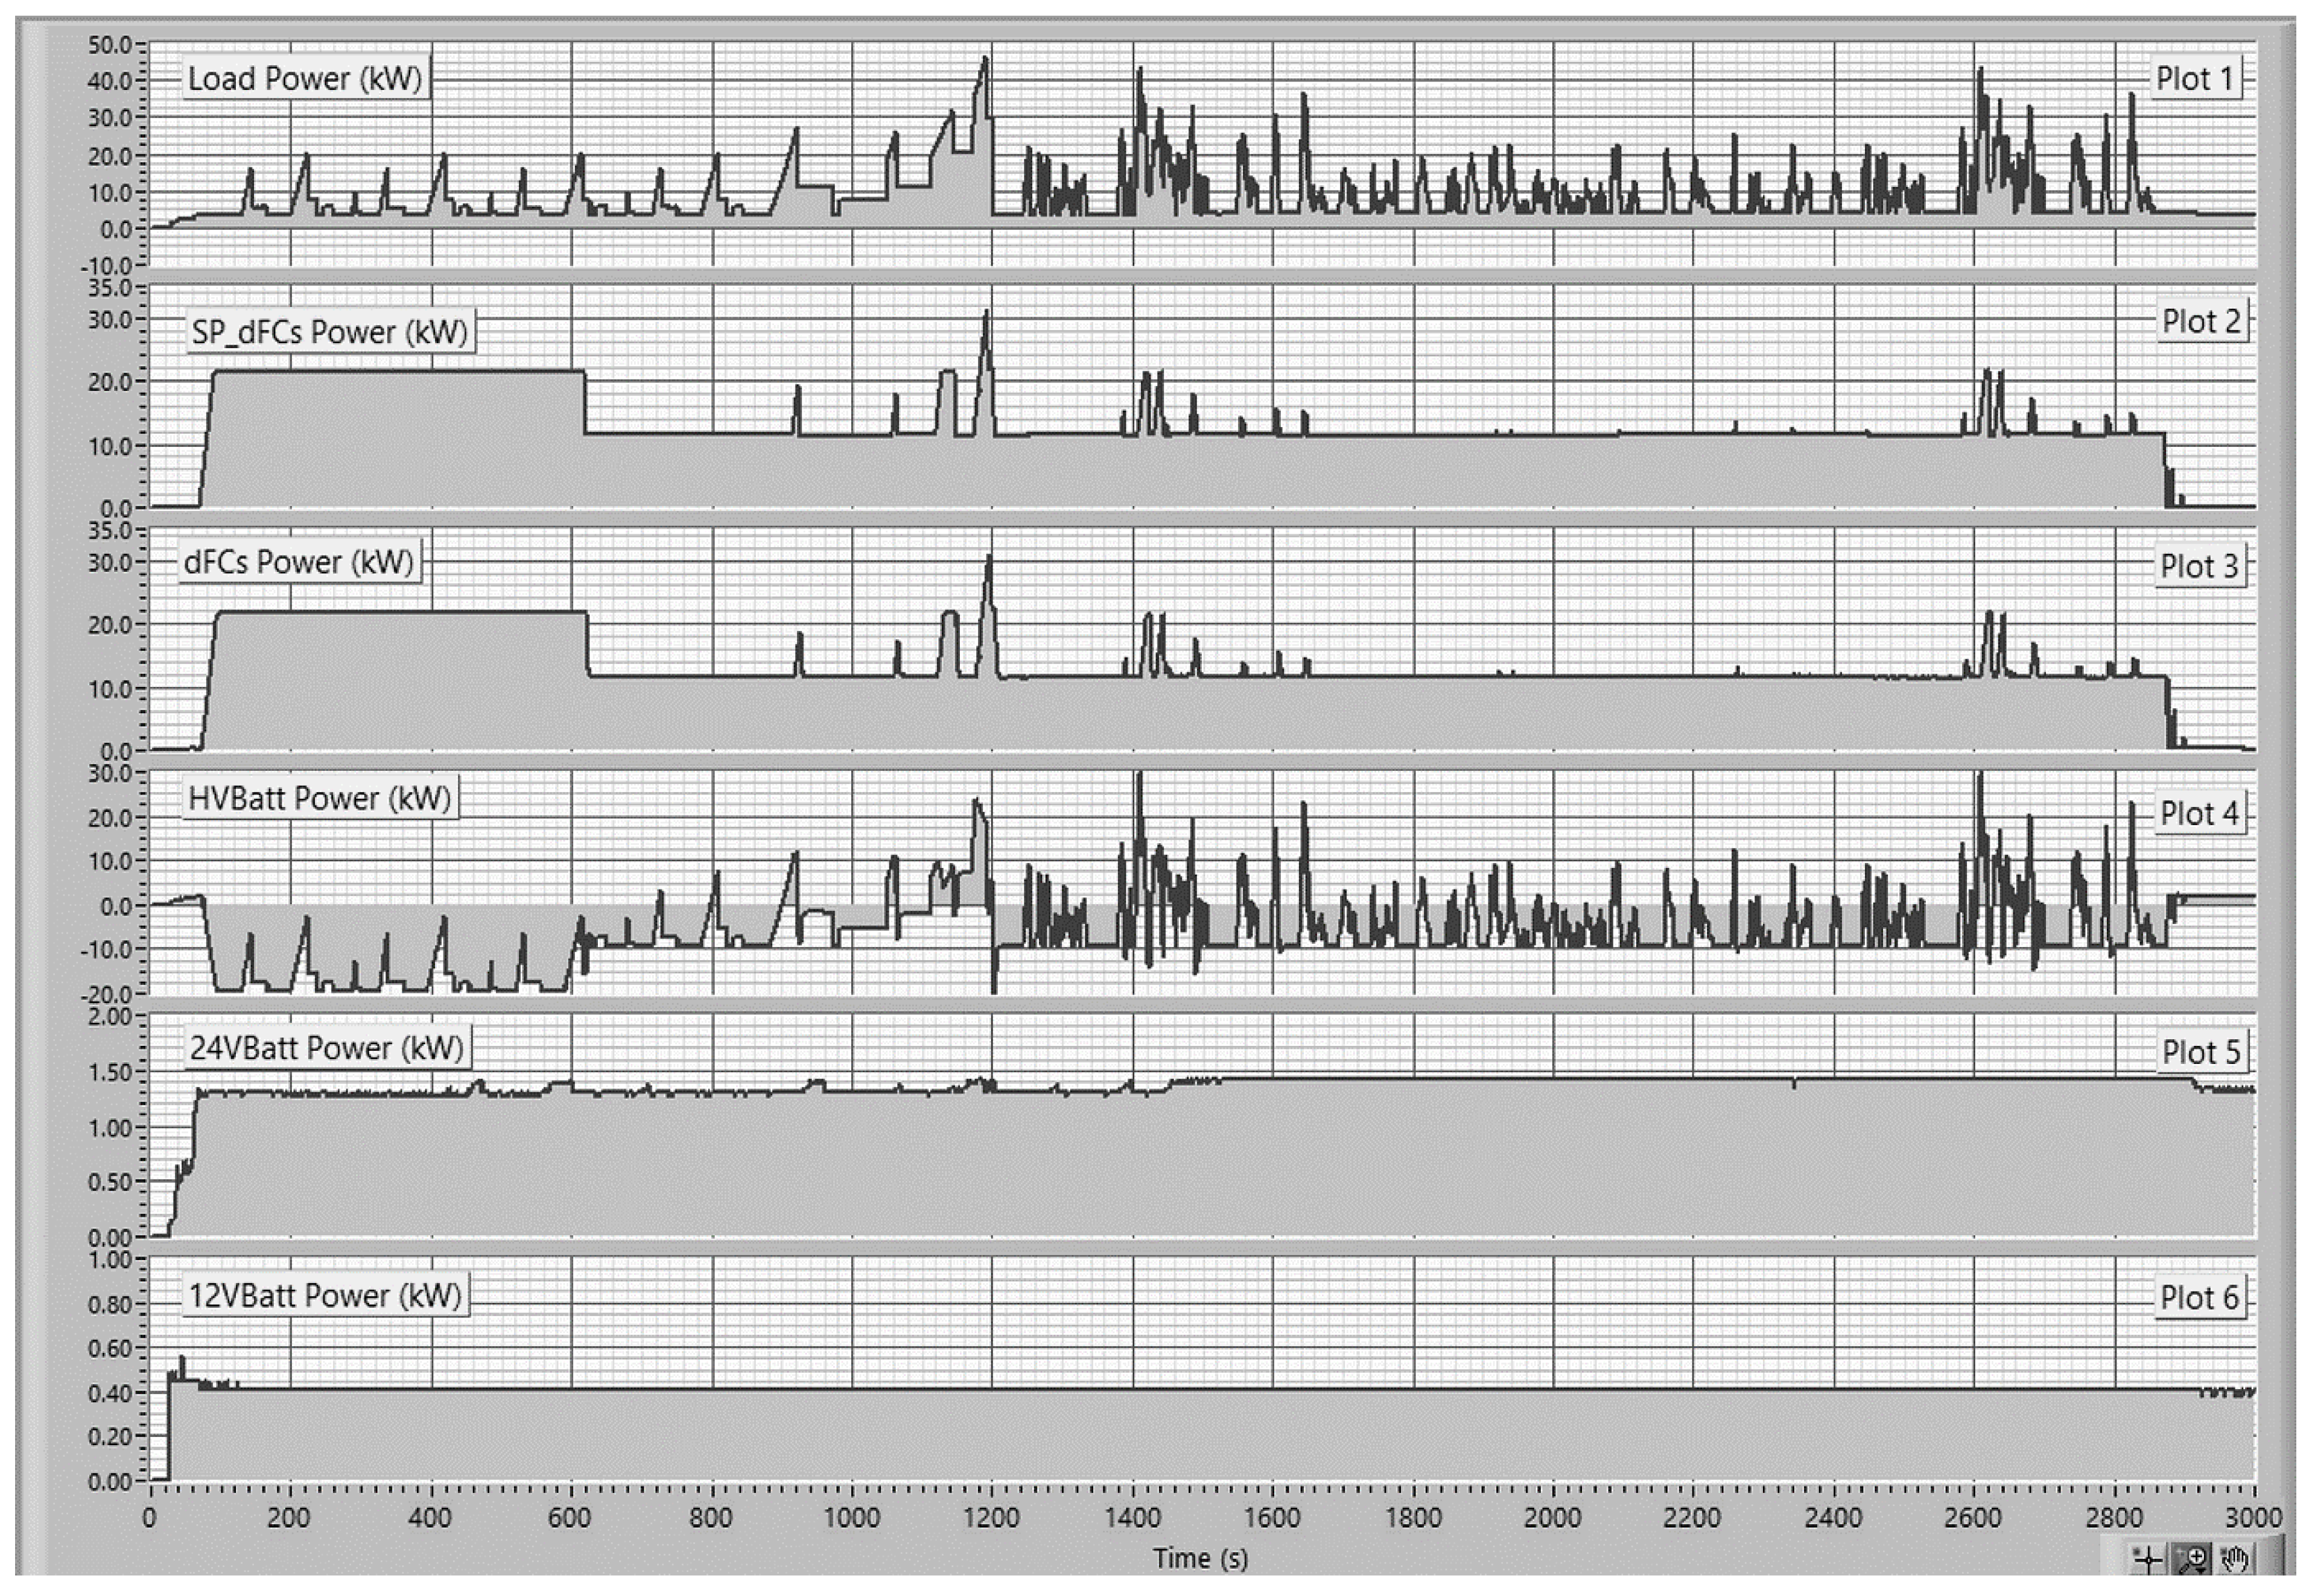
Figure 11 shows the experimental results of the power balance for NEDC and FTP-75 driving cycles.
Figure 11 (Plot 1) shows the waveform of the load power for a realistic driving cycle. The power is ensured by an efficient distribution of the energy produced by the hybrid propulsion train.
Figure 11 (Plot 2) shows the reference value of the power produced by the two fuel cell systems. This value was calculated by using a rule-based control method.
Figure 11 (Plot 3) shows the waveform of the power generated by the two fuel cell systems during the two driving cycles. The waveform in Plot 3 is identical to that in Plot 2, so the control method is accurate.
Figure 11 (Plot 4) shows the power waveform of the battery system. Negative power values are observed when the battery receives excess power, and positive values are seen when the battery supplies the load.
Figure 11 (Plot 5 + Plot 6) shows the power waveforms consumed by the 24 V/12 V loads over the two driving cycles. The power consumed by auxiliary loads helps calculate the efficiency of the entire system.
The powertrain consisting of the two fuel cell systems and the battery system must support the load from Plot 1. The FCSs are connected to the DC bus via a unidirectional converter, and the battery system uses a bidirectional converter. Both converters are programmable by using CAN messages. The efficiency of the power converters is 95%. This power loss was estimated at 3.5 kW, as seen in Plot 1. In the first 25 s, the boot part of the FCHEV in
Figure 4 is initiated. After that, the programmable electronic load is switched on and follows its profile for the two cycles. Next, the method for connecting the fuel cells is executed, as presented in
Figure 6. It checks the battery SoC and decides to implement the initialization procedure. This procedure lasts 25 s until the fuel cells are purged at the anode and cathode to remove the excess water and make the BoP system functional. During this period, until the FCS becomes operational, the power is supplied from the battery system. At 70 s, both FCSs are functional, and then the SMC algorithm in
Table 1 is executed.
The rules implemented in the SMC algorithm are designed so that the FCS operates in the region of maximum efficiency. Initially, the battery SoC value is equal to 49.5%. As long as the load power is lower than the FCS’s optimal power and the battery SoC is below the minimum value of 50%,
State 5 is executed, at which the FCS’s reference value is equal to the FCS’s optimal power of 21.7 kW. Both fuel cell systems are connected in series, as shown in
Figure 3c. The unidirectional DC converter that connects the FCS to the DC bus is controlled in the constant current. The FCS power is divided by the voltage at the converter terminals (in this case, the FCS1 + FCS2 voltages) and gives us the current value that must be supplied by the fuel cells. The FCS is protected from sudden loads by implementing a power control ramp. When switching from one state to another, the FCS’s power is limited, increasing with a power ramp rate of 1 kW/s and decreasing at a power ramp rate of 4 kW/s.
State 5 is visible in
Figure 12 between 70 and 630 s. During this time, the FCS’s power is observed to be greater than the load power. This power difference is directed to the battery system, using a PI regulator (
Figure 5). The FCS operates in
State 5 until the battery state of charge exceeds 55%, and the conditions for the FCS to run in
State 4 are met.
Next, the FCS operates in State 4 if the load power is less than the FCS’s minimum power and the battery’s SoC value is between 55% and 80%. The FCS’s power reference is set to 11.4 kW (Plot 2), and the FCS’s power waveform is shown in Plot 3. When the load power is more significant than 11.4 kW, the SMC algorithm decides that the FCS operates in State 5, as is observable in Plots 2 and 3. When the load power is greater than the optimal power of the FCS (21.7 kW), the SMC algorithm decides that the FCS operates in State 7.
A maximum function calculates the FCS power reference in State 7. If the load power oscillates between 21.7 and 35.7 kW, the maximum function returns the optimal power value of 21.7 kW (observable in Plots 2 and 3, between 1121 and 1146 s). When the load power exceeds the power threshold of 35.7 kW, the maximum function is tracking the load power, from which 14 kW is subtracted as the power provided by the battery system (observable in Plots 2 and 3, between 1176 and 1210 s). This level is the only power range where the FCS does not operate on a constant power level, obviously without the power jumps from one state to another.
Figure 11 (Plot 4) also illustrates that the dynamic responses of the battery system are faster than those of the fuel cell system and, therefore, more suitable for vehicle acceleration/deceleration during the driving cycle.
The power consumption to supply the electrical and electronic components of the powertrain during the two cycles was 1.34 kW for the 24-volt loads (Plot 5) and 0.4 kW for the 12-volt loads (Plot 6). These values are useful in calculating the electrical efficiency of the powertrain.
In
Figure 11, during the two driving cycles, the FCS performed as follows: (1) 21% in State 5 (FCS efficiency = 53.4% and FCS power = 21.7 kW); (2) 77% in State 4 (FCS efficiency = 53% and FCS power = 11.4 kW); and (3) only 2% in State 7 (where FCS followed the load, and the maximum power was 31 kW). So, in conclusion, due to the synergy of the hybrid system, FCS has wholly eliminated the start/stop cycles for running the vehicle at low speeds (suburban). The battery system worked as an energy storage buffer, so the load demand was fully satisfied.
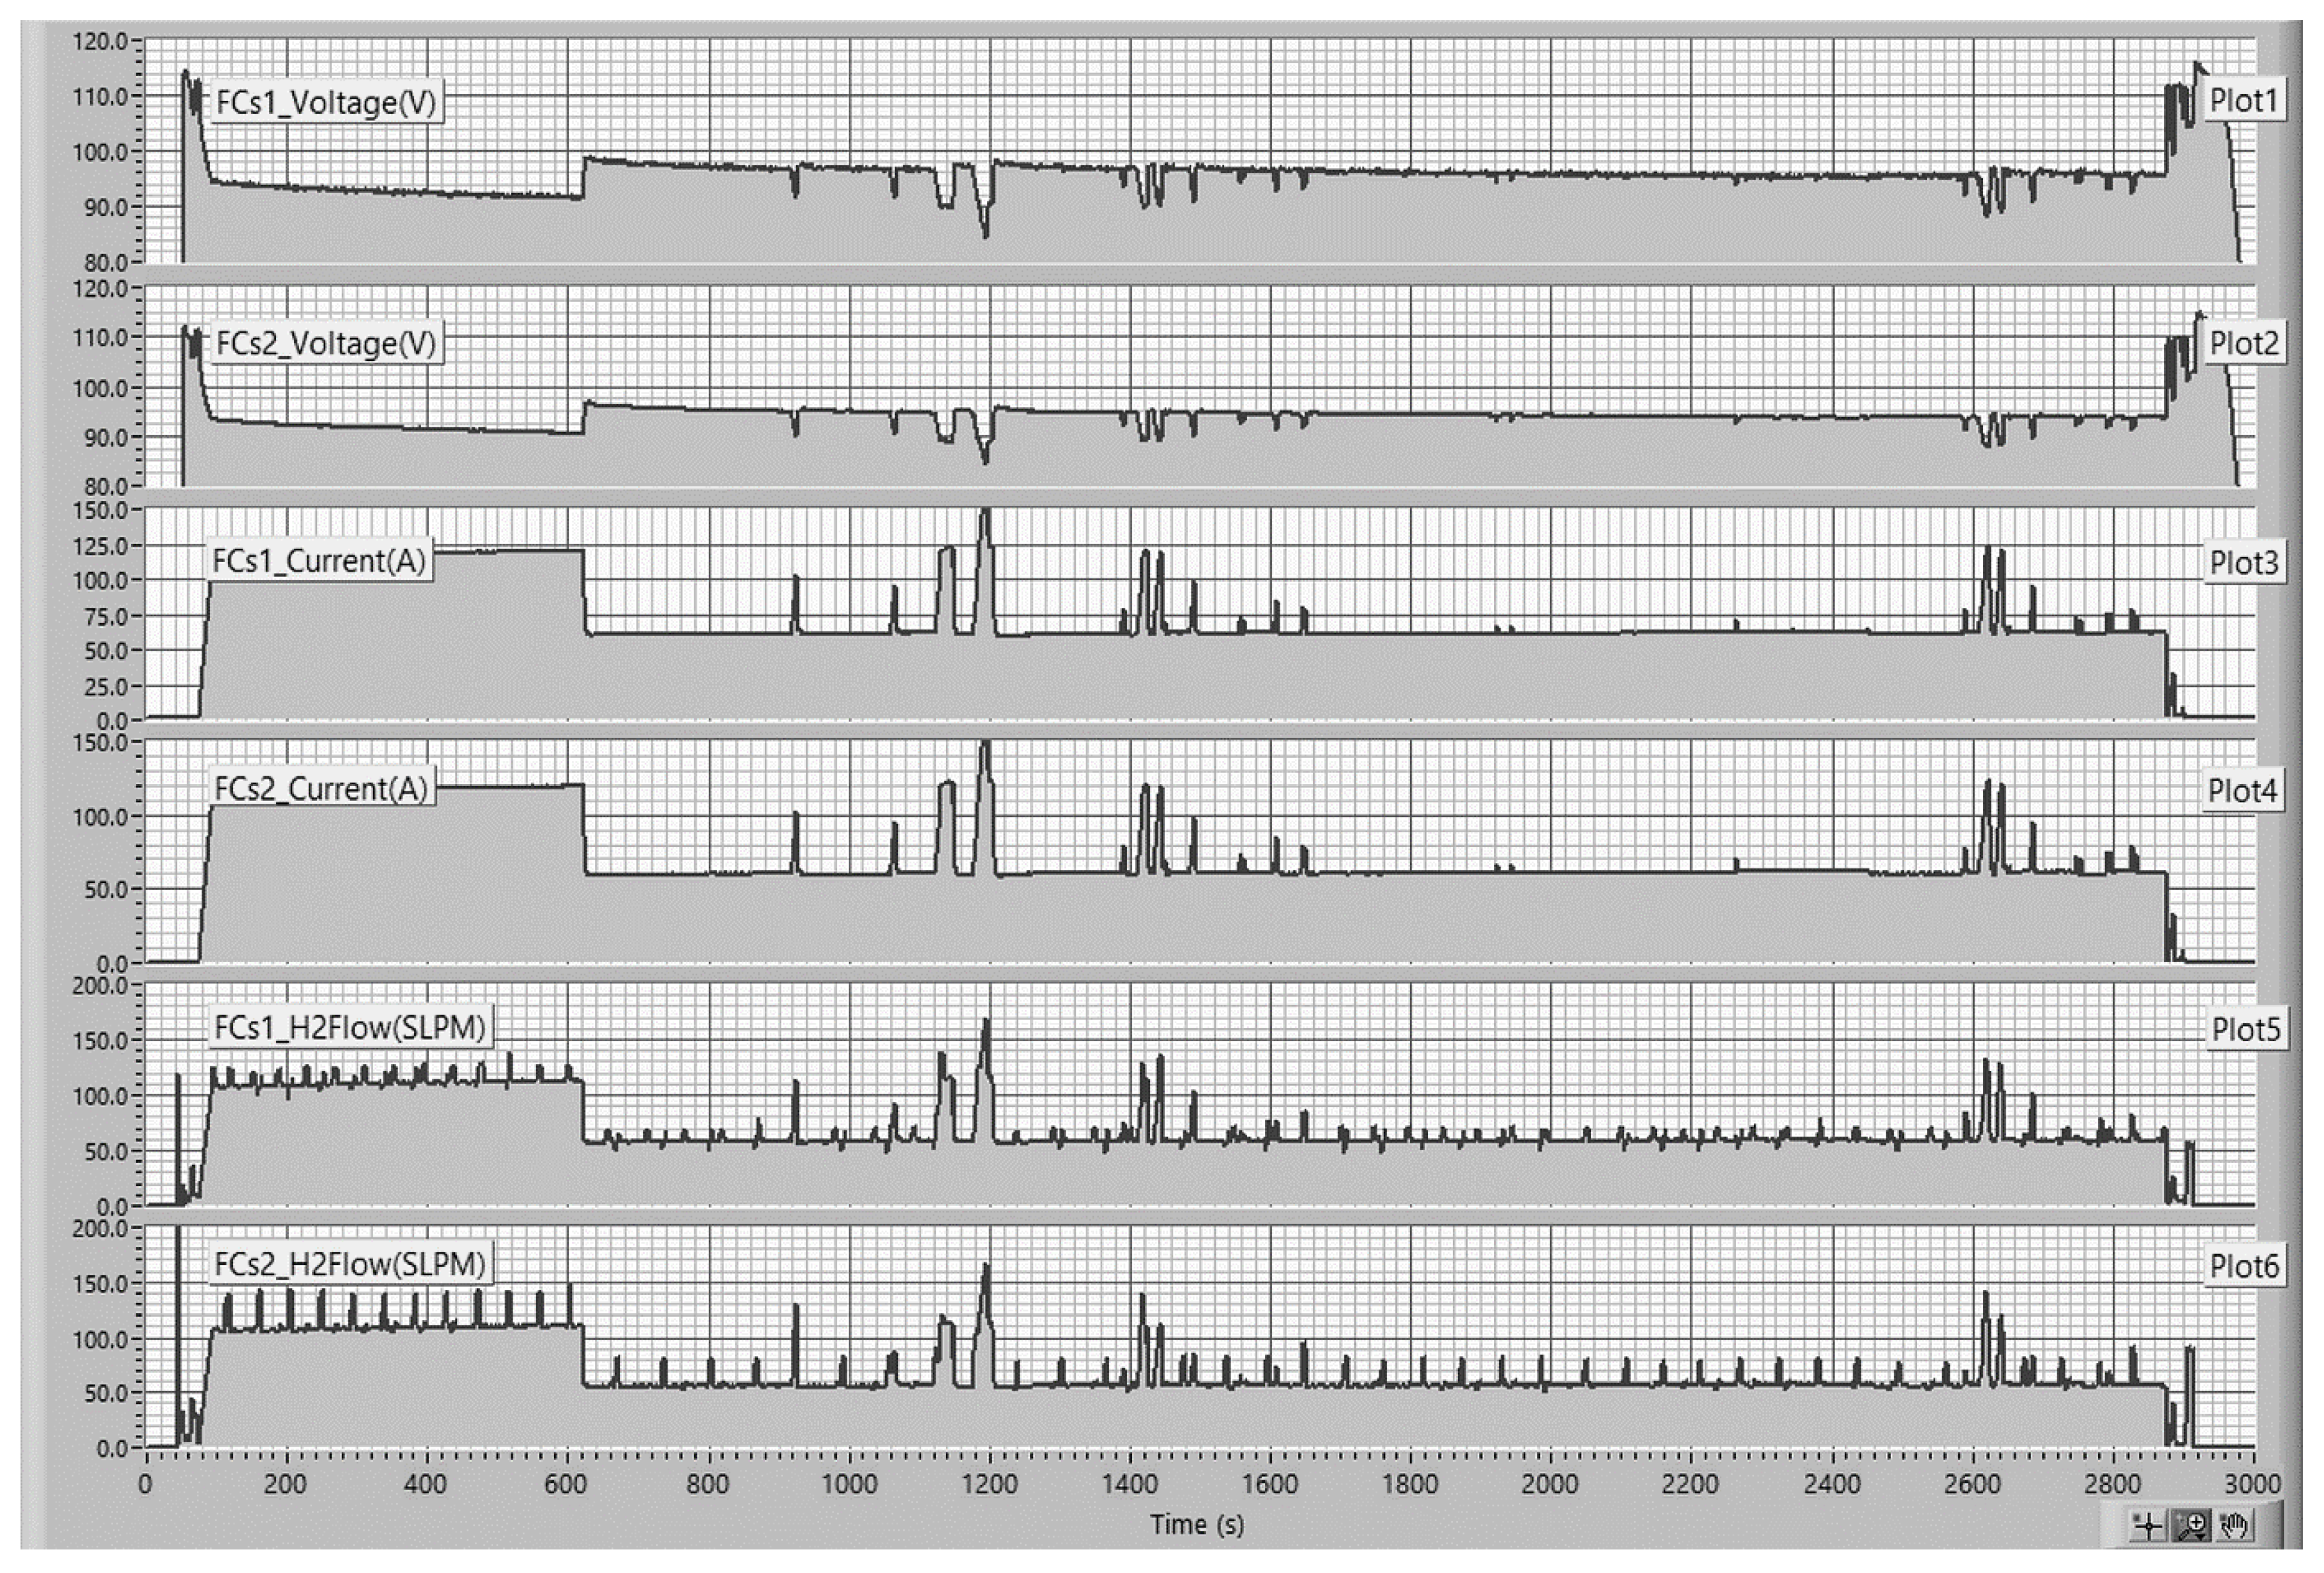
Figure 12 shows the voltage, current, and hydrogen consumption parameters for both fuel cells (FCS1 + FCS2) powering a FCHEV. Due to the slow dynamic response of the fuel cells, it would have been challenging to adapt the FCS to the fast acceleration and deceleration conditions and the frequent start–stop operations while driving the NEDC-FTP-75. However, due to the hybridization with batteries, it is possible for the FCS to operate under safe conditions to provide the necessary power to the engines during large fluctuations and sudden changes.
Figure 12 (Plot 1 + Plot 2) shows the voltage waveforms of the two fuel cell systems for a complex and realistic driving cycle. Voltages are measured at the output terminals of the stack. The voltage fluctuated from 115V (OCV) to 84 V when the maximum power of the two FCS was 30.5 kW.
Figure 12 (Plot 3 + Plot 4) shows the current waveforms of the two fuel cell systems. The currents are measured by hall sensors mounted on the power cable at the positive terminal of the stack. The maximum current during the experiments was 183 A when the vehicle reached the speed of 130 km/h, and the minimum current was 60 A when the FCS operated at the minimum set power. The minimum current with which the FCS worked was higher than the minimum current (50 A) provided by the manufacturer.
Figure 12 (Plots 5 and 6) shows the hydrogen consumption waveform of the two fuel cell systems during the two driving cycles. Hydrogen consumption is measured by two electronic flow regulators mounted at the anodic inlet of each stack. The maximum flow rate of the regulator is 500 SLPM.
Both stacks are fed with hydrogen in dead-end mode. Hydrogen control is performed by operating a solenoid that opens at a specific frequency for purging. The hydrogen from the anodic compartment is eliminated, since it is contaminated by the water vapor produced from the reaction and the nitrogen that penetrates the membrane from the cathodic compartment. There is a difference in the hydrogen consumption waveforms; this comes from the geometric construction of the output lines and the opening frequency of the solenoid. The purge duration for both stacks is 5 s, but the opening frequency differs for FCS1, i.e., 100 Hz/h (36 s), and for FCS2, it is 80 Hz/h (45 s). In the FCS startup and stop-off procedure, hydrogen is refreshed in the anode compartment; this can be seen in Plots 5 and 6. In this way, it is ensured that the water is eliminated. The fuel cell can start even at negative temperatures, i.e., down to −10 °C.
The total lack of hydrogen and oxygen must be completely avoided since it can cause severe and permanent damage to the electrocatalyst of the fuel cell. To solve this problem, the power generated by the FCS is limited by a power slope that makes the FCS increase the power, respecting the rate of 1 kW/s, and decrease the power by 4 kW/s. In Plot 3 and Plot 4, the influence of the control in the power ramp can be seen. However, the best answer, which attests that the FCS was operated under the best conditions, is the fuel cell voltage, which is presented in Plots 1 and 2. Here, it can be seen that the phenomenon of starvation is completely absent.
It is known that the frequent start/stop operations of fuel cells while driving drastically affect the fuel cell’s durability. During the two cycles shown in
Figure 10b,c, 13 vehicle start–stop cycles were observed for the NEDC driving cycle, and 23 start/stop cycles were observed for the FTP-75 driving cycle, respectively. However, thanks to the hybridization of the FCS with batteries and the rule-based algorithm, it can be seen the FCS worked continuously during the two cycles. There was only one FCS start at the beginning and one FCS stop at the end of the driving cycle.
The voltage waveform of the two FCSs is closely related to the current waveform supplied by the two FCS during the two cycles. That is, a decrease in voltage leads to an increase in current and vice versa. After hydrogen purging, as seen on the graph at second 45, the fuel cell generates a voltage of over 110 volts (second 53). Next, the cathode is purged with air, which is observed as a voltage drop in 55–65 s. It is mentioned that the air compressor that supplies the air for the reaction is provided with electricity directly from the energy produced by the stack. The initialization procedure of the two FCSs is completed in the 75th second according to the startup control method presented in
Figure 6. The FCS boot initialization procedure (start FCS) took about 30 s. However, it should be noted that the load started working faster at the 30th second, and the battery system fully powered the load. The safe stopping procedure (stop FCS) of the two fuel cells is opposite to the starting procedure, as seen in
Figure 11, starting with 2880 s. However, due to the remaining hydrogen in the stack, the fuel cell continues to produce a decreasing floating voltage.
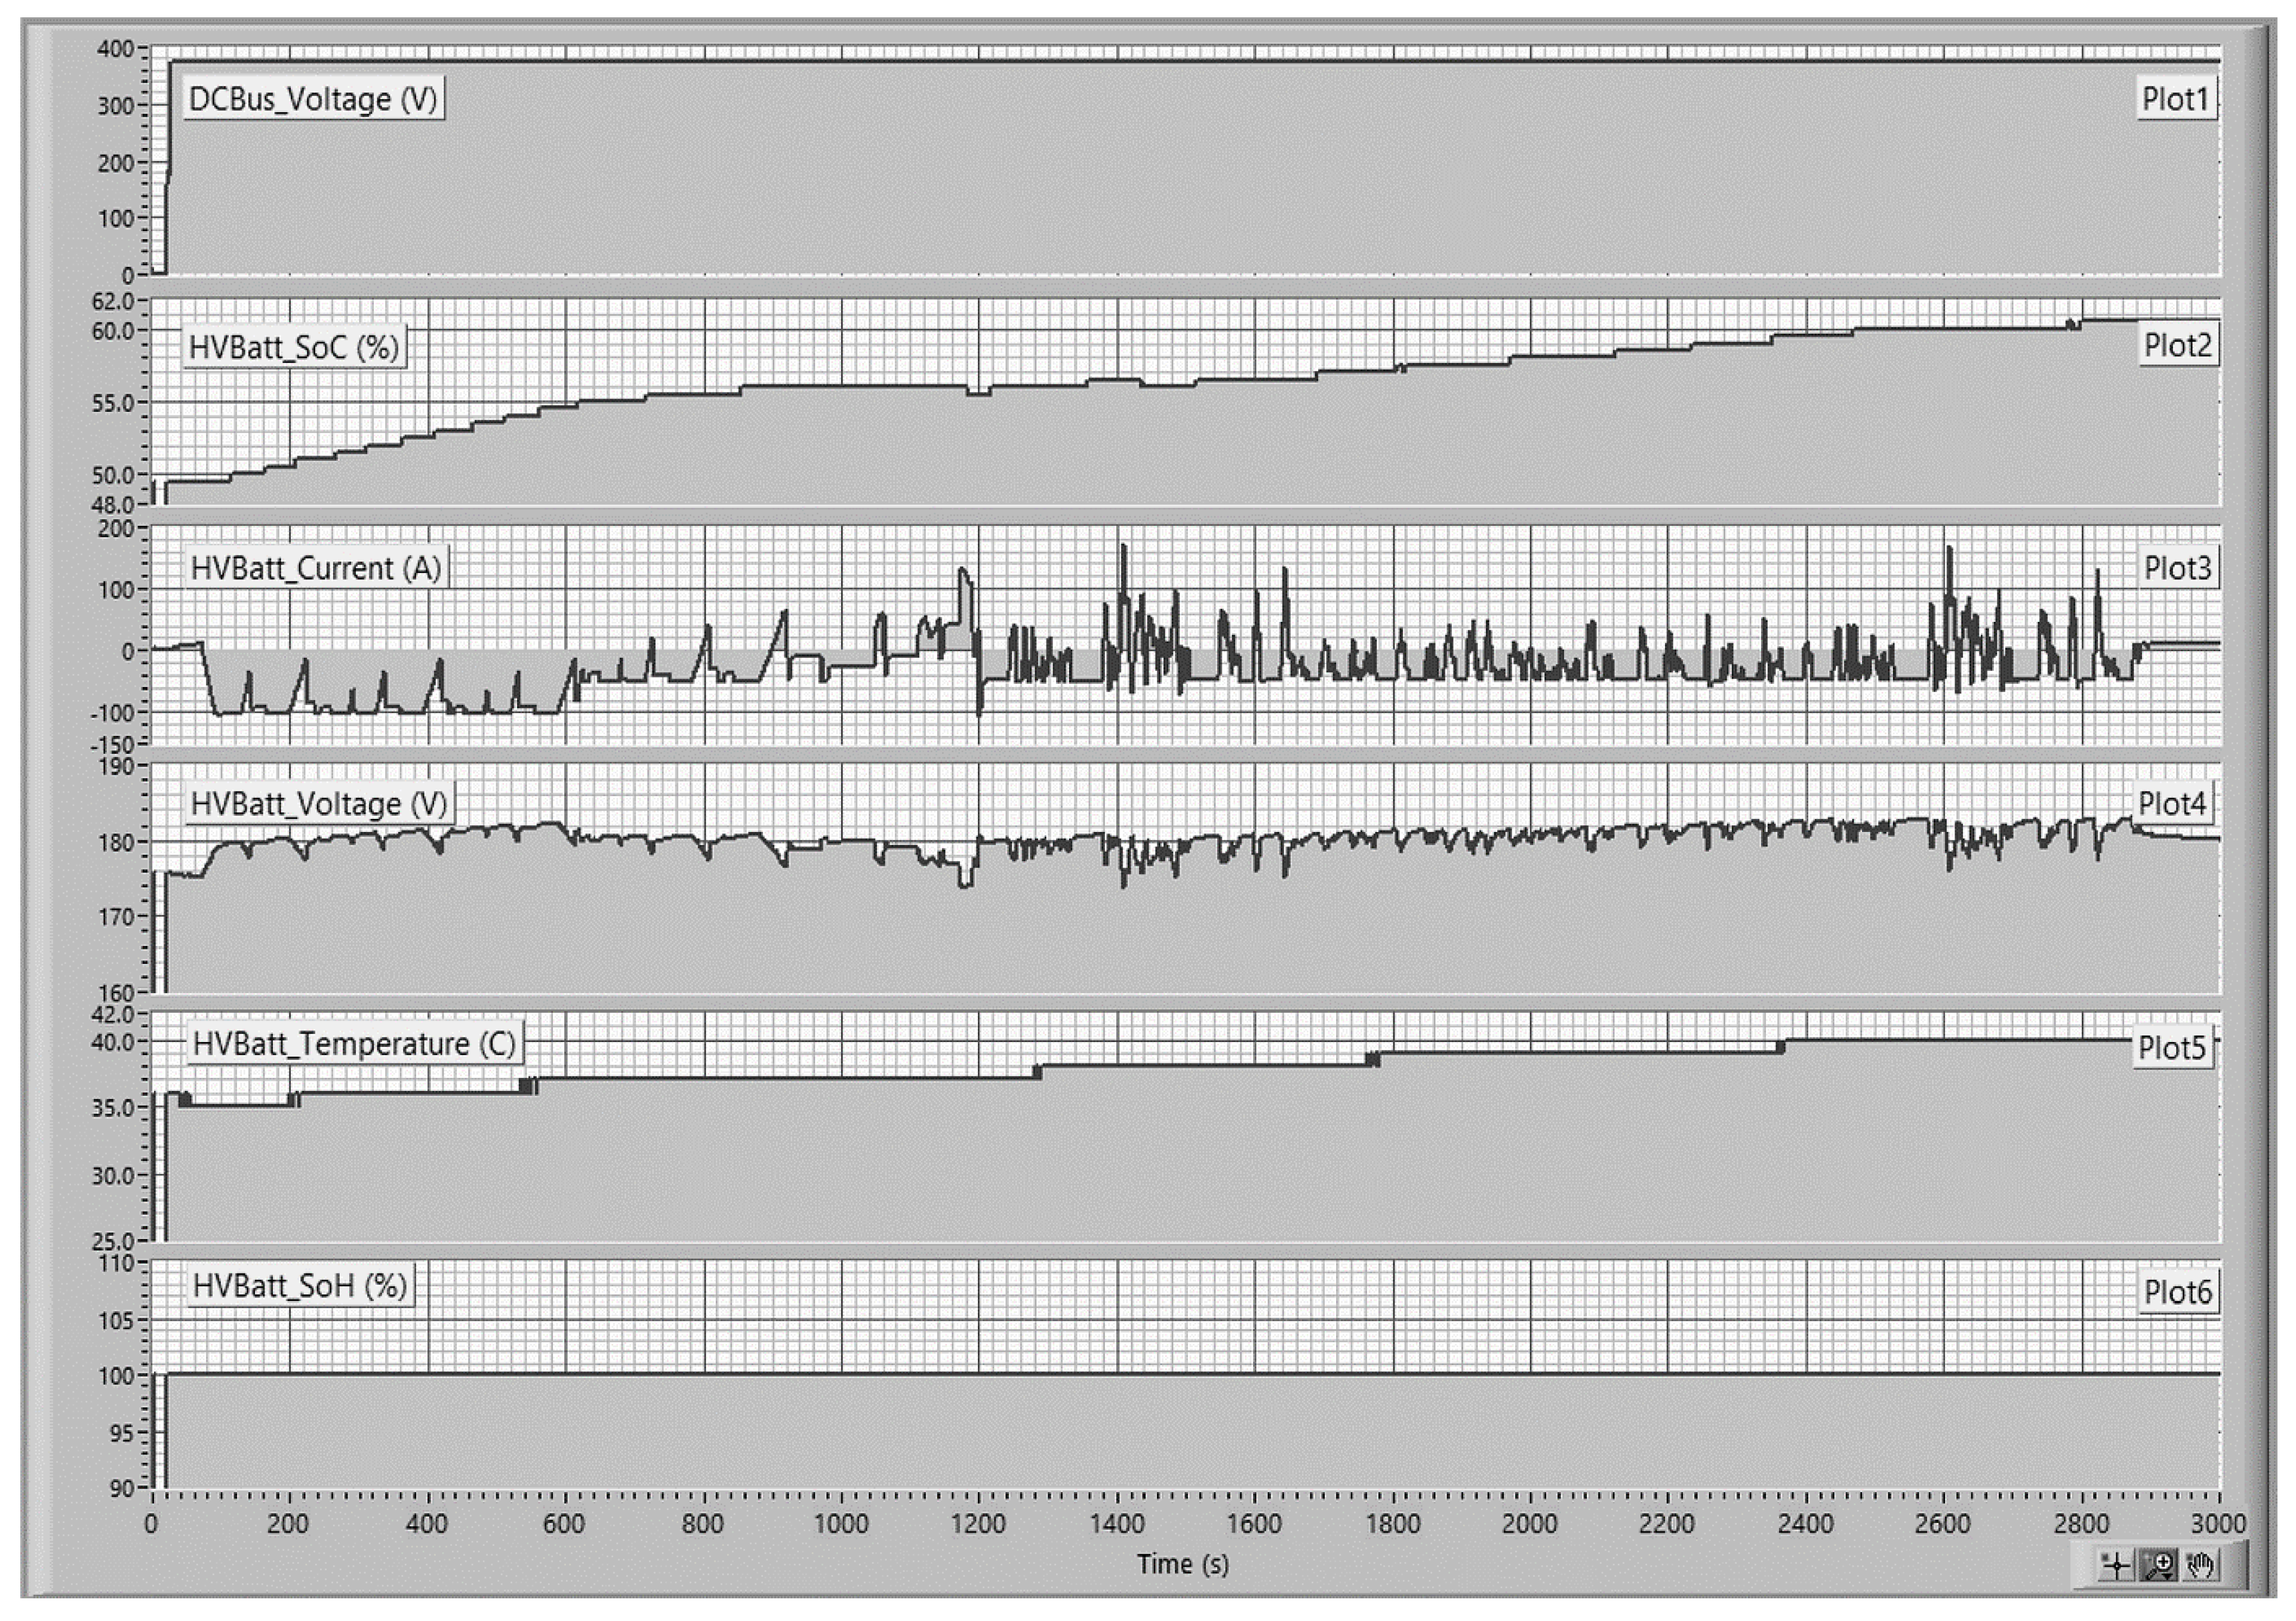
Figure 13 (Plot 1) shows the DC bus voltage waveform.
Figure 13 (Plot 2) shows the SoC HV battery waveform.
Figure 13 (Plot 3) shows the current waveform supplied by the battery system.
Figure 13 (Plot 4) shows the voltage waveform at the battery system’s terminals.
Figure 13 (Plot 5) shows the battery system’s temperature waveform.
Figure 13 (Plot 6) shows the battery system’s state of health (SoH) waveform. All waveforms are visualized throughout the NEDC and FTP-75 drive cycles.
A bidirectional DC converter integrates the battery system into the powertrain system. This converter controls the battery system’s charging and discharging according to the DC bus’s voltage. The battery provides power when the fuel cell cannot supply the power load demand. The battery stores energy when the fuel cell produces more power than the electric motor consumes. The bidirectional converter is controlled by a PI regulator shown in
Figure 5. In
Figure 13 (Plot 1), the PI regulator worked flawlessly, providing a constant voltage of 375 V.
The vehicle startup sequence shown in
Figure 4 is visible by monitoring the voltage on the DC bus and the 12 V/24 V loads. Once the key is turned in the ignition (time = 20 s), the electrical and electronic components of the vehicle are powered. In
Figure 11 (Plot 5 + Plot 6), a consumption of approximately 500 W for 12 V consumers and 600 W for 24 V consumers can be observed. Similarly,
Figure 13 (Plot1) shows a time of 2 s (20–22 s) in which the battery system is connected to the DC bus (battery voltage = 176 V). Starting from second 25, the vehicle is powered only by the battery system, and from second 75, the vehicle is entirely FC/Batt hybrid powered. In other words, the vehicle starts electrically from the battery system in 5 s after the ignition is switched on. After 45 s, the vehicle is fully hybrid-powered. A reasonably short time to start a fuel-cell hybrid electric vehicle.
Once the fuel cell system becomes fully operational (second 75), controlled by the SMC algorithm, it provides more power than the load power at the beginning. The battery system is used to store this surplus power. This is seen in
Figure 13 (Plot 3), where the negative current means that the battery system is receiving power from the fuel cell system. During the sudden acceleration phases of the vehicle, the battery system provides the difference in energy required by the load demand. This can be seen in Plot 3, where the current comes out of the battery and has a positive meaning. The maximum discharge current of the battery system for the NEDC-FTP-75 driving cycle was 169 A, and the maximum charge current was 104 A. In Plot 4, the battery system responds correctly to all sudden and rapid transitions of the engine load. The minimum battery voltage was 174 V, and the maximum voltage was 183 V. Thus, the battery system was protected throughout the driving cycle, both at unfriendly voltages and supra currents.
At the beginning of the experimental tests, the battery state of charge was 49.5%, and at the final stage, it was 60.5%. The initial state of SoC was chosen to observe the conditions in which the fuel cell system operated at maximum efficiency and to check the hysteresis zone. Thus, it can be seen that the battery system’s capacity increased by 10% over the vehicle’s entire driving cycle. It was converted following the power balance to an average value of power stored by the batteries of 3.39 kW. Thus, the energy produced by the FCS fully supported the motor load and charged the batteries.
Because at the end of the two driving cycles, the SoC value of the battery did not reach 80%, the threshold at which the SMC algorithm would have switched to operation by using a single fuel cell system could not be observed. These experimental tests are to be performed in the future.
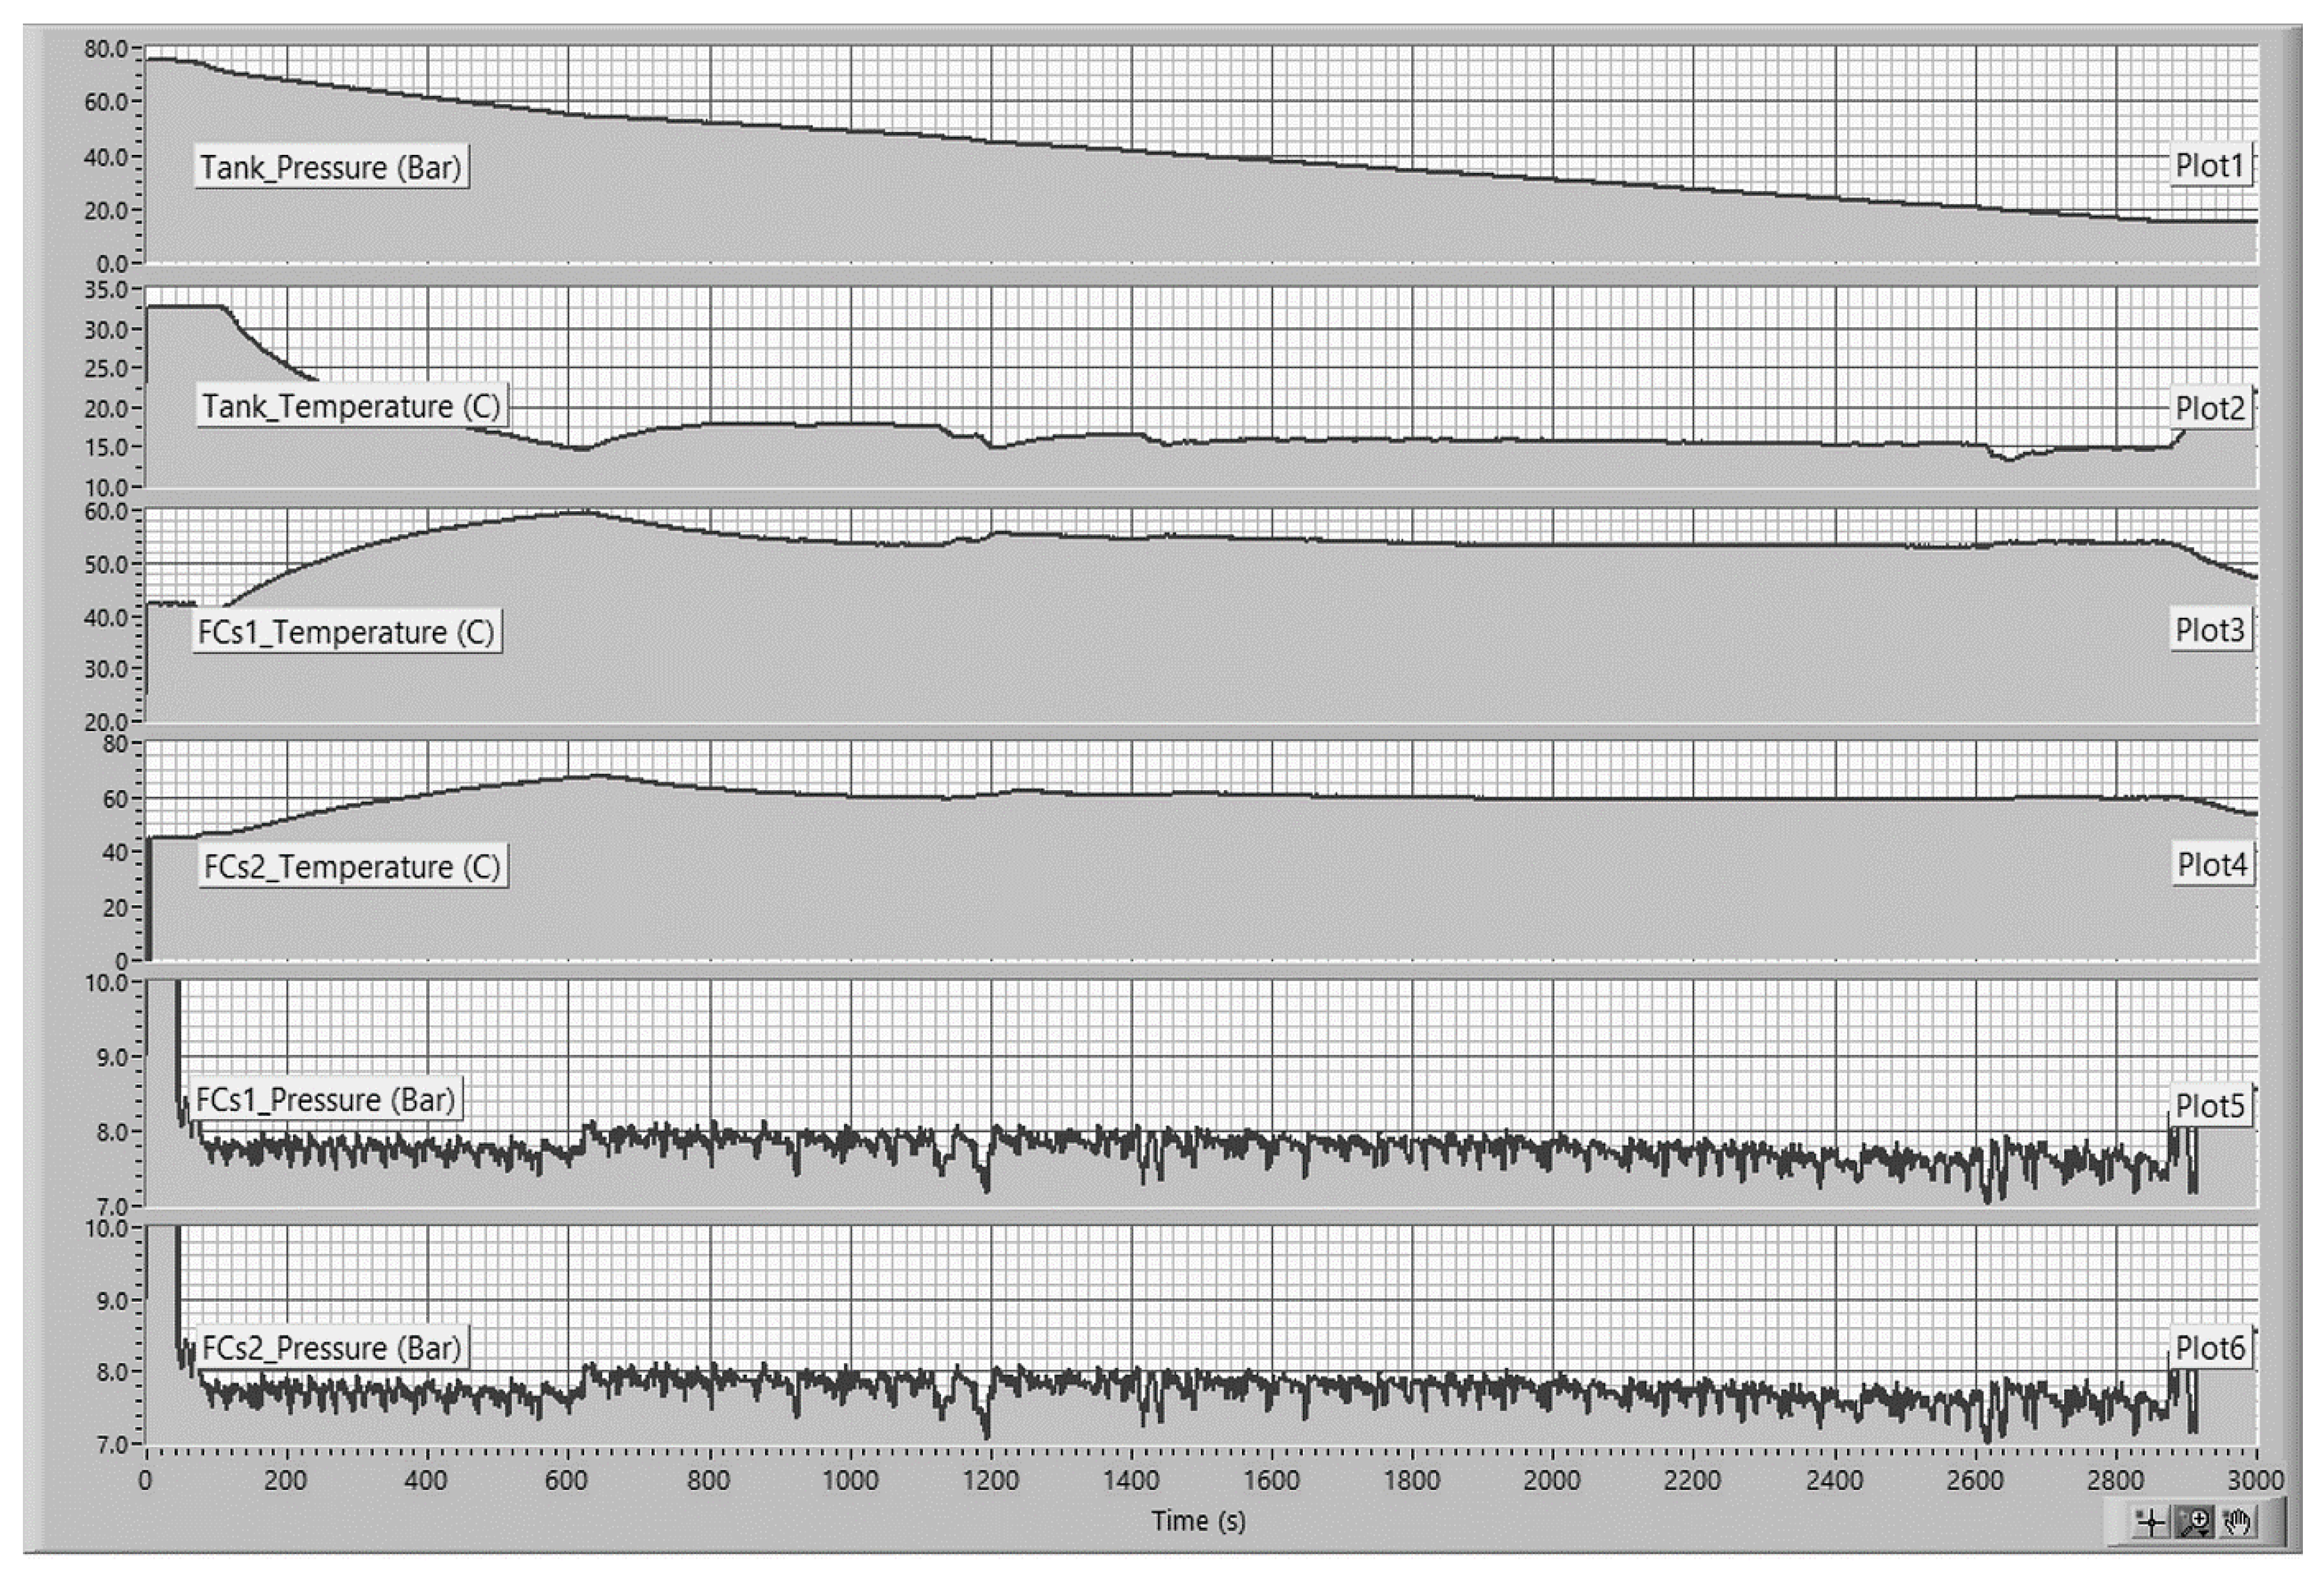
Figure 14 (Plot 1) shows the hydrogen tank’s pressure waveform.
Figure 14 (Plot 2) shows the hydrogen tank’s temperature waveform.
Figure 14 (Plot 3) shows the temperature waveform of the first fuel cell system, FCS1.
Figure 14 (Plot 4) shows the temperature waveform of the second fuel cell system, FCS2.
Figure 14 (Plot 5) shows the hydrogen feed pressure waveform of the first fuel cell system, FCS1.
Figure 14 (Plot 6) shows the hydrogen feed pressure waveform of the second fuel cell system, FCS2. All waveforms are visualized throughout the NEDC+FTP-75 drive cycle.
The pressure of the hydrogen tank at the beginning of the experimental tests was 75 bars, and during the two driving cycles, the fuel cell consumed hydrogen from the tank up to a pressure of 15 bars. The hydrogen tank is designed to work up to 700 bars at high pressures. When the hydrogen pressure in the tank reaches below 15 bar, the fuel cell system receives the safe shutdown command (empty tank).
The hydrogen tank temperature is measured by using NTC sensors. The initial temperature was 32.5 °C, and at the end, it reached almost 15 °C. This hydrogen cooling is due to the hydrogen gas’s expansion. The optimal temperature range of the hydrogen tank is in the field of −40 °C to +80 °C.
The pressure and temperature of the hydrogen tank are also useful for calculating the volume of hydrogen consumed by the fuel cell.
Both fuel cell systems are cooled with deionized water. The operating temperature of the fuel cells is around 60–65 °C. In Plot 3, we can see the operating temperature of FCS1, which varied between 40 and 60 °C. In Plot 4, we can see the operating temperature of FCS2, which varied from 40 to 65 °C. A higher temperature was seen on the FCS2 due to incomplete purging of the air from the cooling system. This problem was solved by introducing an automatic air vent valve in the upper part of the system.
The fuel cells are supplied with hydrogen at the anode side at a pressure of 7–8 bar. A pressure regulator is installed at the outlet of the hydrogen tank to control this pressure. In Plot 5 and Plot 6, this hydrogen supply pressure is correctly maintained.
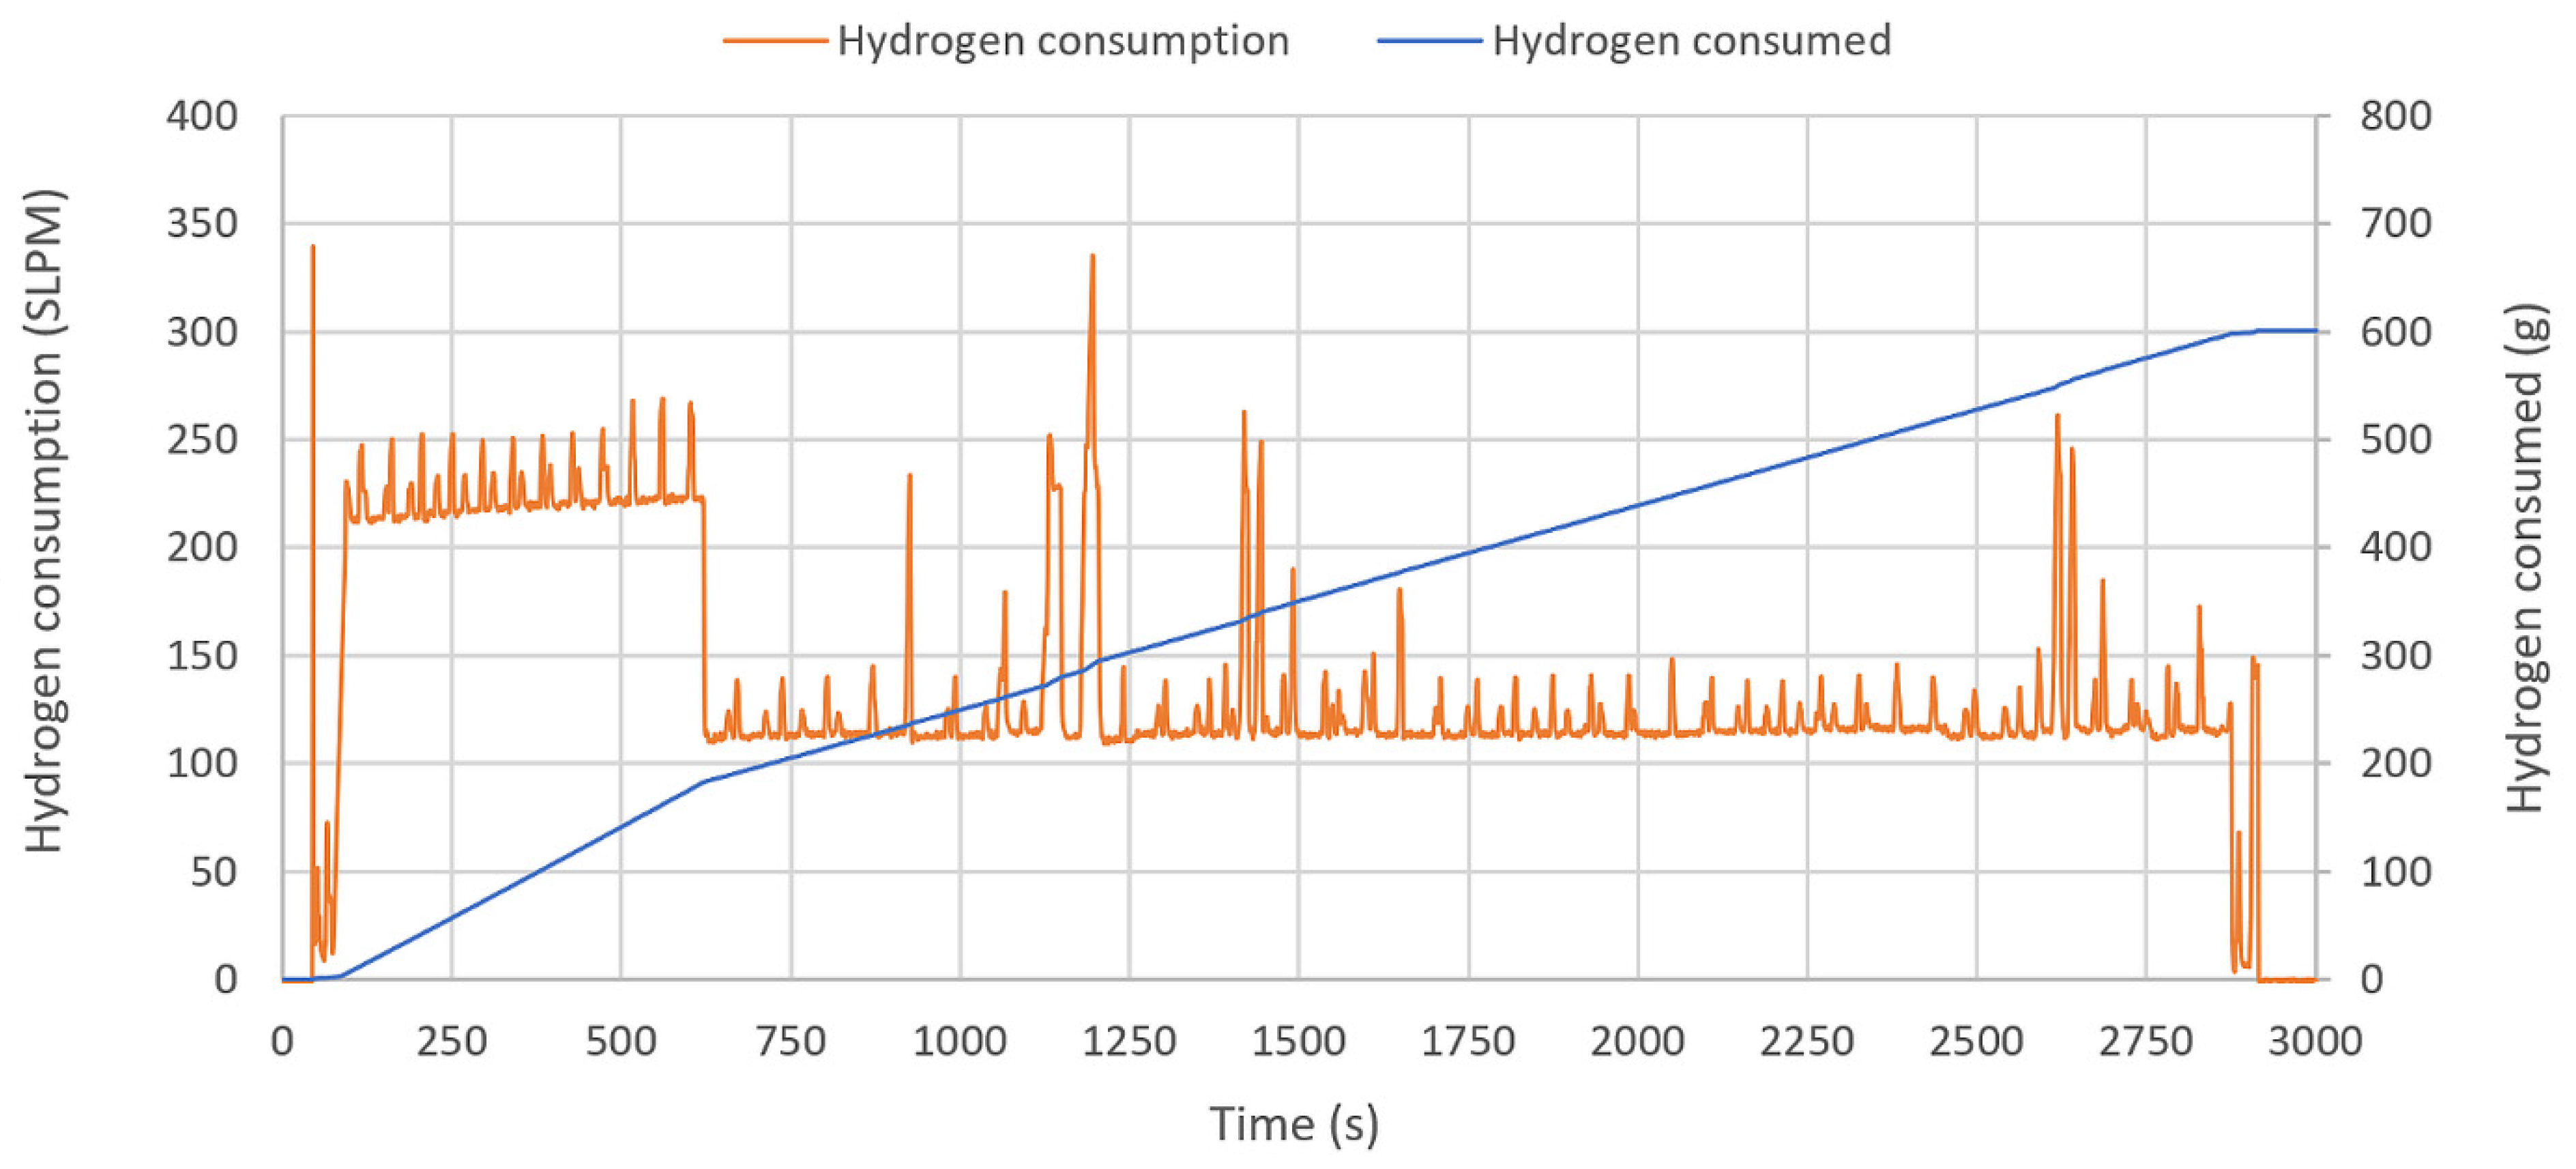
As previously specified, the FCHEV should operate as much as possible in the maximum efficiency zone to reduce fuel consumption. In this sense, the result of the total hydrogen consumption for the NDEC and FTP-75 driving cycles is presented in
Figure 9. The total amount of hydrogen consumed by the fuel cell to meet the power requirements is closely related to the distance traveled by the FCHEV. The distance covered by FCHEV for the NDEC and FTP-75 drive cycles equals approximately 28.77 km.
The amount of hydrogen consumed by the vehicle was calculated by two methods to certify that this value is as correct as possible. The first method was by the addition of the flow rate measured at the anodic inlet of each system (FCS1_H2Flow in
Figure 11 (Plot 5) and FCS2_H2Flow in
Figure 11 (Plot 6)).
The sum of the two debits was integrated by using the expression
, where
W = hydrogen consumed (g),
integrated hydrogen consumption at normal conditions (SLPM), and m = molecular weight of hydrogen 2.016 (g/mol). The amount of hydrogen consumed, measured by the flow rate method, was 601 g (
Figure 15). The pressure and temperature method in the high-pressure hydrogen tank was the second method used for calculating the consumed hydrogen. The pressure and temperature of the hydrogen tank were presented in
Figure 13, Plot 1 and Plot 2. The hydrogen consumed was calculated by the following gas equation:
. Here,
W = hydrogen consumed (g);
m = molecular weight of hydrogen 2.016 (g/mol);
volume of hydrogen tank
;
gas constant
;
hydrogen tank pressure before test
;
hydrogen tank pressure after test
;
hydrogen tank temperature before test 306 [K];
hydrogen tank temperature after test
;
compressibility factor at
,
,
; and
compressibility factor at
,
,
. The amount of hydrogen consumed, measured by the pressure method, was 608 g.
The precision error for determining hydrogen consumed by the two methods was below 1%; thus, the total hydrogen consumed by the vehicle is calculated as the arithmetic mean of the two values, 604.5 g.
In other words, the average power of the FCS over the two NEDC and FTP-75 driving cycles was calculated to be 12.99 kW (experimental results are provided in the
Supplementary Materials), where the FCS consumed 604.5 g of hydrogen. Normalizing to 1 kW of power generated by FCS, 46.5 g of hydrogen was consumed.


