Review

Power Plant Cycles: Evolution towards More Sustainable and Environmentally Friendly Technologies

by
Andrés Meana-Fernández
1,*,
Juan M. González-Caballín
1,
Roberto Martínez-Pérez
1,
Francisco J. Rubio-Serrano
2 and
Antonio J. Gutiérrez-Trashorras
1
1
Department of Energy, Escuela Politécnica de Ingeniería de Gijón, Edificio Departamental Este, University of Oviedo, C/Wifredo Ricart, s/n, 33204 Gijón, Spain
2
IMASA, Ingeniería y Proyectos, S.A. Carpinteros 12, 28670 Villaviciosa de Odón, Spain
*
Author to whom correspondence should be addressed.
Energies 2022, 15(23), 8982; https://doi.org/10.3390/en15238982
Submission received: 3 November 2022 / Revised: 22 November 2022 / Accepted: 23 November 2022 / Published: 28 November 2022
(This article belongs to the Collection Renewable and Sustainable Energy)

Abstract

:
The scarcity of energy and water resources and rising temperatures due to climate change has set the focus on improving the energy efficiency of power plant thermodynamic cycles to adapt to higher heat sink temperatures and use fewer resources for energy production. In this work, a review of power production thermodynamic cycles is presented: from Brayton to Rankine and combined cycles, alongside particular cycles such as Organic Rankine Cycles, Kalina, Goswami or the more recently developed Hygroscopic Cycle. The efficiency of these cycles and their possible improvements are considered, as well as their environmental impact. Costs associated with existing power plants found in the literature have also been included in the study. The main existing facilities for each cycle type are assessed, and the most sustainable options in terms of resource consumption (fuel, water, etc.) and future perspectives to ensure both their energy efficiency and sustainability are identified.

1. Introduction

Global energy is suffering a deep energy crisis, mainly as a consequence of over-exploitation of natural resources, the geopolitical dependence of consumer countries and the obsolescence of generation facilities. Primary energy world consumption in the decade 2011–2021 has shown an increase of 12.5% with fossil fuels—coal, oil and natural gas—being the most used resources representing 82.27% in 2021. In this decade, electricity production increased by 21.8%, as well as the use of fossil fuels, which represent a share of 61.41% of the total [1], as shown in Figure 1a. Additionally, CO2 emissions constantly grew in the period 1973–2019 to 18,161 million tons, an increase of 54% [2]. Figure 1b shows the share of these emissions per energy source.
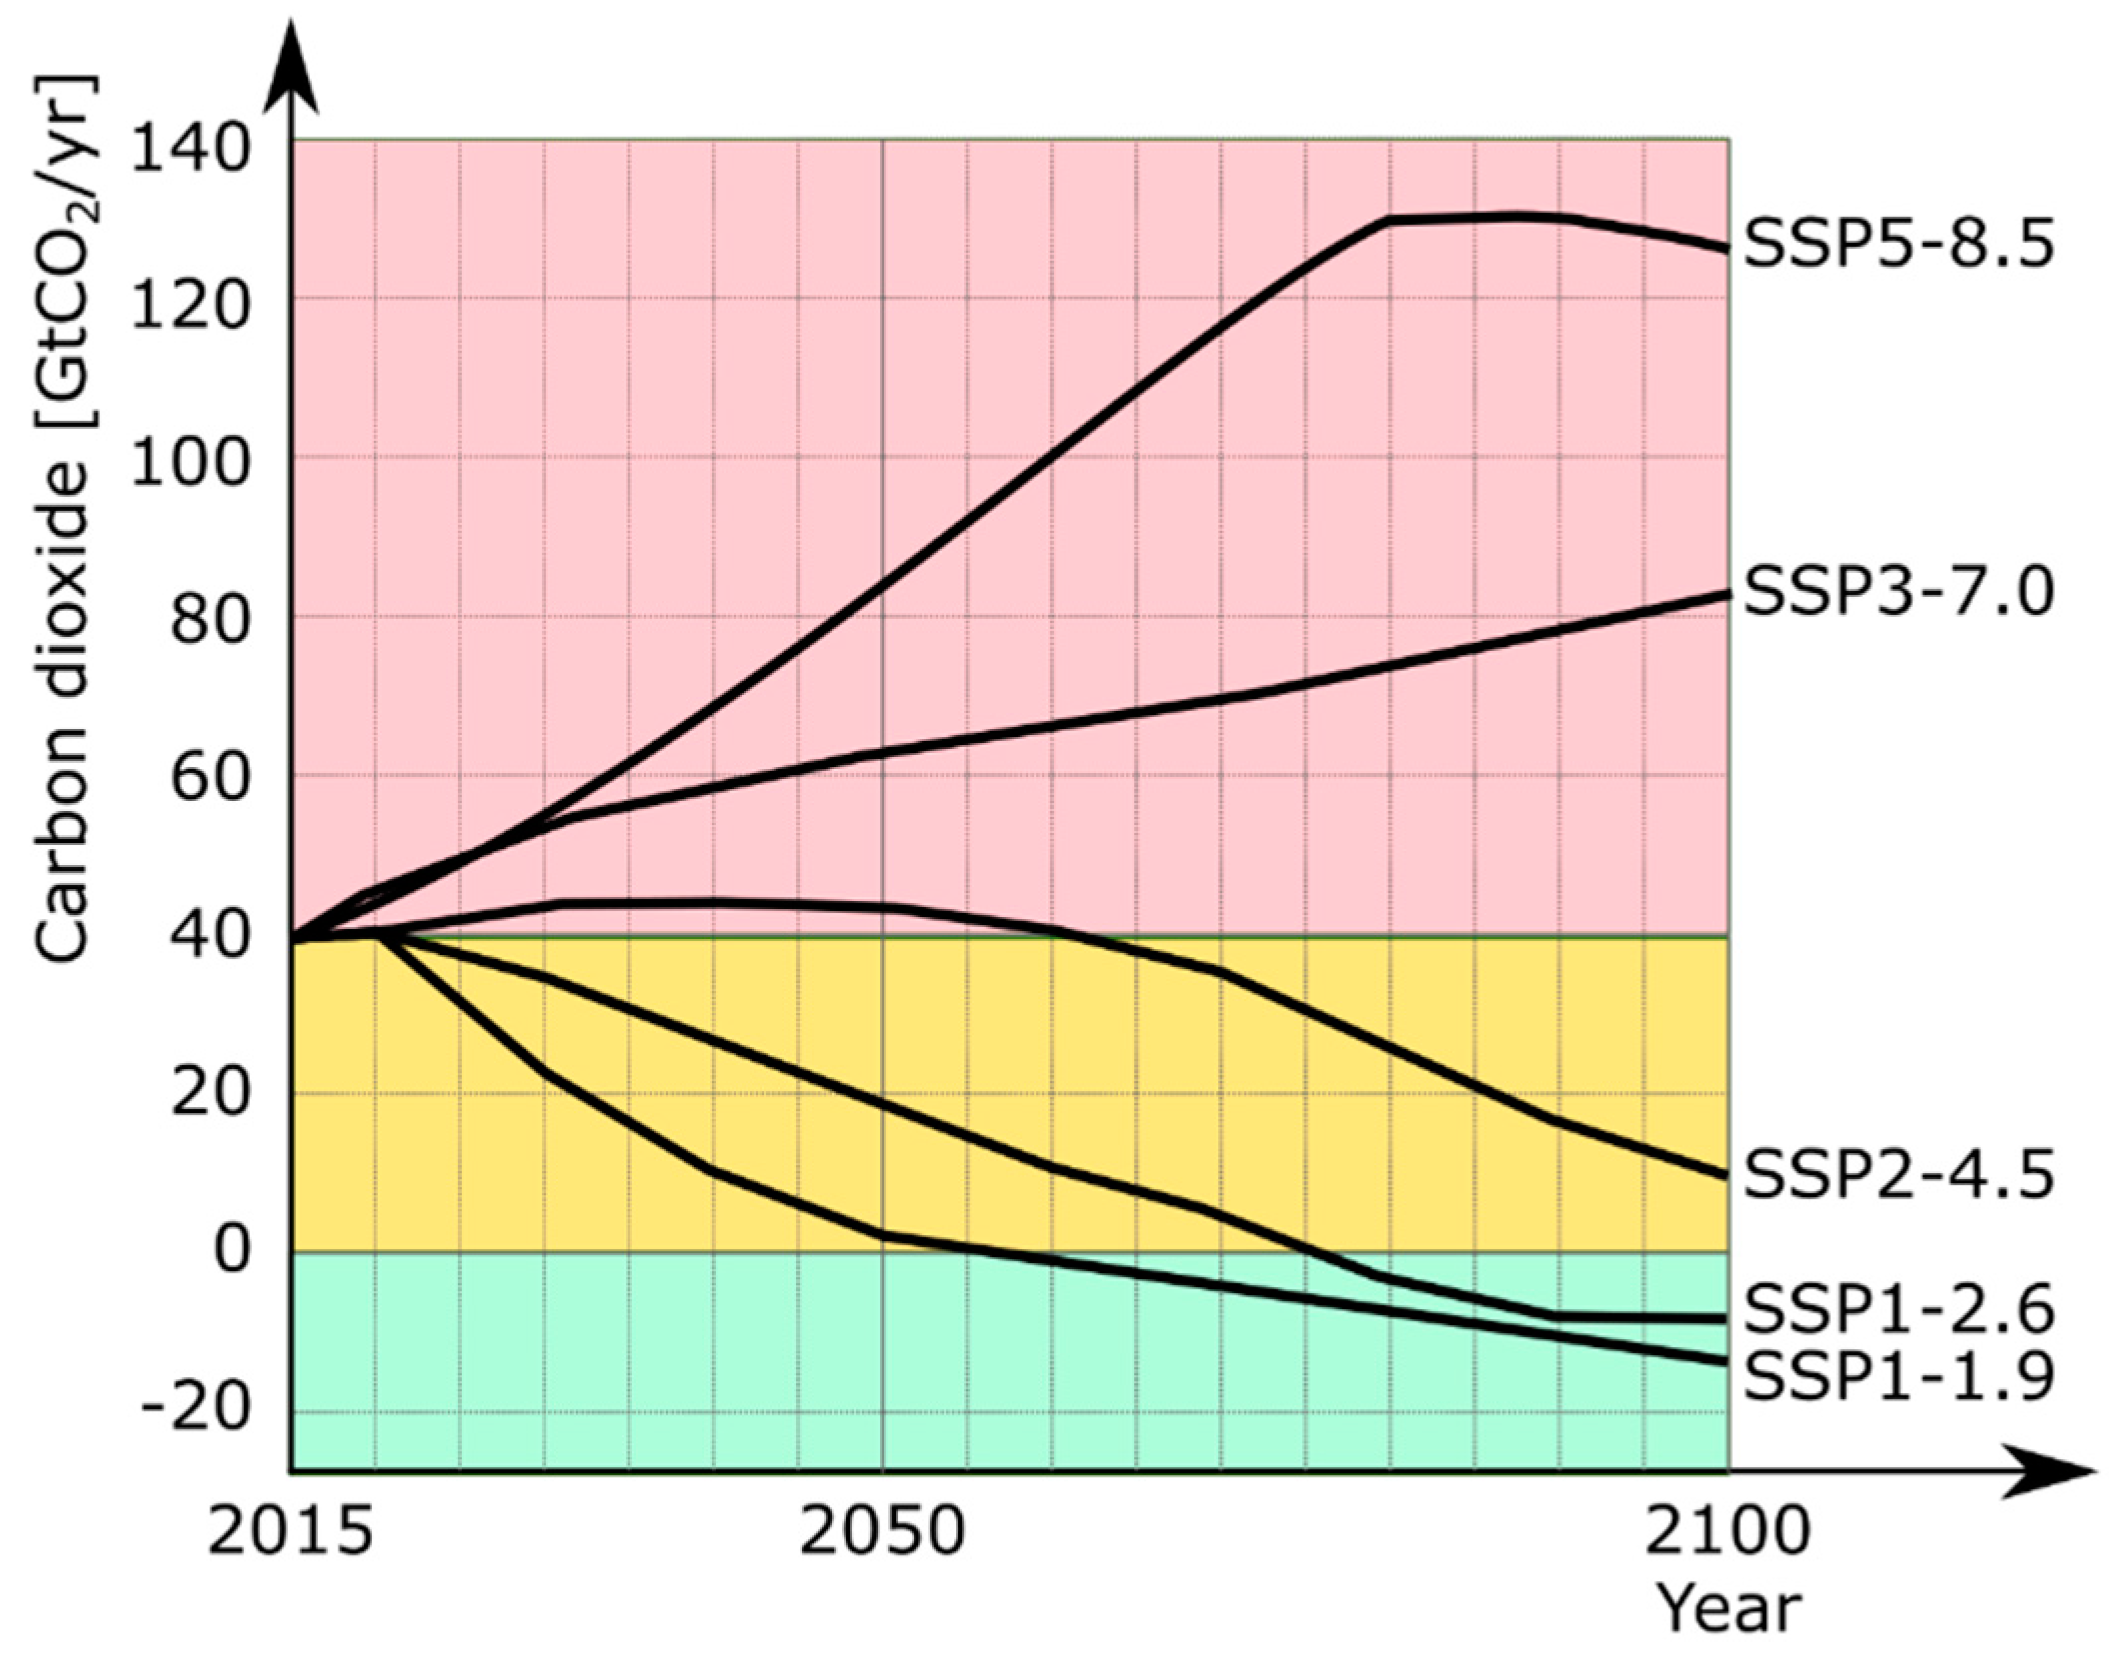
Different scenarios have been proposed for the possible future development of anthropogenic drivers of climate change [3], with the evolution of anthropogenic carbon dioxide depicted in Figure 2 for different shared socioeconomic pathways (SSPs). The most optimistic scenario, SSP1-1.9, reflects a world with net zero CO2 emissions reached around 2050, which avoids the worst impacts of climate change and has temperatures around 1.4 °C higher than in preindustrial times. In order to achieve this scenario, inclusive development and environmental boundaries must be considered. The management of world resources should be considered as well increases in education and health investment, reduced inequality within and between countries, and lower energy and resources use intensity [4]. In contrast, the SSP3-7.0 and SSP5-8.5 scenarios show an increase in CO2 emissions due to competitiveness between countries, and temperatures reaching 3.6 and 4.4 °C higher as a consequence of the prevalence of fossil fuels in a world oriented towards quick technological processes and the development of human and social capital investments, with energy-intensive and resource-consuming lifestyles. Due to the close relationship between the fuel used for electricity generation and greenhouse emissions, as more efficient thermodynamic cycles are developed and renewable energy sources are used in the hot source to power them, SSPs will evolve to have less emissions.
Although the share of renewable energy production is expected to rise in the future, the necessary energy transition must be accompanied by an increase in the efficiency of the thermodynamic cycles used for power generation considering the scarcity of natural resources. One critical aspect is water consumption. The annual report from UNESCO [5] highlighted that in 2030, the world is facing a water deficit of 40%, with industrial water consumption (including energy and power generation) representing 19% of global water consumption. Currently, around 2800 million people live in hydraulically stressed zones, with 2500 million having deficient or no access to electricity. In addition, global energy consumption is expected to increase by 35%, which will increase water consumption by 85%. A reduction in energy demand resulting from the education of society, alongside the improvement of the energy efficiency of systems, would be very helpful to decrease the pace of resource consumption.
In this context, the most used thermodynamic cycles for power generation in the world are Rankine, Brayton and combined cycles. Analysis of the existing power plant cycle technologies and the proposal of improvements would contribute substantially to identify potential ways to increase energy efficiency and avoid the depletion of the resources of the planet. With this aim in mind, in this work, a review of power production thermodynamic cycles is presented: from Brayton to Rankine and combined cycles, alongside particular cycles such as Organic Rankine Cycles, Kalina, Goswami or the more recently developed Hygroscopic Cycle. The efficiency of these cycles and their possible improvements are considered, as well as their environmental impact. Costs associated with existing power plants found in the literature have also been included in the study. The main existing facilities for each cycle type are assessed and the most sustainable options in terms of resource consumption (fuel, water, etc.) and future perspectives to ensure both their energy efficiency and sustainability are identified.

2. Power Plant Thermodynamic Cycles

2.1. Carnot Cycle: Theoretical Reference

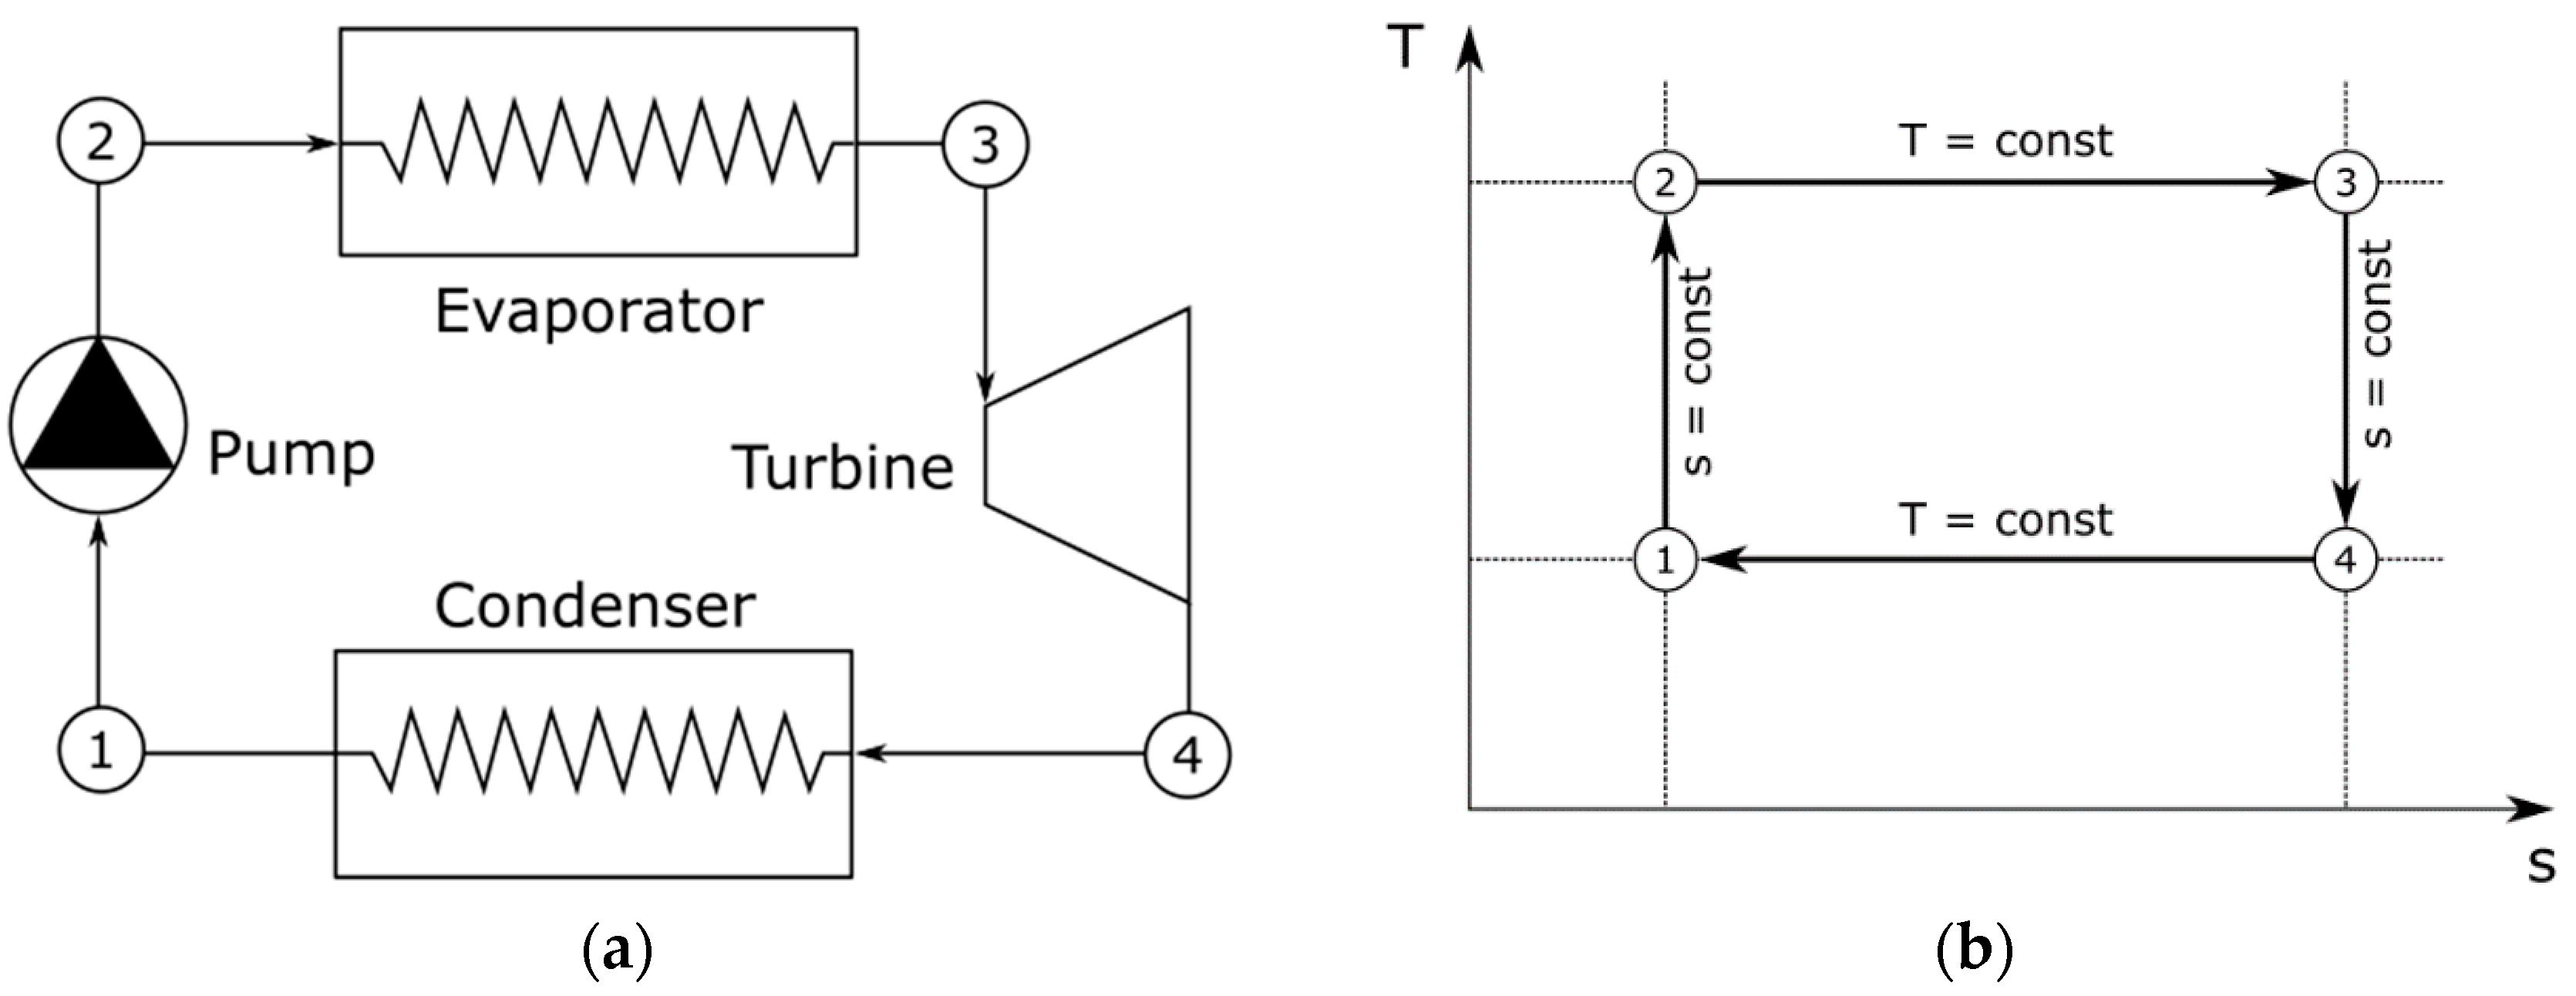
One of the most iconic thermodynamic cycles is the Carnot cycle, which is composed of two isothermal and two isentropic processes, as shown in Figure 3.
Firstly, the fluid is compressed (1–2) isentropically, increasing its pressure and temperature. Then, it is expanded isothermally and reversibly (2–3) by absorbing heat from the hot source. Afterwards, it is expanded isentropically (3–4), so its pressure and temperature decrease. Finally, the fluid is compressed isothermally and reversibly (4–1), releasing heat to the cold sink.
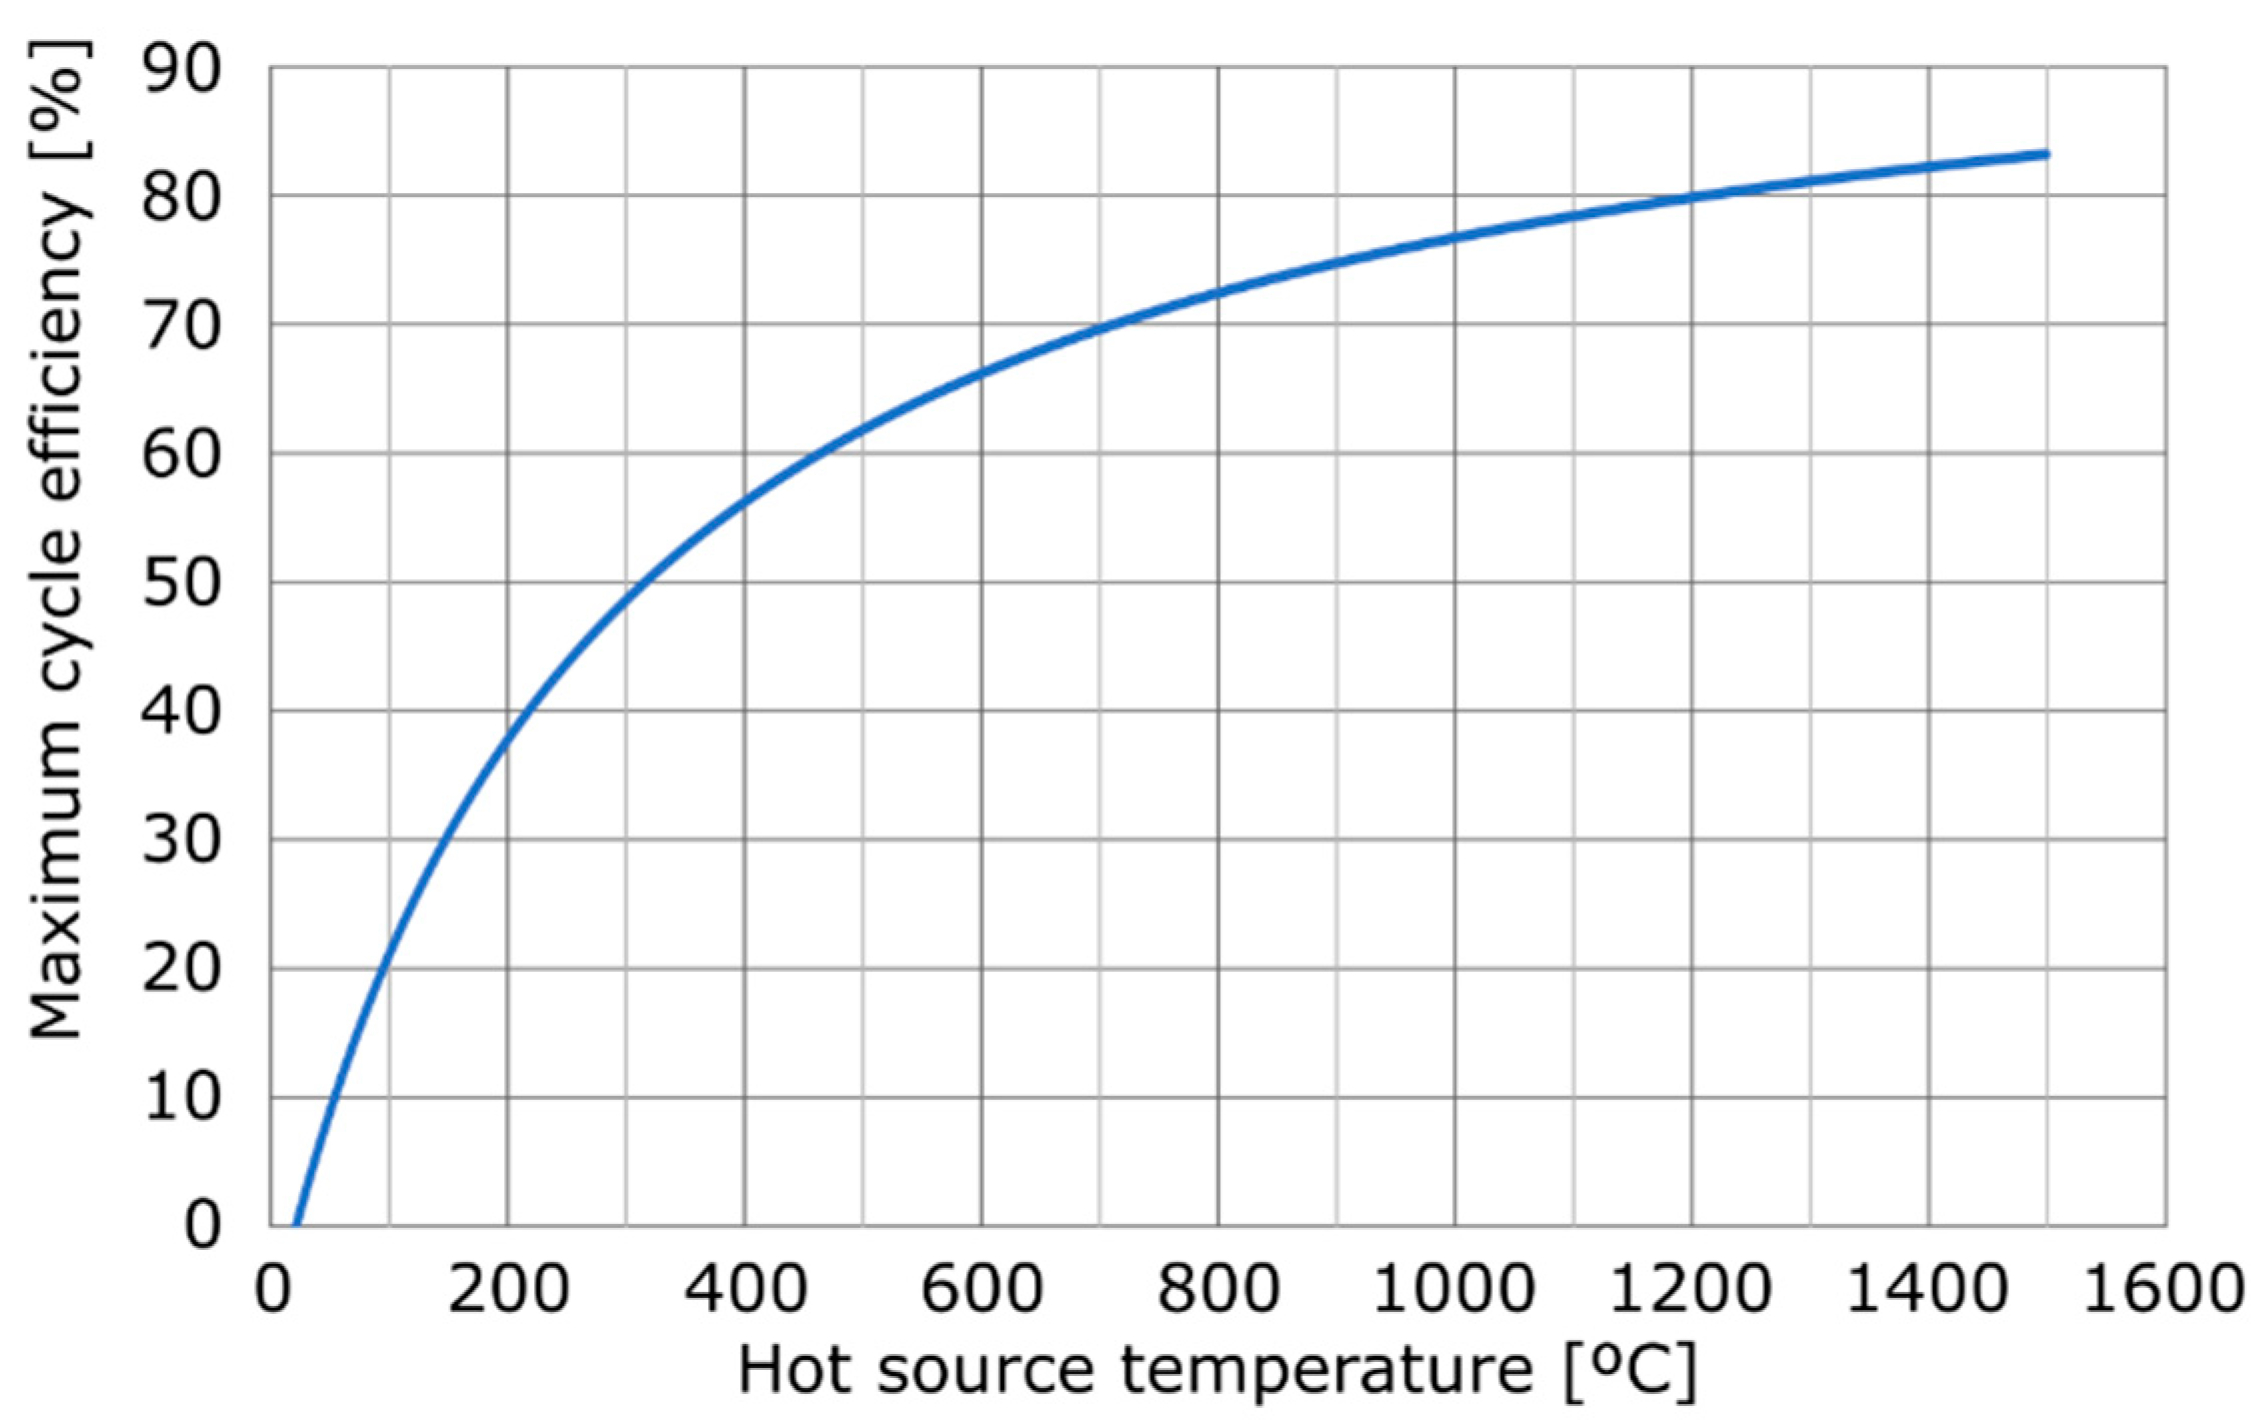
The efficiency attained by this cycle when it works between a hot source at TH and a cold sink at TC is defined by:
η C a r n o t = 1 T C T H
Figure 4 shows the evolution of this maximum efficiency as a function of the hot source temperature when the cold sink has been fixed at 20 °C. Although the Carnot cycle is a theoretical cycle and the reversible thermodynamic processes proposed are impossible to be followed in an actual cycle, it sets the maximum theoretical limit for the efficiency of the rest of power generation cycles. The so-called Carnot factor defines the ratio between the efficiency of a particular cycle and this maximum possible efficiency:
C F = η η C a r n o t

2.2. Stirling Cycle

The Stirling cycle is an altered version of the Carnot cycle in which the two isentropic processes have been replaced by two isochoric regeneration processes, as shown in the T-s diagram of Figure 5. The cycle is reversible and, ideally, it might achieve the same efficiency as the Carnot cycle. The acoustic impact is relatively low, although it has been implemented in small-scale applications. The main application is the design and development of concentrated solar power (CSP) plants. Electricity may be generated in small-scale (below 1 MW) in industrial and off-grid environments [6], although significant effort must be made to make them competitive at medium temperatures. Nevertheless, efficiencies up to 30% have been found at high temperatures, which reduces the overall plant footprint, making it a renewable alternative for reducing fossil fuel consumption [7]. The engine may be combined with other power generation devices such as PV cells, thermoelectric devices and/or thermal collectors. Polygeneration is also possible by implementing nanofluids and/or phase change materials. A review on the simulation of regenerators, the main component of Stirling cycles, may be found in [8].

2.3. Brayton Cycles

Brayton cycles employ gas as fuel, which is mixed with air in a combustion chamber before reaching the turbine. Although they are also used in plane and jet turbines, our focus will be on their use in power plant energy.

2.3.1. Simple Brayton Cycle

The simple Brayton cycle is composed of a compressor, a combustion chamber, and a turbine, as shown in Figure 6. Air enters the compressor and is adiabatically compressed until reaching the combustion chamber pressure (1–2). There, it is mixed with the fuel and combustion is produced (2–3). The hot combustion gases are expanded adiabatically in the turbine (3–4) and are then released into the environment. Normally, for analysis purposes, the cycle is completed with a theoretical process in which the gas leaving the turbine is cooled down at constant pressure until the initial state (4–1), as depicted in Figure 6.
Power cycles based on gas turbines combine the combustion chamber, compressor and turbine in the same device, simplifying its structure. Additionally, the investment cost per MW is lower than for other cycle types [8,9,10]. Thermal efficiency may exceed 30%.

2.3.2. Regenerative Brayton Cycle

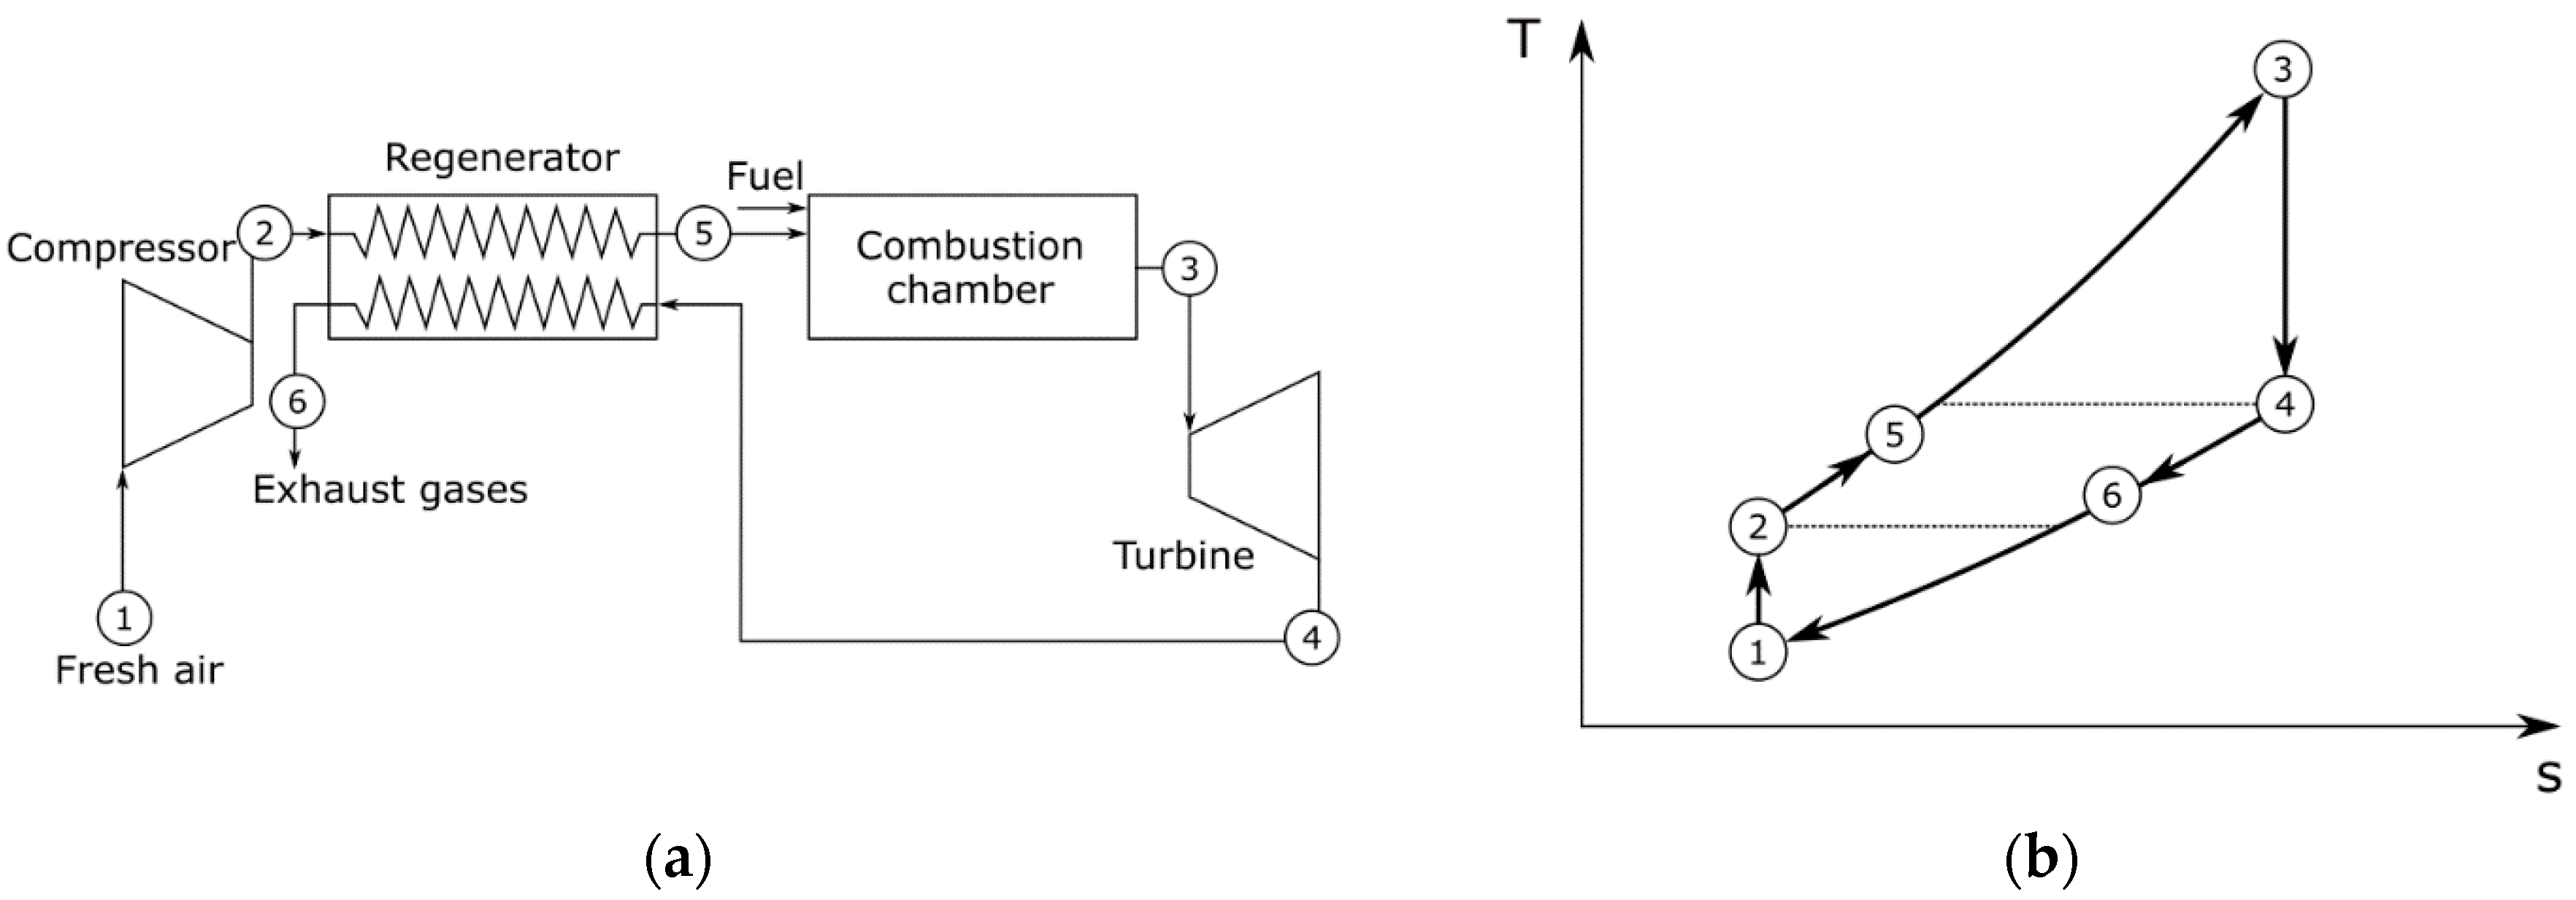
Exhaust gases from the turbine are at a relatively high temperature. If they are released into the atmosphere, this energy will be lost. The regenerative Brayton cycle includes a heat exchanger called a regenerator that uses the residual heat from the exhaust gases (4–6) to preheat the compressed air after the compression process (2–5), as shown in Figure 7.

2.3.3. Brayton Cycle with Intercooling in the Compression

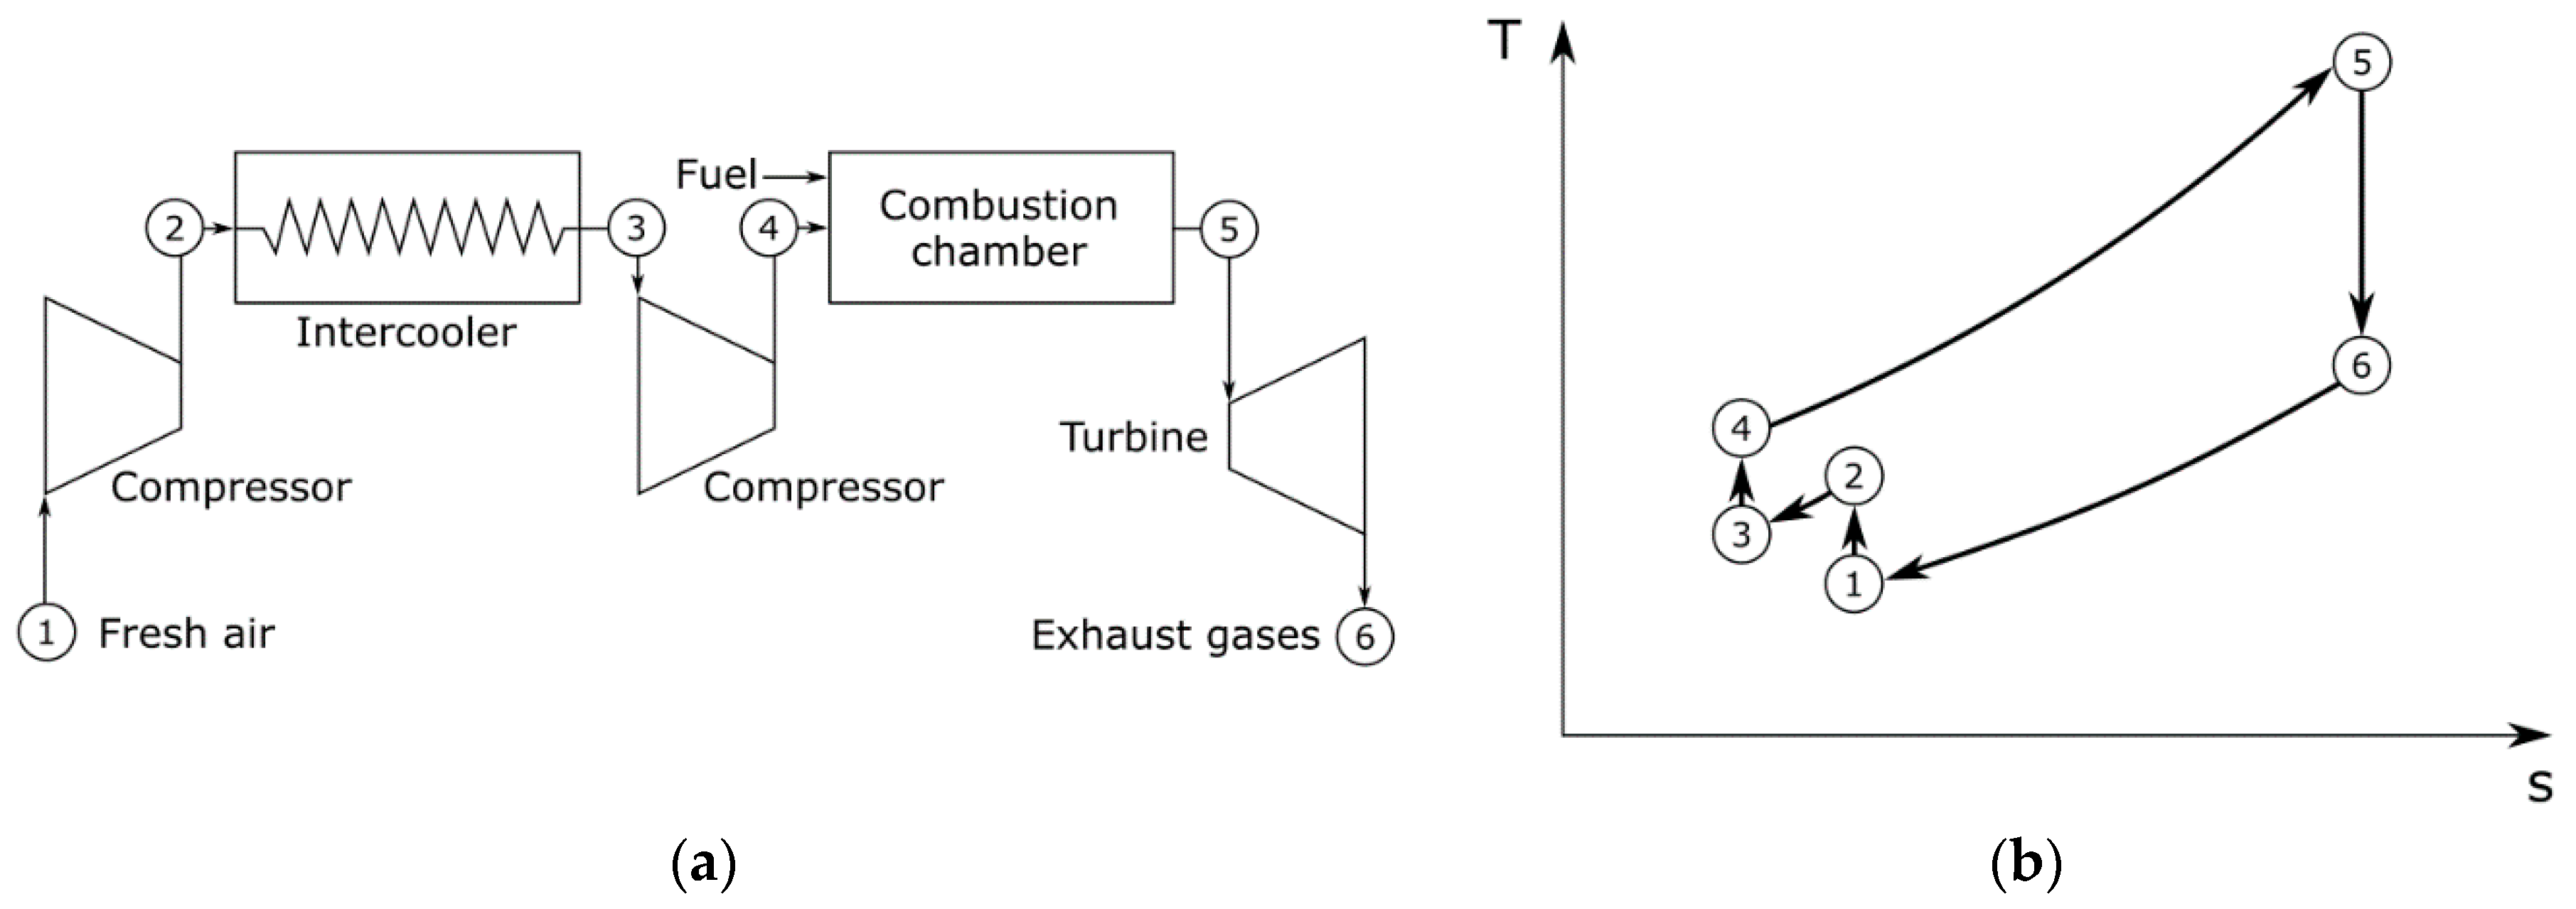
If the compression of air is divided into stages (1–2) and (3–4) and the air is cooled down between those stages (2–3), the compression work is reduced due to the decrease in the specific volume of air, as shown in Figure 8. Normally, this intercooling is performed at the geometric mean of the inlet and outlet pressures. Cooling the air may be counterproductive, as more heat is going to be required in the combustion chamber and thus the energy efficiency of the cycle will be reduced. Nevertheless, this process increases the specific network of the cycle substantially and thus its power output.

2.3.4. Brayton Cycle with Reheating

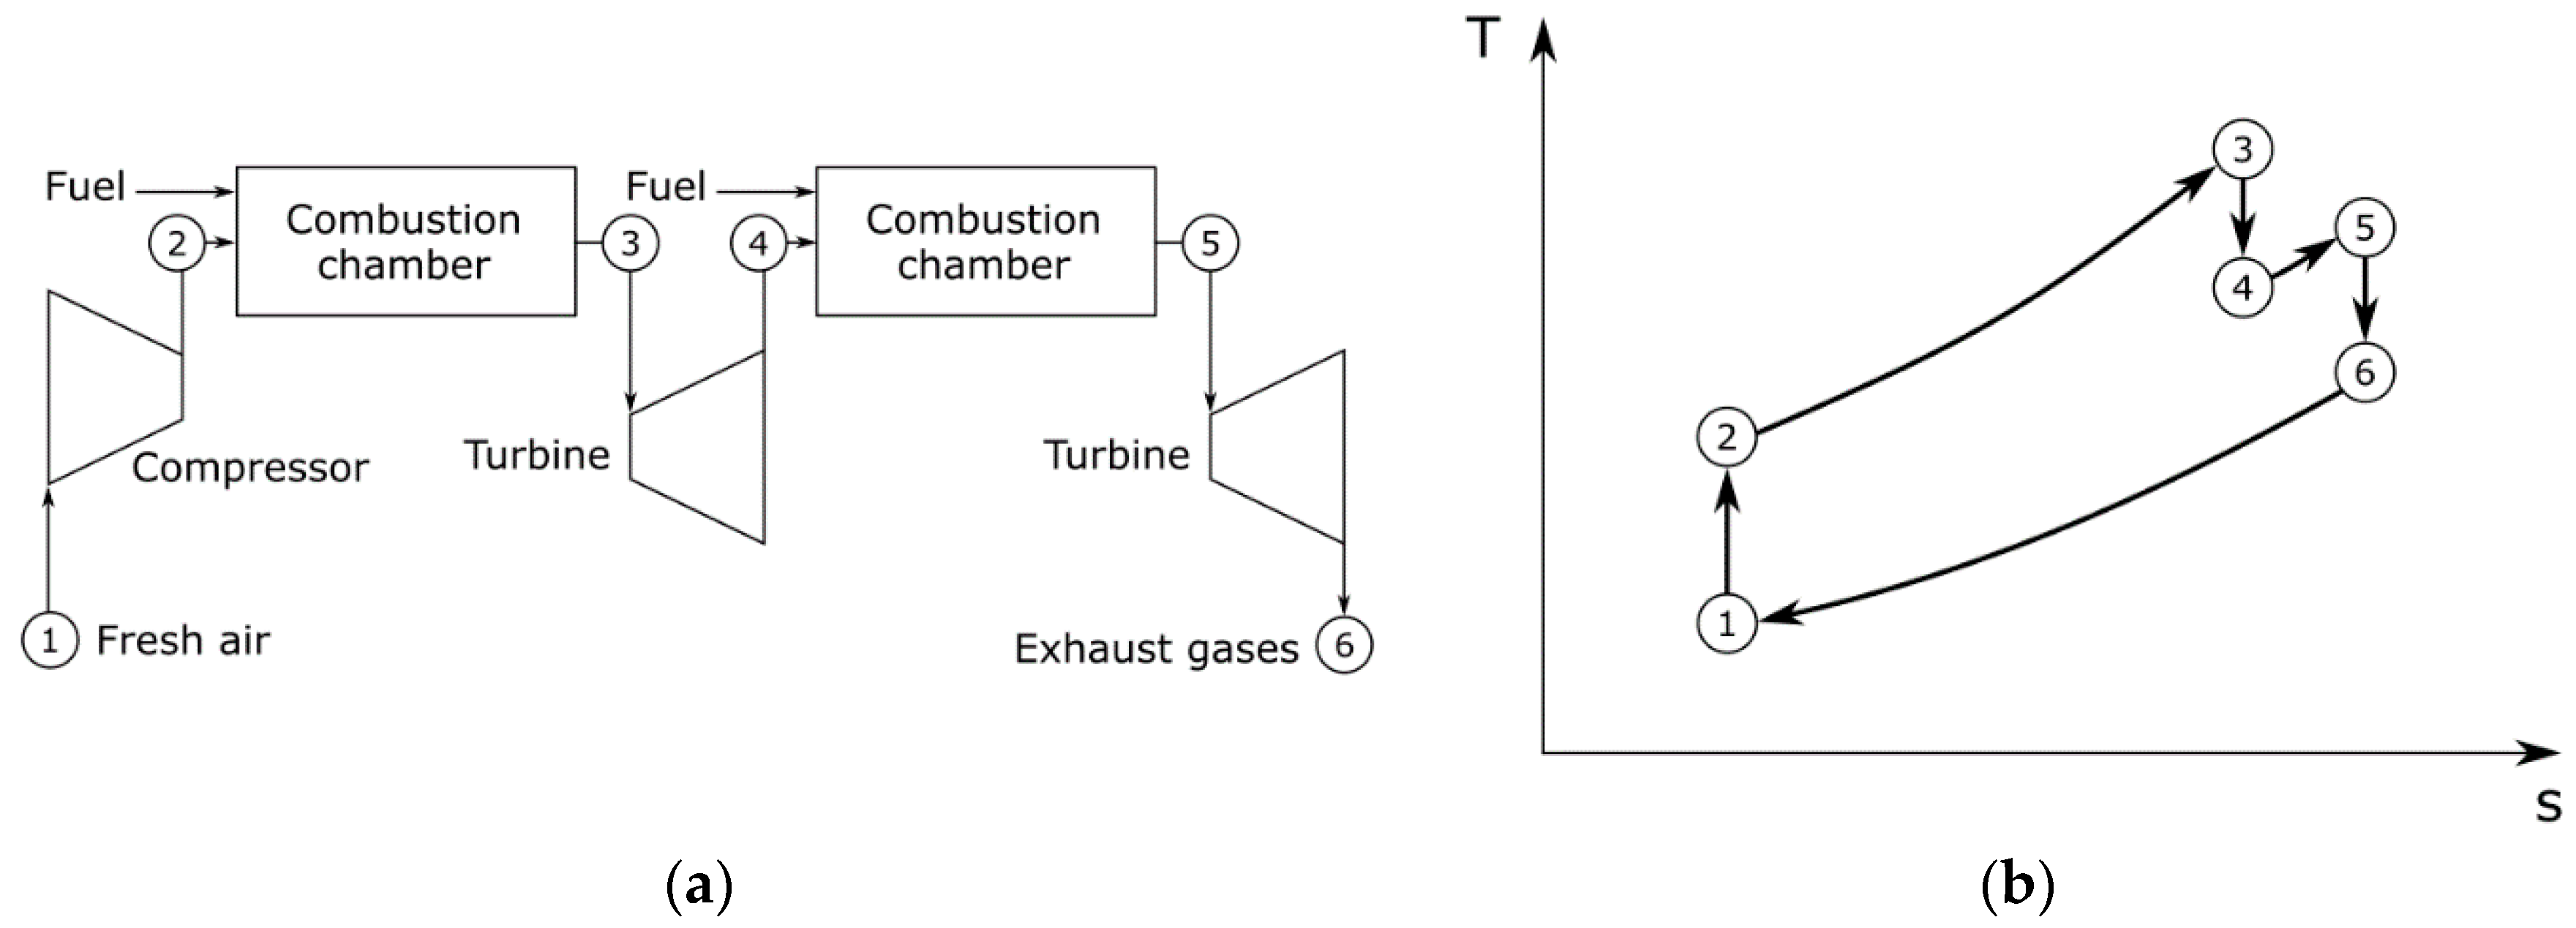
As in the Brayton cycle with intercooling shown in Figure 9, performing the expansion of the combustion gases in different turbine stages (3–4) and (5–6) with an intermediate reheating (3–4) decreases the energy efficiency of the cycle. However, it increases the net power output of the turbine as a consequence of the higher enthalpy differences between the turbine inlet and outlet.

2.3.5. Recent Advances in Brayton Cycles

Alsarayreh et al. [11] simulated the behavior of a dual-fuel gas turbine using a dynamic neural network and deep learning, finding accurate results. These models may represent an interesting alternative to thermodynamic formulation, especially to model dynamic systems [12]. For instance, Rahmoune et al. [13] presented a neural network that predicts the behavior of the degradation of the components of a gas turbine. The potential of using an interstage turbine burner to add heat to the gas during expansion was identified by Yin and Rao [14]. The turbine was able to work with less fuel consumption, reducing NOx emissions as a consequence of a lower turbine inlet temperature. This configuration could also be used with liquefied hydrogen. The existing gas turbines may remain a key element of any future energy ecosystem focused on reducing carbon emissions if the technology for the use of blends of natural gas and hydrogen or 100% hydrogen is developed [15]. Brayton cycles may be used to recover waste heat to increase the sustainability of existing facilities. Zhu et al. [16] studied a combined power plant recovering waste heat from a marine engine and found that it was possible to optimize the redistribution of exhaust energy by adjusting the turbocharger matching and exhaust bypass ratio, improving the combined cycle fuel economy up to 7.3%. It has also been found that solar combined cycles with reheated topping Brayton cycles achieve an increase in their performance of up to 2.7% [14]. An interesting proposal was presented by Holy et al. [17], who studied the possibility of coupling a Brayton cycle with a high-temperature thermal energy storage (HTS), so that excess power may be stored at temperatures around 900 °C and then be used to power a Brayton turbine, with an electrical efficiency of 29%. A survey on modeling and control of gas turbine power generation systems may be found in [18]. In this context, predictive control strategies remain very important to adapt power plants to the energy demand [19].

2.3.6. Supercritical CO2 Cycles

Supercritical CO2-cycles use CO2 as working fluid over its critical point (7.38 MPa and 31.0 °C). The conditions of the critical point of CO2 make it suitable for direct compression at supercritical pressures, so heating it up before expansion becomes easier. The temperature may be matched to the heat source and sink to allow for efficient heat absorption and release. In its simplest version, shown in Figure 10, cool CO2 is compressed (1–2), then passes through a heater (2–3) and is afterwards expanded in a turbine (3–4). Finally, a cooler takes it back to the original state (4–1). Different versions of the cycle include efficiency enhancement modifications similar to those applied to Brayton cycles, such as heat recovery from the gas exhaust to preheat compressed CO2 before the main heater, or separating part of the flow before reaching the gas cooler, compressing it again and injecting it back into the heater. Different layouts for this type of cycle may be found in [20] and an analytical formulation for the optimization of the cycle was proposed in [21]. The supercritical CO2 Brayton cycle has great versatility, as it can be applied to solar energy, nuclear power, high-temperature fuel cells and waste heat sources [22]. Additionally, it may be combined with a bottoming transcritical CO2 cycle, ORC or Kalina cycle, if desired. Supercritical CO2 cycles can reach higher efficiencies than an equivalent steam Rankine cycle at higher turbine temperatures. Thanganadar et al. [23] quantified an increase of 3–4% using a genetic algorithm, which led to lower electricity costs.
Another option regarding CO2 cycles is burning gaseous fuels (natural gas and/or coal gasification syngas [24]) with relatively pure and stoichiometric oxygen. The combustion products, mainly water and CO2, are cooled down to remove water and a portion of CO2 for storage. The remaining CO2 is injected again into the burner as a diluent [25]. Although some studies showed a reduction in energy efficiency with respect to the traditional steam cycle, there is a possibility to reduce CO2 emissions and the levelized cost of energy (LCOE) is reduced when CO2 taxes come into place. Du et al. [26] developed a marine recompression cycle using supercritical CO2, improving its efficiency and saving up to USD 1.77/MWh. Rodríguez-deArriba et al. [27] analyzed the potential of transcritical cycles based on CO2 mixtures, showing that they were able to obtain better efficiencies than pure CO2 cycles. Additionally, the mixture could be adjusted to match particular applications of the cycle. A thermoeconomic methodology was proposed by Crespi et al. [28] to select supercritical CO2 power cycles for concentrated solar power applications. Nevertheless, it is still necessary to obtain more experimental data to make these cycles competitive.

2.4. Rankine Cycles

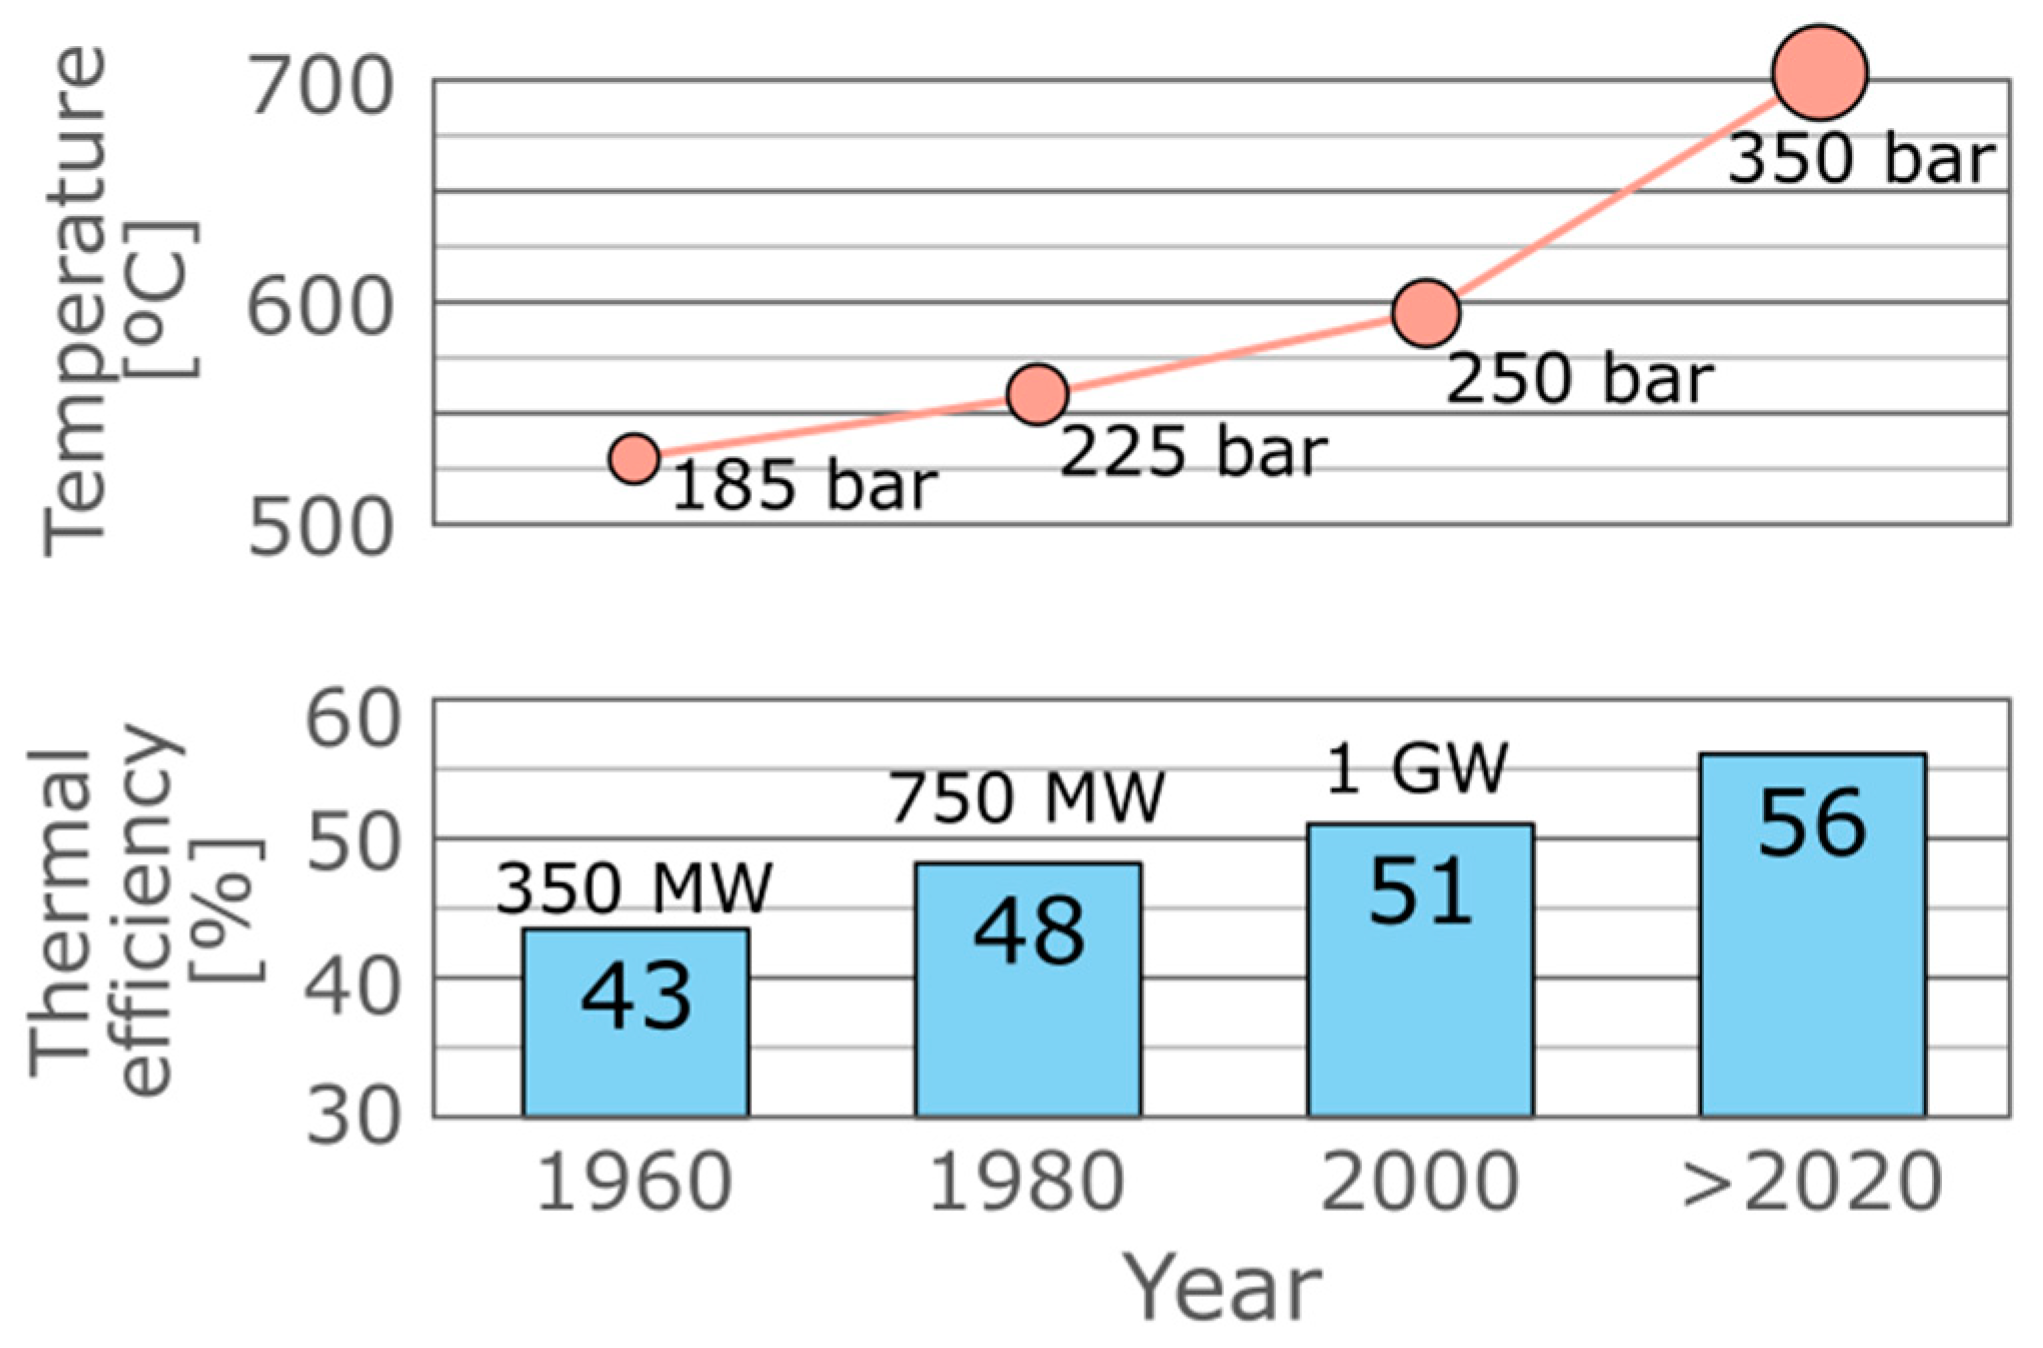
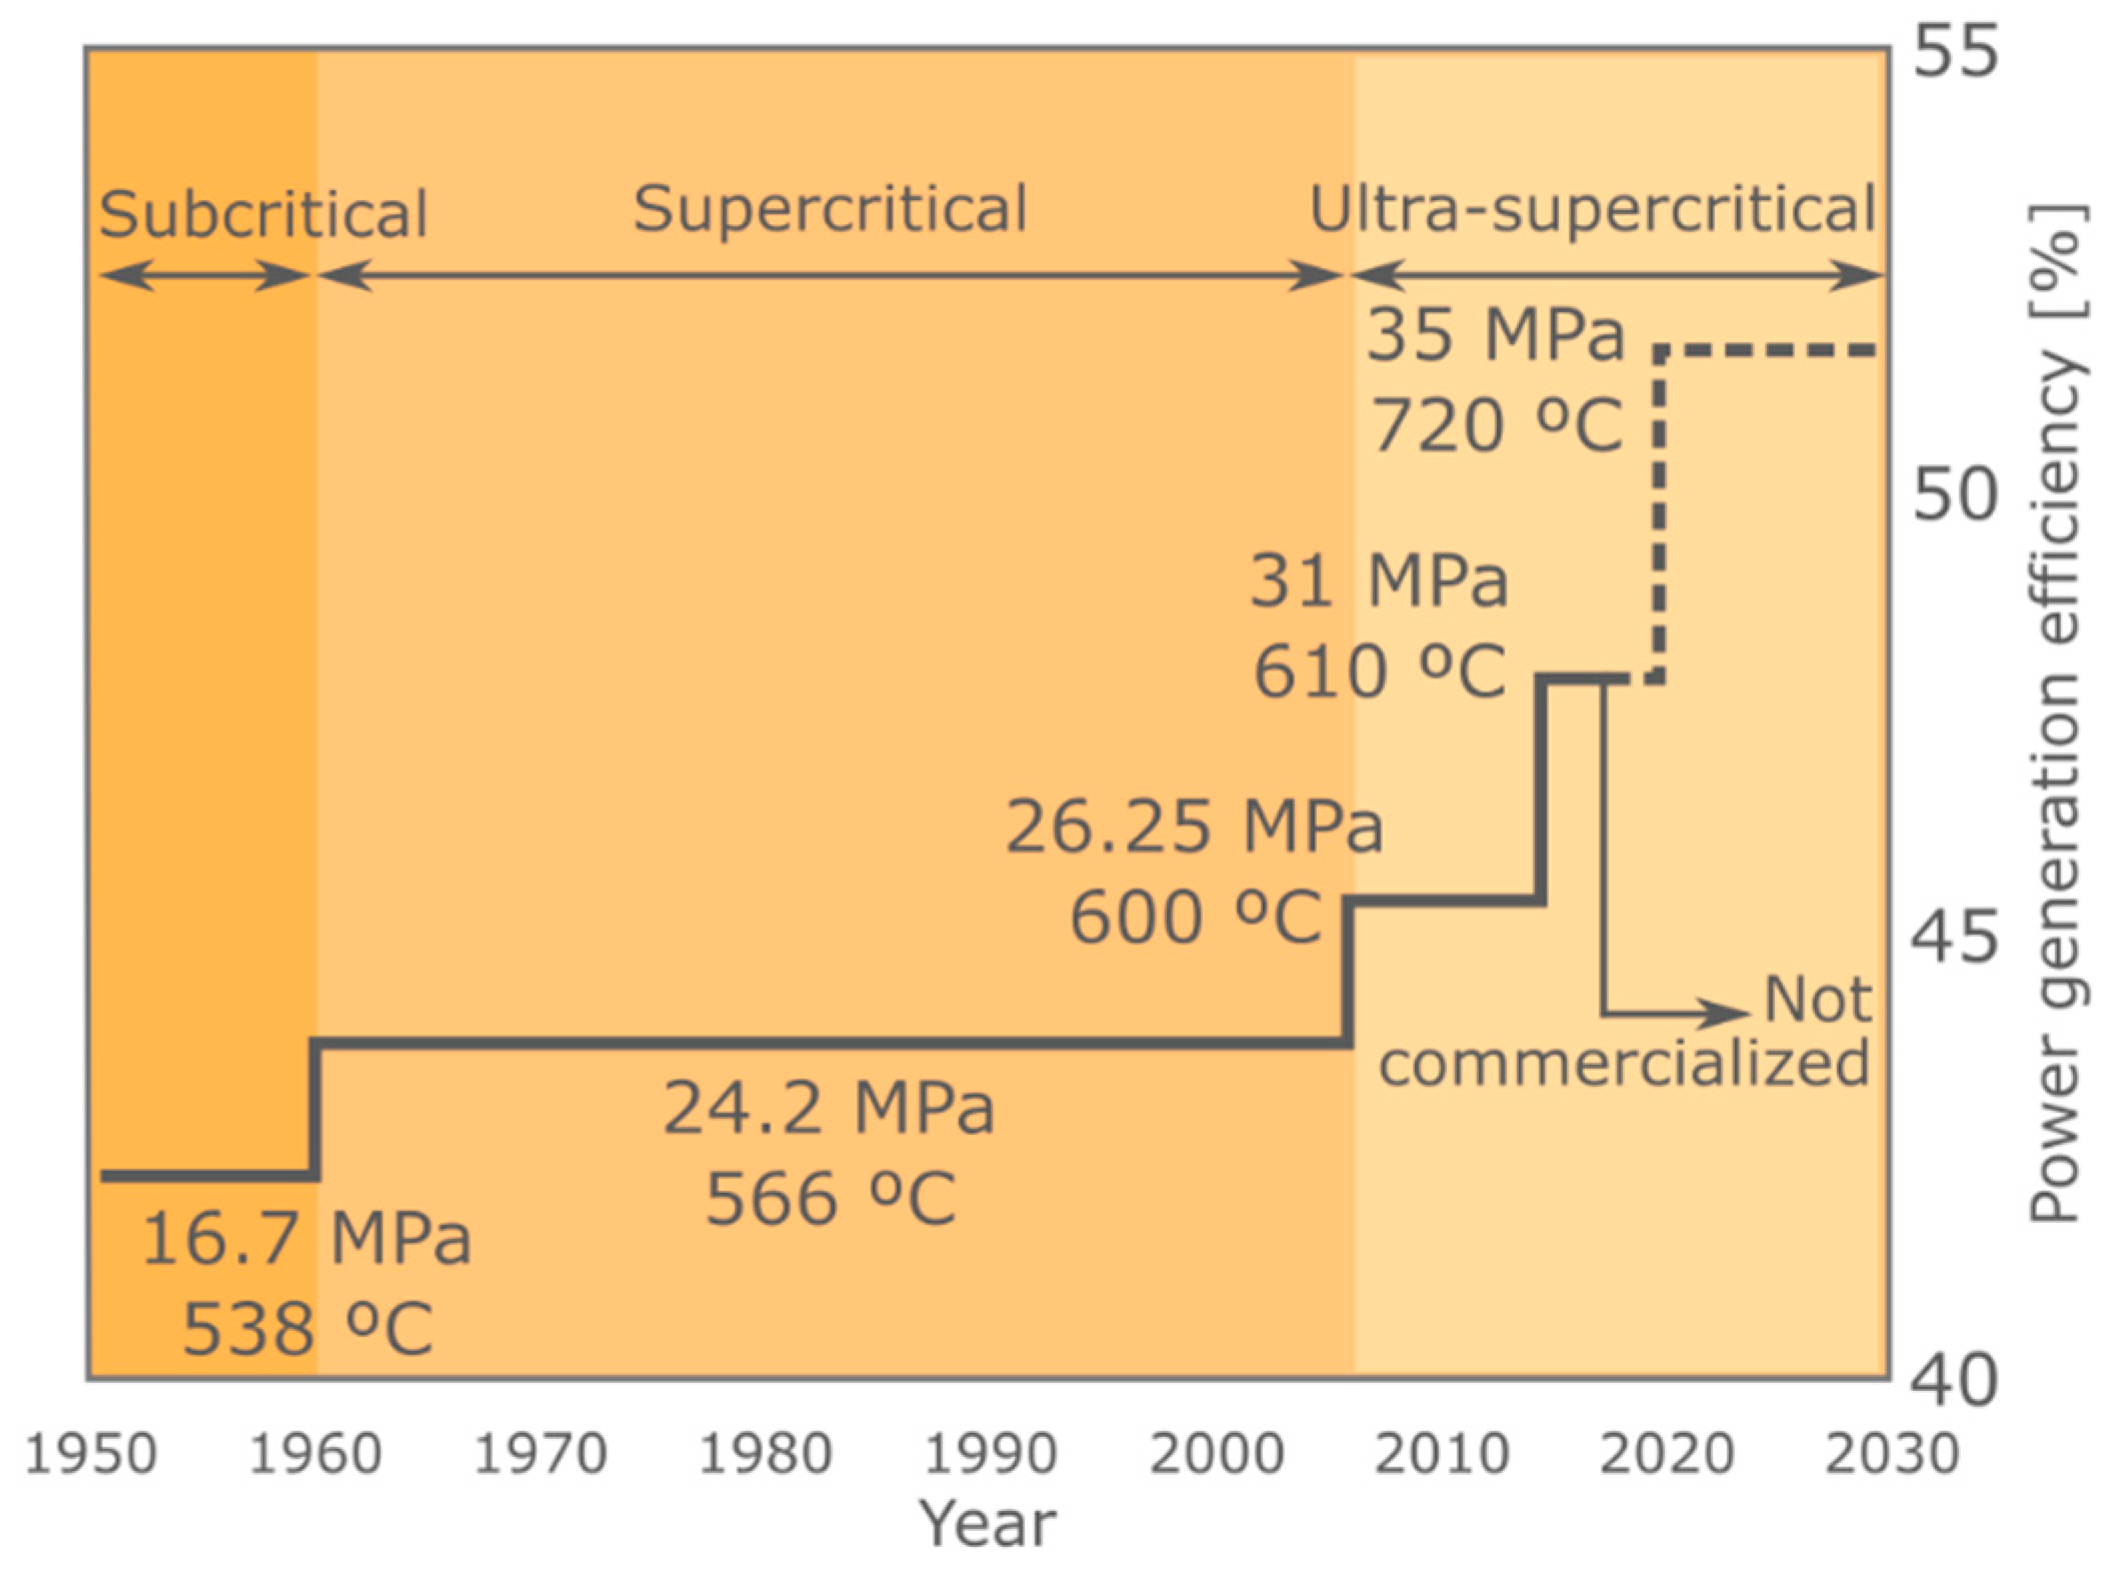
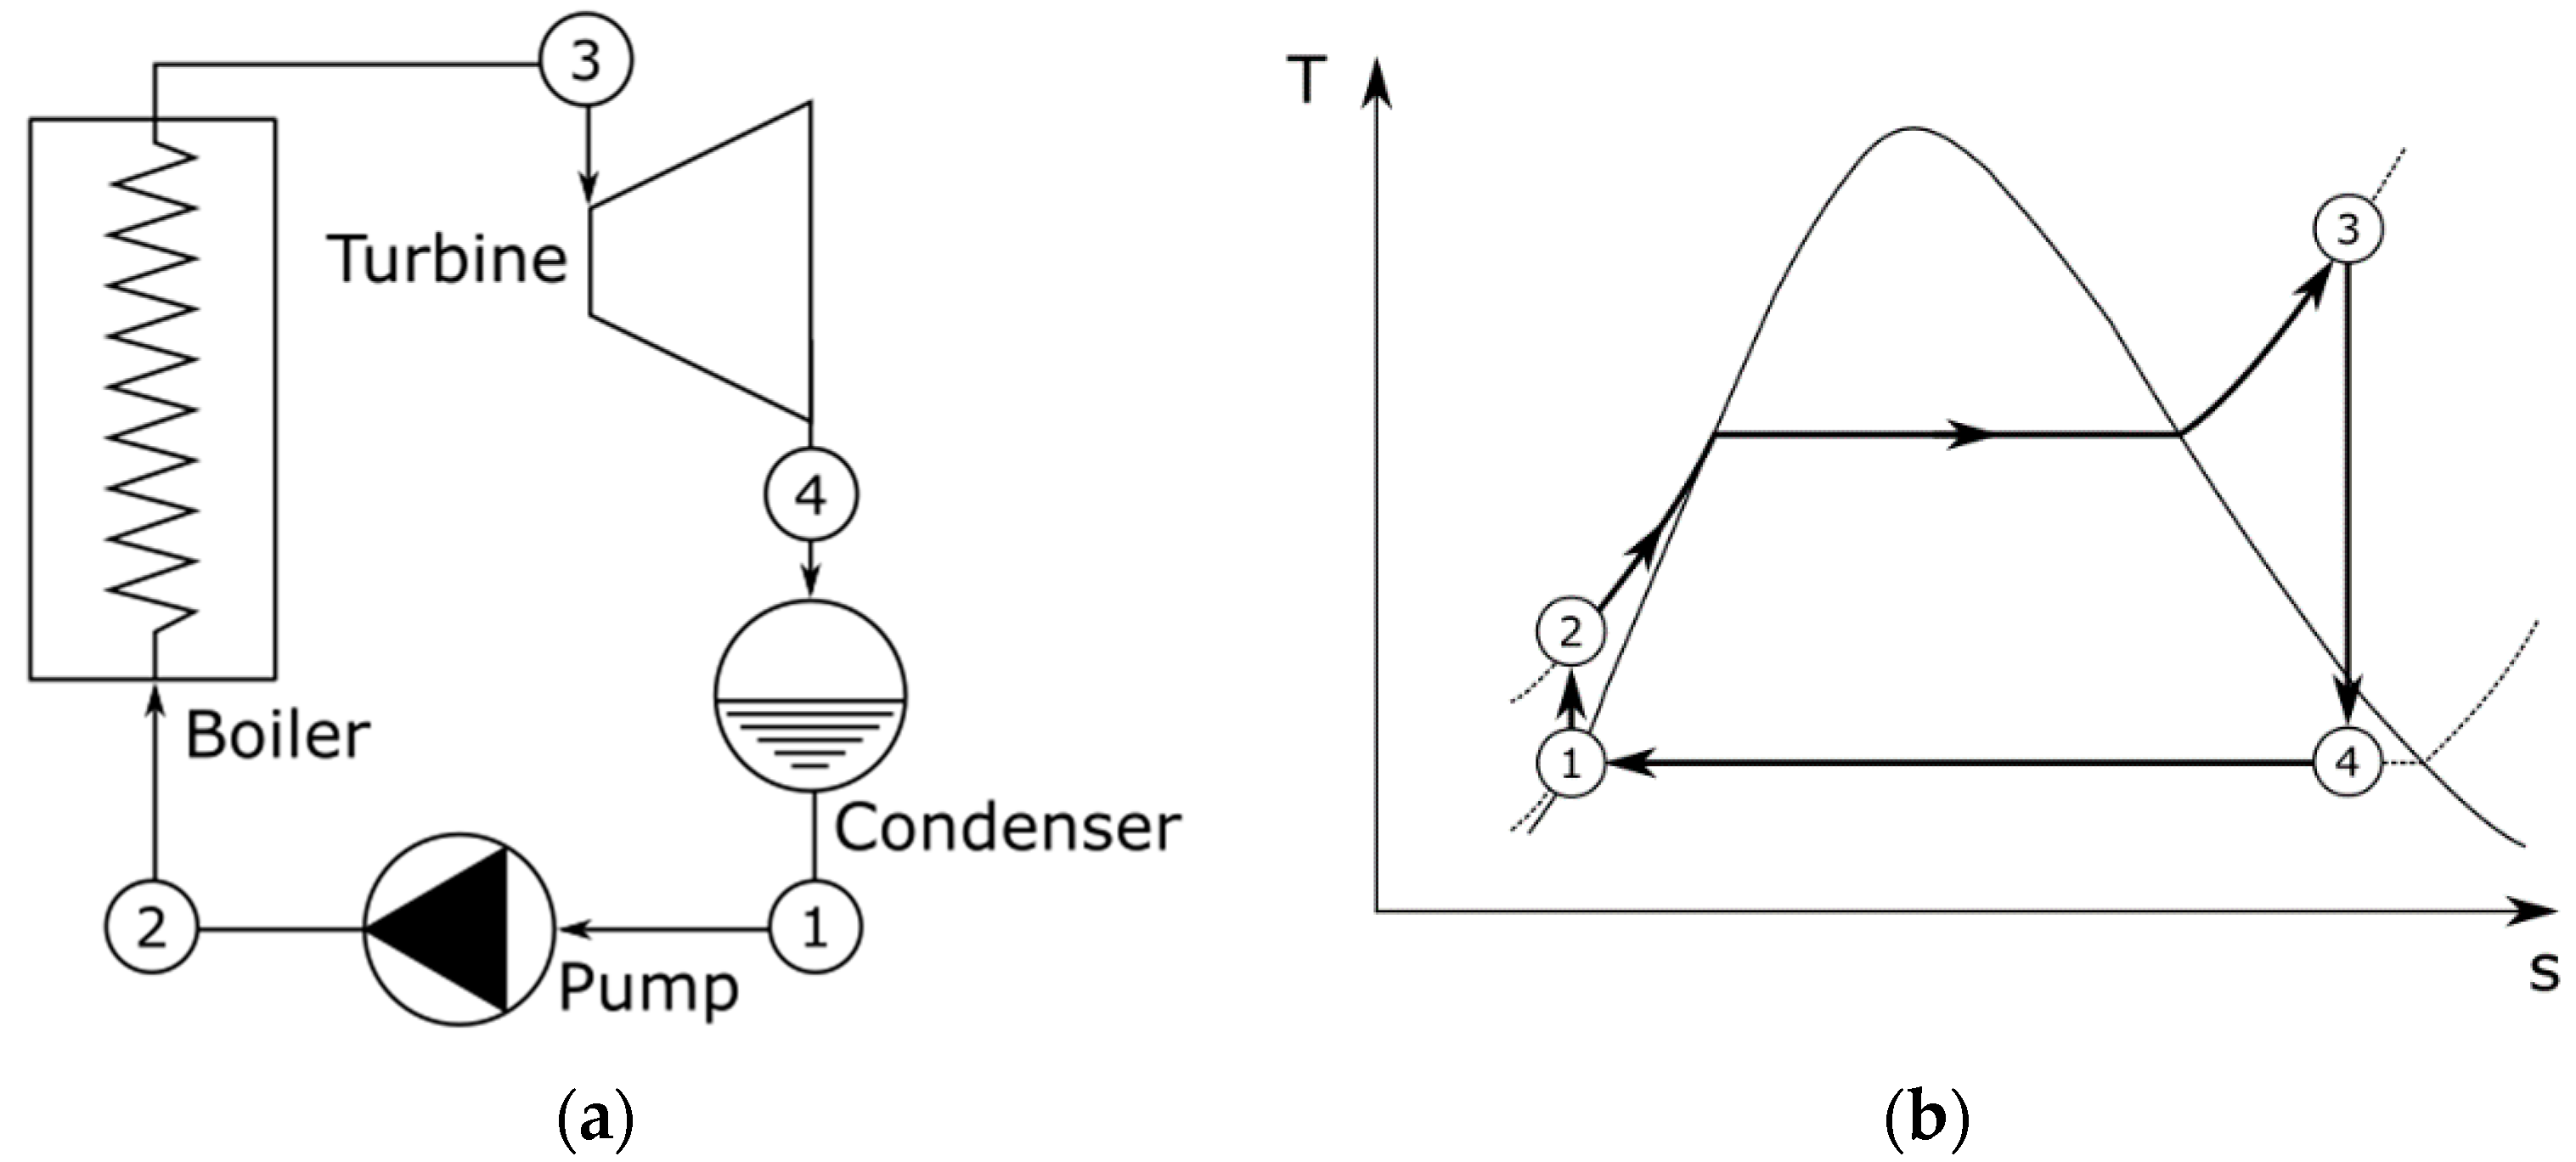
Rankine cycles were originally conceived as liquid water—steam cycles, but their definition may be currently associated with any thermodynamic cycle using a substance that undergoes phase changes for transferring heat in order to obtain power. Rankine cycles for electricity generation using coal as fuel were started in the 1920s. Then, Europe started supercritical Rankine cycles (working above the critical point of water) in the 1930s, which reached the USA in the 1960s [29]. Environmental demands improved the technology with the installation of forced circulation boilers, equipped with scrubbers for the desulfurization of the flue gas and selective catalytic reactors for reducing NOx. Figure 11 shows the evolution of the technical parameters of steam power plant turbines since 1960 [30], where it may be observed how the efficiency of the cycles is still increasing, mainly as a consequence of the use of materials that withstand higher pressures and temperatures. A similar evolution has been found in coal-fired power units in China [31], as depicted in Figure 12, which shows the thermal efficiency from subcritical to super- and ultra-supercritical power plants alongside the maximum pressure and temperature values reached in the cycle.

2.4.1. Original Rankine Cycle

The original Rankine cycle, as shown in Figure 13, is composed of a boiler, a steam turbine, a condenser, and a pump that recirculates water back into the boiler. The liquid that comes out of the condenser is compressed by the pump (1–2) and flows into the boiler. In the boiler, the liquid is heated up at constant pressure (2–3) until it reaches saturation conditions in the economizer. Then, it changes to steam in the evaporator and finally it is heated up until turbine inlet conditions in the superheater. After leaving the boiler, the steam is expanded in a turbine producing useful power (3–4). Finally, the steam leaving the turbine is condensed in a condenser (4–1) so that the cycle can start again [32].
The condenser is normally refrigerated using water, so water availability is one key issue when considering the installation of a Rankine cycle. In some places, dry cooling is possible using air as a refrigerant at the expense of a higher condensing pressure. On the other hand, the heat to be added in the 2–3 process may have multiple origins. Although historically fossil fuels have been the main heat source, it is not difficult to find Rankine cycles in which the heat source is the combustion of a nuclear fuel, of biomass or even the result of concentrating solar power. Boiler thermal efficiency is one of the key performance indicators [33] of the performance and profitability of the cycle [34]. A typical Rankine cycle may reach efficiencies between 34% and 38% [17].
One of the main issues regarding this cycle is avoiding high-humidity contents in the turbine steam, as they are detrimental to the turbine performance and useful life (humidity values should be below 10% to ensure proper functioning). One way of solving this problem is by increasing the superheating degree of the boiler at the cost of a higher investment [35]

2.4.2. Rankine Cycle with Reheating

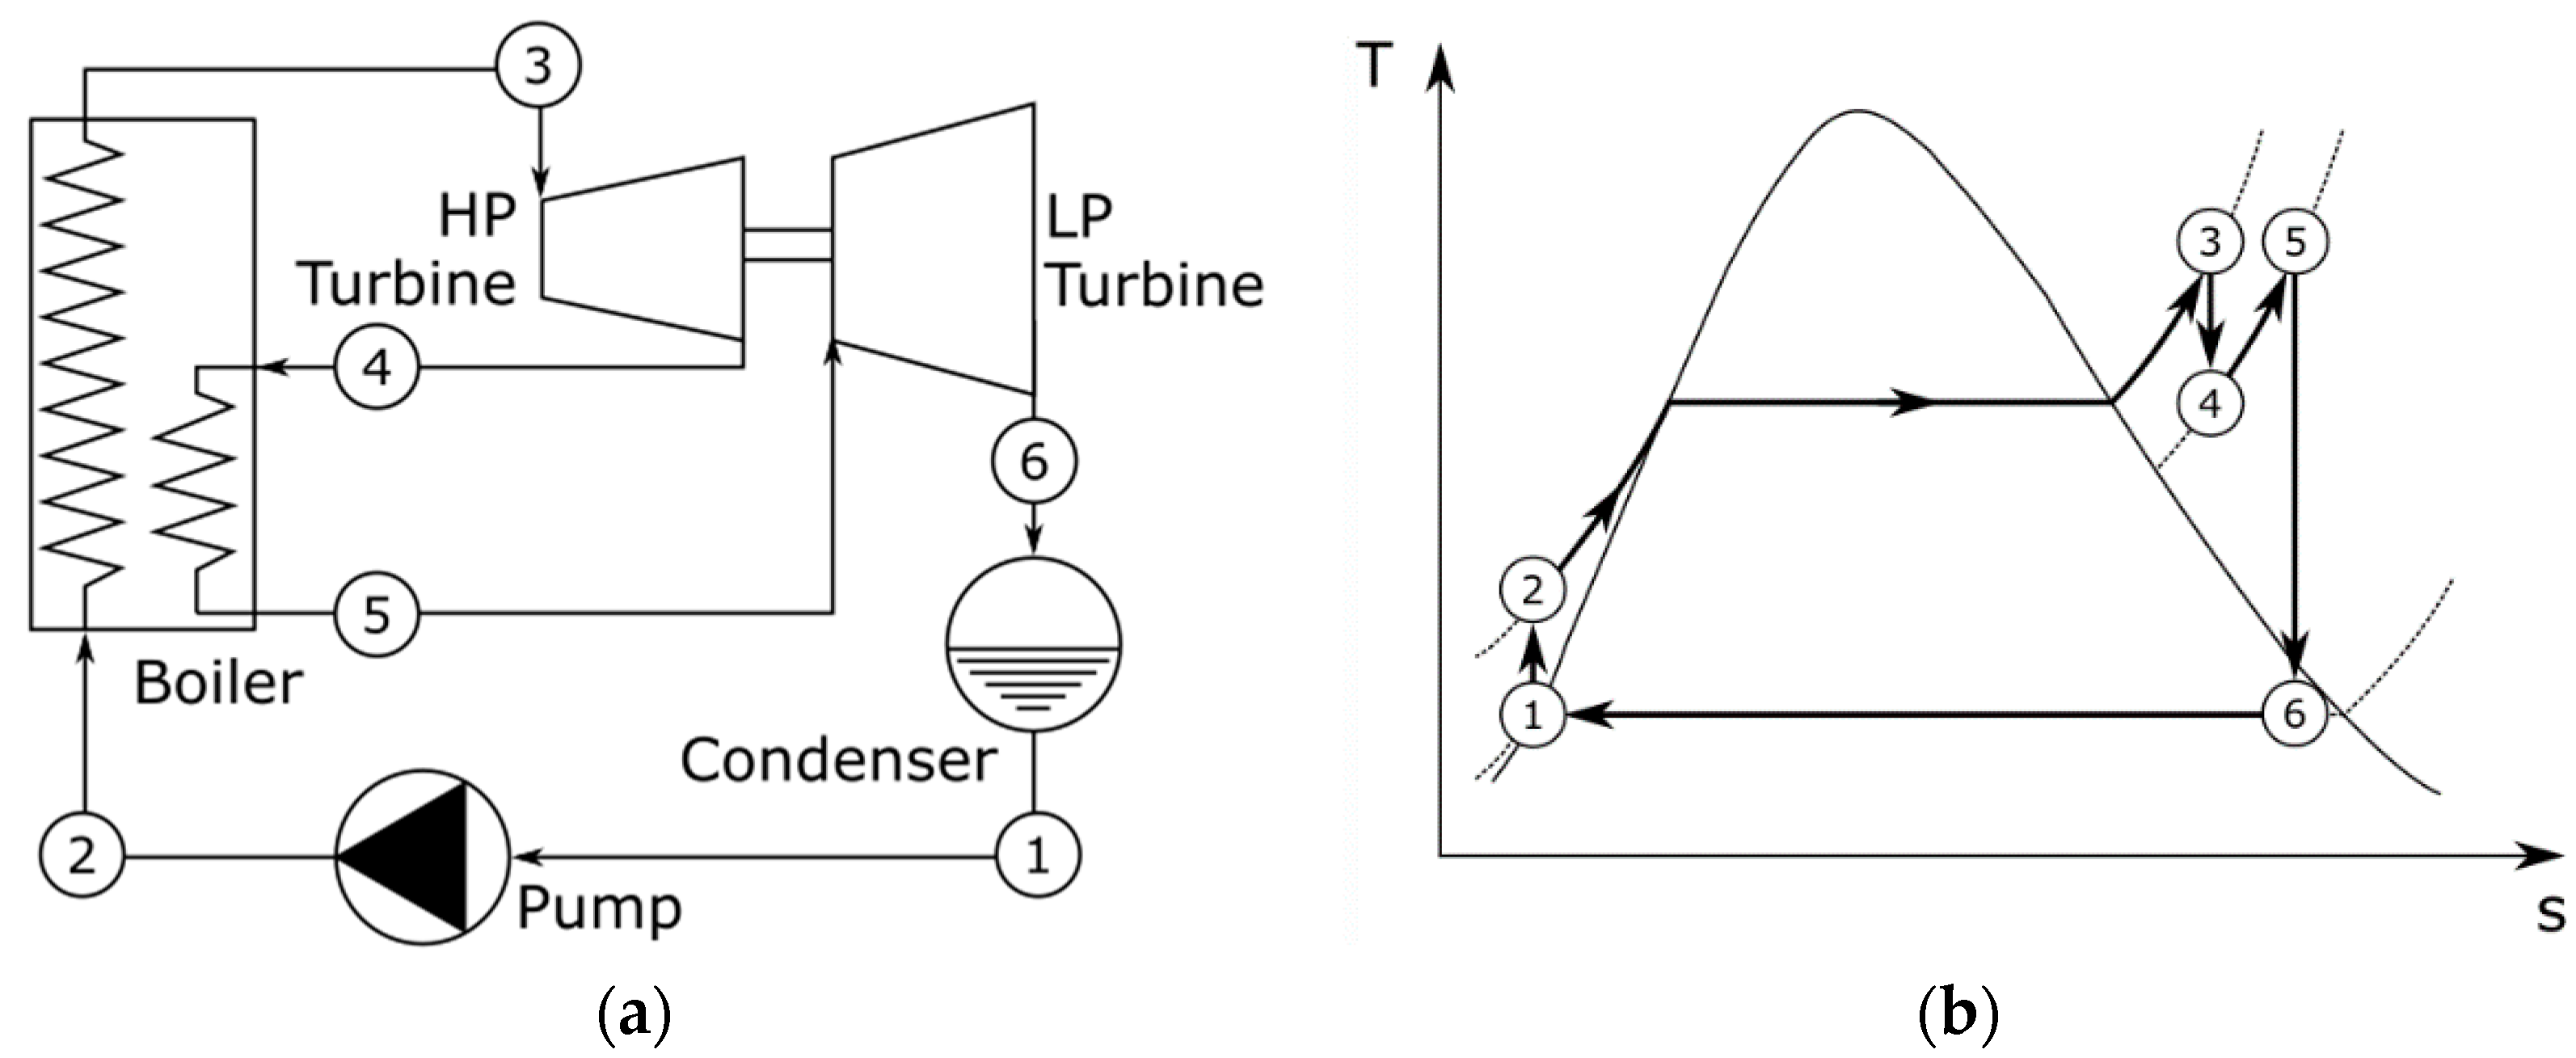
The Rankine cycle with reheating helps to reduce the humidity content in the turbine steam, especially at the lower pressure stages. It is very similar to the simple Rankine cycle but includes the reheating of the turbine steam at an intermediate expansion point (4–5). Not only is it helpful to improve steam quality, but it also increases the cycle efficiency due to a higher output power [35]. Figure 14 shows a flowchart of the cycle with the added reheating process and the T-s diagram.

2.4.3. Regenerative Rankine Cycle

Regenerative Rankine cycles arose as a way of increasing the boiler feedwater temperature, so that the cycle efficiency increases as a consequence of a higher heat absorption temperature in the boiler. This preheating is achieved by extracting steam from the turbine and using heat exchangers. Although part of the output power of the turbine will be lost, this loss is small in comparison with the benefits obtained by preheating in terms of the global cycle efficiency. Additionally, preheaters help to degas the feedwater flow, reducing oxidation and corrosion of the equipment. For these reasons, regenerative Rankine cycles are found in almost all thermal power plants in the world. Heat exchangers may be open or closed, but there is at least one open preheater to degas the feedwater flow [36].
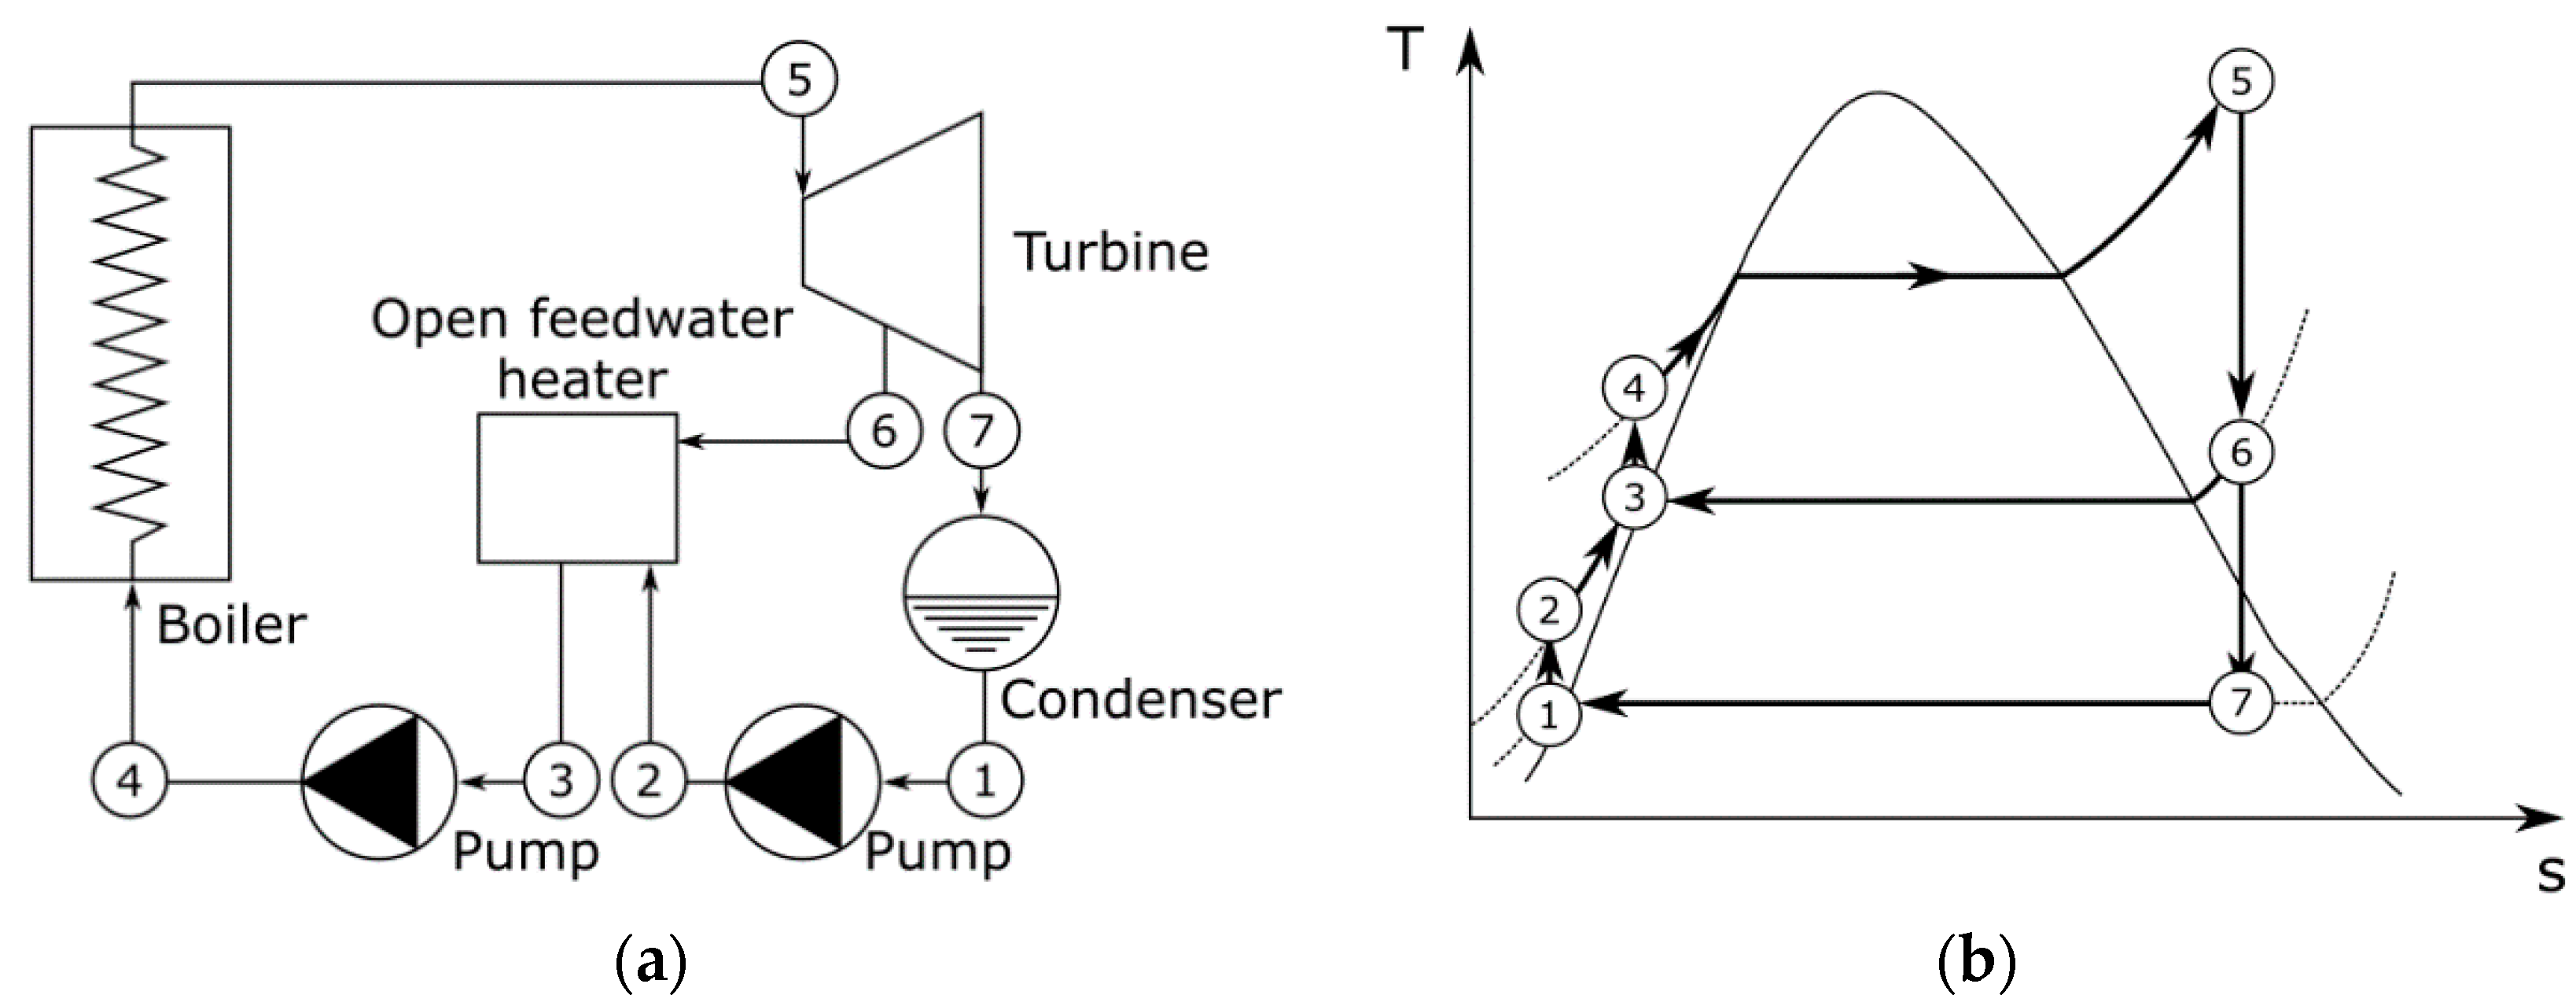
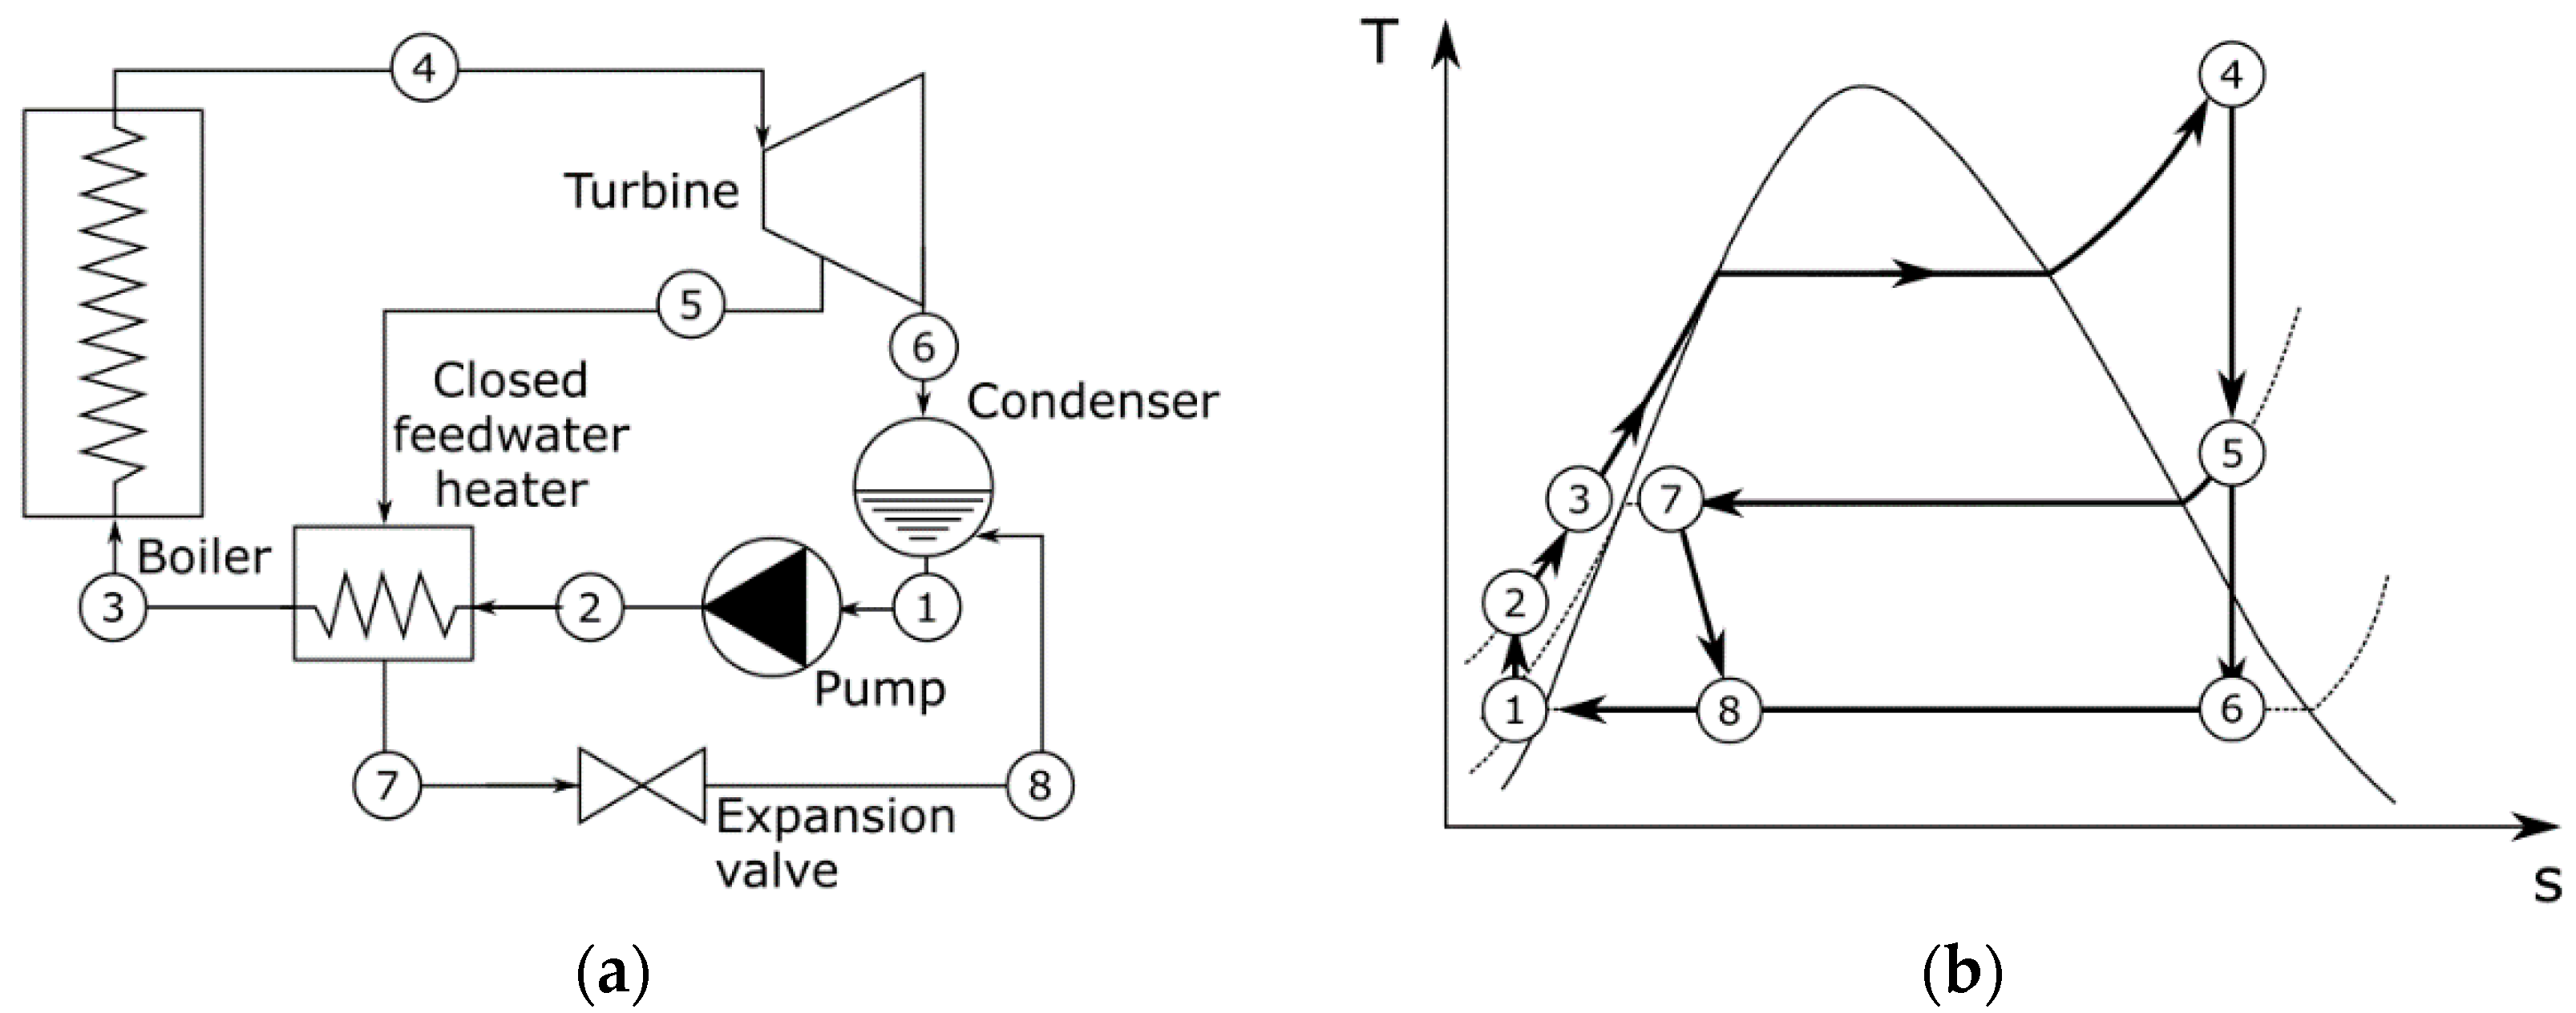
Figure 15 shows the flowchart of the cycle and the T-s diagram of the regenerative Rankine cycle with an open feedwater heater. This heater preheats the feedwater (2–3) using the turbine bleeding at (6). The regenerative Rankine cycle with a closed feedwater heater is shown in Figure 16. In this case, the heater preheats the feedwater (2–3) using the turbine bleeding at (5). The remaining outlet of the closed heater must be expanded (7–8) and is then reinjected into the cycle at a lower pressure (8).

2.4.4. Increasing the Efficiency of Rankine Cycles

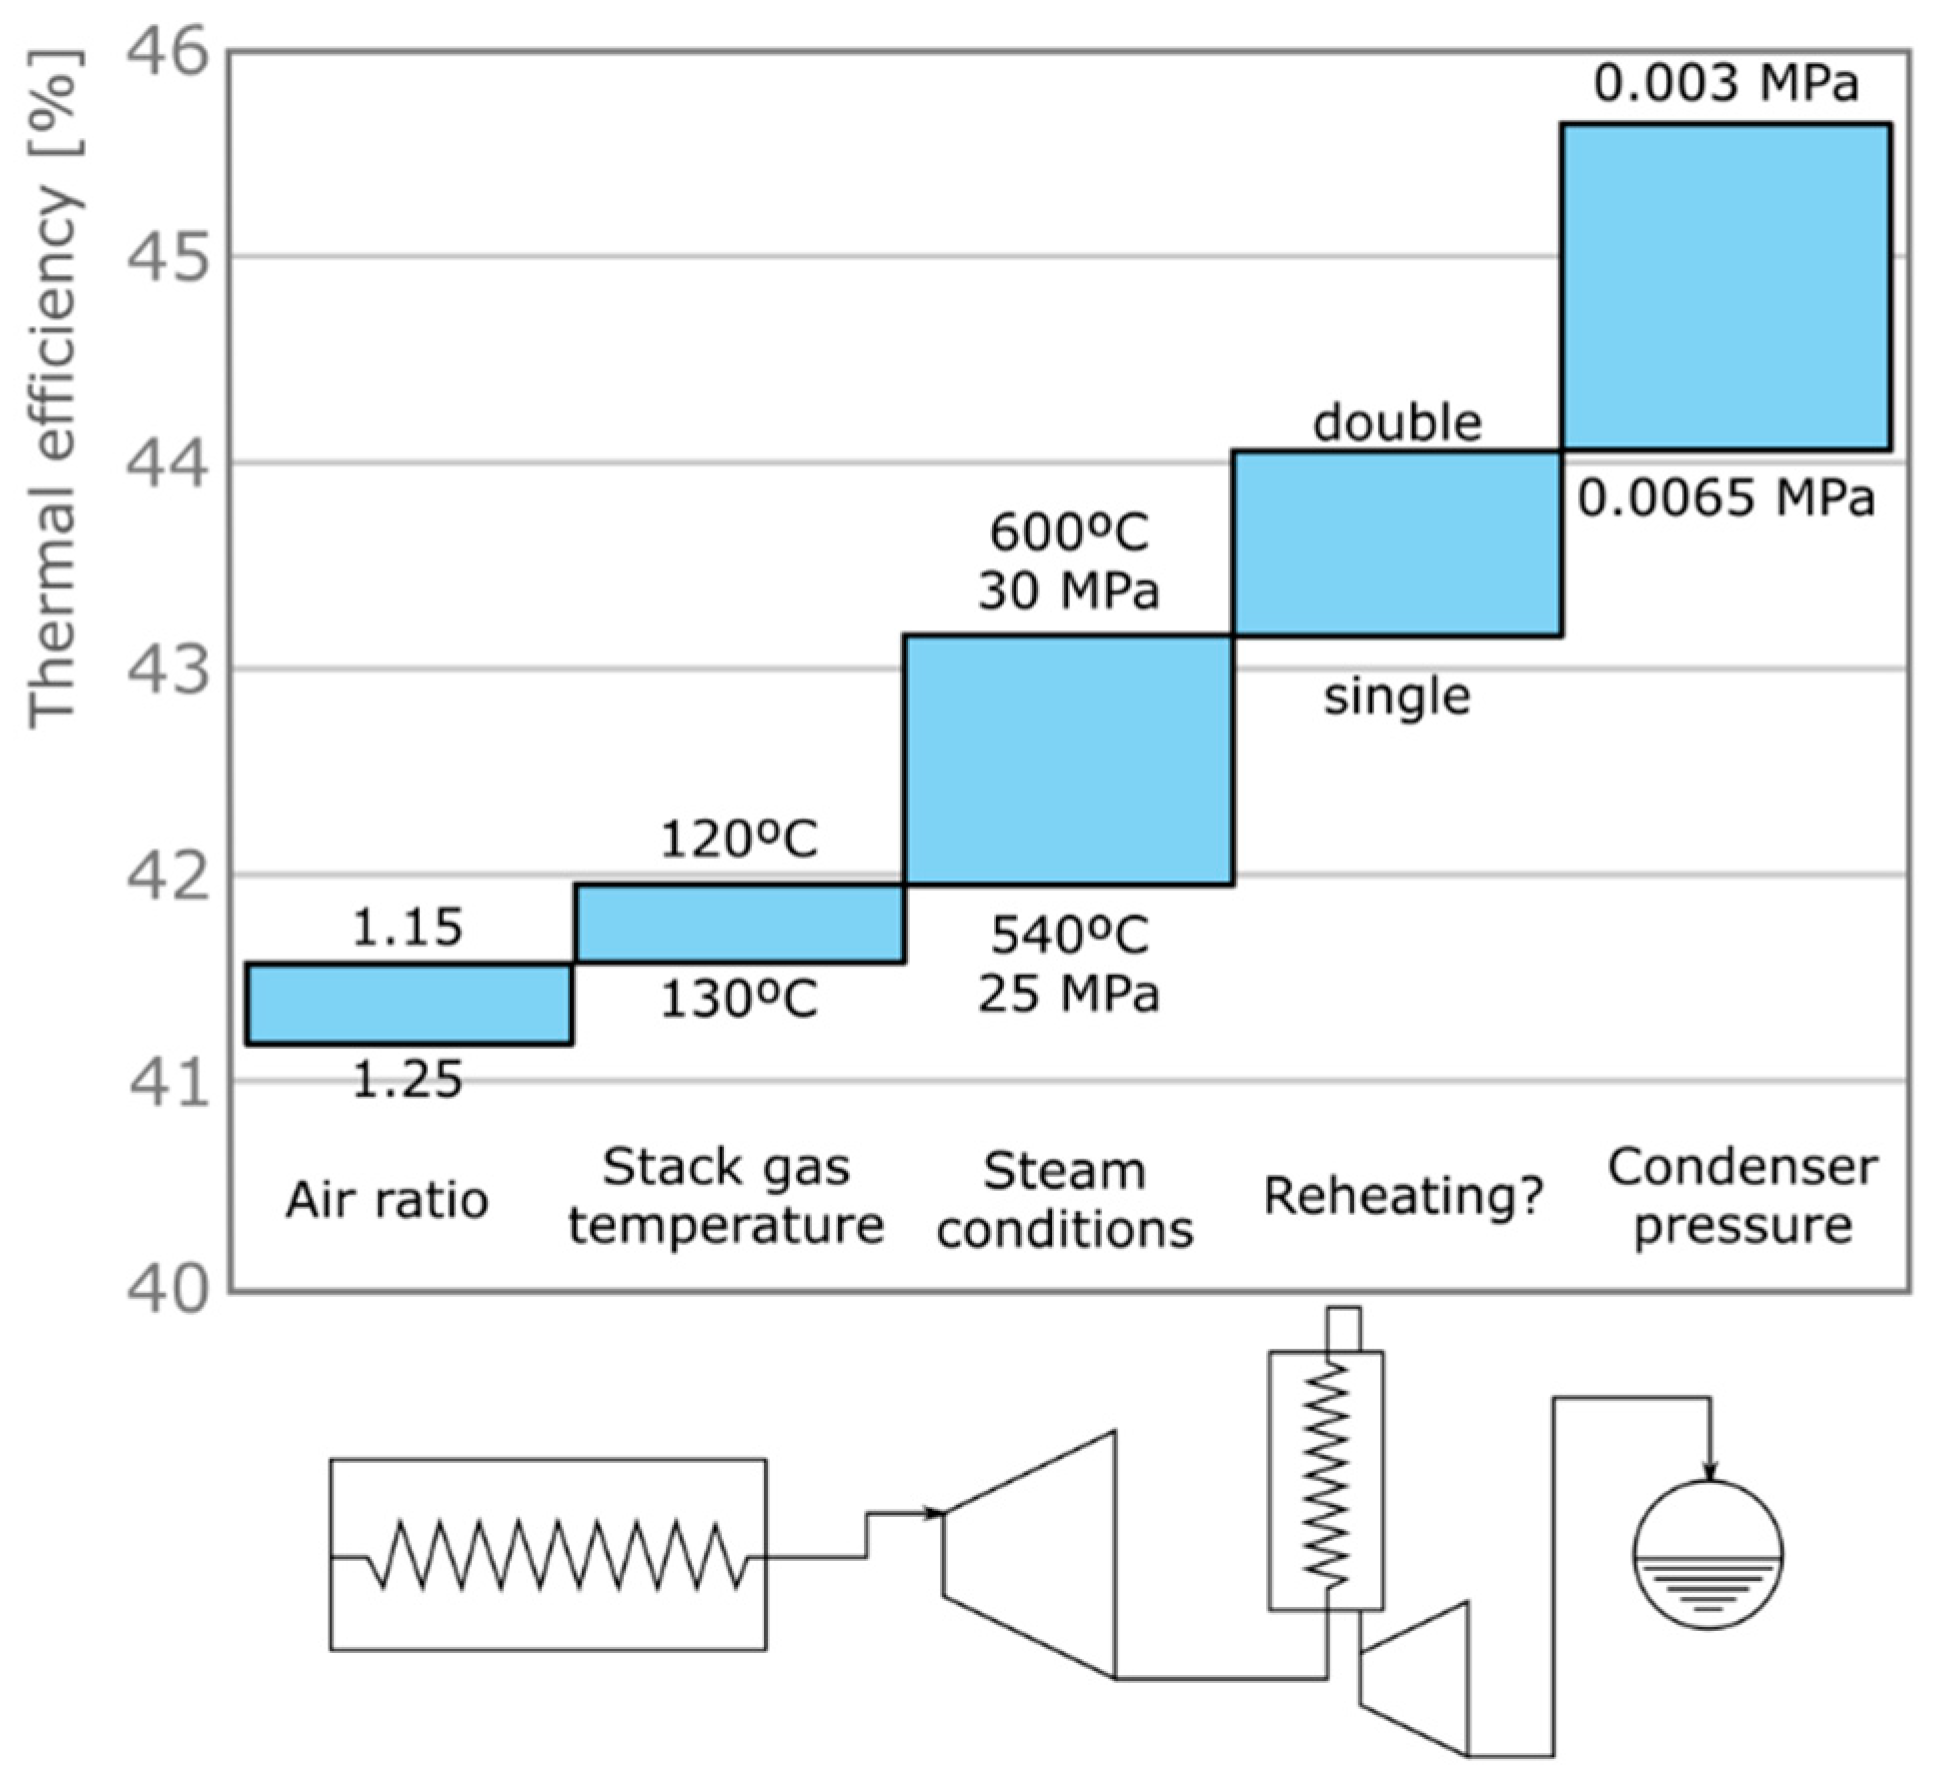
With just modifications of the original Rankine cycle such as reheating and regeneration combinations, higher cycle efficiency values, lower fuel consumption values and a reduction in operational costs and carbon emissions may be reached. Meana-Fernández et al. [37] studied possible modifications of a propulsion plant on a Liquefied Natural Gas (LNG) ship that would increase its efficiency by up to almost 34%, reducing fuel consumption to around 20 ton/day and avoiding the emission of more than 20,000 ton of CO2 per year. Beér et al. [29] quantified the impact of operating conditions and cycle modifications to increase the efficiency of a Rankine cycle power plant up to 45% and beyond: reducing the air ratio and the stack gas temperature to decrease waste gas heat losses, increasing the temperature and pressure of the steam from 25 MPa and 540 °C to 30 MPa and 600 °C, adding a double reheating instead of using a simple one, and decreasing condensing pressure from 6.5 to 3 KPa, as shown in Figure 17. Additionally, coal-firing power plants are the slowest in relation to other fossil fuel plants and have the highest emissions. In this context, Znad et al. [38] introduced a control strategy to speed up the startup process of a coal power station, resulting in savings in fuel and water while keeping the starting time as low as possible and retaining high efficiency and safe operation.
The hybridization of a Rankine cycle with other power producing technologies is also useful in improving cycle efficiency and sustainability. Examples with biomass and thermophotovoltaic power generation are easily found in the literature [39]. However, if solar energy is concerned, control systems to account for weather variations must be considered [40]. In addition, if the integration of Rankine cycles with heat exchanger networks is necessary, algorithms like the one presented in [41] may be useful to find the optimal configuration.

2.4.5. Critical and Supercritical Rankine Cycles

With the use of materials that are more resistant to high pressures and temperatures, the possibility of using supercritical and ultra-supercritical cycles is, nowadays, a reality. Nikam et al. [42] presented a thermodynamic model of a 660 MW supercritical coal-fired plant in India. Despite their advantages, ultra-supercritical cycles require specific management and monitoring to reach a dynamic and stable response due to their large loads and the perturbations that they can cause in the electric network [43]. In addition, they operate under a non-stationary regime, mainly due to load fluctuations and the particularities of coal as fuel [34,42,44]. Therefore, they are exposed to multiple failures that must be solved quickly. Algorithms, such as the one developed by Wu et al. [45] for the detection of failures in an actual ultra-supercritical coal-fired power plant of 1030 MW (26.08 MPa and 605 °C) improve conventional monitoring processes. The algorithm was able to predict boiler and pulverization failures without the need for previous information.
A review on modeling and control of supercritical and ultra-supercritical power plants may be found in [46]. Haddad and Mohamed [47] compared three modeling approaches for a supercritical once-through generation unit, finding that the physical model was superior for physical interpretation and stability studies; whereas, neural network models were the most accurate for black box modeling and linearized state-space models were the most suitable for the design of linear controllers. In this context, Al-Momani et al. [48] used the Grey Wolf Optimizer technique to model a supercritical power plant. Draganescu et al. [49] developed a model to predict plant behavior and calculate future inputs. Fuzzy-neural network methods have proven useful to model ultra-supercritical cycles of up to 1000 MW [50]. On the other hand, physical models, such as the boiler model presented by Deng et al. [51], the parameter identification work performed by Haddad et al. [44], or the simulation model developed by Kumar et al. [52], help to identify the physical effects arising in the power cycles. Dynamic analyses, such as the analysis performed by Wang et al. [53], show that steady-state models tend to underestimate the coal consumption rate during load-up and overestimate it during load-down processes. Yang et al. developed a numerical model for the dynamic analysis of a circulating fluidized bed [54] confirming this fact. Condition monitoring techniques for electrical equipment, specifically, for transformers, generators and induction motors were evaluated by Han et al. [55]. The performance of the data-drive system is fundamental to increase the useful life of power plants and reduce maintenance costs [56]. Finally, [43] developed model predictive control (MPC) technology for the optimization of operations in a power plant of 1000 MW (26.15 MPa, 605 °C) to reduce operating costs and energy consumption.

2.4.6. Organic Rankine Cycles (ORCs)

The study of possible replacements for water in a Rankine cycle has been considered since the first patent of Thomas Howard in 1826 using alcohol or ether [57]. From that moment, several replacement options, such as naphtha [58], were studied. The Organic Rankine cycle (ORC) refers to the use of organic working fluids: ammonia-water in Campbell engines, sulfur-dioxide by Henry E. Willsie, ether by Frank Shuman or methyl chloride by Romagnoli [57,59]. A review on ORCs for micro-cogeneration systems and their current challenges has been performed by Pereira et al. [60].
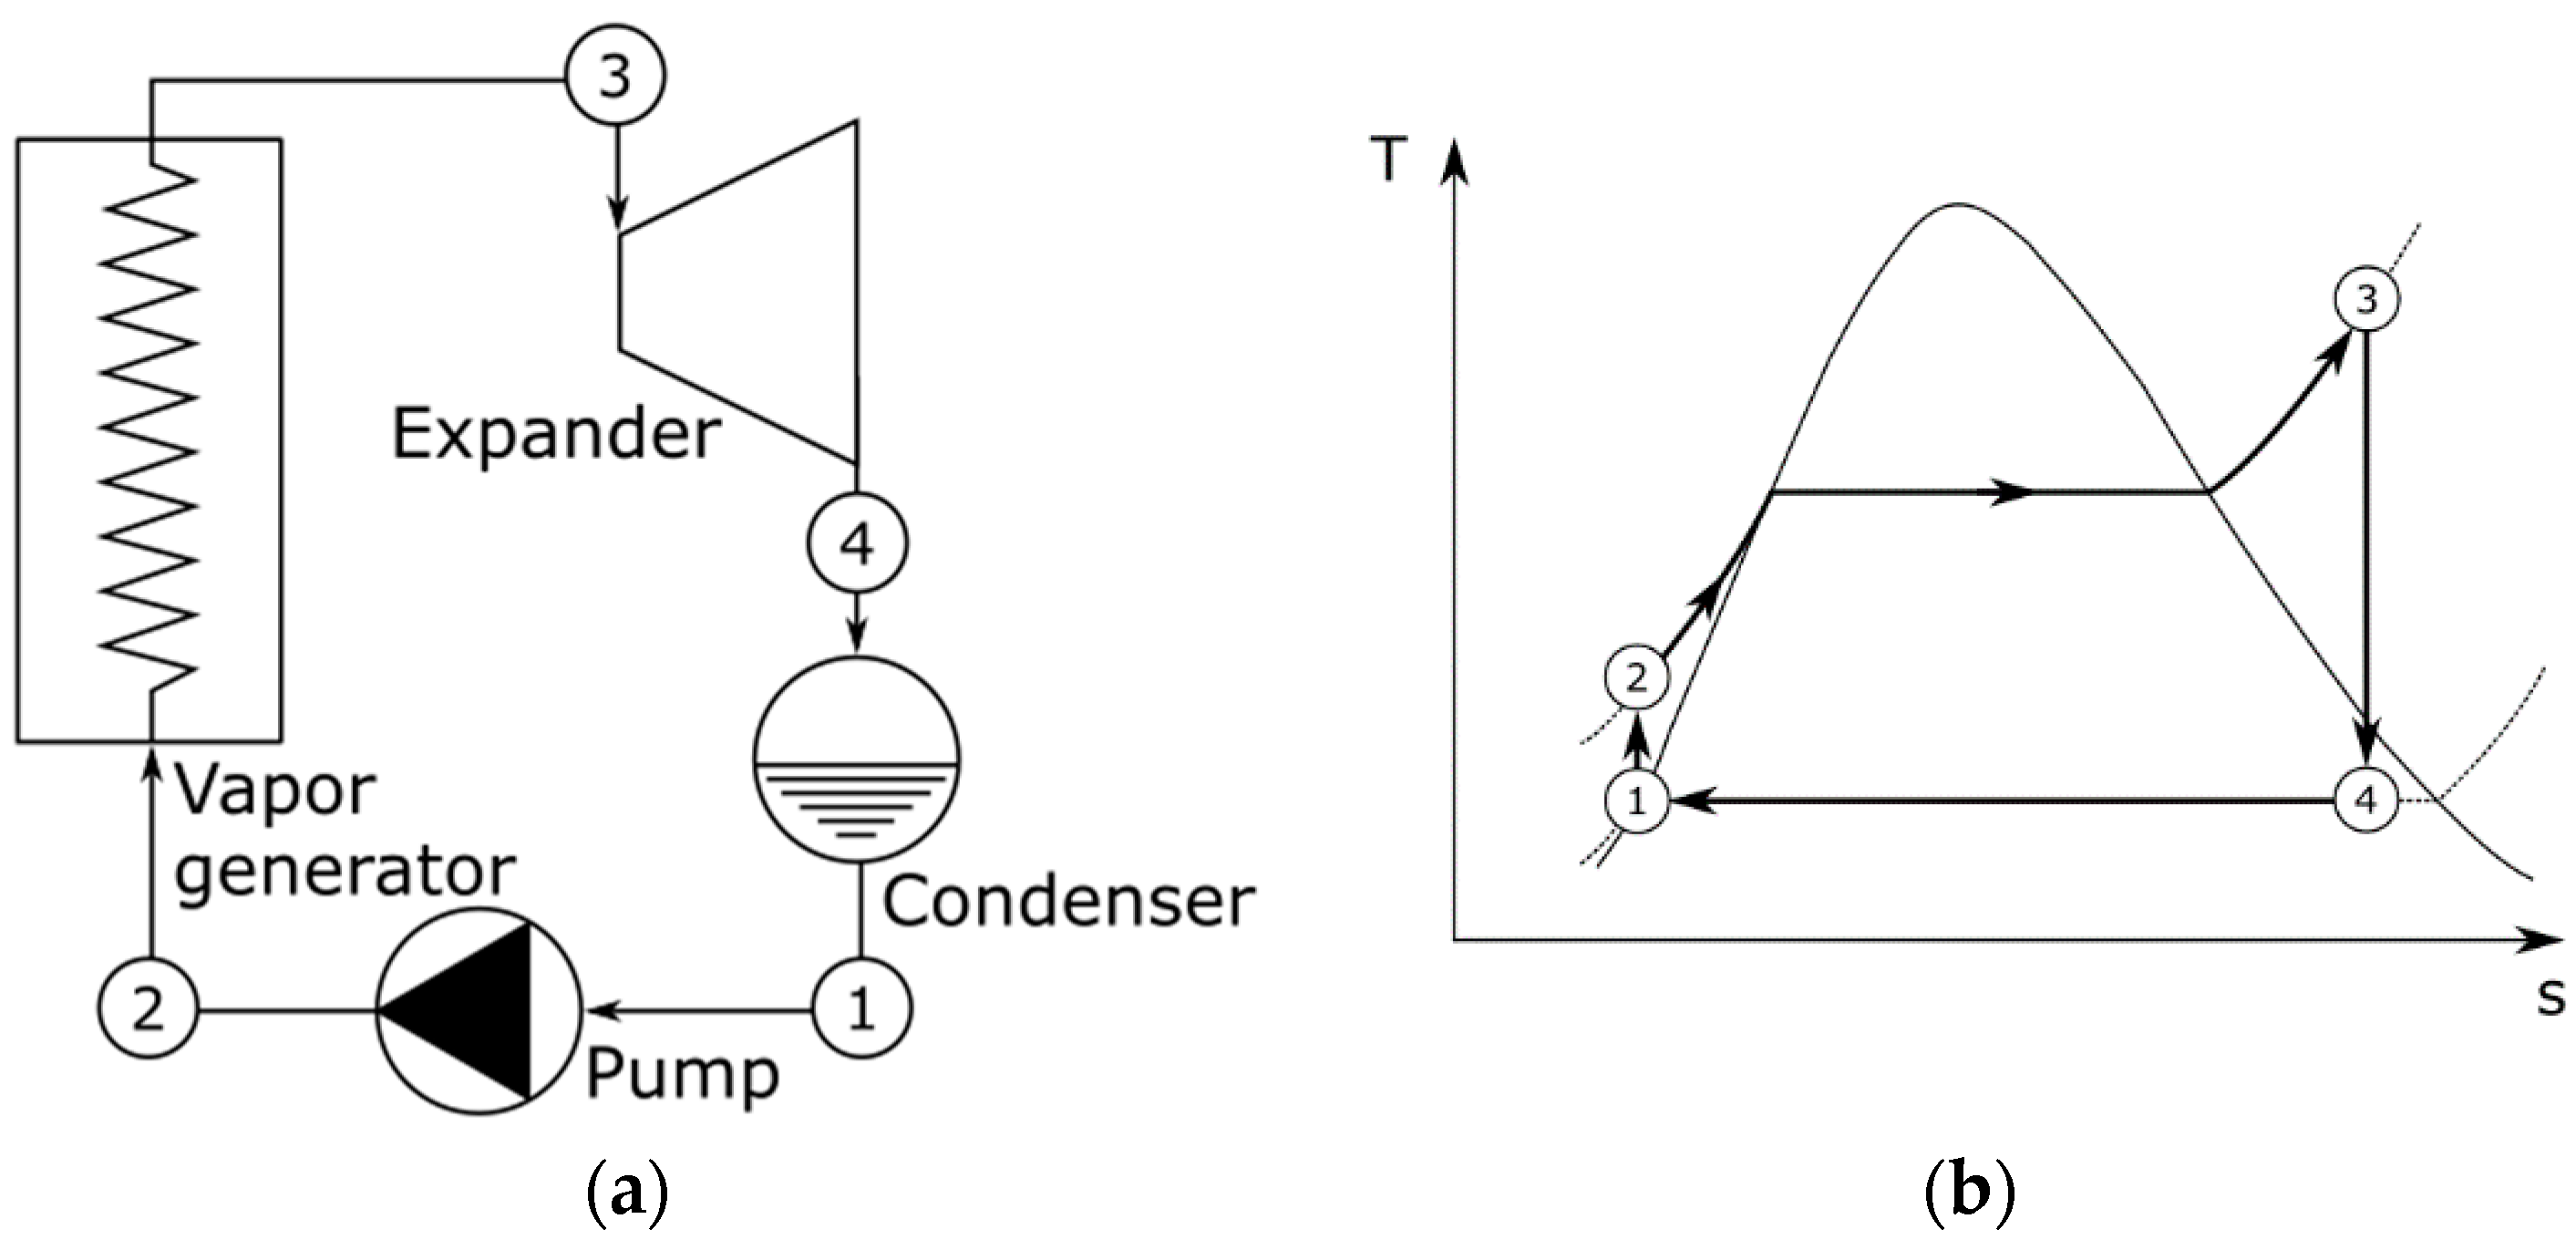
Figure 18 shows the main components and the T-s diagram of an ideal ORC. The organic fluid is compressed (1–2) and then is evaporated (2–3) in a heat recovery vapor generator (HRVG), which takes heat from an external source. The expander is fed with this superheated vapor, producing useful power and reducing the pressure of the vapor (3–4). The vapor finally passes through a condenser, closing the thermodynamic cycle (4–1). A review of modeling approaches and tools for the simulation of ORCs may be found in [61].
ORCs have the capability to work with low-grade thermal sources, such as low-enthalpy geothermal energy or solar energy, enabling the possibility of increasing the sustainability of power production cycles [62]. A comparison of waste heat recovery systems, with a focus on ORCs may be found in [63], and a review of cycles and fluids for low-grade heat recovery is available in [64]. Waste heat may be used just for electricity production, or to provide hot water and space heating as well. Yazawa [65] achieved electricity generation at 12% efficiency on the MW scale at around USD 4/W with a payback period below one year and a half.
Different layouts of ORC cycles may be found in [62]: regenerative ORC, simple organic flash cycle, ORC with two-phase expanders, cascade ORC, etc. An assessment of working fluids, thermal resources and cooling utilities for ORCs may be found in [66], alongside the commercial status and future prospects. As ORC technology may use almost any kind of fuel, hybridization is also possible, for example, the biomass retrofitting of solar powered ORCs [67]. These authors reported an increase of 5% in the efficiency of the plant, of about 3500 h in the annual operation duration, with a cost of energy of EUR 109/MWh. Concerning power production, there are several power plants in the range of MW, but there is still a need for a decrease in the specific price of small-scale ORCS below EUR 3500/kW and EUR 2500/kW in the power ranges of 5–10 kW and 10–100 Kw, respectively [60,68]. Two of the bottlenecks are the working fluid selection and the expander design. Regarding the expanders, experimental results on the high-speed flow at their outlet were collected by Nematollahi and Kim [69]. Eyerer et al. [70] developed a test rig to evaluate the application of an ORC with combined heat and power production for geothermal applications, finding that novel architectures could increase thermal efficiency by almost 10% and net electricity production by up to 9.4%.

2.5. Absorption Power Cycles

This section collects power cycles in which the absorption/desorption of different substances by water is used to generate different mixtures at different points of the cycle, benefiting from the thermodynamic changes caused by concentration differences.

2.5.1. Kalina Cycle

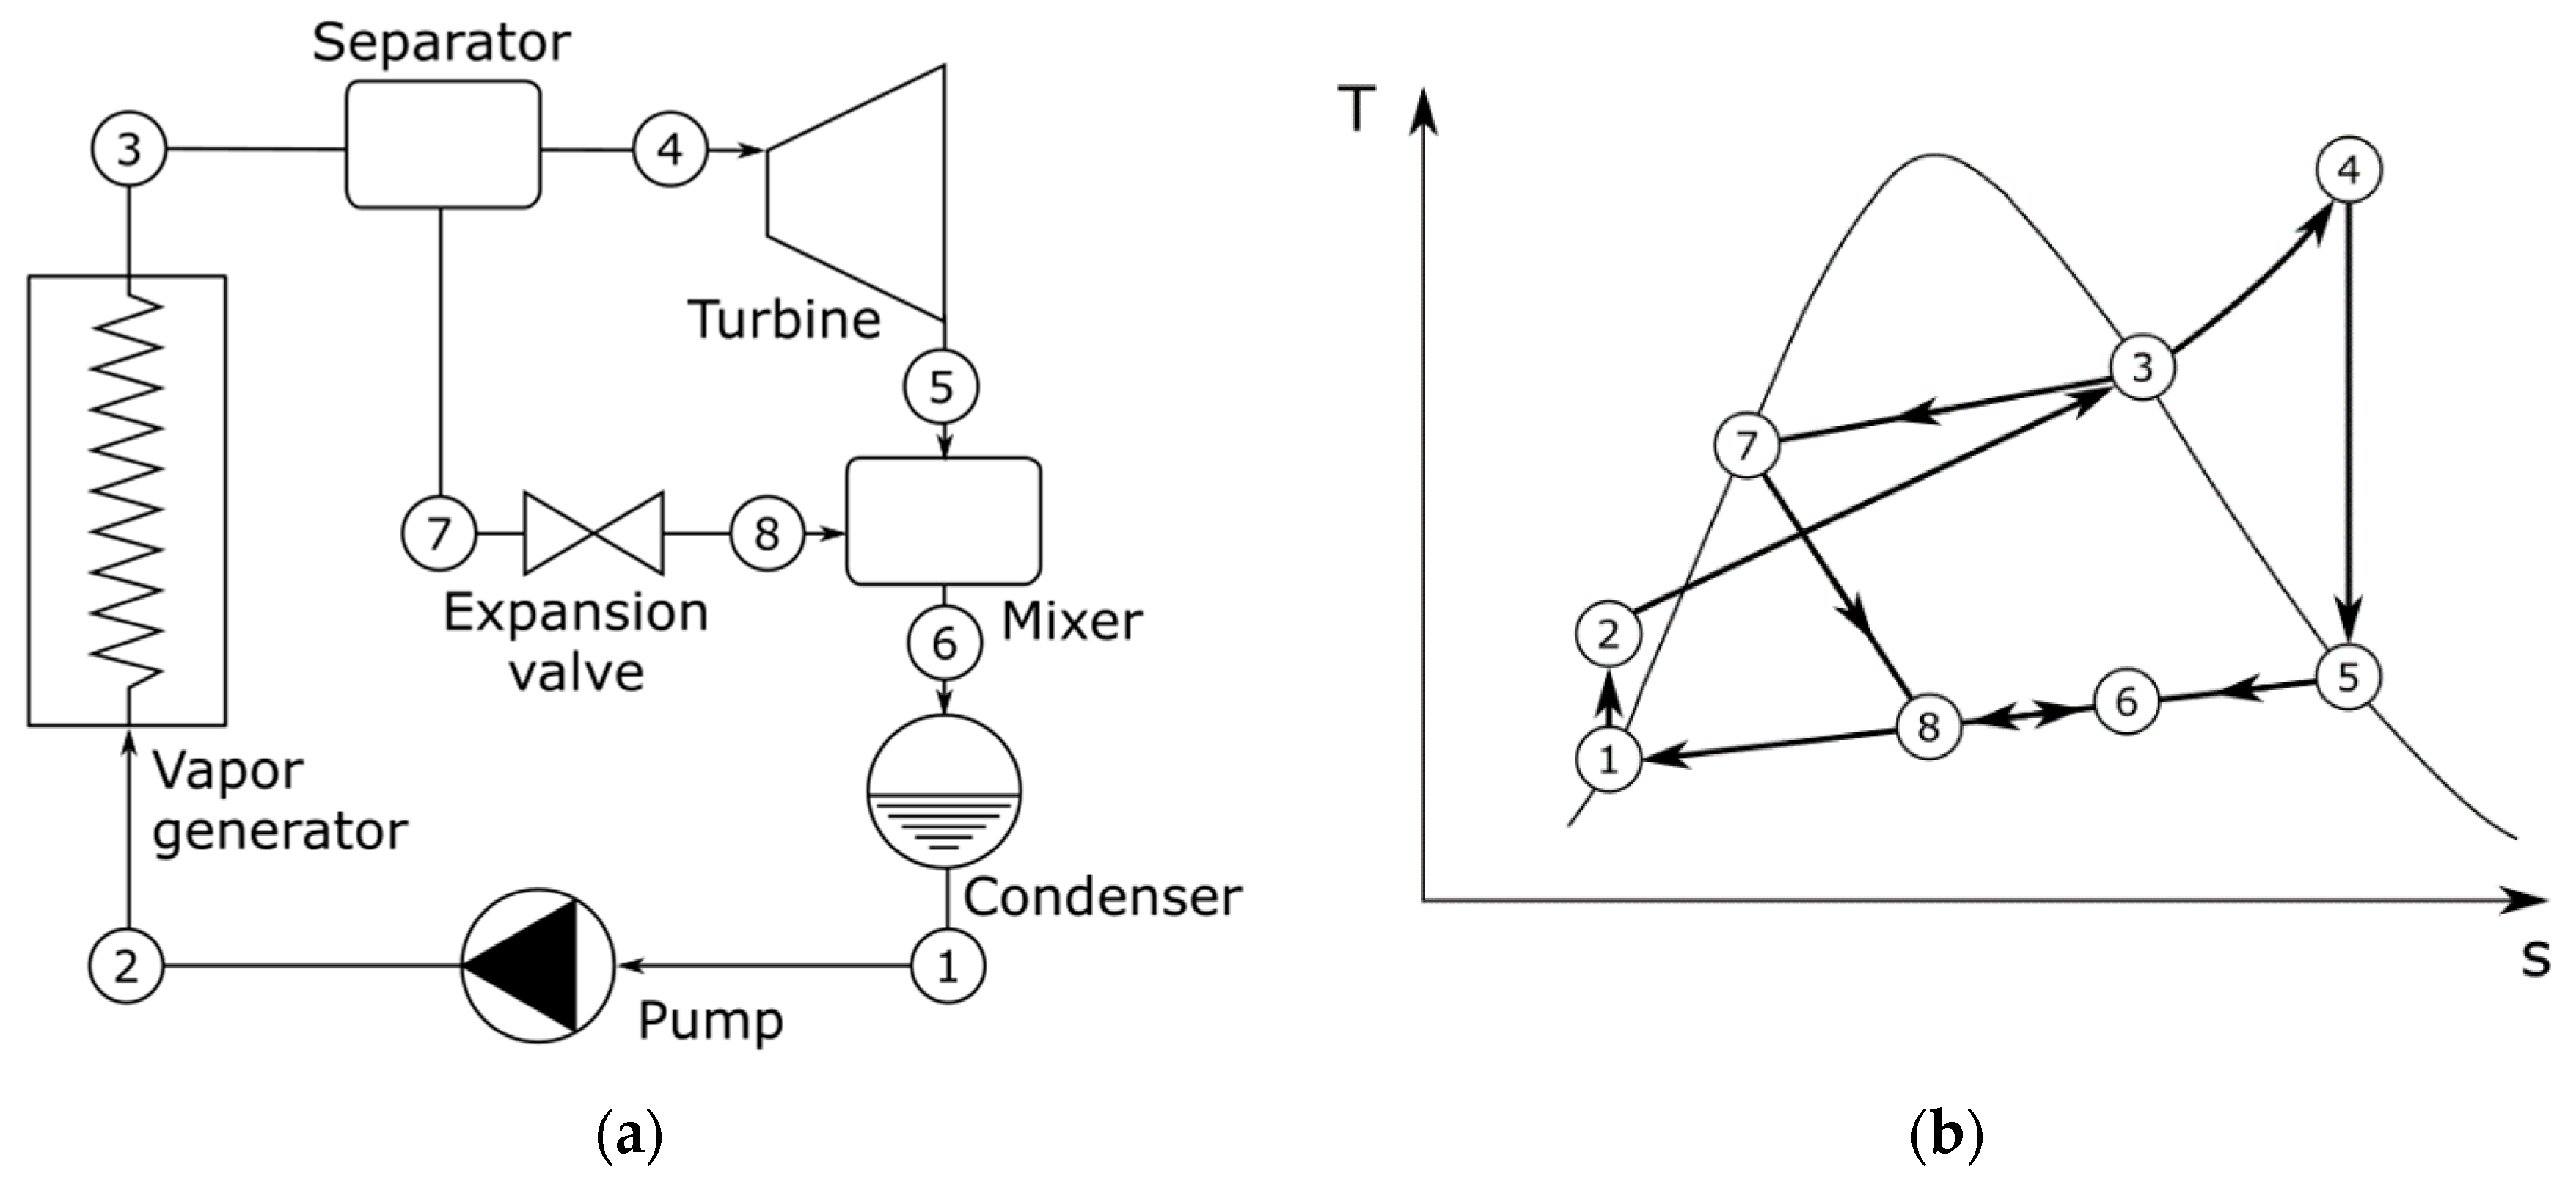
The Kalina cycle uses a mixture of water and ammonia as the working fluid [71]. This leads to temperature changes during the phase changes of the mixture, allowing an increase in the temperature at which heat is absorbed and a decrease in the temperature at which heat is released thus increasing the thermal efficiency of the cycle with respect to a Rankine cycle. The cycle works similarly to a Rankine cycle, as shown in Figure 19, with a pump increasing the pressure of the fluid (1–2), a boiler heating it up (2–3), a turbine producing useful power by expansion (4–5) and a condenser to close the loop (6–1). A separator is placed before the turbine to increase ammonia concentration (3–4) before the expansion and to boost the effect of the mixture. The lean mixture from the separator is expanded (7–8) and then mixed with the turbine outlet (5–8–6), so that the original mixture is recovered before the condenser. Due to the low condensing temperatures of ammonia, this reinjection is necessary to increase the condensing temperature and ensure the viability of the cycle. There are modifications of this cycle that can be performed to increase its efficiency, such as preheating the mixture before the boiler with the turbine outlet stream in a regenerator, but it has been found difficult to further increase its efficiency.
The Kalina cycle can work with any kind of fuel, similarly to the Rankine cycle. Modi et al. [72] performed a thermoeconomic optimization of a Kalina cycle for a central receiver concentrating solar plant at a high temperature. Nevertheless, the Kalina cycle proved to be less efficient and with higher LCOE than the state-of-the-art Rankine cycle for nearly all the considered cases. On the other hand, Król and Krajačić [73] proposed a Kalina cycle coupled with a biogas Brayton cycle with an efficiency of 28%. Factors influencing the economics of the Kalina power cycle and situations of superior performance may be found in [71].

2.5.2. Hygroscopic Cycle

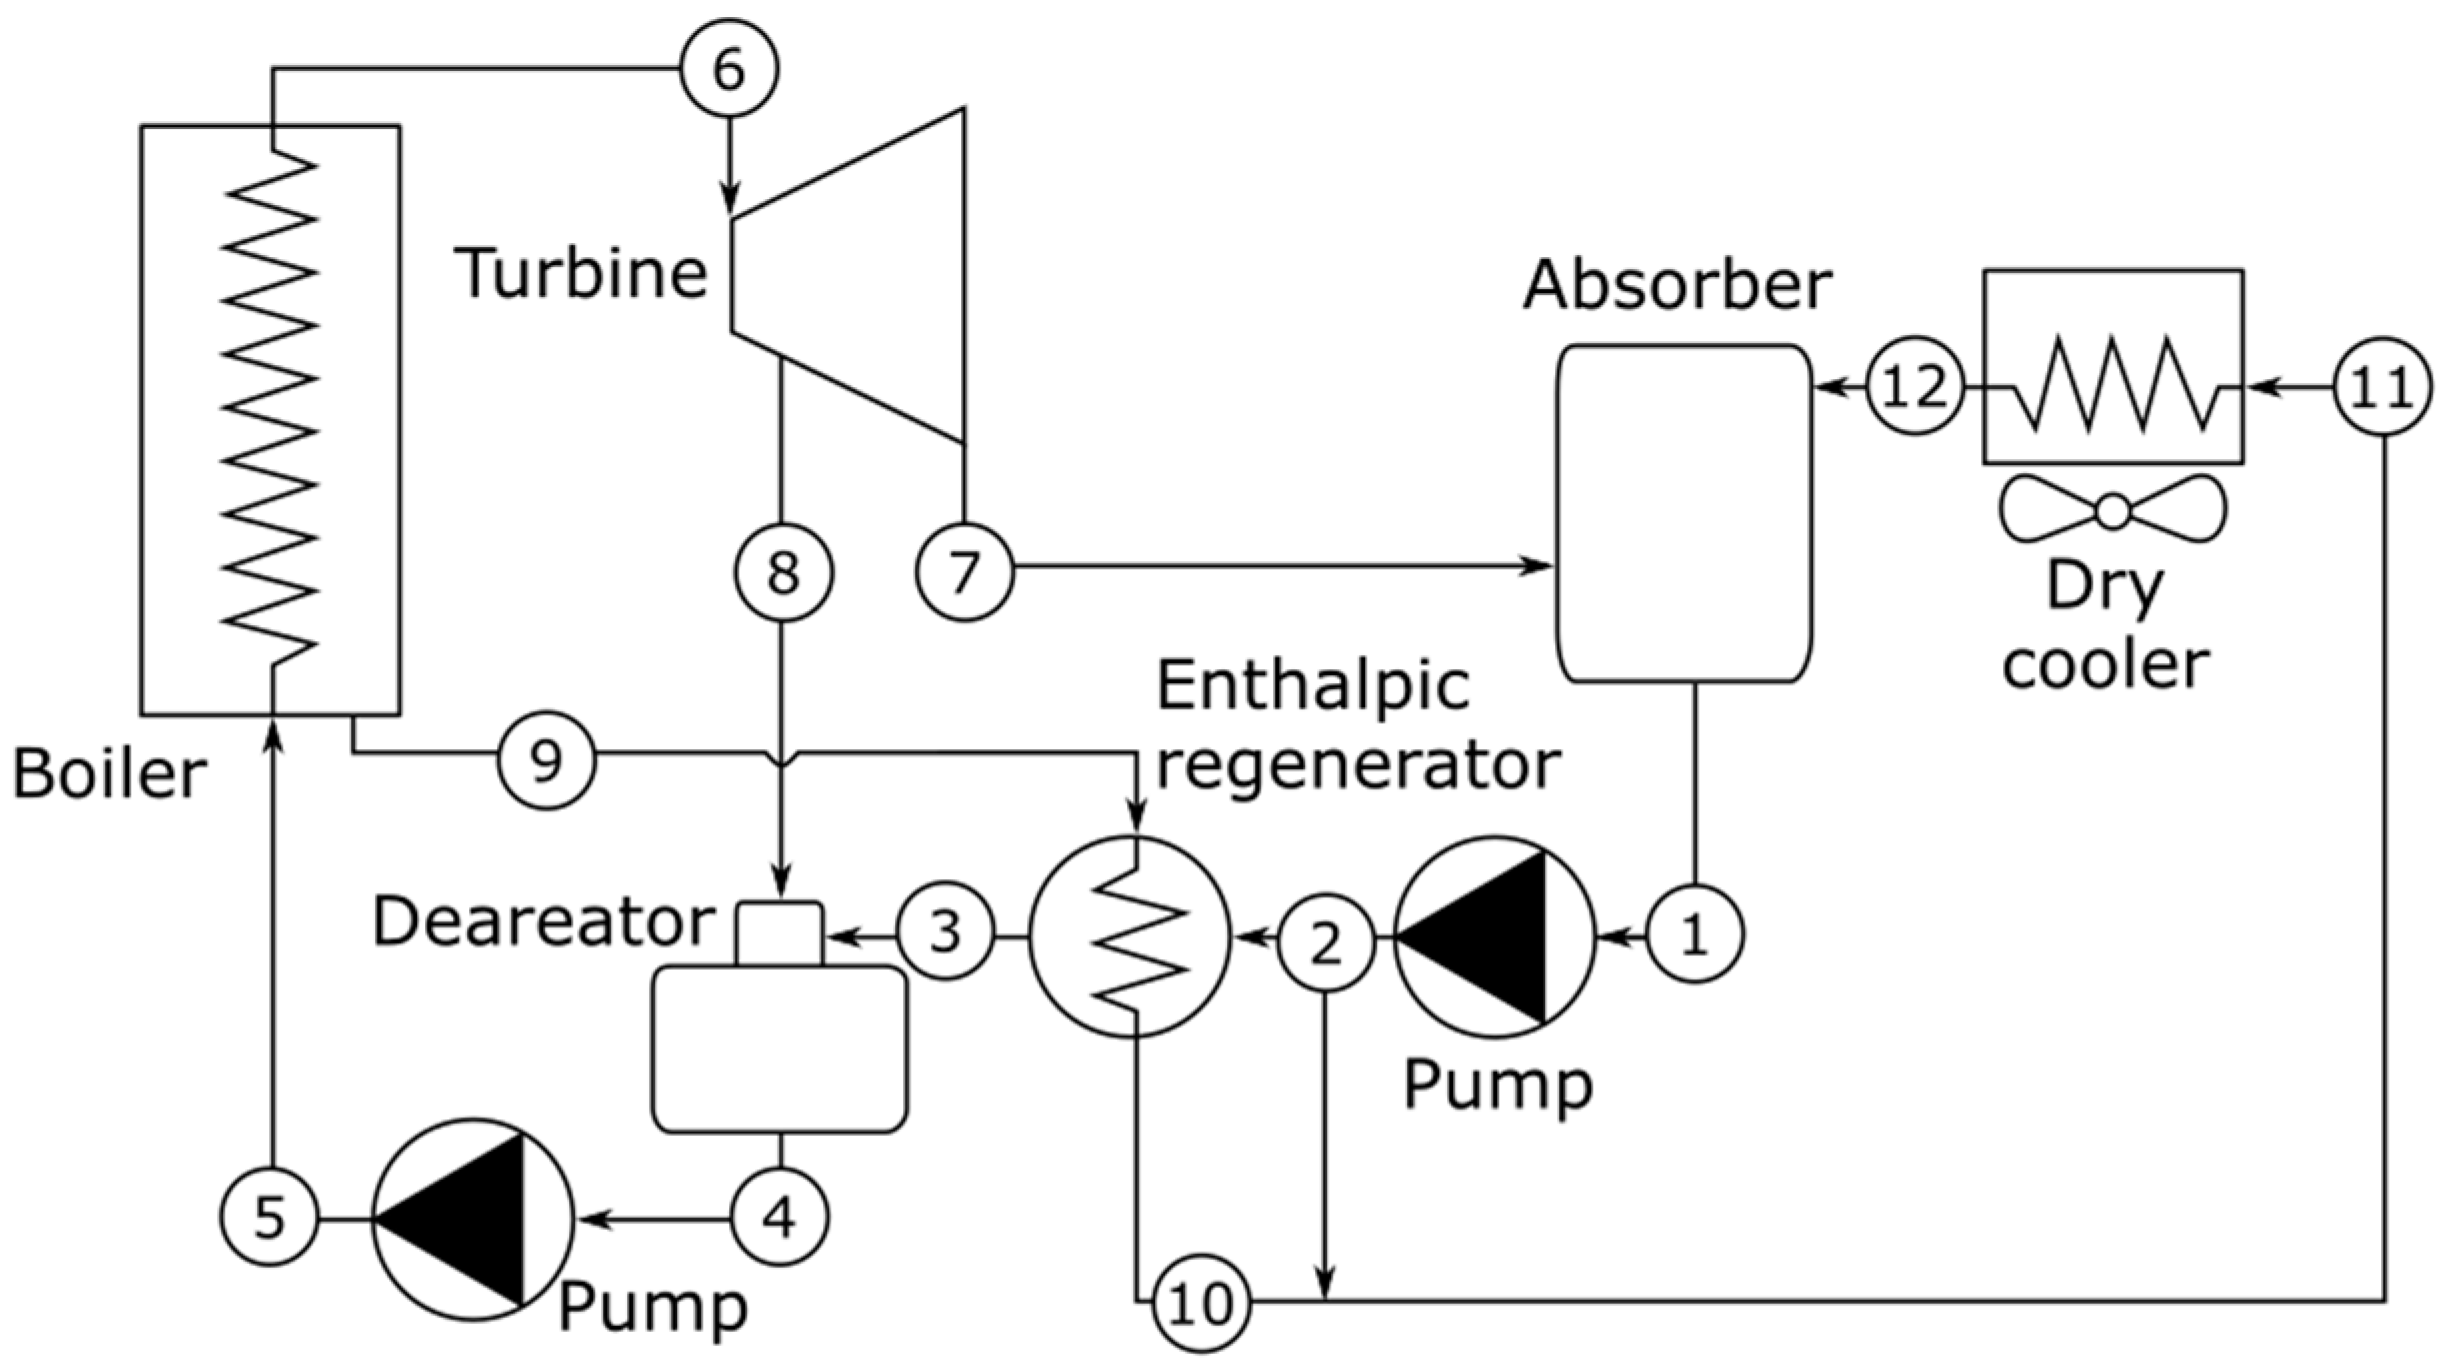
The hygroscopic cycle developed by Rubio-Serrano [74] introduces hygroscopic salts into a Rankine cycle. The equipment diagram is shown in Figure 20. A condensation process occurs in a steam absorber instead of in a condenser, with the steam being cooled by its absorption by hygroscopic compounds (7–12–1). The hygroscopic salts mixed with the water are desorbed and purged from the boiler (9), so clean steam may flow to power the cycle turbine (6–7). The boiler blowdown stream is used to preheat the feedwater (2–3), resulting in an increase in the efficiency of the cycle. It must be noted that the elimination of the condenser avoids the use of cooling water, allowing the possibility of implementing this cycle in regions with low or no access to water. Additionally, the heat may be released with dry air coolers (11–12) to higher-temperature surroundings as with traditional Rankine cycles [74]. This allows condensing temperatures to rise over 13 °C for the same condensing pressure as in a Rankine cycle. The boiler works similarly to that of a Rankine cycle, so any type of fuel (fossil, nuclear or renewable) may be used.
The optimal concentration of hygroscopic salts has been also studied by Rubio-Serrano et al. [75], who found that about 40% in the cooling reflux resulted in the maximum efficiency of the cycle with respect to a standard Rankine cycle. Finally, by controlling the salt concentration it is possible to control the cooling temperature for a given pressure [76], so it is possible to adjust the cycle to changing ambient conditions without modifying the power plant facility. This technology is bound to have an important role, as it avoids large water consumption and is able to refrigerate the cycle working fluid in zones with high-climate severity. Currently, the state-of-the-art technology is a 25 MW biomass plant in Córdoba (Spain).

2.6. Combined Cycles

When two cycles work at different temperature regions, the residual heat from the one working at the highest temperatures may be used to power the cycle working at the lowest ones. One of the most typical examples is the combination of the Brayton cycle and the Rankine cycle, but other options may be considered.

2.6.1. Typical Combined Cycle: Brayton & Rankine

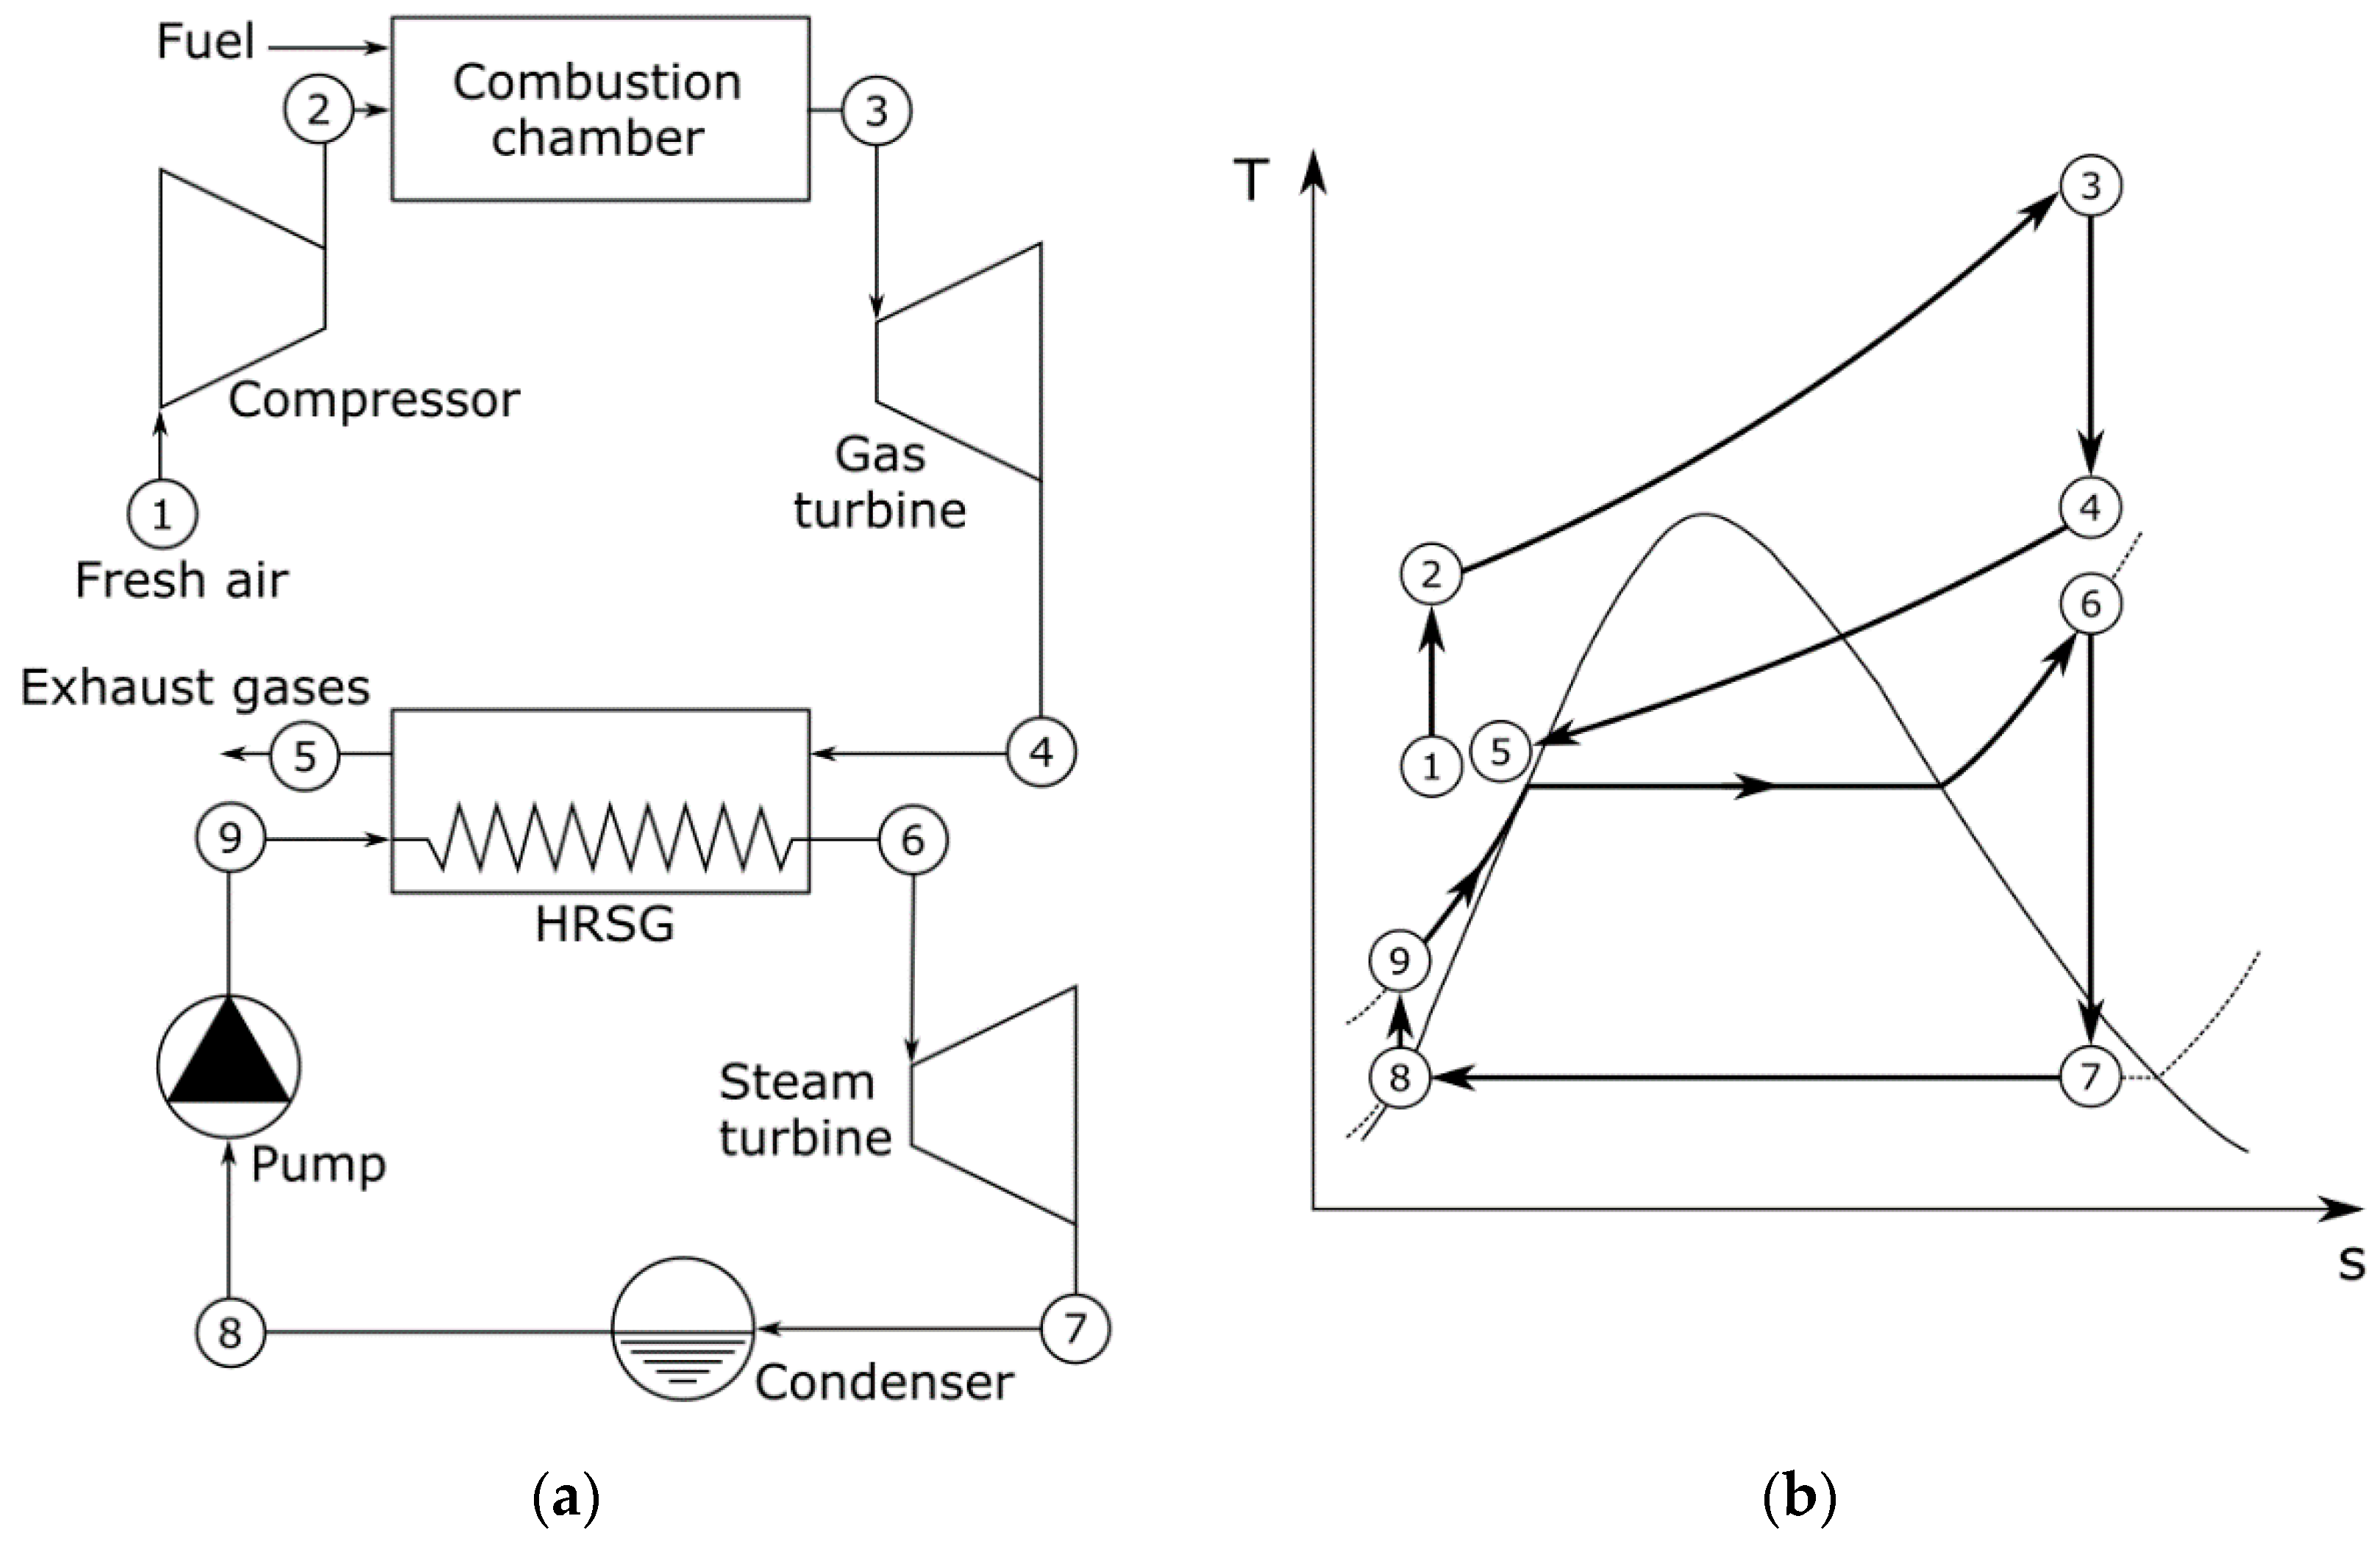
The Brayton cycle works at a much higher temperature than the Rankine cycle. This means that the exhaust gases from the Brayton cycle turbine may be used to generate steam to power a Rankine cycle. For this purpose, a heat recovery steam generator (HRSG) is placed to link both cycles, as shown in Figure 21. The hot gas enters the HRSG (4) and heats up the water in the economizer until the water reaches saturation conditions. Afterwards, the water passes through the evaporator and finally through the superheater of the HRSG, reaching the conditions of the main steam (6). As the heat released into the environment is reduced substantially, so is the increase in net power and the efficiency of the combined cycle. Efficiencies of up to 50% may be achieved, but the investment cost is substantially higher than for simple cycles.
Figure 22 shows a detailed view of the HRSG, where the economizer, evaporator and superheater may be distinguished, alongside the evolution of the temperature in the HRSG for both fluids as a function of heat transfer. In the design of a combined cycle, the temperature difference between the gas flow and saturated water, called the pinch point, is one of the key parameters. Additionally, the temperature at which the liquid water reaches the economizer must be also set, defining the so-called approach point as the temperature difference between the subcooled water reaching the economizer and the gas flow.
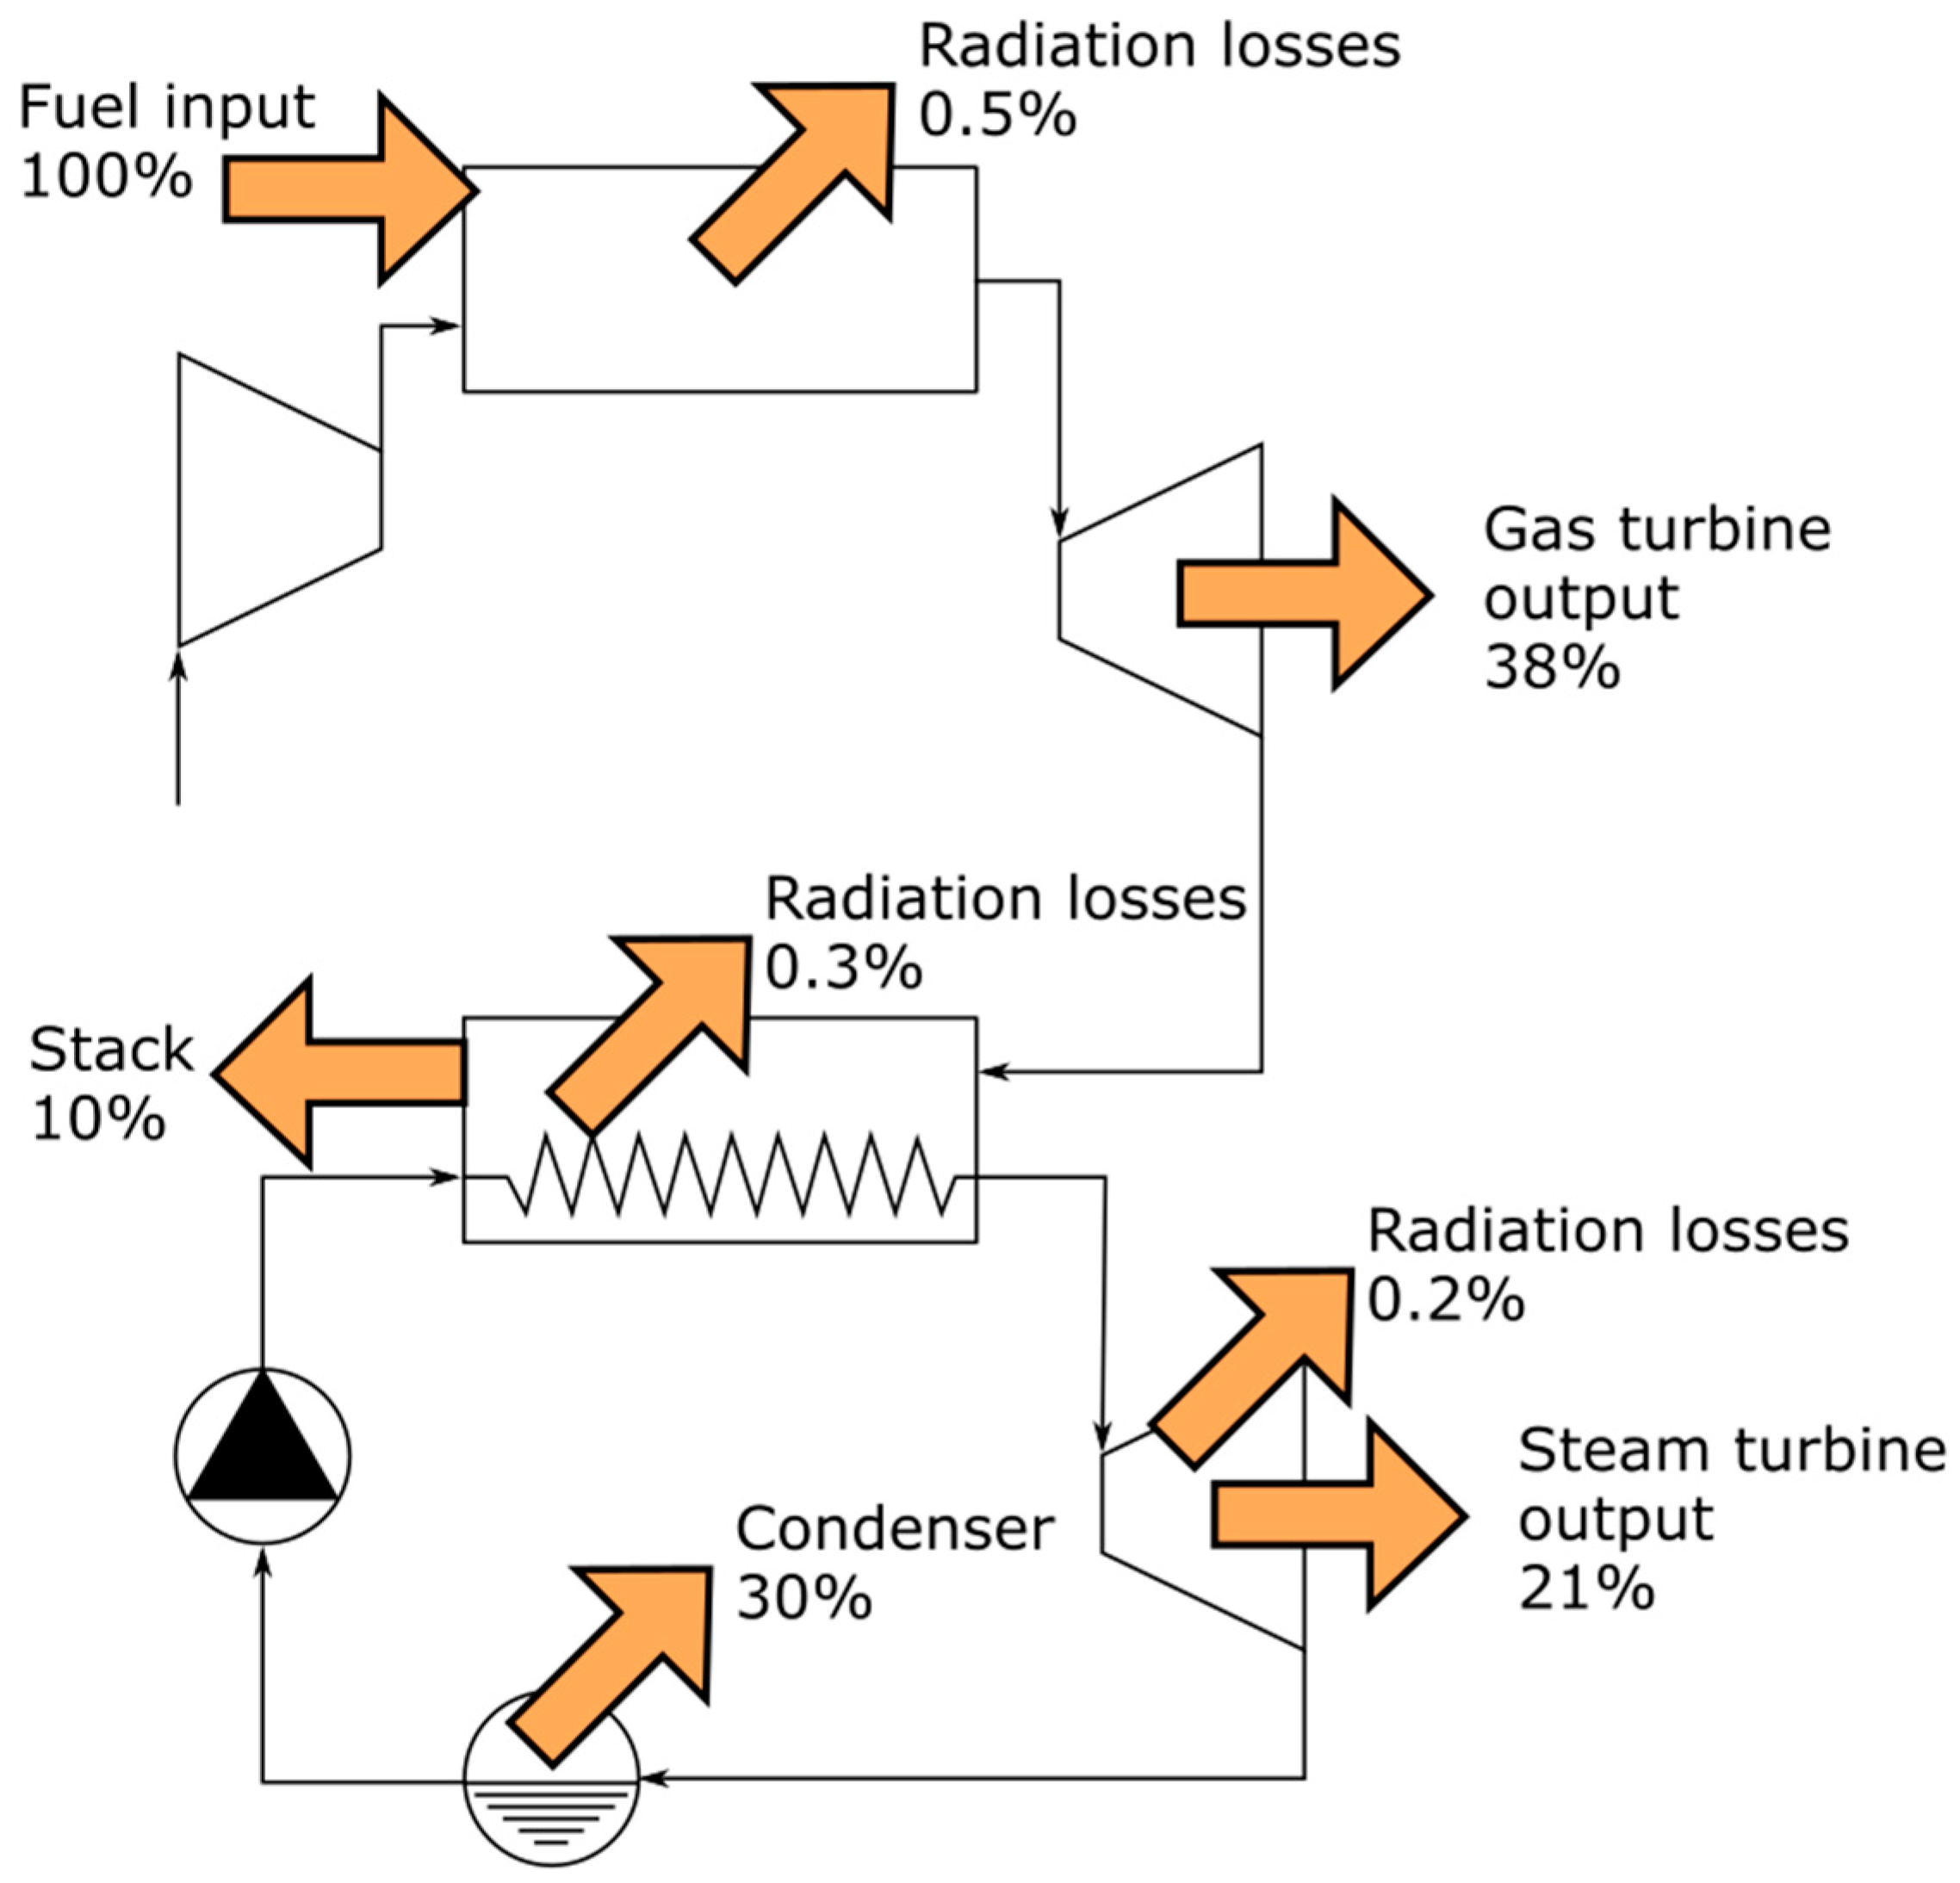
Figure 23 shows the energy balance inside a typical combined cycle, where the order of magnitude of the power produced by the gas and steam turbines, the heat rejection in the condenser and the energy losses with respect to the incoming fuel energy may be observed.
The limitations of combined cycles are purely technological and related to the performance of the materials chosen to build the cycle equipment in terms of their resistance to high temperatures, as Carnot factors between 0.82 and 0.85 have already been reached [77]. Nevertheless, different energy sources, such as solar energy, may be used to power the cycle, reducing fuel consumption or increasing its power [78]. Combined cycles may be also coupled with renewable energy sources, reducing their carbon footprint and giving stability to the natural variability of renewable energies. For instance, Zaversky et al. [79] introduced compressed air energy storage, which is filled when cheap off-peak electricity is available, which is used to power the compressor of the Brayton upper cycle of the combined cycle. The importance of using solar energy as a substitute for fossil fuels has been described in [80] and is not only for the purposes of power generation but also to obtain thermal energy for several industrial processes. The obtained energy may also be stored for its later use [81]. Ortiz et al. [82] proposed using high-temperature energy storage in a solar combined cycle in Seville (Spain), with an overall plant efficiency over 45% (considering off-design performance). Another example is the flexible power and hydrogen production from integrated gasification combined cycles proposed by Szima et al. [83], which resulted in CO2 avoidance costs in the range of EUR 24.9 to 36.9/ton. Due to its ability to continue operating and sell hydrogen to the market when there is enough sun and wind, an increase of 6–11% in the annual rate of return is possible, provided there is a successful establishment of hydrogen technology. A bibliometric study on integrated solar combined cycles based on data analytic tools may be found in [84].
Amirante et al. [85] proposed a small-scale power plant able to generate electricity and thermal energy from solid and gaseous biomass for rural electrification and built a 45-kW prototype. Residues from agriculture and farming may be treated to obtain new products and/or generate energy, as performed by Bryant and Coats [86], who studied the life cycle and performed pilot studies on the conversion of a wastewater treatment plant to a water resource recovery facility with recovery of carbon (for energy and bioplastic production) and phosphorus (for agronomic uses), as well as the production of reclaimed water for its discharge. The potential of sustainable biogas production from biomass waste for power generation in Pakistan has been assessed by Yaqoob et al. [87], finding that almost half of the total power generation for 2018 could have been generated from this source.

2.6.2. Alternative Combined Cycles

The exhaust gases from a gas turbine may be also used by other options instead of a steam Rankine cycle. ORCs, supercritical CO2 cycles, or even centrifugal and axial turbines may be used as bottoming cycles. Ancona et al. [88] compared different alternatives, finding that the supercritical CO2 cycle showed higher efficiencies, up to 28%, than ORC, below 18%, but the investment cost was higher, preventing the investment in CO2 technology unless a high carbon tax value is present. Figure 24 shows the ranges of waste heat source power and temperature at which different technologies may be applied. It may be observed that, technically, all options are viable depending on the operating conditions. Due to the variability in economic and environmental policies, research in all technologies should not be disregarded.

2.6.3. Carbon Capture in Combined Cycles

Regarding environmental issues, power plants with carbon capture technologies are an interesting alternative, as they reduce the harm caused to the environment. Many power plants are experiencing retrofitting processes to capture CO2 after combustion [90]. However, the use of traditional indicators to assess their performance, such as LCOE or specific primary energy consumption per CO2 avoided (SPECCA), may result in unrealistic comparisons against renewable energy sources [91]. The use of such indicators averts additional costs of backup power for intermittent renewables to fossil generators, making renewables look unrealistically cheap compared to fossil power with carbon capture technologies. An approach to the tecno-economic assessment of power plants with carbon capture and storage including part-load operation is presented in [91] highlighting the usefulness of employing the traditional indicators (LCOE, SPECCA), as they are widely used and well-understood by scientists, the industry, and policy makers, but considering the issue of the comparison with renewables. Gatti et al. [92] compared different systems for post-combustion CO2 capture in natural gas fired power plants, finding that molten carbonate fuel cells were the best option, with a SPECCA of 0.31 MJ per avoided kg of CO2. Ferguson and Tarrant [93] proposed a configuration with a targeted 92% CO2 capture from the plant with molten carbonate fuel cells as well. Another technique for power production with integrated CO2 capture is chemical-looping combustion (CLC) in the gas cycle; however, its introduction limits the maximum achievable turbine gas temperature. A study by Khan et al. [94] studied the techno-economic viability of introducing an added combustor after the CLC reactors, which reduced CO2 avoidance costs to USD 60.3/ton with a reduction in energy yield of just 1.4%. The post-combustion CO2 capture may be predicted with different algorithms, such as that presented by Akinola et al. [95]; such models can be used to guarantee a stable and automatic operation of a post-combustion CO2 capture plant [96,97].

2.6.4. Goswami Cycle

The Goswami cycle [64], similarly to the Kalina cycle, uses a mixture of ammonia and water. This mixture, as shown in Figure 25, is pumped from an absorber (1–2), flows through two different heat exchangers for heat recovery and then goes to a desorber (3) where it is partially boiled and split into a rich ammonia steam (4) and a lean liquid mixture (10). A rectifier, using heat from the absorber outlet (2), increases the ammonia concentration of the steam (6), which is later superheated (7) and expanded (8) to produce power. The condensed liquid from the rectifier is injected back into the desorber (5). A refrigeration effect may be achieved by heating the turbine exhaust in a heat exchanger linked to the cold source (9). The turbine exhaust is then recirculated to the absorber, where it is mixed with the lean liquid mixture that was extracted from the desorber after it has been used to recover heat in the cycle (11–12). In the absorber, the original mixture is regenerated (1) after rejecting heat from the cycle.
A modification of the conventional Goswami cycle with a compressor used to increase the pressure at the turbine outlet was proposed by Njock et al. [98], attaining an energy efficiency of around 4% higher than the conventional cycle.
Currently, comparisons are being made in the literature between the Goswami cycle and other alternatives. Two cycles were compared to the original Goswami cycle by Rivera et al. [99] to increase the cooling effect by up to six times its original value; however, this was made at the expense of reducing the turbine power output down to 50%. The Goswami cycle has been also proposed as the bottoming cycle for heat recovery from low-grade thermal sources by Sayyaadi et al. [100], finding that it increased the power generation of the plant by 25% and the thermal efficiency by 8.4%, to greater values than an ORC or a Kalina cycle option. A similar study was performed by Ambriz-Díaz [101], who found that the ORC or the Kalina cycles were easier to integrate in a polygeneration plant, and that the ORC had better efficiencies and was more profitable from an economic point of view. Leveni and Cozzolino [102] compared a Goswami cycle with a cascade ORC for a geothermal application, finding that the Goswami cycle had an efficiency around 3% higher than the ORC and was cheaper. Colakoglu and Durmayaz [103] studied a triple combined cycle for multigeneration consisting of a Brayton cycle, an ORC and a Goswami cycle. They claimed an energy efficiency of almost 52%, with around 510 kg CO2 saved per hour. Finally, Shankar and Srinivas [104] compared a solar combined power and cooling cycle working with an ammonia-water mixture or a Li-Br-water mixture at different cooling water temperature values. The LiBr mixture showed better performance in terms of power, with a 0.86 utilization factor, than the ammonia mixture, with 0.32. Nevertheless, the ammonia mixture showed better properties working at lower temperatures, so they recommended it for industrial use where cooling requirements are below 0 °C, leaving the LiBr cycle for refrigeration and air conditioning systems.. Considering the disparity between the results in the literature, further research into the suitability of different bottoming cycles for combined cycles is desirable, considering the technical, economic and environmental factors, as well as the influence of the operating conditions.

3. Power Cycle Applications: Comparison of Performance and Environmental Aspects

The cycles most used in industrial applications and in the energy sector are the Rankine, Brayton and the typical combined cycle. Hence, special attention is paid to them, and data about the rated power ranges, usual pressure and temperature values and environmental aspects such as emissions and water consumption are shown.
A detailed comparison between gas and steam cycles using pulverized coal is presented in Table 1 using the data available in the literature. It may be appreciated that the gas turbine has the greatest thermal efficiency, as it is able to work at higher temperatures and without needing such high pressures as the steam turbines. Nevertheless, the cost of a gas turbine is higher. Regarding steam cycles, as the materials are improved, the increase of turbine pressure and temperature results in an increase in thermal efficiency from 34% in subcritical cycles to 42.7% in advanced ultra-supercritical cycles. Since existing coal-fired steam cycles are relatively old, it was difficult to find reliable values of installation costs and relate them to the present value.
Due to the diversity in the rated power of combined cycles and the different solutions available in the market, it is difficult to give a general value of the performance of a Brayton-Rankine combined cycle. However, if the gas turbine power and the exhaust gas temperature are fixed, it may be observed that overall efficiency increases as the enthalpy from exhaust gases is better used in the HRSG, as shown in Table 2. Although the efficiency increases in a combined cycle, so does the complexity of the facility. Hence, the study of such cycles must include a technoeconomic analysis.
From an economic point of view, values of LCOE for combined cycle gas plants range between 45 and USD 80/MWh. For coal-fired plants, values are between USD 45 and 63/MWh; whereas, for nuclear plants, values are between USD 42 and 58/MWh [106]. The costs of installation and operation and maintenance of gas, coal-based steam and combined cycle power plants may be found in Table 3.
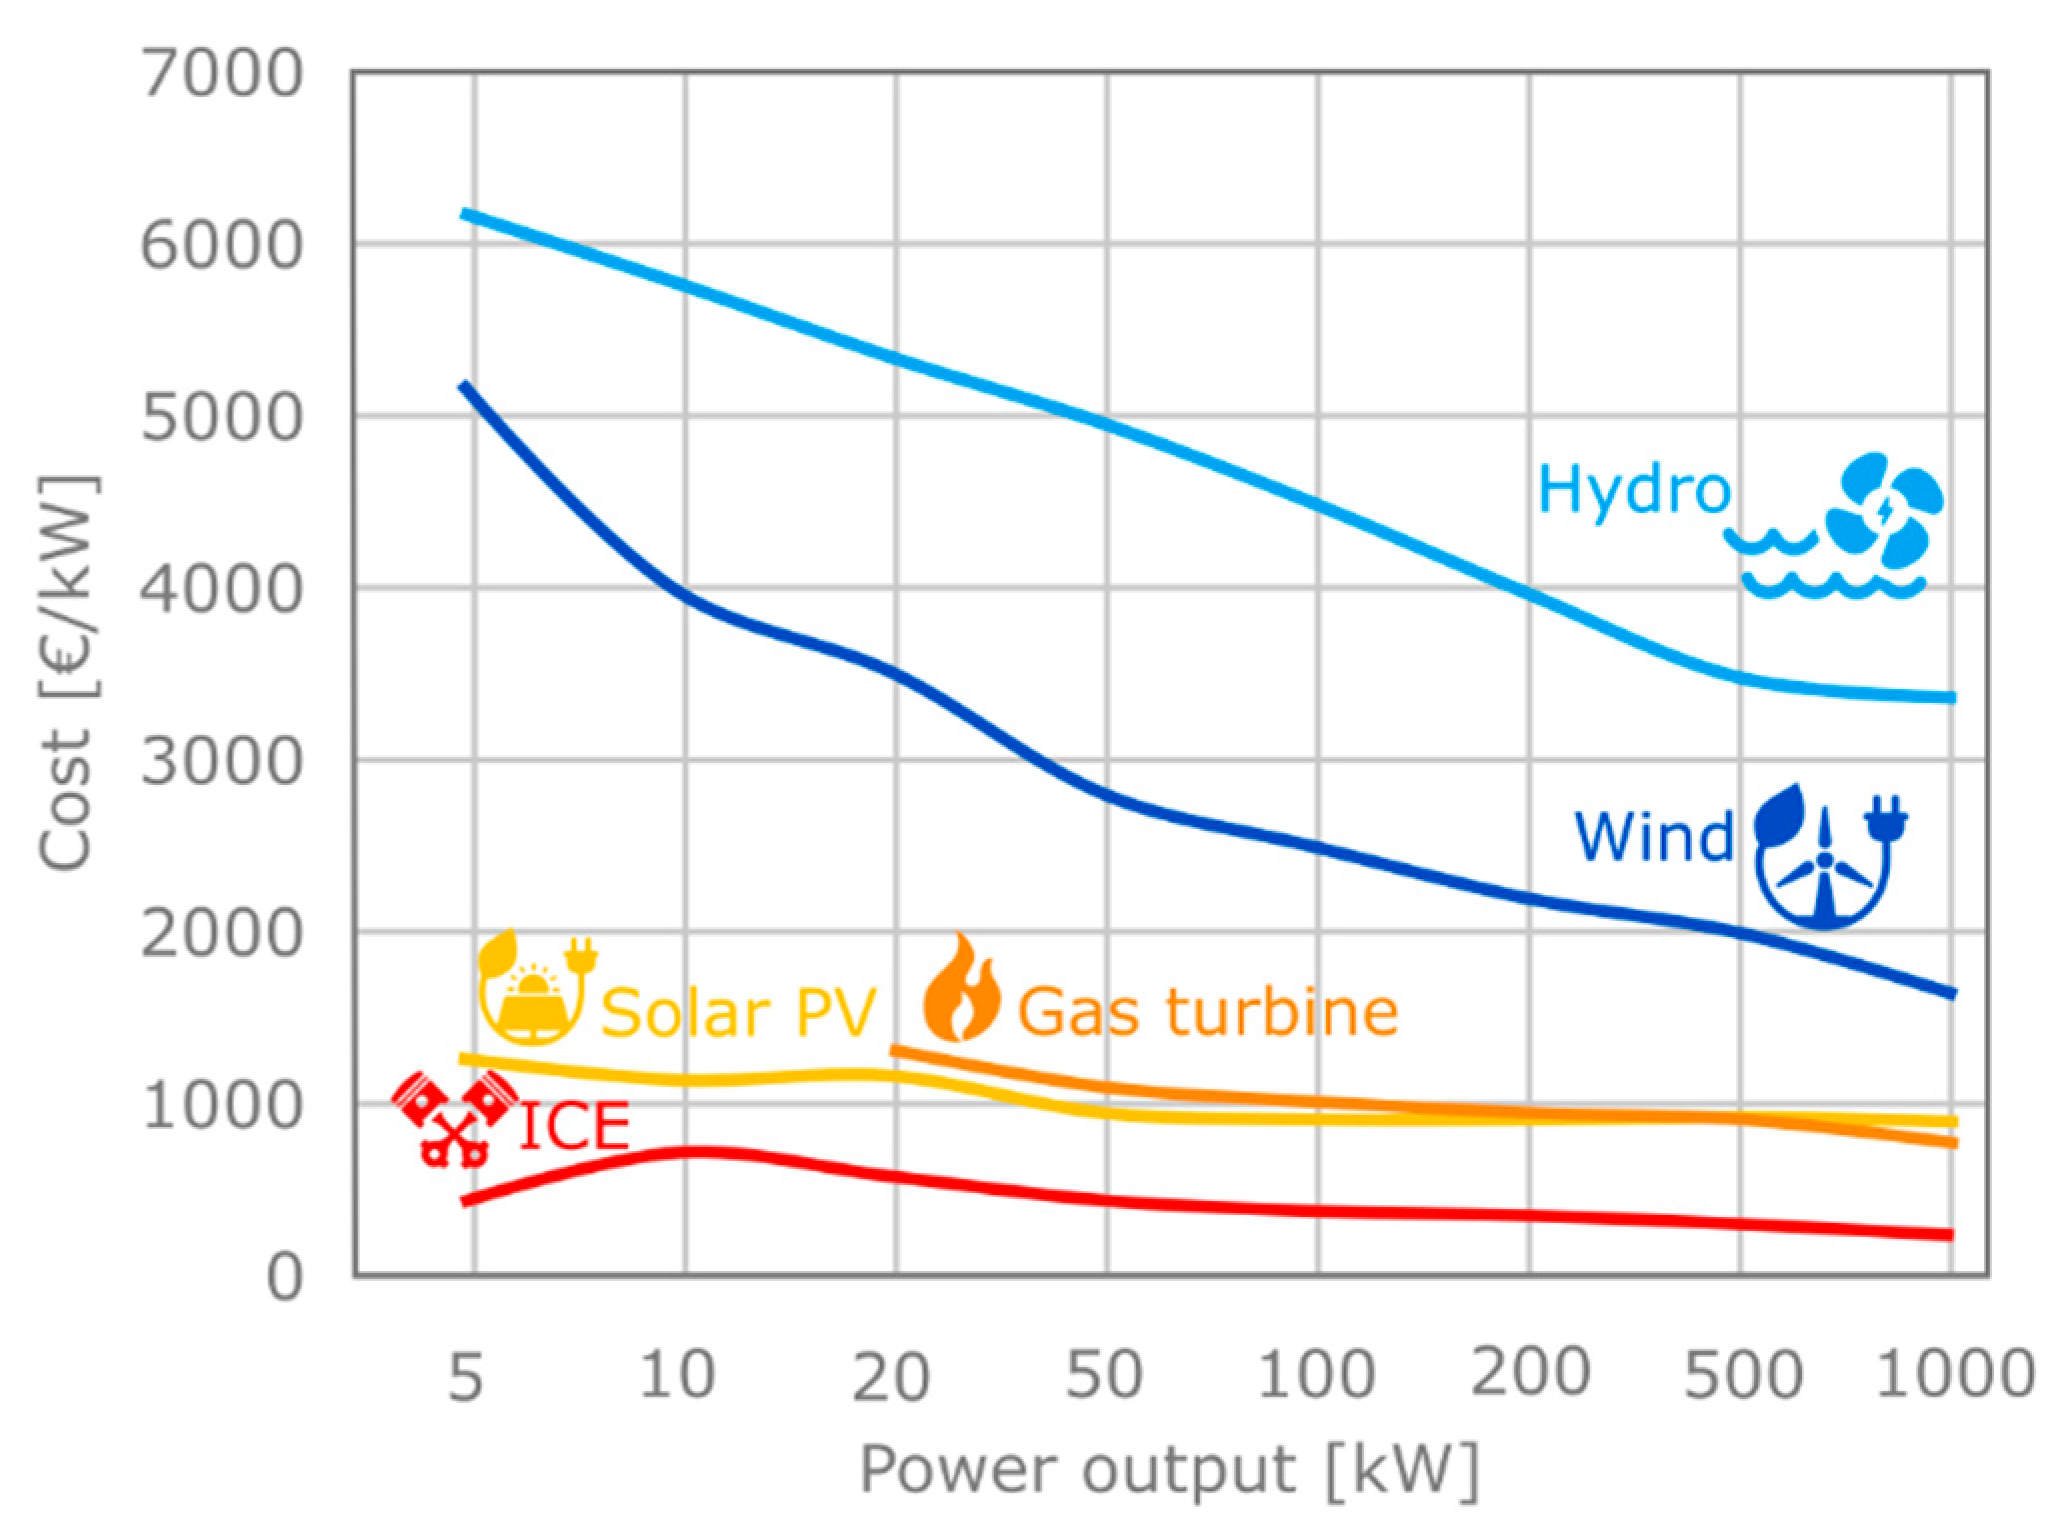
Regarding small- and medium-scale power ranges, Figure 26 shows the trends of installation costs for different power plants. It may be observed that gas turbines are still one of the cheapest ways to produce electricity, with investment costs decreasing per additional kW. However, supercritical and ultra-supercritical plants may supply support energy to renewable sources, which must combine response flexibility with the lowest possible polluting emissions [110].
Finally, the environmental impact of the most used cycles is assessed. Table 4 compares the emissions of a combined cycle and a coal power plant, highlighting that the combined cycle results in much cleaner energy production [105]. Fluidized bed technologies may be used in steam power plants to reduce emissions when the fuel is relatively dirty. Combustion temperatures between 1116 and 1172 K activate SO2 capture by the limestone in the fluidized bed and reduce NOx emissions. The disadvantage is the generation of N2O, a gas with a global warming potential 296 times greater than CO2. The improvement of denitrification efficiency by changing feedwater temperature has been studied by Wang et al. [53], who found that an increase is not always effective in terms of energy saving for supercritical units.
Table 5 shows the cooling water consumption in coal-fired steam power plants and gas power plants in cubic meters per unit power production [111,112]. It may be appreciated how gas power plants require the least water consumption per GJ delivered. Nevertheless, technologies that do not use cooling water for refrigeration, such as the hygroscopic technology, have a great advantage over other technologies [74].
Zappa et al. [113] analyzed the feasibility of a renewable power system in Europe by 2050, finding that a 100% renewable power system could operate relying on European resources alone with the same level of system adequacy as in 2019. Nevertheless, a 90% increase in renewable generation and a 240% increase in cross-border transmission capacity would be required. Apart from the energy efficiency measures, mass mobilization of Europe’s biomass and biogas resources would be required. And in addition, this system would represent a cost 30% higher than nuclear or carbon storage and capture technologies. All these conclusions suggest the fact that combined cycles for power generation still have many years to go, so research into their integration with renewables and carbon capture is of vital importance.

4. Conclusions

Rising temperatures and the high consumption of water across the planet have predetermined a future in which power cycles will need to adapt to higher cold sink temperatures and water scarcity for cooling purposes. The most used thermodynamic cycles for high-grade power generation in the world are still the Rankine, Brayton and combined cycles, which have already reached mature technology levels. Operation and maintenance costs, economies of scale in component fabrication and the scarcity of economic incentives lead conventional Rankine and Brayton cycles to be widely used, thus slowing down the development of cleaner cycles. In order to complete the necessary energy transition, supporting energy sources must be added to the renewable energy mix. The two leading thermodynamic cycles use fossil fuels; therefore, it is necessary to install denitrification and desulfurization equipment, as well as increasing the energy efficiency of the cycles. However, alternative cycles such as Organic Rankine Cycles, Kalina, Goswami or the Hygrosopic cycle may offer some benefits in relation to the change in temperatures and availability of resources, even more so if they use renewable energies as the hot source for power. The analysis and comparison of these cycle typologies has served to identify their differences in terms of energy efficiency and sustainability. For high power generation, focus is still on the traditional cycles; nevertheless, hybridizations with renewable sources have been found in the literature and seem promising to gradually reduce the use of fossil fuels. Hybridization with solar technology is especially likely to have an important role in the near future. In addition, the use of biomass sources fuels has been recognized as a way of improving the sustainability of power cycles. In small- and medium-scale power generation, alternatives such as the Organic Rankine Cycles and Kalina cycles may be useful, especially for the use of low-grade heat from industrial processes. CO2 cycles also have the potential to become future state-of-the-art technology, but experimental tests are required to ensure their viability. Regarding environmental issues, the consumption of water could be substantially reduced if the cooling technology is switched to dry cooling technologies, as in the Hygroscopic cycle. This cycle allows the release of heat at higher temperatures, so its hybridization with waste heat recovery systems could be a viable option. In addition, carbon capture technologies can be integrated into existing power plants to reduce carbon emissions. Cogeneration cycles, such as the Goswami cycle or those resulting from the hybridization of existing power plants with renewable energy sources, may also have an impact on the future energy mix. Finally, the introduction of hydrogen as a fuel in gas cycles opens the possibility of storing energy produced by renewable sources and recovering it in retrofitted existing gas and combined cycle power plants. Economic aspects must be considered when analyzing the different alternatives for power generation, finding a compromise between the power installed, the installation, operation and maintenance costs, and the environmental impact.

Author Contributions

All authors have contributed equally to the work contained in this manuscript. All authors have read and agreed to the published version of the manuscript.

Funding

This research was funded by the project “Improvement of energy performance of the Hygroscopic Cycle for power production” PID2019-108325RB-I00 from the Spanish Ministry of Science, Innovation and Universities; and the “Severo Ochoa” predoctoral research scholarship BP20-176. provided by the Principality of Asturias, Spain, as well as the support from the University Institute of Industrial Technology of Asturias (IUTA), financed by the City Council of Gijón, Spain.

Acknowledgments

The authors also want to acknowledge the contribution of the Spanish company IMATECH (IMASA TECHNOLOGIES).

Conflicts of Interest

The authors declare no conflict of interest. The funders had no role in the design of the study in the collection, analyses, or interpretation of data; in the writing of the manuscript; or in the decision to publish the results.

References

  1. British Petroleum Statistical Review of World Energy. 2022. Available online: https://www.bp.com/content/dam/bp/business-sites/en/global/corporate/pdfs/energy-economics/statistical-review/bp-stats-review-2022-full-report.pdf (accessed on 27 October 2022).
  2. Energy Agency, I. Key World Energy Statistics. 2021. Available online: https://iea.blob.core.windows.net/assets/52f66a88-0b63-4ad2-94a5-29d36e864b82/KeyWorldEnergyStatistics2021.pdf (accessed on 27 October 2022).
  3. Masson-Delmotte, V.; Zhai, P.; Chen, Y.; Goldfarb, L.; Gomis, M.I.; Matthews, J.B.R.; Berger, S.; Huang, M.; Yelekçi, O.; Yu, R.; et al. Climate Change 2021 The Physical Science Basis. Available online: https://www.ipcc.ch/report/ar6/wg1/downloads/report/IPCC_AR6_WGI_SPM_final.pdf (accessed on 28 October 2022).
  4. Riahi, K.; van Vuuren, D.P.; Kriegler, E.; Edmonds, J.; O’Neill, B.C.; Fujimori, S.; Bauer, N.; Calvin, K.; Dellink, R.; Fricko, O.; et al. The Shared Socioeconomic Pathways and Their Energy, Land Use, and Greenhouse Gas Emissions Implications: An Overview. Glob. Environ. Chang. 2017, 42, 153–168. [Google Scholar] [CrossRef] [Green Version]
  5. UNESCO. Valuing Water. Available online: https://unesdoc.unesco.org/ark:/48223/pf0000375724 (accessed on 21 October 2022).
  6. Giovannelli, A. State of the Art on Small-Scale Concentrated Solar Power Plants. Energy Procedia 2015, 82, 607–614. [Google Scholar] [CrossRef] [Green Version]
  7. Allouhi, H.; Allouhi, A.; Buker, M.S.; Zafar, S.; Jamil, A. Recent Advances, Challenges, and Prospects in Solar Dish Collectors: Designs, Applications, and Optimization Frameworks. Sol. Energy Mater. Sol. Cells 2022, 241, 111743. [Google Scholar] [CrossRef]
  8. Sadrameli, S.M. Mathematical Models for the Simulation of Thermal Regenerators: A State-of-the-Art Review. Renew. Sustain. Energy Rev. 2016, 58, 462–476. [Google Scholar] [CrossRef]
  9. Turner, M.; Iyengar, A.; Woods, M. Cost and Performance Baseline for Fossil Energy Plants Supplement: Sensitivity to CO2 Capture Rate in Coal-Fired Power Plants; National Energy Technology Laboratory: Albany, OR, USA, 2020. [Google Scholar]
  10. Kumar, N.; Besuner, P.; Lefton, S.; Agan, D.; Hilleman, D. Power Plant Cycling Costs. Available online: http://www.osti.gov/bridge (accessed on 3 November 2022).
  11. Alsarayreh, M.; Mohamed, O.; Matar, M. Modeling a Practical Dual-Fuel Gas Turbine Power Generation System Using Dynamic Neural Network and Deep Learning. Sustainability 2022, 14, 870. [Google Scholar] [CrossRef]
  12. Asgari, H.; Chen, X.Q.; Morini, M.; Pinelli, M.; Sainudiin, R.; Spina, P.R.; Venturini, M. NARX Models for Simulation of the Start-up Operation of a Single-Shaft Gas Turbine. Appl. Therm. Eng. 2016, 93, 368–376. [Google Scholar] [CrossRef]
  13. Ben Rahmoune, M.; Hafaifa, A.; Kouzou, A.; Chen, X.Q.; Chaibet, A. Gas Turbine Monitoring Using Neural Network Dynamic Nonlinear Autoregressive with External Exogenous Input Modelling. Math Comput. Simul. 2021, 179, 23–47. [Google Scholar] [CrossRef]
  14. Yin, F.; Rao, A.G. A Review of Gas Turbine Engine with Inter-Stage Turbine Burner. Prog. Aerosp. Sci. 2020, 121, 100695. [Google Scholar] [CrossRef]
  15. Goldmer, J. Hydrogen as a Fuel for Gas Turbines. Available online: www.ge.com/gas-power/future-of-energy (accessed on 3 November 2022).
  16. Zhu, S.; Ma, Z.; Zhang, K.; Deng, K. Energy and Exergy Analysis of the Combined Cycle Power Plant Recovering Waste Heat from the Marine Two-Stroke Engine under Design and off-Design Conditions. Energy 2020, 210, 558. [Google Scholar] [CrossRef]
  17. Holy, F.; Textor, M.; Lechner, S. Gas Turbine Cogeneration Concepts for the Pressureless Discharge of High Temperature Thermal Energy Storage Units. J. Energy Storage 2021, 44, 103283. [Google Scholar] [CrossRef]
  18. Mohamed, O.; Khalil, A. Progress in Modeling and Control of Gas Turbine Power Generation Systems: A Survey. Energies 2020, 13, 2358. [Google Scholar] [CrossRef]
  19. Mohamed, O.; Wang, J.; Khalil, A.; Limhabrash, M. Predictive Control Strategy of a Gas Turbine for Improvement of Combined Cycle Power Plant Dynamic Performance and Efficiency. SpringerPlus 2016, 5, 980. [Google Scholar] [CrossRef] [PubMed] [Green Version]
  20. Ahn, Y.; Bae, S.J.; Kim, M.; Cho, S.K.; Baik, S.; Lee, J.I.; Cha, J.E. Review of Supercritical CO2 Power Cycle Technology and Current Status of Research and Development. Nucl. Eng. Technol. 2015, 47, 647–661. [Google Scholar] [CrossRef] [Green Version]
  21. Sathish, S.; Kumar, P. Equation of State Based Analytical Formulation for Optimization of SCO2 Brayton Cycle. J. Supercrit. Fluids 2021, 177, 105351. [Google Scholar] [CrossRef]
  22. Liu, Y.; Wang, Y.; Huang, D. Supercritical CO2 Brayton Cycle: A State-of-the-Art Review. Energy 2019, 189, 115900. [Google Scholar] [CrossRef]
  23. Thanganadar, D.; Asfand, F.; Patchigolla, K.; Turner, P. Techno-Economic Analysis of Supercritical Carbon Dioxide Cycle Integrated with Coal-Fired Power Plant. Energy Convers Manag. 2021, 242, 114294. [Google Scholar] [CrossRef]
  24. Filippov, S.P.; Keiko, A.V. Coal Gasification: At the Crossroad. Technological Factors. Therm. Eng. 2021, 68, 209–220. [Google Scholar] [CrossRef]
  25. Wei, X.; Manovic, V.; Hanak, D.P. Techno-Economic Assessment of Coal- or Biomass-Fired Oxy-Combustion Power Plants with Supercritical Carbon Dioxide Cycle. Energy Convers. Manag. 2020, 221, 113143. [Google Scholar] [CrossRef]
  26. Du, Y.; Hu, C.; Yang, C.; Wang, H.; Dong, W. Size Optimization of Heat Exchanger and Thermoeconomic Assessment for Supercritical CO2 Recompression Brayton Cycle Applied in Marine. Energy 2022, 239, 306. [Google Scholar] [CrossRef]
  27. Rodríguez-de Arriba, P.; Crespi, F.; Sánchez, D.; Muñoz, A.; Sánchez, T. The Potential of Transcritical Cycles Based on CO2 Mixtures: An Exergy-Based Analysis. Renew. Energy 2022, 199, 1606–1628. [Google Scholar] [CrossRef]
  28. Crespi, F.; Sánchez, D.; Rodríguez, J.M.; Gavagnin, G. A Thermo-Economic Methodology to Select SCO2 Power Cycles for CSP Applications. Renew. Energy 2020, 147, 2905–2912. [Google Scholar] [CrossRef]
  29. Beér, J.M. High Efficiency Electric Power Generation: The Environmental Role. Prog. Energy Combust. Sci. 2007, 33, 107–134. [Google Scholar] [CrossRef] [Green Version]
  30. Achter, T.; Quinkertz, R.; Baca, M. Increased Efficiency and Flexibility of Large Coal-Fired Power Plants Applied to 350-MW-Class Units. In Proceedings of the Power-Gen Asia, Bangkok, Thailand, 20–22 September 2016; pp. 1–21. [Google Scholar]
  31. Fan, H.; Zhang, Z.; Dong, J.; Xu, W. China’s R&D of Advanced Ultra-Supercritical Coal-Fired Power Generation for Addressing Climate Change. Therm. Sci. Eng. Prog. 2018, 5, 364–371. [Google Scholar]
  32. Wu, D.; Sheng, L.; Zhou, D.; Chen, M. Dynamic Stationary Subspace Analysis for Monitoring Nonstationary Dynamic Processes. Ind. Eng. Chem. Res. 2020, 59, 20787–20797. [Google Scholar] [CrossRef]
  33. Si, Y.; Wang, Y.; Zhou, D. Key-Performance-Indicator-Related Process Monitoring Based on Improved Kernel Partial Least Squares. IEEE Trans. Ind. Electron. 2021, 68, 2626–2636. [Google Scholar] [CrossRef]
  34. Wu, D.; Zhou, D.; Chen, M.; Zhu, J.; Yan, F.; Zheng, S.; Guo, E. Output-Relevant Common Trend Analysis for KPI-Related Nonstationary Process Monitoring with Applications to Thermal Power Plants. IEEE Trans. Industr. Inform. 2021, 17, 6664–6675. [Google Scholar] [CrossRef]
  35. Çengel Yunus, A.; Boles Michael, A. Thermodynamics. An Engineering Approach, 8th ed.; McGraw-Hill: New York, NY, USA, 2015. [Google Scholar]
  36. Michael, J.M.; Howard, N.S.; Daisie, D.B.; Margaret, B.B. Fundamentals of Engineerings Thermodynamics, 8th ed.; Fowley, D., Ed.; Wiley: Hoboken, NJ, USA, 2014. [Google Scholar]
  37. Meana-Fernández, A.; Peris-Pérez, B.; Gutiérrez-Trashorras, A.J.; Rodríguez-Artime, S.; Ríos-Fernández, J.C.; González-Caballín, J.M. Optimization of the Propulsion Plant of a Liquefied Natural Gas Transport Ship. Energy Convers. Manag. 2020, 224, 113398. [Google Scholar] [CrossRef]
  38. Znad, O.A.; Mohamed, O.; Elhaija, W.A. Speeding-up Startup Process of a Clean Coal Supercritical Power Generation Station via Classical Model Predictive Control. Process Integr. Optim. Sustain. 2022, 6, 751–764. [Google Scholar] [CrossRef]
  39. Hussain, C.M.I.; Duffy, A.; Norton, B. Economic Appraisal of Hybrid Solar-Biomass Thermophotovoltaic Power Generation. Proc. Inst. Civ. Eng. Energy 2019, 172, 162–168. [Google Scholar] [CrossRef]
  40. Al-Maliki, W.A.K.; Hadi, A.S.; Al-Khafaji, H.M.H.; Alobaid, F.; Epple, B. Dynamic Modelling and Advanced Process Control of Power Block for a Parabolic Trough Solar Power Plant. Energies 2022, 15, 129. [Google Scholar] [CrossRef]
  41. Elsido, C.; Cremonesi, A.; Martelli, E. A Novel Sequential Synthesis Algorithm for the Integrated Optimization of Rankine Cycles and Heat Exchanger Networks. Appl. Therm. Eng. 2021, 192, 116594. [Google Scholar] [CrossRef]
  42. Nikam, K.C.; Kumar, R.; Jilte, R. Thermodynamic Modeling and Performance Evaluation of a Supercritical Coal-Fired Power Plant Situated in Western India. Energy Sources Part A Recovery Util. Environ. Eff. 2020, 1–19. [Google Scholar] [CrossRef]
  43. Kong, X.; Liu, X.; Lee, K.Y. An Effective Nonlinear Multivariable HMPC for USC Power Plant Incorporating NFN-Based Modeling. IEEE Trans. Industr. Inform. 2016, 12, 555–566. [Google Scholar] [CrossRef]
  44. Haddad, A.; Mohamed, O.; Zahlan, M.; Wang, J. Parameter Identification of a Highly Promising Cleaner Coal Power Station. J Clean Prod. 2021, 326, 129323. [Google Scholar] [CrossRef]
  45. Wu, D.; Zhou, D.; Chen, M. Performance-Driven Component Selection in the Framework of PCA for Process Monitoring: A Dynamic Selection Approach. IEEE Trans. Control. Syst. Technol. 2022, 30, 1171–1185. [Google Scholar] [CrossRef]
  46. Mohamed, O.; Khalil, A.; Wang, J. Modeling and Control of Supercritical and Ultra-Supercritical Power Plants: A Review. Energies 2020, 13, 2935. [Google Scholar] [CrossRef]
  47. Haddad, A.; Mohamed, O. Qualitative and Quantitative Comparison of Three Modeling Approaches for a Supercritical Once-through Generation Unit. Int. J. Energy Res. 2022, 46, 20780–20800. [Google Scholar] [CrossRef]
  48. Al-Momani, A.; Mohamed, O.; Abu Elhaija, W. Multiple Processes Modeling and Identification for a Cleaner Supercritical Power Plant via Grey Wolf Optimizer. Energy 2022, 252, 124090. [Google Scholar] [CrossRef]
  49. Draganescu, M.; Guo, S.; Wojcik, J.; Wang, J.; Liu, X.; Hou, G.; Xue, Y.; Gao, Q. Generalized Predictive Control for Superheated Steam Temperature Regulation in a Supercritical Coal-Fired Power Plant. CSEE J. Power Energy Syst. 2015, 1, 69–77. [Google Scholar] [CrossRef]
  50. Liu, X.J.; Kong, X.B.; Hou, G.L.; Wang, J.H. Modeling of a 1000 MW Power Plant Ultra Super-Critical Boiler System Using Fuzzy-Neural Network Methods. Energy Convers. Manag. 2013, 65, 518–527. [Google Scholar] [CrossRef]
  51. Deng, K.; Yang, C.; Chen, H.; Zhou, N.; Huang, S. Start-Up and Dynamic Processes Simulation of Supercritical Once-through Boiler. Appl. Therm. Eng. 2017, 115, 937–946. [Google Scholar] [CrossRef]
  52. Kumar, R.; Jilte, R.; Ahmadi, M.H.; Kaushal, R. A Simulation Model for Thermal Performance Prediction of a Coal-Fired Power Plant. Int. J. Low-Carbon Technol. 2019, 14, 122–134. [Google Scholar] [CrossRef] [Green Version]
  53. Wang, Y.; Cao, L.; Hu, P.; Li, B.; Li, Y. Model Establishment and Performance Evaluation of a Modified Regenerative System for a 660 MW Supercritical Unit Running at the IPT-Setting Mode. Energy 2019, 179, 890–915. [Google Scholar] [CrossRef]
  54. Yang, C.; Zhang, Z.; Wu, H.; Deng, K. Dynamic Characteristics Analysis of a 660 MW Ultra-Supercritical Circulating Fluidized Bed Boiler. Energies 2022, 15, 4049. [Google Scholar] [CrossRef]
  55. Han, Y.; Song, Y.H. Condition Monitoring Techniques for Electrical Equipment—A Literature Survey. IEEE Trans. Power Deliv. 2003, 18, 4–13. [Google Scholar] [CrossRef]
  56. Zhang, Y.; Dong, Z.Y.; Kong, W.; Meng, K. A Composite Anomaly Detection System for Data-Driven Power Plant Condition Monitoring. IEEE Trans. Industr. Inform. 2020, 16, 4390–4402. [Google Scholar] [CrossRef]
  57. Invernizzi, C.M. Closed Power Cycles: Thermodynamic Fundamentals and Applications; Springer: Berlin/Heidelberg, Germany, 2013. [Google Scholar]
  58. Ofeldt, F.W. Engine. U.S. Patent No. 611,792, 4 October 1898. [Google Scholar]
  59. Casati, E.I.M. New Concepts FOR Organic Rankine Cycle Power Systems; Review Publishing & Printing Company: Philadelphia, PA, USA, 2014; ISBN 9789462593305. [Google Scholar]
  60. Pereira, J.S.; Ribeiro, J.B.; Mendes, R.; Vaz, G.C.; André, J.C. ORC Based Micro-Cogeneration Systems for Residential Application—A State of the Art Review and Current Challenges. Renew. Sustain. Energy Rev. 2018, 92, 728–743. [Google Scholar] [CrossRef]
  61. Liu, L.; Zhu, T.; Gao, N.; Gan, Z. A Review of Modeling Approaches and Tools for the Off-Design Simulation of Organic Rankine Cycle. J. Therm. Sci. 2018, 27, 305–320. [Google Scholar] [CrossRef]
  62. Iglesias Garcia, S.; Ferreiro Garcia, R.; Carbia Carril, J.; Iglesias Garcia, D. A Review of Thermodynamic Cycles Used in Low Temperature Recovery Systems over the Last Two Years. Renew. Sustain. Energy Rev. 2018, 81, 760–767. [Google Scholar] [CrossRef]
  63. Kumar, A.; Rakshit, D. A Critical Review on Waste Heat Recovery Utilization with Special Focus on Organic Rankine Cycle Applications. Clean Eng. Technol. 2021, 5, 100292. [Google Scholar] [CrossRef]
  64. Chen, H.; Goswami, D.Y.; Stefanakos, E.K. A Review of Thermodynamic Cycles and Working Fluids for the Conversion of Low-Grade Heat. Renew. Sustain. Energy Rev. 2010, 14, 3059–3067. [Google Scholar] [CrossRef]
  65. Yazawa, K.; Shakouri, A. Heat Flux Based Optimization of Combined Heat and Power Thermoelectric Heat Exchanger. Energies 2021, 14, 791. [Google Scholar] [CrossRef]
  66. Qyyum, M.A.; Khan, A.; Ali, S.; Khurram, M.S.; Mao, N.; Naquash, A.; Noon, A.A.; He, T.; Lee, M. Assessment of Working Fluids, Thermal Resources and Cooling Utilities for Organic Rankine Cycles: State-of-the-Art Comparison, Challenges, Commercial Status, and Future Prospects. Energy Convers Manag. 2022, 252, 115055. [Google Scholar] [CrossRef]
  67. Oyekale, J.; Heberle, F.; Petrollese, M.; Brüggemann, D.; Cau, G. Biomass Retrofit for Existing Solar Organic Rankine Cycle Power Plants: Conceptual Hybridization Strategy and Techno-Economic Assessment. Energy Convers. Manag. 2019, 196, 831–845. [Google Scholar] [CrossRef]
  68. Tocci, L.; Pal, T.; Pesmazoglou, I.; Franchetti, B. Small Scale Organic Rankine Cycle (ORC): A Techno-Economic Review. Energies 2017, 10, 413. [Google Scholar] [CrossRef]
  69. Nematollahi, O.; Kim, K.C. Real-Gas Effects: The State of the Art of Organic Rankine Cycles. J. Clean Prod. 2020, 277, 124102. [Google Scholar] [CrossRef]
  70. Eyerer, S.; Dawo, F.; Schifflechner, C.; Niederdränk, A.; Spliethoff, H.; Wieland, C. Experimental Evaluation of an ORC-CHP Architecture Based on Regenerative Preheating for Geothermal Applications. Appl. Energy 2022, 315, 119057. [Google Scholar] [CrossRef]
  71. Eliasson, L.; Valdimarsson, P.; Ing, S. Factors Influencing the Economics of the Kalina Power Cycle and Situations of Superior Performance. In Proceedings of the International Geothermal Conference, Reykjavík, Iceland, 24–17 September 2003. [Google Scholar]
  72. Modi, A.; Kærn, M.R.; Andreasen, J.G.; Haglind, F. Thermoeconomic Optimization of a Kalina Cycle for a Central Receiver Concentrating Solar Power Plant. Energy Convers. Manag. 2016, 115, 276–287. [Google Scholar] [CrossRef] [Green Version]
  73. Król, P.; Krajačić, G. Energy Analysis of Municipal Waste in Dubrovnik. Acta Innov. 2018, 40, 40–48. [Google Scholar] [CrossRef]
  74. Rubio-Serrano, F.J.; Gutiérrez-Trashorras, A.J.; Soto-Pérez, F.; Álvarez-Álvarez, E.; Blanco-Marigorta, E. Advantages of Incorporating Hygroscopic Cycle Technology to a 12.5-MW Biomass Power Plant. Appl. Therm. Eng. 2018, 131, 320–327. [Google Scholar] [CrossRef]
  75. Rubio-Serrano, F.J.; Soto-Pérez, F.; Gutiérrez-Trashorras, A.J. Influence of Cooling Temperature Increase in a Hygroscopic Cycle on the Performance of the Cooling Equipment. Energy Convers. Manag. 2019, 200, 112080. [Google Scholar] [CrossRef]
  76. Rubio-Serrano, F.J.; Soto-Pérez, F.; Gutiérrez-Trashorras, A.J. Experimental Study on the Influence of the Saline Concentration in the Electrical Performance of a Hygroscopic Cycle. Appl. Therm. Eng. 2020, 165, 114588. [Google Scholar] [CrossRef]
  77. Gülen, S.C. Steam Turbine—Quo Vadis? Front Energy Res. 2021, 8, 384. [Google Scholar] [CrossRef]
  78. Zhang, Z.; Duan, L.; Wang, Z.; Ren, Y. General Performance Evaluation Method of Integrated Solar Combined Cycle (ISCC) System. Energy 2022, 240, 122472. [Google Scholar] [CrossRef]
  79. Zaversky, F.; Les, I.; Sorbet, P.; Sánchez, M.; Valentin, B.; Brau, J.F.; Siros, F. The Challenge of Solar Powered Combined Cycles–Providing Dispatchability and Increasing Efficiency by Integrating the Open Volumetric Air Receiver Technology. Energy 2020, 194, 116796. [Google Scholar] [CrossRef]
  80. Martín, M. Challenges and Opportunities of Solar Thermal Energy towards a Sustainable Chemical Industry. Comput. Chem. Eng. 2022, 165, 107926. [Google Scholar] [CrossRef]
  81. Zaversky, F.; Cabello, F.; Bernardos, A.; Sánchez, M. A Novel High-Efficiency Solar Thermal Power Plant Featuring Electricity Storage–Ideal for the Future Power Grid with High Shares of Renewables. AIP Conf. Proc. 2022, 2445, 060008. [Google Scholar]
  82. Ortiz, C.; Tejada, C.; Chacartegui, R.; Bravo, R.; Carro, A.; Valverde, J.M.; Valverde, J. Solar Combined Cycle with High-Temperature Thermochemical Energy Storage. Energy Convers. Manag. 2021, 241, 114274. [Google Scholar] [CrossRef]
  83. Szima, S.; Arnaiz del Pozo, C.; Cloete, S.; Chiesa, P.; Jiménez Alvaro, Á.; Cormos, A.M.; Amini, S. Finding Synergy between Renewables and Coal: Flexible Power and Hydrogen Production from Advanced IGCC Plants with Integrated CO2 Capture. Energy Convers. Manag. 2021, 231, 113866. [Google Scholar] [CrossRef]
  84. Reyes-Belmonte, M.Á. A Bibliometric Study on Integrated Solar Combined Cycles (ISCC), Trends and Future Based on Data Analytics Tools. Sustainability 2020, 12, 8217. [Google Scholar] [CrossRef]
  85. Amirante, R.; Bruno, S.; Distaso, E.; la Scala, M.; Tamburrano, P. A Biomass Small-Scale Externally Fired Combined Cycle Plant for Heat and Power Generation in Rural Communities. Renew. Energy Focus 2019, 28, 36–46. [Google Scholar] [CrossRef]
  86. Bryant, C.; Coats, E.R. Integrating Dairy Manure for Enhanced Resource Recovery at a WRRF: Environmental Life Cycle and Pilot-Scale Analyses. Water Environ. Res. 2021, 93, 2034–2050. [Google Scholar] [CrossRef] [PubMed]
  87. Yaqoob, H.; Teoh, Y.H.; Ud Din, Z.; Sabah, N.U.; Jamil, M.A.; Mujtaba, M.A.; Abid, A. The Potential of Sustainable Biogas Production from Biomass Waste for Power Generation in Pakistan. J. Clean Prod. 2021, 307, 127250. [Google Scholar] [CrossRef]
  88. Ancona, M.A.; Bianchi, M.; Branchini, L.; de Pascale, A.; Melino, F.; Peretto, A.; Torricelli, N. Systematic Comparison of Orc and S-Co2 Combined Heat and Power Plants for Energy Harvesting in Industrial Gas Turbines. Energies 2021, 14, 3402. [Google Scholar] [CrossRef]
  89. Redko, A.; Redko, O.; DiPippo, R. Industrial Waste Heat Resources. In Low-Temperature Energy Systems with Applications of Renewable Energy; Elsevier: Amsterdam, The Netherlands, 2020; pp. 329–362. [Google Scholar]
  90. Wu, X.; Wang, M.; Shen, J.; Li, Y.; Lawal, A.; Lee, K.Y. Reinforced Coordinated Control of Coal-Fired Power Plant Retrofitted with Solvent Based CO2 Capture Using Model Predictive Controls. Appl. Energy 2019, 238, 495–515. [Google Scholar] [CrossRef] [Green Version]
  91. Van der Spek, M.; Manzolini, G.; Ramirez, A. New Approach to Techno-Economic Assessment of Power Plants with Carbon Capture and Storage: The Inclusion of Realistic Dispatch Profiles to Calculate Techno-Economics of Part Load Operations. Energy Fuels 2017, 31, 1047–1049. [Google Scholar] [CrossRef]
  92. Gatti, M.; Martelli, E.; di Bona, D.; Gabba, M.; Scaccabarozzi, R.; Spinelli, M.; Viganò, F.; Consonni, S. Preliminary Performance and Cost Evaluation of Four Alternative Technologies for Post-Combustion CO2 Capture in Natural Gas-Fired Power Plants. Energies 2020, 13, 543. [Google Scholar] [CrossRef] [Green Version]
  93. Ferguson, S.; Tarrant, A. Molten Carbonate Fuel Cells for 90% Post Combustion CO2 Capture From a New Build CCGT. Front. Energy Res. 2021, 9, 668431. [Google Scholar] [CrossRef]
  94. Khan, M.N.; Chiesa, P.; Cloete, S.; Amini, S. Integration of Chemical Looping Combustion for Cost-Effective CO2 Capture from State-of-the-Art Natural Gas Combined Cycles. Energy Convers. Manag. X 2020, 7, 100044. [Google Scholar] [CrossRef]
  95. Akinola, T.E.; Oko, E.; Wu, X.; Ma, K.; Wang, M. Nonlinear Model Predictive Control (NMPC) of the Solvent-Based Post-Combustion CO2 Capture Process. Energy 2020, 213, 8840. [Google Scholar] [CrossRef]
  96. Marx-Schubach, T.; Schmitz, G. Modeling and Simulation of the Start-up Process of Coal Fired Power Plants with Post-Combustion CO2 Capture. Int. J. Greenh. Gas Control 2019, 87, 44–57. [Google Scholar] [CrossRef]
  97. Wu, X.; Shen, J.; Li, Y.; Wang, M.; Lawal, A.; Lee, K.Y. Nonlinear Dynamic Analysis and Control Design of a Solvent-Based Post-Combustion CO2 Capture Process. Comput. Chem. Eng. 2018, 115, 397–406. [Google Scholar] [CrossRef]
  98. Paul Njock, J.; Thierry Sosso, O.; Stouffs, P.; Nzengwa, R. A Comparative Energy Analysis of Idealized Cycles Using an Ammonia-Water Mixture for Combined Power/Cooling. Energy 2022, 261, 5184. [Google Scholar] [CrossRef]
  99. Rivera, W.; Sánchez-Sánchez, K.; Hernández-Magallanes, J.A.; Jiménez-García, J.C.; Pacheco, A. Modeling of Novel Thermodynamic Cycles to Produce Power and Cooling Simultaneously. Processes 2020, 8, 320. [Google Scholar] [CrossRef] [Green Version]
  100. Sayyaadi, H.; Khosravanifard, Y.; Sohani, A. Solutions for Thermal Energy Exploitation from the Exhaust of an Industrial Gas Turbine Using Optimized Bottoming Cycles. Energy Convers. Manag. 2020, 207, 112523. [Google Scholar] [CrossRef]
  101. Ambriz-Díaz, V.M.; Rubio-Maya, C.; Chávez, O.; Ruiz-Casanova, E.; Pastor-Martínez, E. Thermodynamic Performance and Economic Feasibility of Kalina, Goswami and Organic Rankine Cycles Coupled to a Polygeneration Plant Using Geothermal Energy of Low-Grade Temperature. Energy Convers. Manag. 2021, 243, 114362. [Google Scholar] [CrossRef]
  102. Leveni, M.; Cozzolino, R. Energy, Exergy, and Cost Comparison of Goswami Cycle and Cascade Organic Rankine Cycle/Absorption Chiller System for Geothermal Application. Energy Convers. Manag. 2021, 227, 113598. [Google Scholar] [CrossRef]
  103. Colakoglu, M.; Durmayaz, A. Energy, Exergy, Economic and Emission Saving Analysis and Multiobjective Optimization of a New Multi-Generation System Based on a Solar Tower with Triple Combined Power Cycle. Sustain. Energy Technol. Assess. 2022, 52, 102289. [Google Scholar] [CrossRef]
  104. Shankar, R.; Srinivas, T. Options in Kalina Cycle Systems. Energy Procedia 2016, 90, 260–266. [Google Scholar] [CrossRef]
  105. Sabugal García, S.; Gómez Moñux, F. Centrales Térmicas de Ciclo Combinado; Ediciones Díaz de Santos: Madrid, Spain, 2006. [Google Scholar]
  106. Feretic, D.; Tomsic, Z. Probabilistic Analysis of Electrical Energy Costs Comparing: Production Costs for Gas, Coal and Nuclear Power Plants. Energy Policy 2005, 33, 5–13. [Google Scholar] [CrossRef]
  107. Siemens Energy Gas Turbines. Available online: https://www.siemens-energy.com/global/en/offerings/power-generation/gas-turbines.html (accessed on 31 October 2022).
  108. International Energy Agency. Available online: https://www.iea.org/ (accessed on 20 June 2021).
  109. Comisión Nacional de la Energía. Chile Informe de Costos de Tecnologías de Generación; Informe Annual; Comisión Nacional de la Energía: Madrid, Spain, 2022. [Google Scholar]
  110. Mac Kinnon, M.A.; Brouwer, J.; Samuelsen, S. The Role of Natural Gas and Its Infrastructure in Mitigating Greenhouse Gas Emissions, Improving Regional Air Quality, and Renewable Resource Integration. Prog. Energy Combust. Sci. 2018, 64, 62–92. [Google Scholar] [CrossRef]
  111. Plata, S.L.; Devenport, C.L.; Miara, A.; Sitterley, K.A.; Evans, A.; Talmadge, M.; van Allsburg, K.M.; Kurup, P.; Cox, J.; Kerber, S.; et al. Zero Liquid Discharge and Water Reuse in Recirculating Cooling Towers at Power Facilities: Review and Case Study Analysis. ACS EST Eng. 2022, 2, 508–525. [Google Scholar] [CrossRef]
  112. Grubert, E.; Sanders, K.T. Supplementary Information for Water Use in the US Energy System: A National Assessment and Unit Process Inventory of Water Consumption and Withdrawals. Environ. Sci. Technol. 2018, 52, 6695–6703. [Google Scholar] [CrossRef] [PubMed]
  113. Zappa, W.; Junginger, M.; van den Broek, M. Is a 100% Renewable European Power System Feasible by 2050? Appl. Energy 2019, 233–234, 1027–1050. [Google Scholar] [CrossRef]
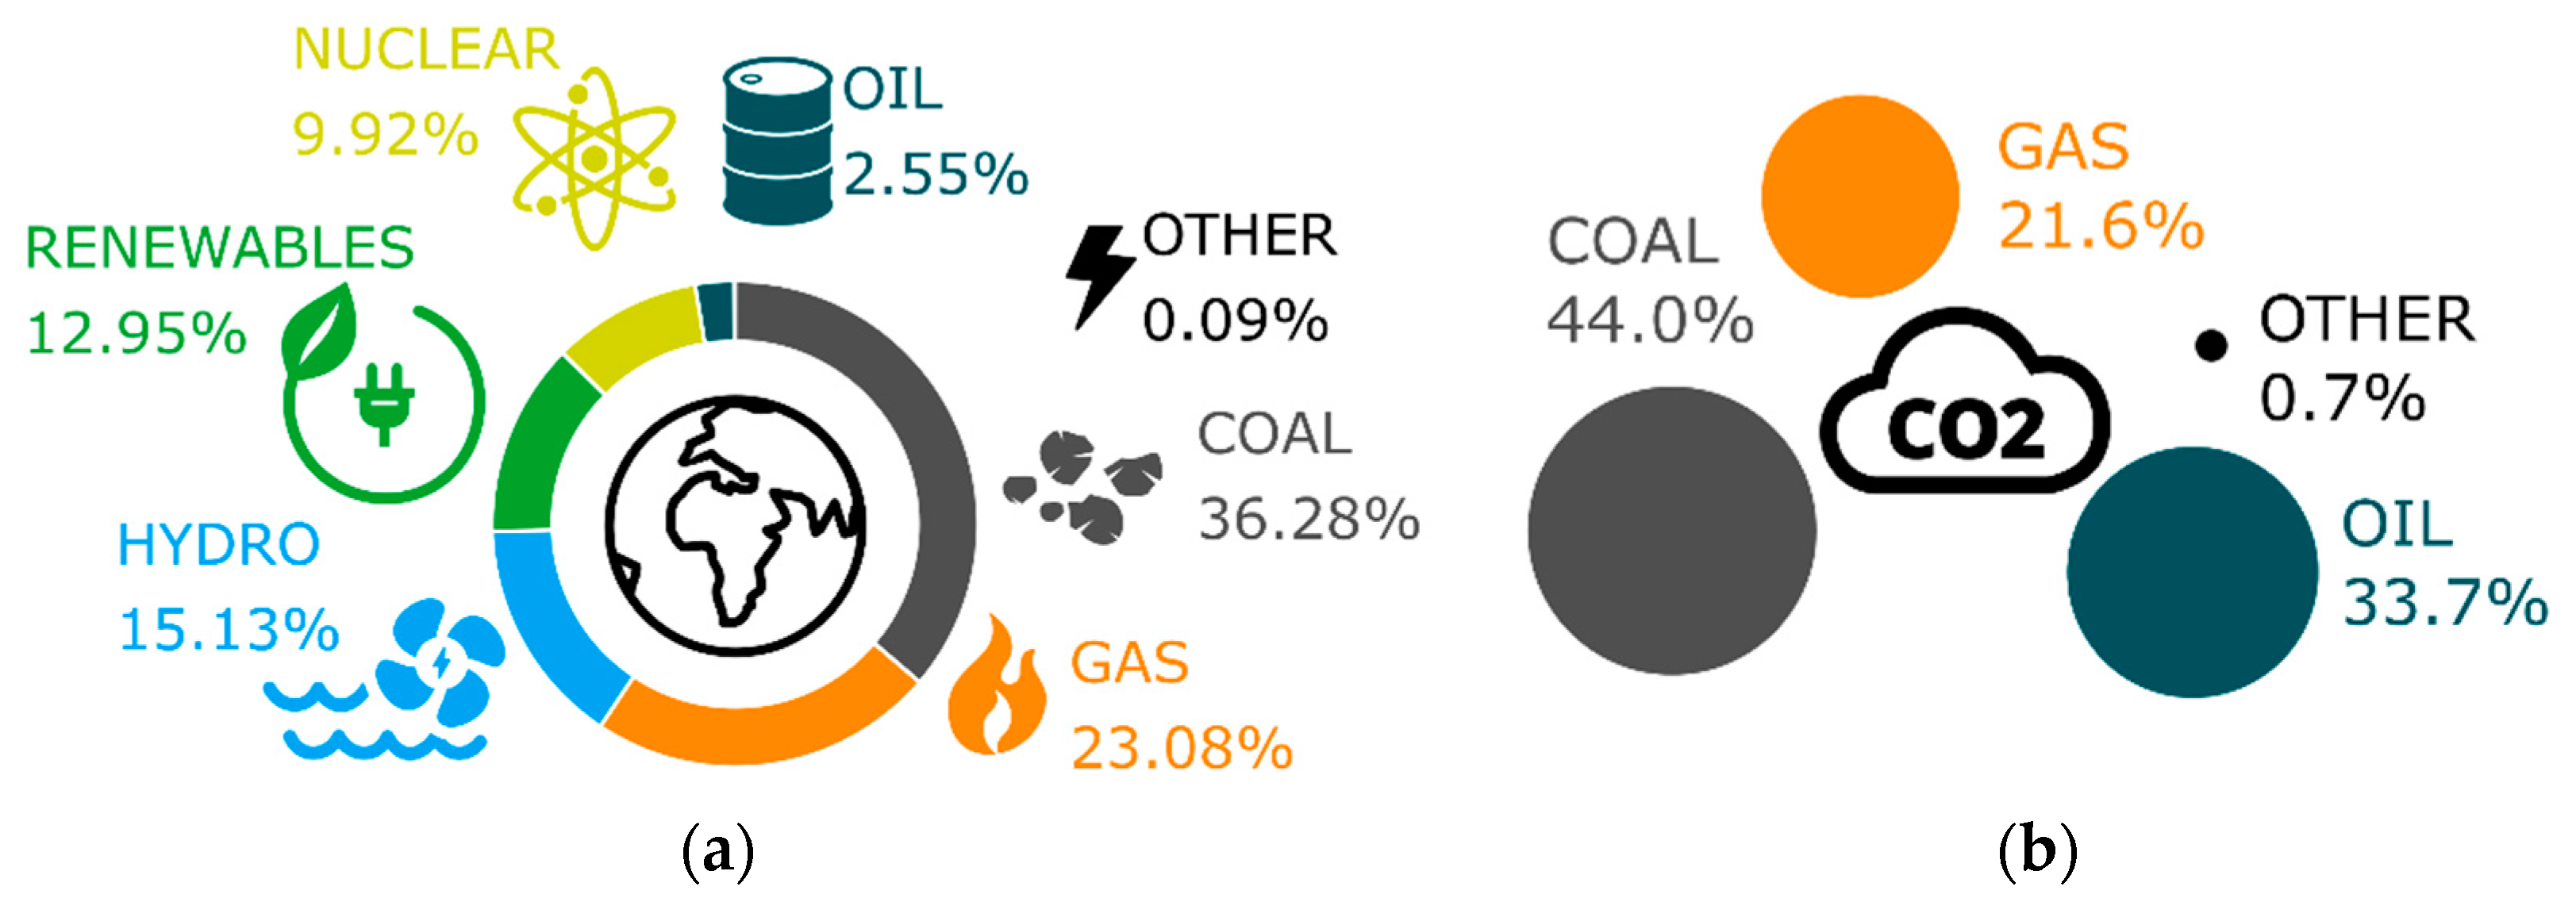
Figure 1. (a) Share of world electricity generation in 2021 (data source: [1]); (b) fuel share of CO2 emissions from fuel combustion in 2019 (data source: [2]).
Energies 15 08982 g001
Figure 2. Prediction of future development of anthropogenic carbon dioxide in the current century (data source: [3]).
Energies 15 08982 g002
Figure 3. (a) Equipment and (b) T-s diagram of the Carnot cycle.
Energies 15 08982 g003
Figure 4. Carnot cycle efficiency as a function of the hot source temperature for a cold sink temperature of 20 °C.
Energies 15 08982 g004
Figure 5. P-V diagram of the Stirling cycle.
Energies 15 08982 g005
Figure 6. (a) Equipment and (b) T-s diagram of the ideal Brayton cycle.
Energies 15 08982 g006
Figure 7. (a) Equipment and (b) T-s diagram of the ideal regenerative Brayton cycle.
Energies 15 08982 g007
Figure 8. (a) Equipment and (b) T-s diagram of the ideal Brayton cycle with intercooling.
Energies 15 08982 g008
Figure 9. (a) Equipment and (b) T-s diagram of the ideal Brayton cycle with reheating.
Energies 15 08982 g009
Figure 10. (a) Equipment and (b) T-s diagram of a supercritical CO2 cycle.
Energies 15 08982 g010
Figure 11. Evolution of technical parameters of steam power plant turbines from 1960 (data source: [24]).
Energies 15 08982 g011
Figure 12. Evolution of capabilities of coal-fired power units in China (adapted from [31]).
Energies 15 08982 g012
Figure 13. (a) Equipment and (b) T-s diagram of an ideal Rankine cycle.
Energies 15 08982 g013
Figure 14. (a) Equipment and (b) T-s diagram of an ideal Rankine cycle with reheating.
Energies 15 08982 g014
Figure 15. (a) Equipment and (b) T-s diagram of an ideal regenerative Rankine cycle with an open feedwater heater.
Energies 15 08982 g015
Figure 16. (a) Equipment and (b) T-s diagram of an ideal regenerative Rankine cycle with a closed feedwater heater.
Energies 15 08982 g016
Figure 17. Impact of operating conditions and cycle modifications to improve thermal efficiency (adapted from [29]).
Energies 15 08982 g017
Figure 18. (a) Equipment and (b) T-s diagram of an ideal Organic Rakine cycle (ORC).
Energies 15 08982 g018
Figure 19. (a) Equipment and (b) T-s diagram of an ideal Kalina cycle.
Energies 15 08982 g019
Figure 20. Equipment of the Hygroscopic cycle (adapted from [75]).
Energies 15 08982 g020
Figure 21. (a) Equipment and (b) T-s diagram of a Brayton-Rankine combined cycle).
Energies 15 08982 g021
Figure 22. (a) Detailed view of a HRSG and (b) Temperature—heat transfer diagram.
Energies 15 08982 g022
Figure 23. Energy balance in a combined cycle (data source: [29]).
Energies 15 08982 g023
Figure 24. Technologies for waste heat recovery depending on source temperature and power (data source: [89]).
Energies 15 08982 g024
Figure 25. Equipment of a Goswami cycle.
Energies 15 08982 g025
Figure 26. Investment cost as a function of installed capacity for different power generation technologies [68].
Energies 15 08982 g026
Table 1. Significative parameters of installed power (data source: [24,31,43,100,103,105]).
PlantPower
[MW]
Pressure
[bar]
Temperature
[°C]
Thermal Efficiency
[%]
Installation Cost
[€/kW]
Steam
(pulverized coal)
Subcritical350–1300<221<54134–41900–1000
Supercritical540–790>240>55036–44(not available)
Ultra-supercritical>500>300≥593>39(not available)
Advanced Ultra-supercritical352680>43(not available)
GasGas turbine2–593140130057600–1400
Table 2. Parameters for different combined cycle configurations (data source: [105].)
Configuration1P2P3P3P + R2P + R
Fuel heating value [MW]695695695695695
Gas turbine power [MW]260.4260.4260.4260.4260.4
Steam turbine power [MW]144.1148.4150.4154.4157.2
Thermal efficiency [%]57.157.657.858.458.5
nP: n pressure levels, R: reheating.
Table 3. Installation, operation and maintenance costs of different power cycles (data source: [24,102,103,105,107,108,109]).
Installed Power [MW]Installation Cost [$/kW]O&M Costs
Open Brayton cycle 211675Fixed4009 k$/year
Variable3.3 $/MWh
Combined cycle630898Fixed11,970 k$/year
Variable2 $/MWh
Coal-fired steam cycle350900–1000Fixed25,260 k$/year
Variable4.6 $/MWh
Table 4. Environmental impact of emissions from a combined cycle and a coal-fired power plant (data source: [105].)
CO2NOxSO2Ash
Combined Cycle≤0.45 kg/kWh *<50 mg/Nm300
Coal Power Plant≤0.85 kg/kWh500 mg/Nm3 **400 mg/Nm3 ***<50 mg/Nm3
* at full load; ** for rated power over 500 MWth and 200 mg/Nm3 for newly-built plants; *** for power plants built after 2016.
Table 5. Cooling water consumption depending on the fuel burnt (data source: [111,112]).
FuelCooling Water Consumption [m3/GJ Delivered]
Coal0.28
Subbituminous Coal0.43
Bituminous Coal0.19
Lignite Coal0.41
Natural Gas0.041
Publisher’s Note: MDPI stays neutral with regard to jurisdictional claims in published maps and institutional affiliations.