Article

Doweled cross Laminated Timber (DCLT) Building Air Tightness and Energy Efficiency Measurements: Case Study in Poland

by
Jadwiga Świrska-Perkowska
1,
Anna Wicher
1,
Sławomir Pochwała
2,
Stanisław Anweiler
3,* and
Michał Böhm
4
1
Department of Physics of Materials, Faculty of Civil Engineering and Architecture, Opole University of Technology, Katowicka 48, 45-061 Opole, Poland
2
Department of Thermal Engineering and Industrial Facilities, Faculty of Mechanical Engineering, Opole University of Technology, Mikołajczyka 5, 45-271 Opole, Poland
3
Department of Process and Environmental Engineering, Faculty of Mechanical Engineering, Opole University of Technology, Mikołajczyka 5, 45-271 Opole, Poland
4
Department of Mechanics and Machine Design, Faculty of Mechanical Engineering, Opole University of Technology, Ulica Mikołajczyka 5, 45-271 Opole, Poland
*
Author to whom correspondence should be addressed.
Energies 2022, 15(23), 9029; https://doi.org/10.3390/en15239029
Submission received: 10 October 2022 / Revised: 15 November 2022 / Accepted: 18 November 2022 / Published: 29 November 2022
(This article belongs to the Special Issue Selected Papers from the 54th Inter-University Metrology Conference)

Abstract

:
A contemporary challenge for the construction industry is to develop a technology based on natural building materials which at the same time provides high energy efficiency. This paper presents the results of an airtightness test and a thermal imaging study of a detached house built with technology using cross laminated dowelled timber panels. The thermal conductivity coefficients of the wood wool used to insulate the walls and ceiling of the building have also been measured, the linear heat transfer coefficients of the structural nodes have been numerically determined, and calculations have been made regarding the energy efficiency of the building. On the basis of the research, it was found that the air exchange rate in the analyzed building n50 is at the level of 4.77 h−1. Air leaks were also observed in the places of connection of longitudinal walls with the roof and at the junction of window frames with external walls. The experimentally determined thermal conductivity coefficient of the wood wool was ~10% higher than that declared by the manufacturer. Calculations for the energy performance certificate showed that an increase of ~10% in the thermal conductivity coefficient of the wood wool used to insulate the building results in a heating demand increase of 2.1%. It was also found that changing the value of the parameter n50 from 1.0 h−1 to 4.77 h−1 leads to a 40.1% increase in heat demand for heating the building. At the same time, the indicators for final energy demand EK and non-renewable primary energy demand EP increase by 18.1%.

1. Introduction

Over the past decades, the development of the construction sector has been shaped by the desire to reduce the human impact on the environment and raise awareness of the depletion of natural resources. Therefore, wood, as the only fully renewable construction material that also contributes to reducing the carbon footprint, is currently attracting increasing interest [1]. The choice of wood as the basic material for house construction is associated with numerous benefits from an ecological point of view. Both the production of the material and the construction and disposal of wooden structures are generally more environmentally friendly than steel, brick, or reinforced concrete structures. For example, in [2], it was shown that replacing traditional brick walls with partitions made of cross-laminated timber would result in a reduction of CO2 emissions to the atmosphere resulting from the production of materials and operational processes by as much as 59%. On the other hand, according to [3], the production of a 3-m high column made of reinforced concrete or steel would involve, respectively, three times and nine times more energy consumption than an analogous structure of the same bearing capacity made of wood. In general, it can be concluded that wood-based products mostly have lower global warming potential (GWP) than other building materials [4]. Besides, trees sequester carbon dioxide from the atmosphere during the growth period through photosynthesis, which is then stored in wood products throughout their lifetime. In this way, wood structures act as carbon stores, which is more effective the longer the life of the component [5].
The recent renaissance in timber construction is also associated with the emergence of a whole range of wood products, such as cross-laminated timber (CLT) [6], glue-laminated timber, or laminated veneer lumber, whose strength properties exceed those of solid wood. Another important aspect here is that wood has a low volume weight and heat conductivity [7] compared to other construction materials, which allows the production of large prefabricated elements from flat panels and spatial modular elements that can be conveniently transported and moved on site [8,9]. With improvements in industrial production leading to high levels of prefabrication and the development of techniques for assembling panel elements, timber structures have found a distinctive application area in the civil engineering field, including low and multi-storey residential buildings, schools, and bridges [10].
The materials used and the construction technology significantly influence the characteristics of the building during its lifetime. In many respects, the environmental aspirations are in line with those of the building user. Thus, the lower the energy intensity of a building, the greater the environmental benefits and comfort for the building user. Similarly, the fewer harmful substances of artificial origin in the building material, the lower the negative impact of the building on the environment and the healthier the microclimate inside the building. Solid wood, as a material of natural origin, creates a healthy interior microclimate. Unfortunately, the situation is different in the case of wood composite, in which the connection of the individual components requires the use of an adhesive. These are most often petroleum-based adhesives containing, for example, urea-formaldehyde or phenol-formaldehyde resins. These substances irritate and sensitize the skin, so prolonged exposure to them may lead to allergic reactions [11]. The inhalation of gaseous formaldehyde, which can be released, for example, from composite wood or emitted during its production, is furthermore carcinogenic to humans, which makes the toxicity of these substances perfectly clear [12].
The above-mentioned drawbacks disappear in the case of so-called dowelled cross-laminated timber (DCLT). In this type of panel, layers of wood are connected to each other by perpendicular pegs placed in pre-drilled holes. The dowels are made of hardwood, such as ash, oak, or beech, and are kiln-dried before being inserted into the panel. Once embedded in the hole, the dowel recovers lost moisture, expands, and becomes wedged, creating a permanent bond between the layers. One technology that uses pegged solid timber elements for house construction is Holz100 technology developed in Austria [13]. Massive timber structures have a number of advantages, which include good fire resistance [3,14] and high airtightness [15,16,17,18]. The good fire properties are due to the fact that in these structures there is a one-dimensional charring, in contrast to frame structures where oxygen flows into the posts from two directions [9]. The high airtightness of solid wood walls, on the other hand, is related to the fact that they are large panels of solid wood that can form an airtight structure [16]. These structures have fewer components and joints through which air can leak.
Air tightness is the main parameter of the building envelope which influences the intensity of air infiltration in the building. By infiltration, we mean the process of penetration of air mass through gaps and random openings in the shell, caused by a pressure difference in the building enclosure elements. This pressure difference may result from a temperature gradient along the height of the building (the so-called chimney effect) and wind pressure, or from the operation of mechanical ventilation. The infiltration phenomenon therefore depends on parameters, such as temperature distribution, wind speed and direction, and the location of the building. The airtightness, which is supposed to be the parameter characterizing the building envelope, is defined as the mass of air infiltrating the building in a certain time at a pressure difference in the envelope of 50 Pa. By imposing a pressure gradient, the influence of climate on the intensity of the analyzed phenomenon is reduced [19]. It follows from the work [20] that the calculations concerning the energy performance of a building become reliable only after the experimental verification of the building airtightness, and no estimated values of the airtightness parameters can replace the results obtained from measurements [19,21].
The air tightness of a building is expressed by the average air leakage rate at a pressure difference of 50 Pa (in m3/(h∙m2)) or air change rate per hour at a pressure difference of 50 Pa (in h−1) (n50 value) [22]. The tightness of the building, just after the thermal insulation of partitions, is an important parameter defining the energy intensity of the building, because the greater the stream of air coming from outside, the greater the heat demand to heat the inflowing air [15,17,18,23,24]. This parameter turns out to be particularly important especially in cold climates [24,25]. The energy significance of the infiltration phenomenon has increased with the increase of requirements concerning the thermal insulation of partitions, at the same time leading to a situation whereby a further increase of investments in insulation does not result in a significant reduction of the energy intensity of buildings. Adequate air tightness is also one of the basic requirements for energy-efficient and passive houses [24].
In this paper [17], a life cycle analysis approach was used to determine the primary energy demand of a multi-storey building constructed using three different timber building systems: CLT, post and beam structure made of glued laminated timber and veneer laminated timber, and modular volume prefabricated elements. For calculation of the energy efficiency of the object, the air infiltration rate was adopted on the basis of the values declared by manufacturers, i.e., 0.2 L/(s∙m2)—in the case of CLT and 0.4 L/(s∙m2)—in the case of the post and beam structure and the modular system. The annual energy demand for heating and ventilation was calculated using the VIP+ software, based on the dynamic hourly method. The simulations showed that the most favorable system was found to be the system with CLT, which showed 11% and 10% lower energy demand for heating and ventilation, respectively, compared to beam-and-column construction and the modular system. This was mainly due to the low value of air infiltration, consistent with this type of building.
The article [18] is devoted to the topic of energy efficiency of a single-family house and hygrothermal behavior of partitions made of CLT in different climates in the USA. The research focuses on determining the influence of thermal mass and infiltration phenomena in CLT houses on heating and cooling demand and on hygrothermal conditions in the building envelope. Simulations of the building energy consumption were carried out using EnergyPlus software. A house with low (n50 = 7) and high airtightness (n50 = 2) was analyzed. The results of the calculations were compared with the results obtained for a reference building, which is a standard timber frame construction (n50 = 7). The simulation results show that the use of CLT leads to a reduction in annual energy costs in all climates, with greater savings achieved in cold climates (up to 38% reduction in annual heating energy) than in hot climates (17% reduction in annual cooling energy). The results of the calculations also indicate that the better heating efficiency of houses with CLT is mainly due to the greater airtightness of these structures.
The authors of the paper [26] tried to establish the relationship between enclosure tightness, infiltration, and energy consumption for a typical Finnish single-family house. For this purpose, the behavior of a single residential building was simulated under different conditions. Parameters, such as climatic conditions, wind shielding of the building, distribution of air leakage, and air exchange rate were changed. The building analyzed was a two-storey detached house with a timber frame construction and mineral wool insulation. The building model was created using the IDA-ICE 3.0 software, which enables the simultaneous dynamic simulation of heat and air flow. Based on the results of the calculations, the authors found that the infiltration phenomenon is responsible for 15–30% of the energy consumption for heating, and the heat demand for heating increases approximately linearly with an increase in n50.
In [27], the results of airtightness tests of 42 wooden houses built in Korea between 2006 and 2016 with different technologies were presented. The mean value of n50 for the light-frame houses (30 houses) was 3.7 h−1, while for the post-and-beam houses (8 houses) it was 5.5 h−1. The lowest mean value of n50, equal to 1.1 h−1, was obtained for the houses made of CLT (2 houses), respectively, 1.4 h−1 for the house without air barrier, and 0.7 h−1 for the house with air barrier installed. The last value mentioned above was the lowest one obtained in all the tests performed. Due to the fact that in the case of five frame houses without air barrier, the valuen_n50 below 1.5 h−1 was recorded, the authors concluded that, due to time and cost, the use of an air barrier is justified only in the case of houses for which a higher airtightness standard is required (n50 ≤0.6 h−1). In other cases, airtightness can be ensured by appropriate care in the construction of the structure and its joints.
To the authors’ knowledge, there are no studies in the world literature dedicated to the airtightness and energy performance of buildings made of DCLT. DCLT combines the concepts of ply dowelled timber (DLT; planks stacked and connected by pegs) and CLT and is one of the latest mass timber products invented in recent decades [1]. This type of panel is made by stacking several layers of planks, each of which is turned 90° or 45° with respect to the previous one, and joining them using perpendicular wooden dowels Manufacturers of DCLT systems claim [28] that these panels have an air permeability corresponding to class 4 according to EN 12207. This means that, at a pressure difference of 50 Pa, the air flow through the element relative to its surface is less than 2 m3/(h∙m2) [29]. The same class of air permeability is included in the panels manufactured by CLT wood manufacturers [30]. Since five-layer CLT elements with low moisture content (13%) at the time of installation are considered an airtight layer [31], it can be expected that a building made of CLT with properly sealed joints will have high airtightness. Similar statements are also made by manufacturers of DCLT systems, claiming that a wind barrier is not necessary for these buildings, and that buildings with well-sealed joints meet airtightness standards corresponding to passive buildings (n50 ≤ 0.6 h−1) [32].
This paper presents the results of an airtightness test on a single-storey detached house made of DCLT panels without wind barrier, which was insulated with wood wool. The test was performed using the blower door method, and tracer gas was used to detect leaks in the building envelope. Thermal bridges and leakage points in the building envelope were located using infrared imaging. To determine the causes of thermal anomalies appearing on thermograms, temperature distributions were calculated numerically in the building junctions, for which these anomalies were the largest (external wall/ceiling and external wall/window junction). The calculations were performed for ambient conditions corresponding to the measurement conditions. The models created in THERM software took into account the possibility of thermal insulation discontinuity at the junction. The resulting distributions were compared with the temperature values recorded by the thermal imaging camera. The thermal conductivity coefficient of the wood wool used to insulate the building was also verified. The thermal conductivity of the insulation was measured using a HFM 446 Lambda plate apparatus [33]. Then, calculations of the energy performance of the building under consideration were carried out. For this purpose, the ArCADia-TERMOCAD software was used [34], determining the heat demand for heating with the quasi-stationary monthly method. The linear heat transfer coefficients of thermal bridges, whose values are entered into ArCADia-TERMOCAD, were determined numerically with the use of THERM software [35]. Calculations of energy characteristics have been performed four times: for two different values of parameter n50 (experimentally determined and value recommended for energy-saving buildings) and for different values of thermal conductivity coefficient of insulation (declared by manufacturer and experimentally determined).
This article adds to the existing knowledge on the airtightness and energy performance of buildings made of DCLT, a technology which is an interesting alternative to CLT structures and to which little research work has been devoted so far [1]. The method of determining the causes of thermal anomalies occurring in the object, based on the comparison of temperature distributions obtained from thermograms and from numerical calculations carried out for identical ambient conditions, can also be regarded as an original element of the work.

2. Materials and Methods

2.1. Analysed Bulilding

The subject of the research, as shown in the Figure 1, is a house constructed from solid wood DCLT. This technology uses coniferous wood, felled in winter, from controlled habitats. The trees are felled during the waning phase of the moon to ensure that the wood lasts longer. The felled trees are stored for two years. They are used to make 12–36-cm thick walls, made up of several layers of cross and diagonal planks. The boards are connected in a purely mechanical way using wooden beech pegs. Massive wooden boards are load-bearing, stiffening, and non-load-bearing elements of walls, ceilings, and roofs. The individual components of the building are connected to each other with screws. Therefore, these houses are easy to demolish—just break the mechanical connections that hold the house together. A new house can be built from the reclaimed raw material [32].
Holz100 panels are highly fire-resistant; they remain load-bearing after 150 min of exposure to a 900—1000 °C flame. The lack of adhesive between the layers of Holz100 leaves microscopic gaps which are filled with air. As a result, 36-cm thick walls have the same heat transfer coefficient as a 75-cm thick glulam wall. From a structural point of view, Holz100 walls consist of only one thick layer of wood and the wood wool used for insulation is highly vapor-permeable, which means that walls in this technology are built without a vapor barrier. At the same time, it should be noted that Holz100 buildings are often constructed as passive houses with a particularly high standard of airtightness. The airtightness of the building is, of course, determined in this case by the appropriately careful execution of the connections of the individual elements of the outer shell [32].
The analyzed building was erected in 2019. It is a single-family single-storey house with a usable area of 93.5 m2 and a volume of 261.8 m3. The body of the building is simple; the aspect ratio (A/V) is 1.48 m−1. The building has a gable roof with a slope angle of 30° covered with tiles. The roof structure consists of glued laminated timber frame and truss girders. The central heating system and the hot water system are powered by an air-source heat pump. The building is equipped with gravity ventilation.
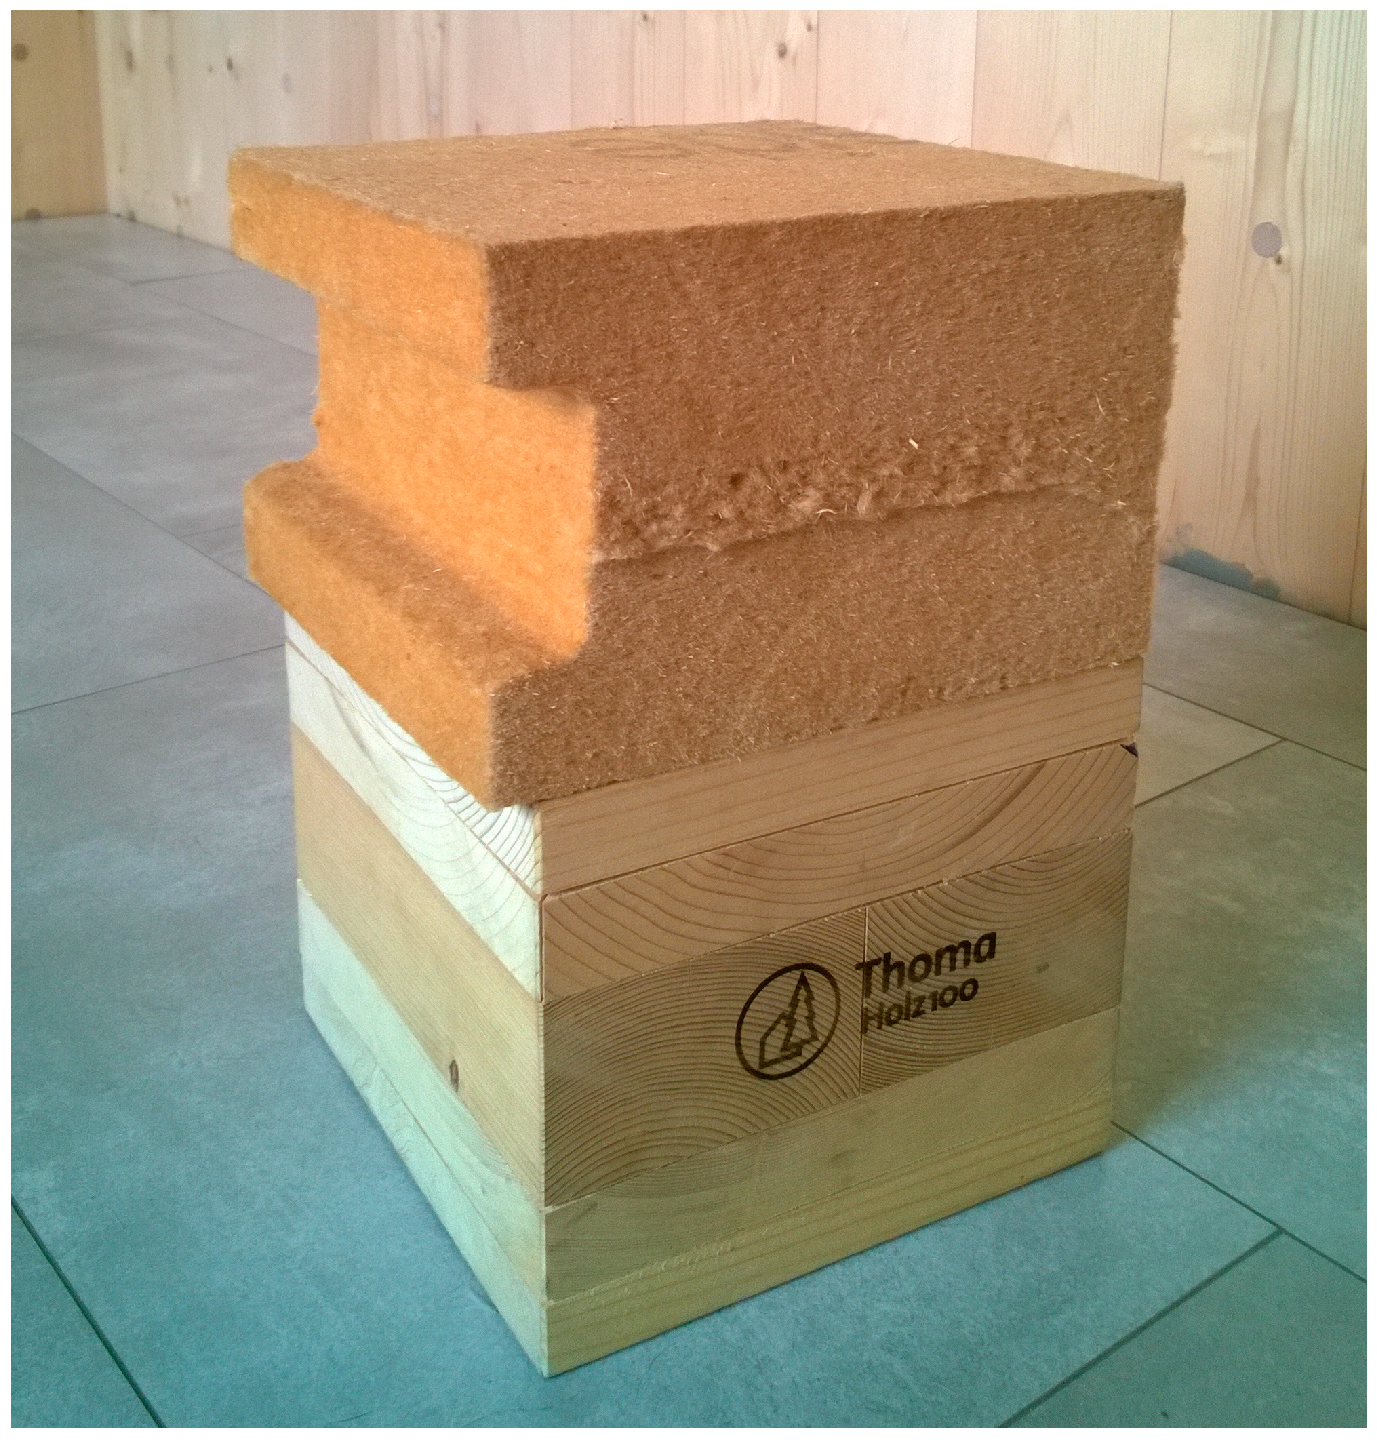
The load-bearing element of the external walls consists of layers of wood with a total thickness of 17 cm. The thermal conductivity coefficient of this material adopted for the purposes of this study is 0.120 W/m∙K (according to the manufacturer’s declaration). The next layer of wall is the thermal insulation in the form of wood wool with a thickness of 14 cm and thermal conductivity coefficient of 0.038 W/(m∙K). This is followed by a 3-cm air cavity and 2-cm thick façade boards. The façade boards are not impregnated with artificial chemical impregnates. The properties of the materials forming the successive wall layers are summarized in Table 1. Figure 2 shows a sample of a wall section.
The load-bearing elements of the floor are the lower beams of the 168 cm roof girders, spaced every 90 cm. Between the beams, on a 4-cm thick wooden grid, two layers of wood wool are placed, 16- and 14-cm thick respectively, with a thermal conductivity coefficient of 0.036 W/(m∙K). The ceiling is made of a clay slab. The parameters of the individual layers are summarized in Table 2.
The foundation of the building is a 20 cm thick concrete slab. Under the slab is a 20-cm layer of polystyrene with a thermal conductivity coefficient of 0.035 W/(m∙K). Another layer of polystyrene, this time 10-cm thick, is placed on top of the slab (λ = 0.036 W/(m∙K)). The base for finishing layers of the floor is a 7-cm thick cement screed. Parameters of individual layers of the floor on the ground are presented in Table 3.
The window woodwork used in the building has a heat transfer coefficient of 0.8 W/(m2∙K) (value for the entire window), while the wooden entrance door has a U-value of 1.0 W/(m2∙K).

2.2. Tightness Tests and Thermal Imaging Tests

The described tests were carried out in March 2020 and in June 2021, respectively, one and two years after the building was put into use (the airtightness test was repeated, because there were wind gusts during the first measurements). The tightness of the external building envelope was determined using the pressure, blower door method, in accordance with the recommendations of PN-EN ISO 9972:2015-10 [36]. Before starting the tightness test, all openings and ventilation ducts were covered, and windows were closed. In this way, potential points of additional air leakage were eliminated. In addition, a tracer gas which was produced in a portable smoke generator was used to check the tightness of selected joints in the building envelope.
In addition, during the airtightness test, thermal imaging camera inspections were performed to locate thermal bridges and leaks (air leakage) in the building envelope. The operation of the fan helps to visualize air leakage areas on the thermal imaging camera image because it intensifies the convective heat exchange carried by the infiltrating air. Detection of thermal defects in the building envelope was carried out in accordance with PN-EN 13187 [37]. The difference in air temperature on the external and internal surface of the building envelope was within the recommended range and equaled 11.1 °C. A FLIR E6 thermal imaging camera was used for the measurements [38]. The thermograms generated using this camera are complete radiometric results of thermal imaging of the building.

2.3. Thermal Conductivity Tests of the Wood Wool

The thermal conductivity of wood wool was measured in accordance with PN-EN 12664:2002 [39] and PN-EN 12667:2002 [40] using a device with a heating plate and a HFM 446 Lambda Small heat flux meter, shown in Figure 3, in which the material sample under test is placed between two plates of different temperatures. The temperatures of the plates are individually controlled by bidirectional Peltier systems for cooling or heating, integrated into an external chiller. Three K-type thermocouples are placed on the surface of each plate to measure the temperature with an accuracy of 0.01 °C. The heat flux through the sample is measured by two calibrated transducers covering the central surface of each 102 × 102 mm plate. The apparatus is also equipped with an integrated transducer with a resolution of 1 μm, enabling measurement of the actual thickness of the sample. The maximum sample size is 203 × 203 × 51 mm.
After inserting the sample and setting the desired average temperature and temperature difference, the instrument proceeds to thermal equilibrium, after which the test is performed. The output of the heat flux transducer is calibrated using a reference standard. Calculation of the thermal conductivity coefficient λ is based on the measured average heat flux, sample thickness, and temperature difference according to Fourier’s law.
Samples of wood wool for testing were obtained from the owner of the building under analysis and are shown in Figure 4. These were two types of wood wool: soft with a density of approx. 60 kg/m3 (loft insulation) and hard with a density of approximately 110 kg/m3 (wall insulation). Due to the limited amount of material, samples of the following dimensions were cut from the board fragments obtained: 200 × 200 × 50 mm for soft wool and 105 × 105 × 50 mm for hard wool, three samples of each type. One surface of all samples was the original manufacturer’s surface.
After cutting, the samples were placed in a heating chamber and dried at 40 ± 1 °C to a constant weight (the weight of the samples was controlled once a day using a precision balance with an accuracy of 0.001 g). Then, the samples were transferred to a climatic chamber where they were conditioned at a temperature of 23 ± 1 °C and a relative humidity of 45 ± 1% until the equilibrium humidity was reached. After the mass of the samples stabilized, the coefficient of thermal conductivity was measured. The tests were carried out at an average temperature of the samples equal to 10 °C and a temperature difference between the surfaces of the samples equal to 20 °C. In the case of samples of 105 × 105 × 50 mm in size, they were placed in the central part of the measuring chamber and the empty space was filled with polystyrene foam. The temperature of the plates was then controlled using only the central thermocouples.

2.4. Energy Performance Certificate

The calculations of energy performance have been carried out in the ArCADia-TERMOCAD software, version PRO 7.4 by Intersoft. This program carries out calculations of heat demand for heating in accordance with the quasi-stationary monthly method and is one of the tools most frequently used for this purpose by Polish designers. In addition to energy performance certificates, it is also used for drawing up energy and renovation audits and energy efficiency audits, or for determining the ecological and economic effect of the planned modernization of buildings. The result of the simulation is in this case a report with an energy efficiency audit card, in which the anticipated reduction in demand for final and primary energy, additionally converted into tons of fuel oil, and reduction in carbon dioxide emissions resulting from the proposed thermo-modernization measures are detailed. In this application, it is also possible to make certified BREEAM calculations. ArCADia-TERMOCAD has a built-in graphic editor that allows to create building models and to import drawings in *.dwg format and projects of ArCADia BIM (Building Information Modelling) system, which aims to support designers in their work in accordance with the BIM concept.
To increase the accuracy of performed energy simulations, the linear heat transfer coefficients of structural nodes of the analyzed building have been determined numerically with the use of THERM version 7.6.01. This software has been developed at Lawrence Berkeley National Laboratory (LBNL) and is used to solve two-dimensional heat conduction problems based on the finite element method. As a result of the calculations, the user obtains the temperature distributions in the cross-section, the heat flux density distributions, and the value of the heat transfer coefficient U at a given edge of length l. From these quantities, the linear heat transfer coefficient of the structural node under consideration can be calculated according to Equation (1).
ψ = U · l j U j · l j ,
where Uj [W/(m2∙K)], lj [m] are, respectively, the heat transfer coefficient and the length of the j-component, included in the structural assembly under consideration.

3. Results

3.1. Tightness Test of Building

Building air tightness is described using parameters such as: air change rate per hour at a pressure difference equal to 50 Pa—n50 [h−1]; building air permeability at a pressure difference equal to 50 Pa—q50 [l/(s∙m2)], which is the ratio of the infiltrating air flux to the surface of the external partitions; building specific leakage at a pressure difference of 50 Pa—w50 [l/(s∙m2)], calculated as the ratio of the infiltrating air flux and the floor area [35]. The quantity n50 is determined as the ratio of the infiltrating air stream (V50) to the volume of the heated part of the building.
The following is a summary of the building input data used by the software used to determine the airtightness parameters of buildings according to [36]:
  • Internal volume of the heated part:     261.8 m3
  • Building shell area:            283.9 m2
  • Internal floor area:             93.5 m2
  • Building height:               5.5 m
  • Fan pressure range:            −57.5 Pa–+7.5 Pa
  • Temperature at the start of the test:     20.1 °C inside; 20.1 °C outside
  • Temperature at the end of the test:      20.1 °C inside; 20.1 °C outside;
Results of the air tightness test are summarized in Table 4.
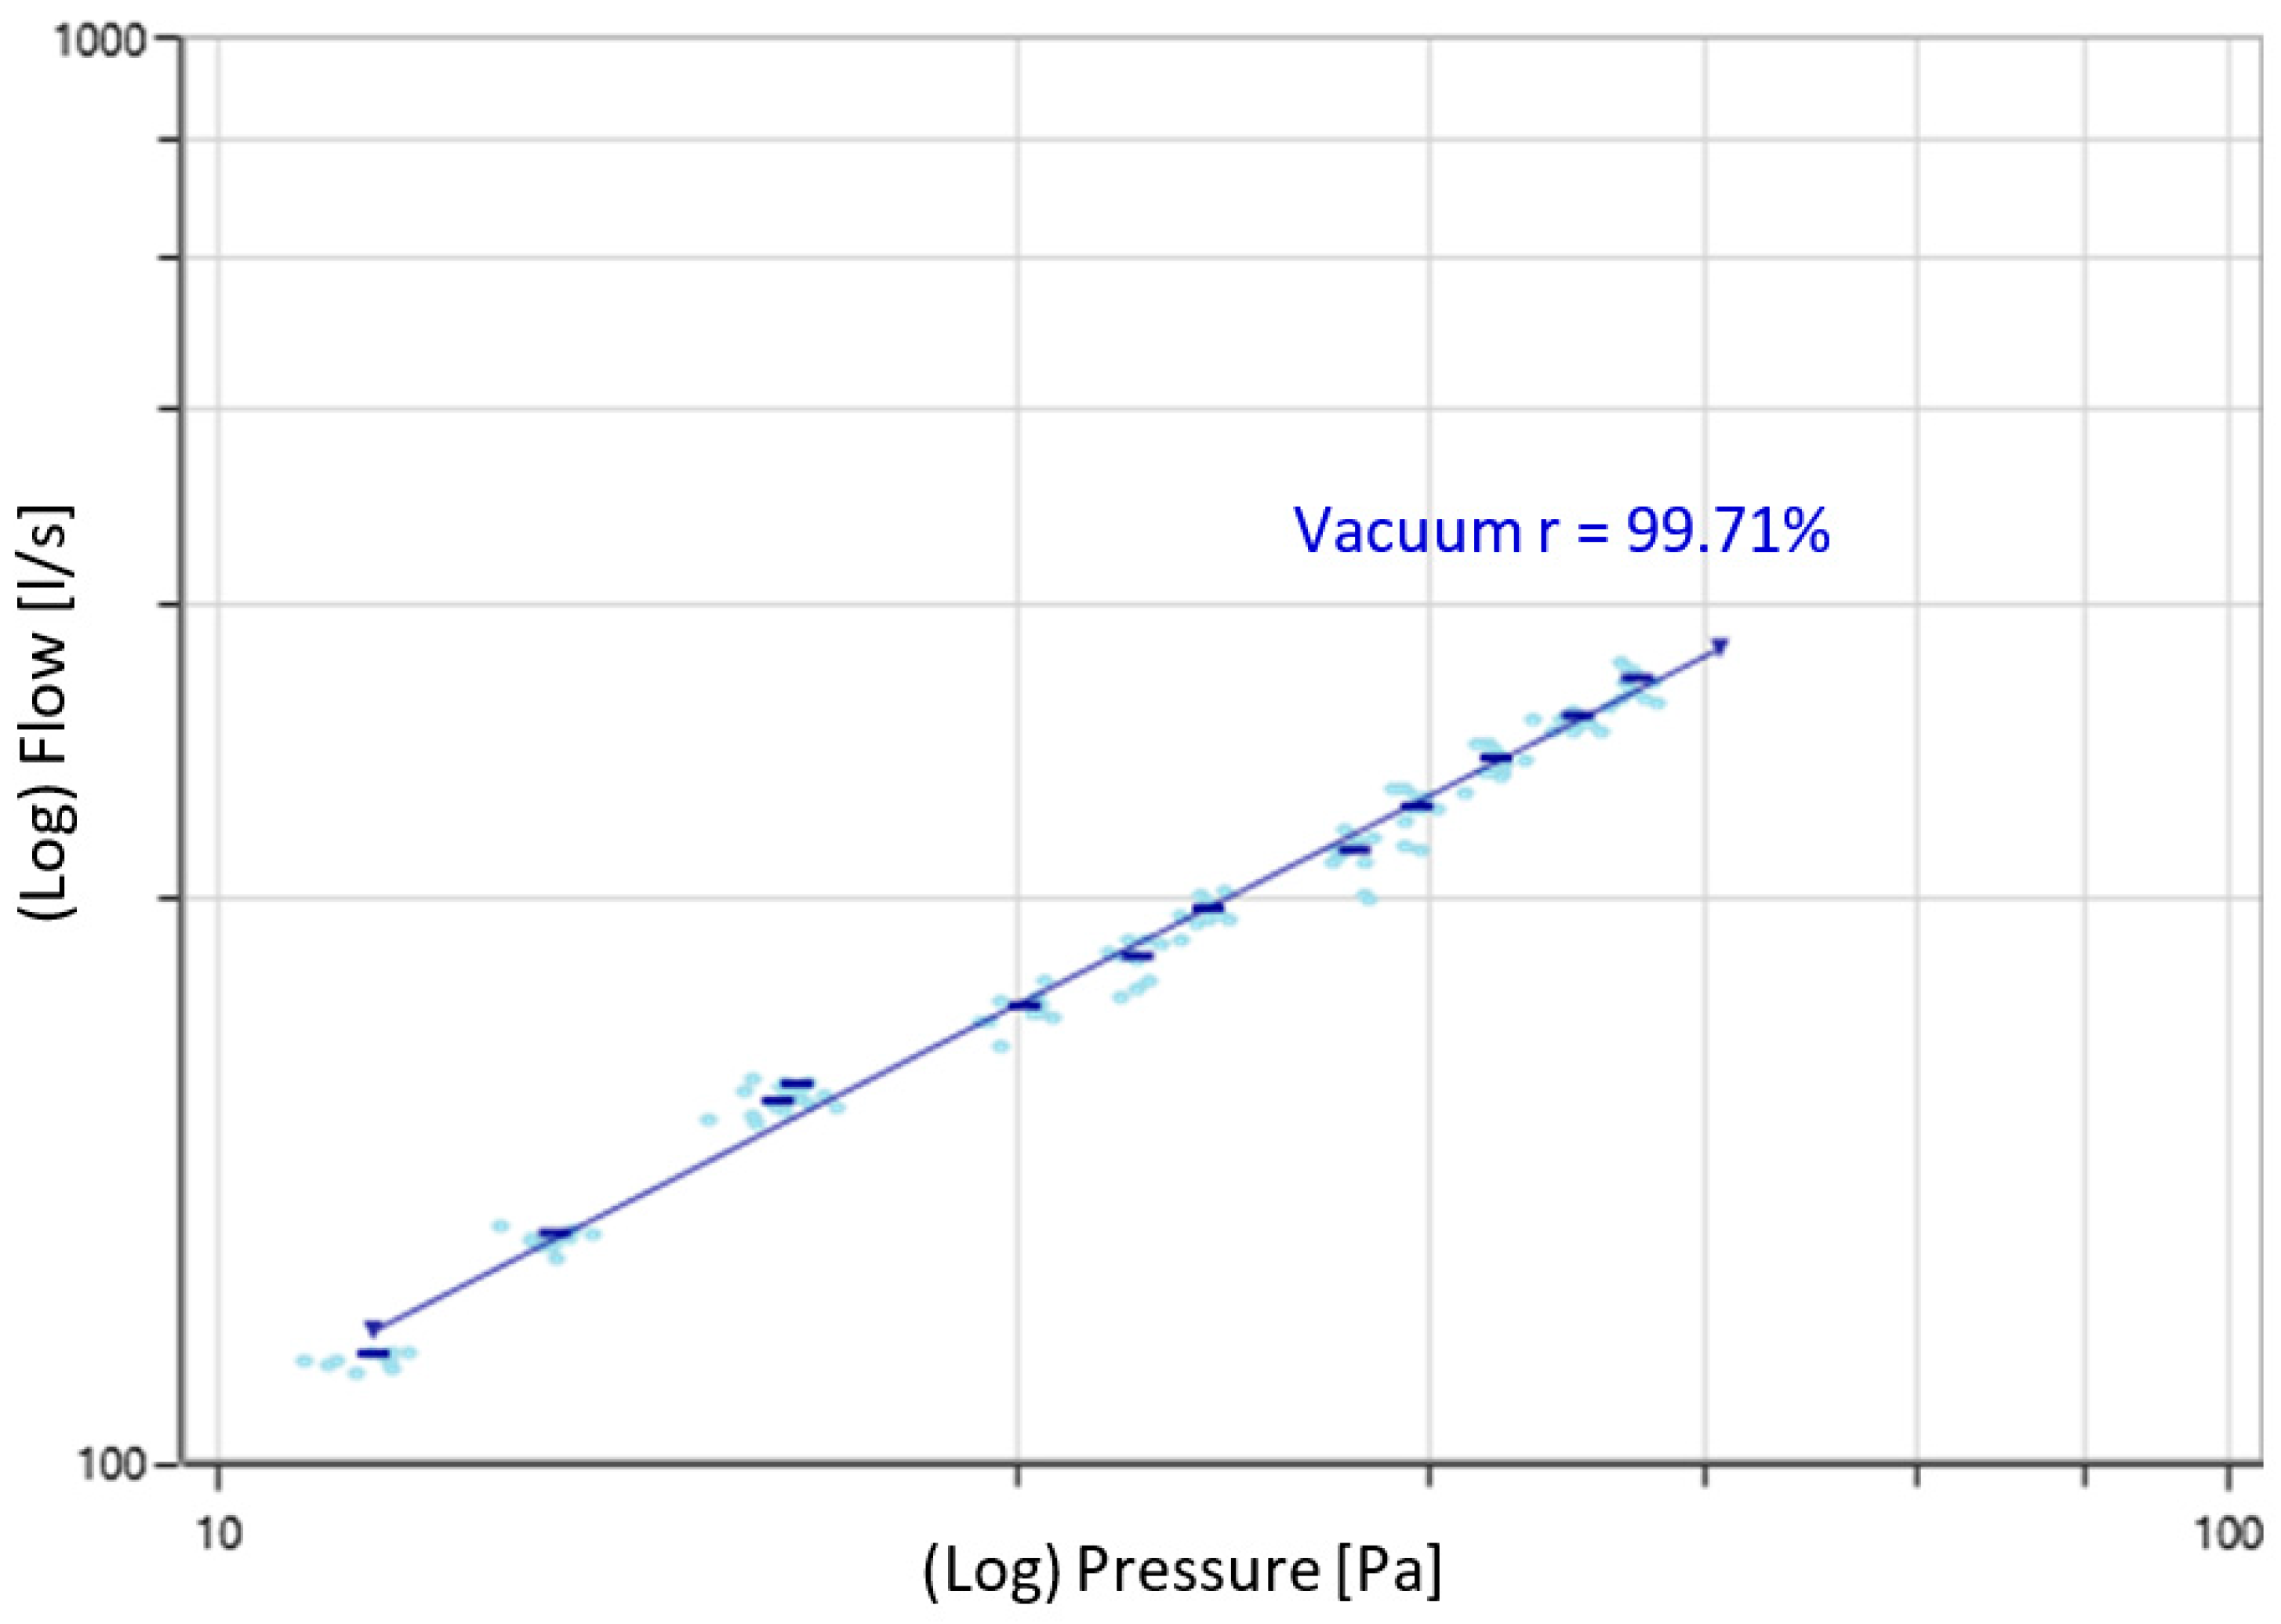
Figure 5 shows a graph of the change in air velocity through the fan during tightness measurements in relation to the pressure in the measurement system. A straight line on the graph indicates stable measurement conditions, i.e., no influence of external conditions on the measurement such as wind gusts.
In addition to the basic parameters described above which characterize the airtightness of a building, further airtightness-related parameters are listed in Table 4. These include effective leakage area, defined as the area of an ideal nozzle in cm2, which at the pressure induced by a fan permeates the same amount of air as the analyzed building [24]; equivalent leakage area, which is defined as the area of a sharp-edged opening in cm2 (a circular hole cut in a thin plate), through which the same amount of air would flow as in the building under consideration (this parameter is used to evaluate the air exchange rate) [41]; normalized leakage surface, which is the leakage area related to the surface of the building envelope [42].
An aerosol of tracer gas was used to detect airflow points and possible leaks. Testing with tracer gas was carried out during the airtightness test. It was found that the windows were not fixed properly. Air was leaking into the building through the gap between the frame and the edge of the wall, the flow of which caused the movement of portions of generated smoke. A similar phenomenon was observed at the connection between the ceiling and the exterior wall. In addition, thermal imaging tests were used to locate the leaks and places with reduced thermal insulation.

3.2. Thermal Imaging Tests

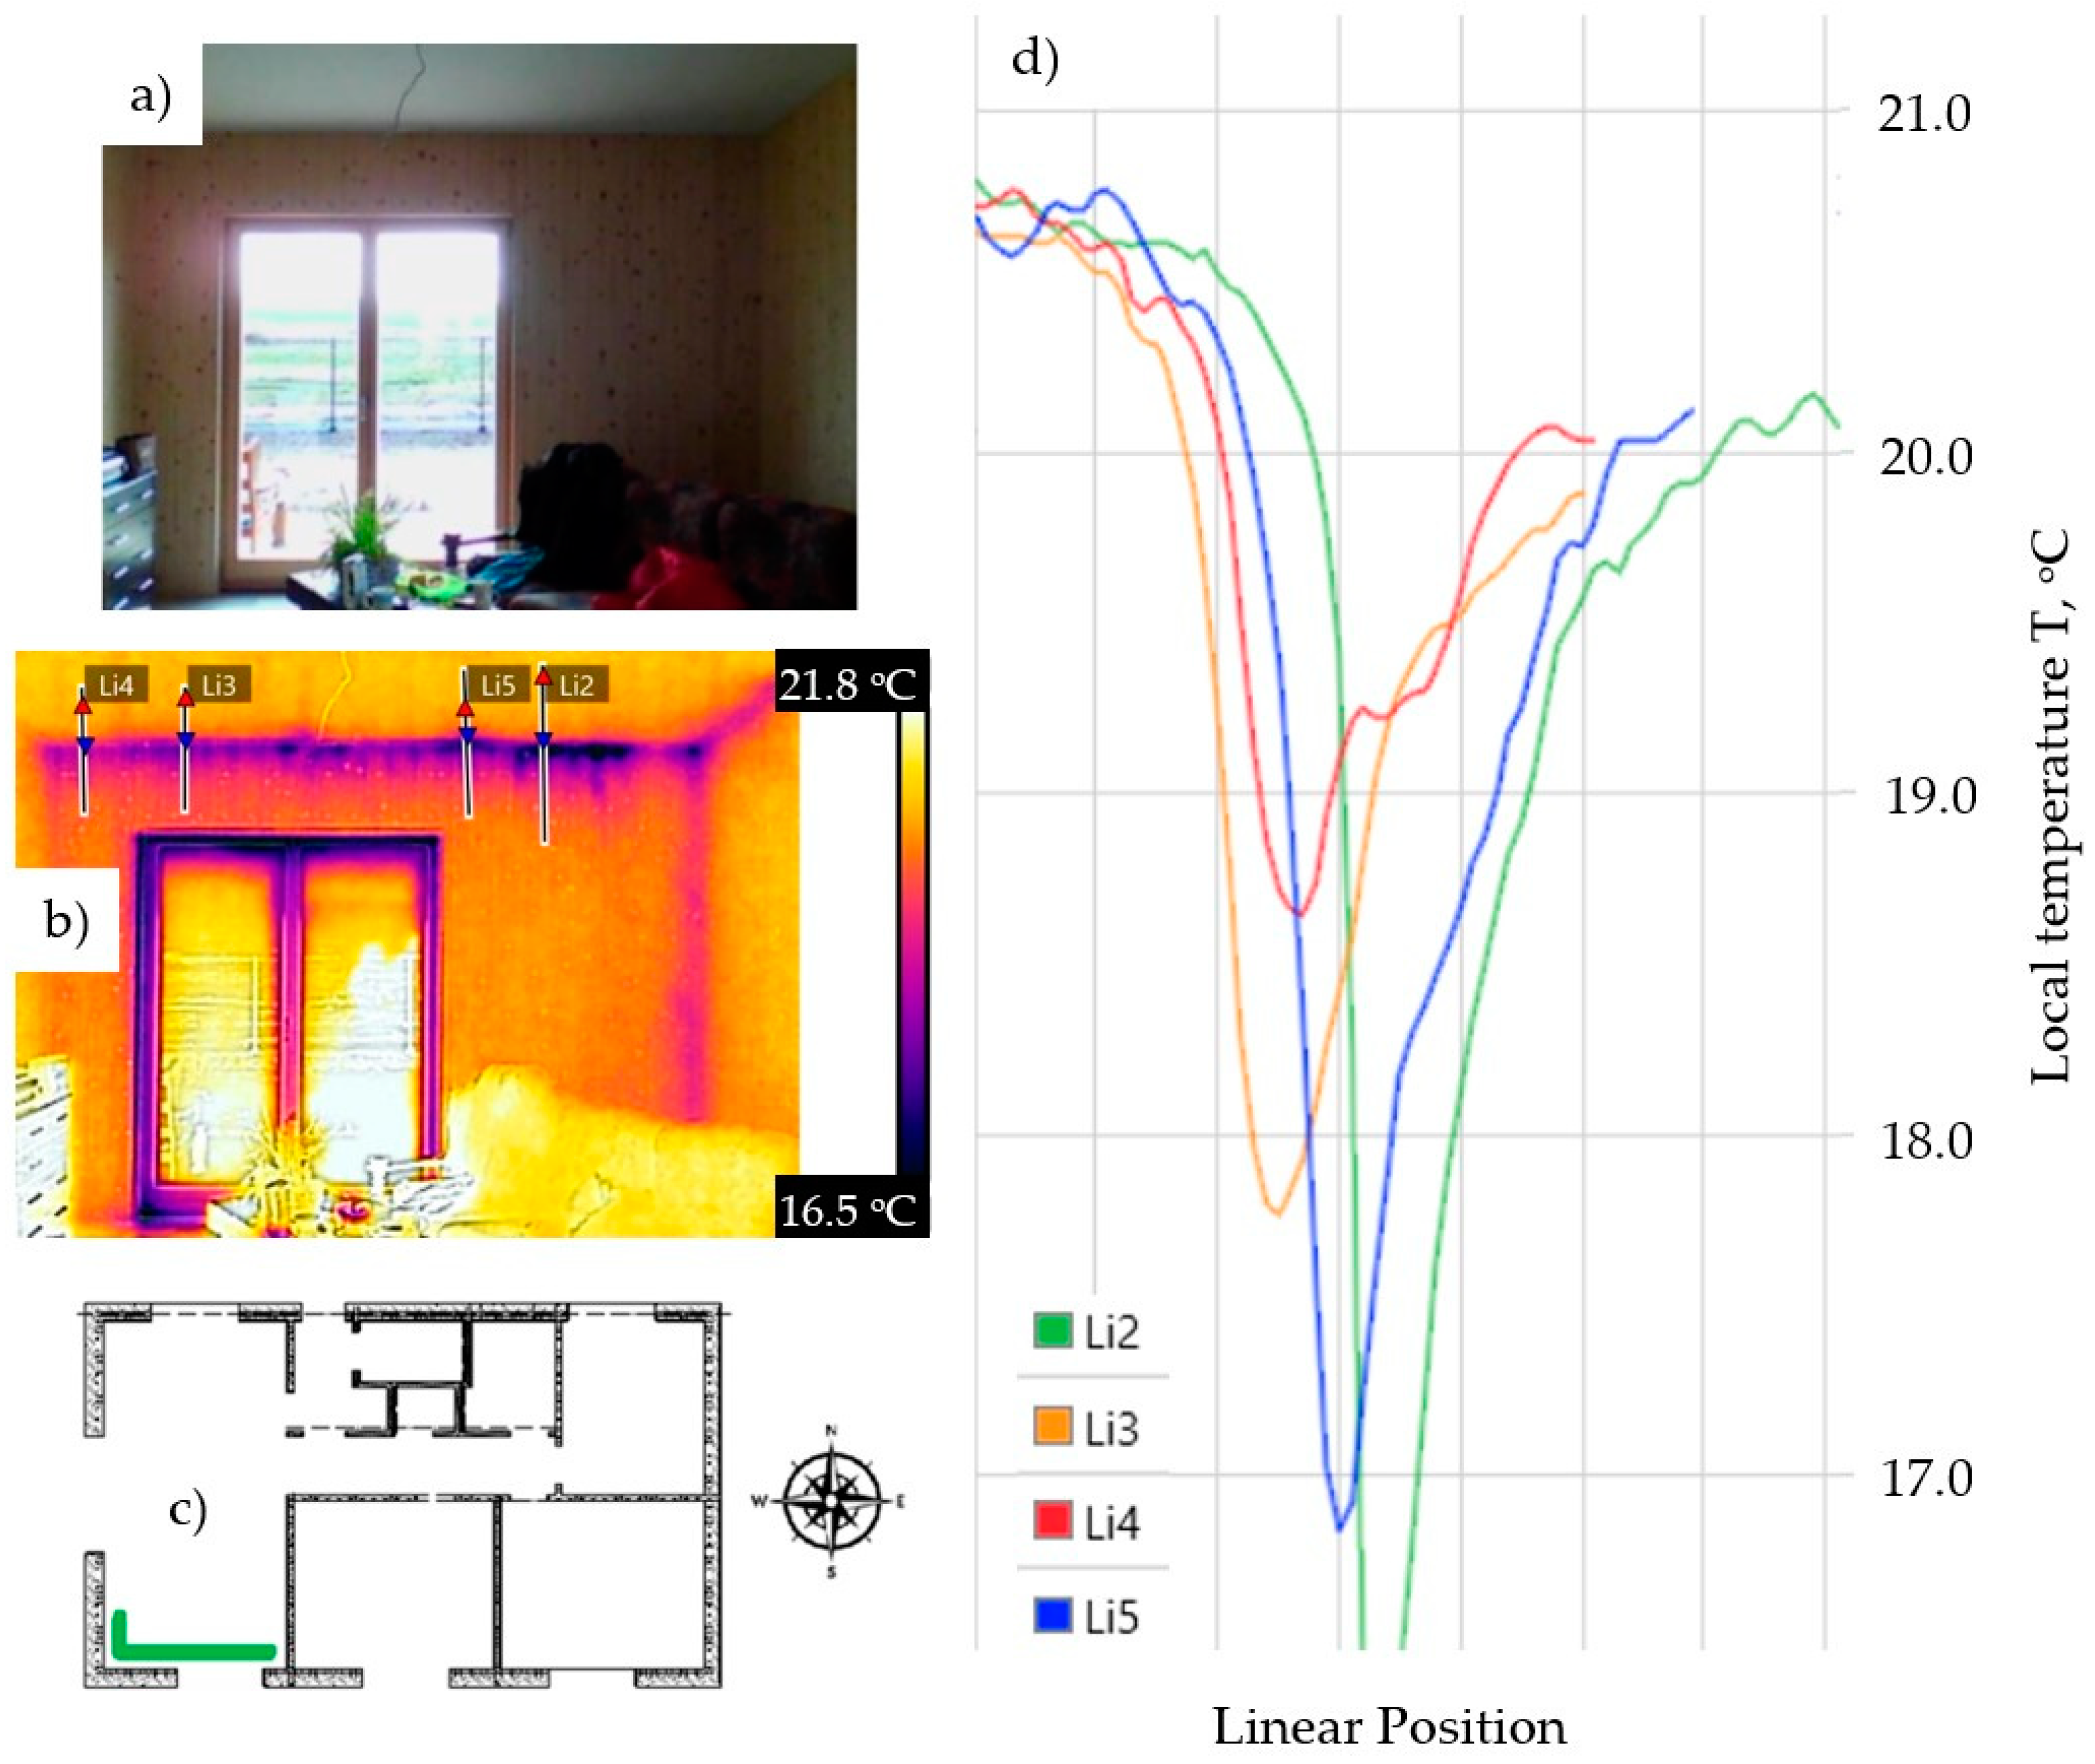
Thermal imaging was conducted during the first leakage test, which took place in March 2020. During the test, the indoor temperature was 20.1 °C and the outdoor temperature was 9 °C. The images were taken at a pressure difference between the indoor and outdoor environment of 50 Pa. The thermograms below show the results of a thermographic survey. Each thermogram is accompanied by the corresponding temperature scale. Photos in visible light are also attached, as well as a projection of the ground floor from above, on which a green line schematically indicates the location of the tested wall. In addition, the figures include plots showing temperature changes along selected lines visible in the thermograms.
Figure 6 shows the leaks visible from inside in the place of the part of the north and west wall connection with the roof, as well as reduced corner temperature of the building and overcooling of the window frame. The lowest temperatures are observed at the location of the window frame. A similar situation repeats in the other thermograms (see Figure 7, Figure 8, Figure 9 and Figure 10).
In the thermograms (Figure 6, Figure 7 and Figure 8), thermal anomalies of irregular shape, with significant temperature fluctuations, forming characteristic streaks, are visible at the interface between the external wall and the ceiling. This type of thermal anomalies usually indicates the presence of air leakage in the analyzed place [43]. On the diagrams, corresponding to the temperature distributions along the lines of the lowered temperature areas on the mentioned thermograms, one can observe significant temperature drops in the place of the external wall connection with the ceiling. In some points, the temperature drops even to 13.6 °C (line Li1 in Figure 8). These curves also have a peculiar “pointed” shape characteristic of places where heat transfer is intensified by convection (see [25] and Figure 7). Apart from the places where leaks occur, these curves have a gentler course (e.g., line Li4 and Li5 in Figure 6). It should be noted, however, that the temperatures observed at the beginning of the discussed diagrams, exceeding the ambient temperature value (20.1 °C), result from an apparent change in the emissivity of the ceiling, related to the change in the direction of observation.
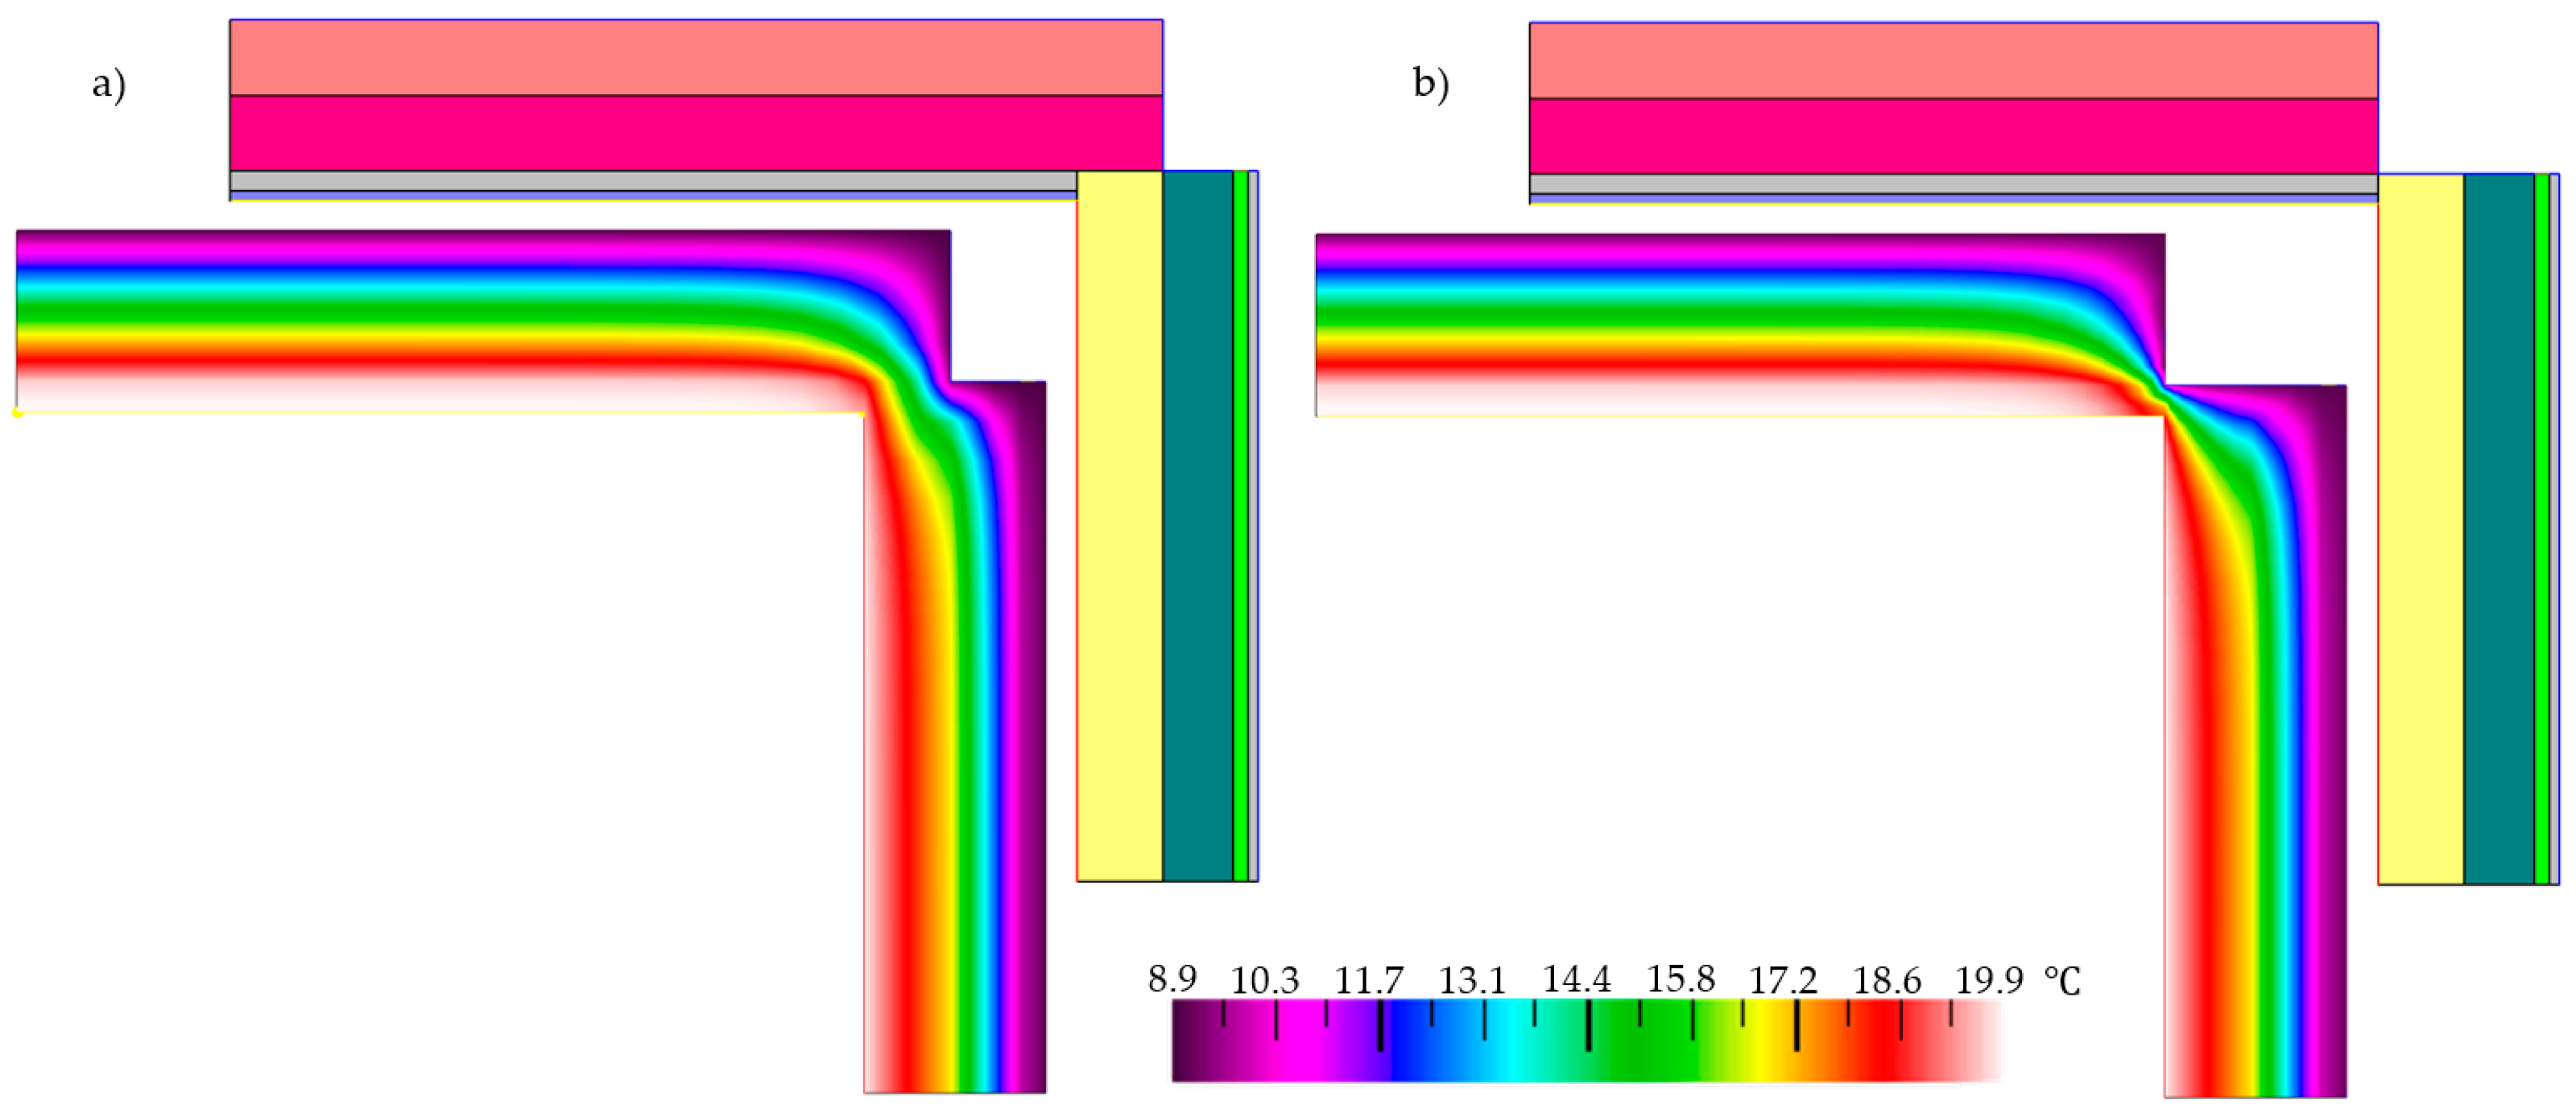
In order to confirm the hypothesis that the thermal anomalies visible in the thermograms in the external wall/ceiling junction are due to air leakage, the junction was modelled in THERM and the temperature distributions in the junction were calculated corresponding to the ambient conditions occurring during the thermovision tests. Taking into account that the insulation of the building could have been made with some defects, two cases of such defects were taken into account when modeling the joint. They concern different variants of discontinuity between the floor insulation (layers marked with pink color in Figure 10) and the wall insulation (layer marked with dark green color). For each of the analyzed cases, the temperatures occurring at the wall–ceiling interface were read, and they are 19.3 °C and 17.8 °C for variants a and b of discontinuity, respectively. As it is easy to state, the calculated temperatures considerably exceed the minimum temperatures occurring on the thermograms in the reduced temperature zones. This fact can be considered as a confirmation of the predominant share of the convective heat transfer phenomenon in the overall phenomena related to heat transport in the joint in question.
The performed detection of thermal defects also revealed the presence of thermal bridges at window frames. These types of thermal bridges are shown in the thermograms in Figure 6, Figure 7 and Figure 8. Since the tracer gas (aerosol) test results showed air leakage at the junction between the edges of the window opening and the window frame, it can be expected that the cooling of these surfaces is among other things due to heat transfer from the infiltrating air. Figure 11 shows the temperature distribution obtained from THERM at the exterior wall/window junction for ambient conditions corresponding to the thermal imaging test conditions. The graph shows the reduction in temperature of the inner surfaces of the window frame relative to that of the adjacent wall. The point with the lowest temperature, equal to 18 °C, is indicated by an arrow in the figure. Since the numerically calculated minimum temperature is higher than the minimum temperature shown by line Li1 in Figure 6 (16.2 °C), it can be concluded that the infiltration of cold air through leaks in the joint must have additionally contributed to the cooling of some parts window frame. In the case under consideration, thermal anomalies within the analyzed joint are thus the effect of the superposition of two phenomena: air leakage and thermal inhomogeneity of the joint elements.
It should be noted here that the computer-calculated temperatures of the internal surfaces of the partitions included in the analyzed joints (Figure 10 and Figure 11), at a distance from the points of contact of the elements, were as follows: exterior wall 19.8 °C, ceiling 19.9 °C, window glass 19.4 °C. On the other hand, the temperatures of these surfaces, read from the graphs of temperature changes along the lines visible in the thermograms (Figure 6, Figure 7 and Figure 8), range from ~18.7 °C to ~20.2 °C for the outer wall, ~19.3 °C to ~20.5 °C for the ceiling, and from ~19.7 °C to ~21.3 °C for the window glass. Taking into account the fact that infrared thermography is considered more of a qualitative than a quantitative research method, and that there are changes in the apparent emissivity of the surface as the direction of observation changes, it should be said that a fairly good agreement between the calculation results and measured data was obtained here. In addition, the lower temperature of the wall surface read from the thermograms is due to the washing of the surface by the cold air flow penetrating the leaking joints, while the higher temperature of the window glass is due to the action of solar radiation (none of the phenomena discussed above was taken into account in the numerical model of the joints).
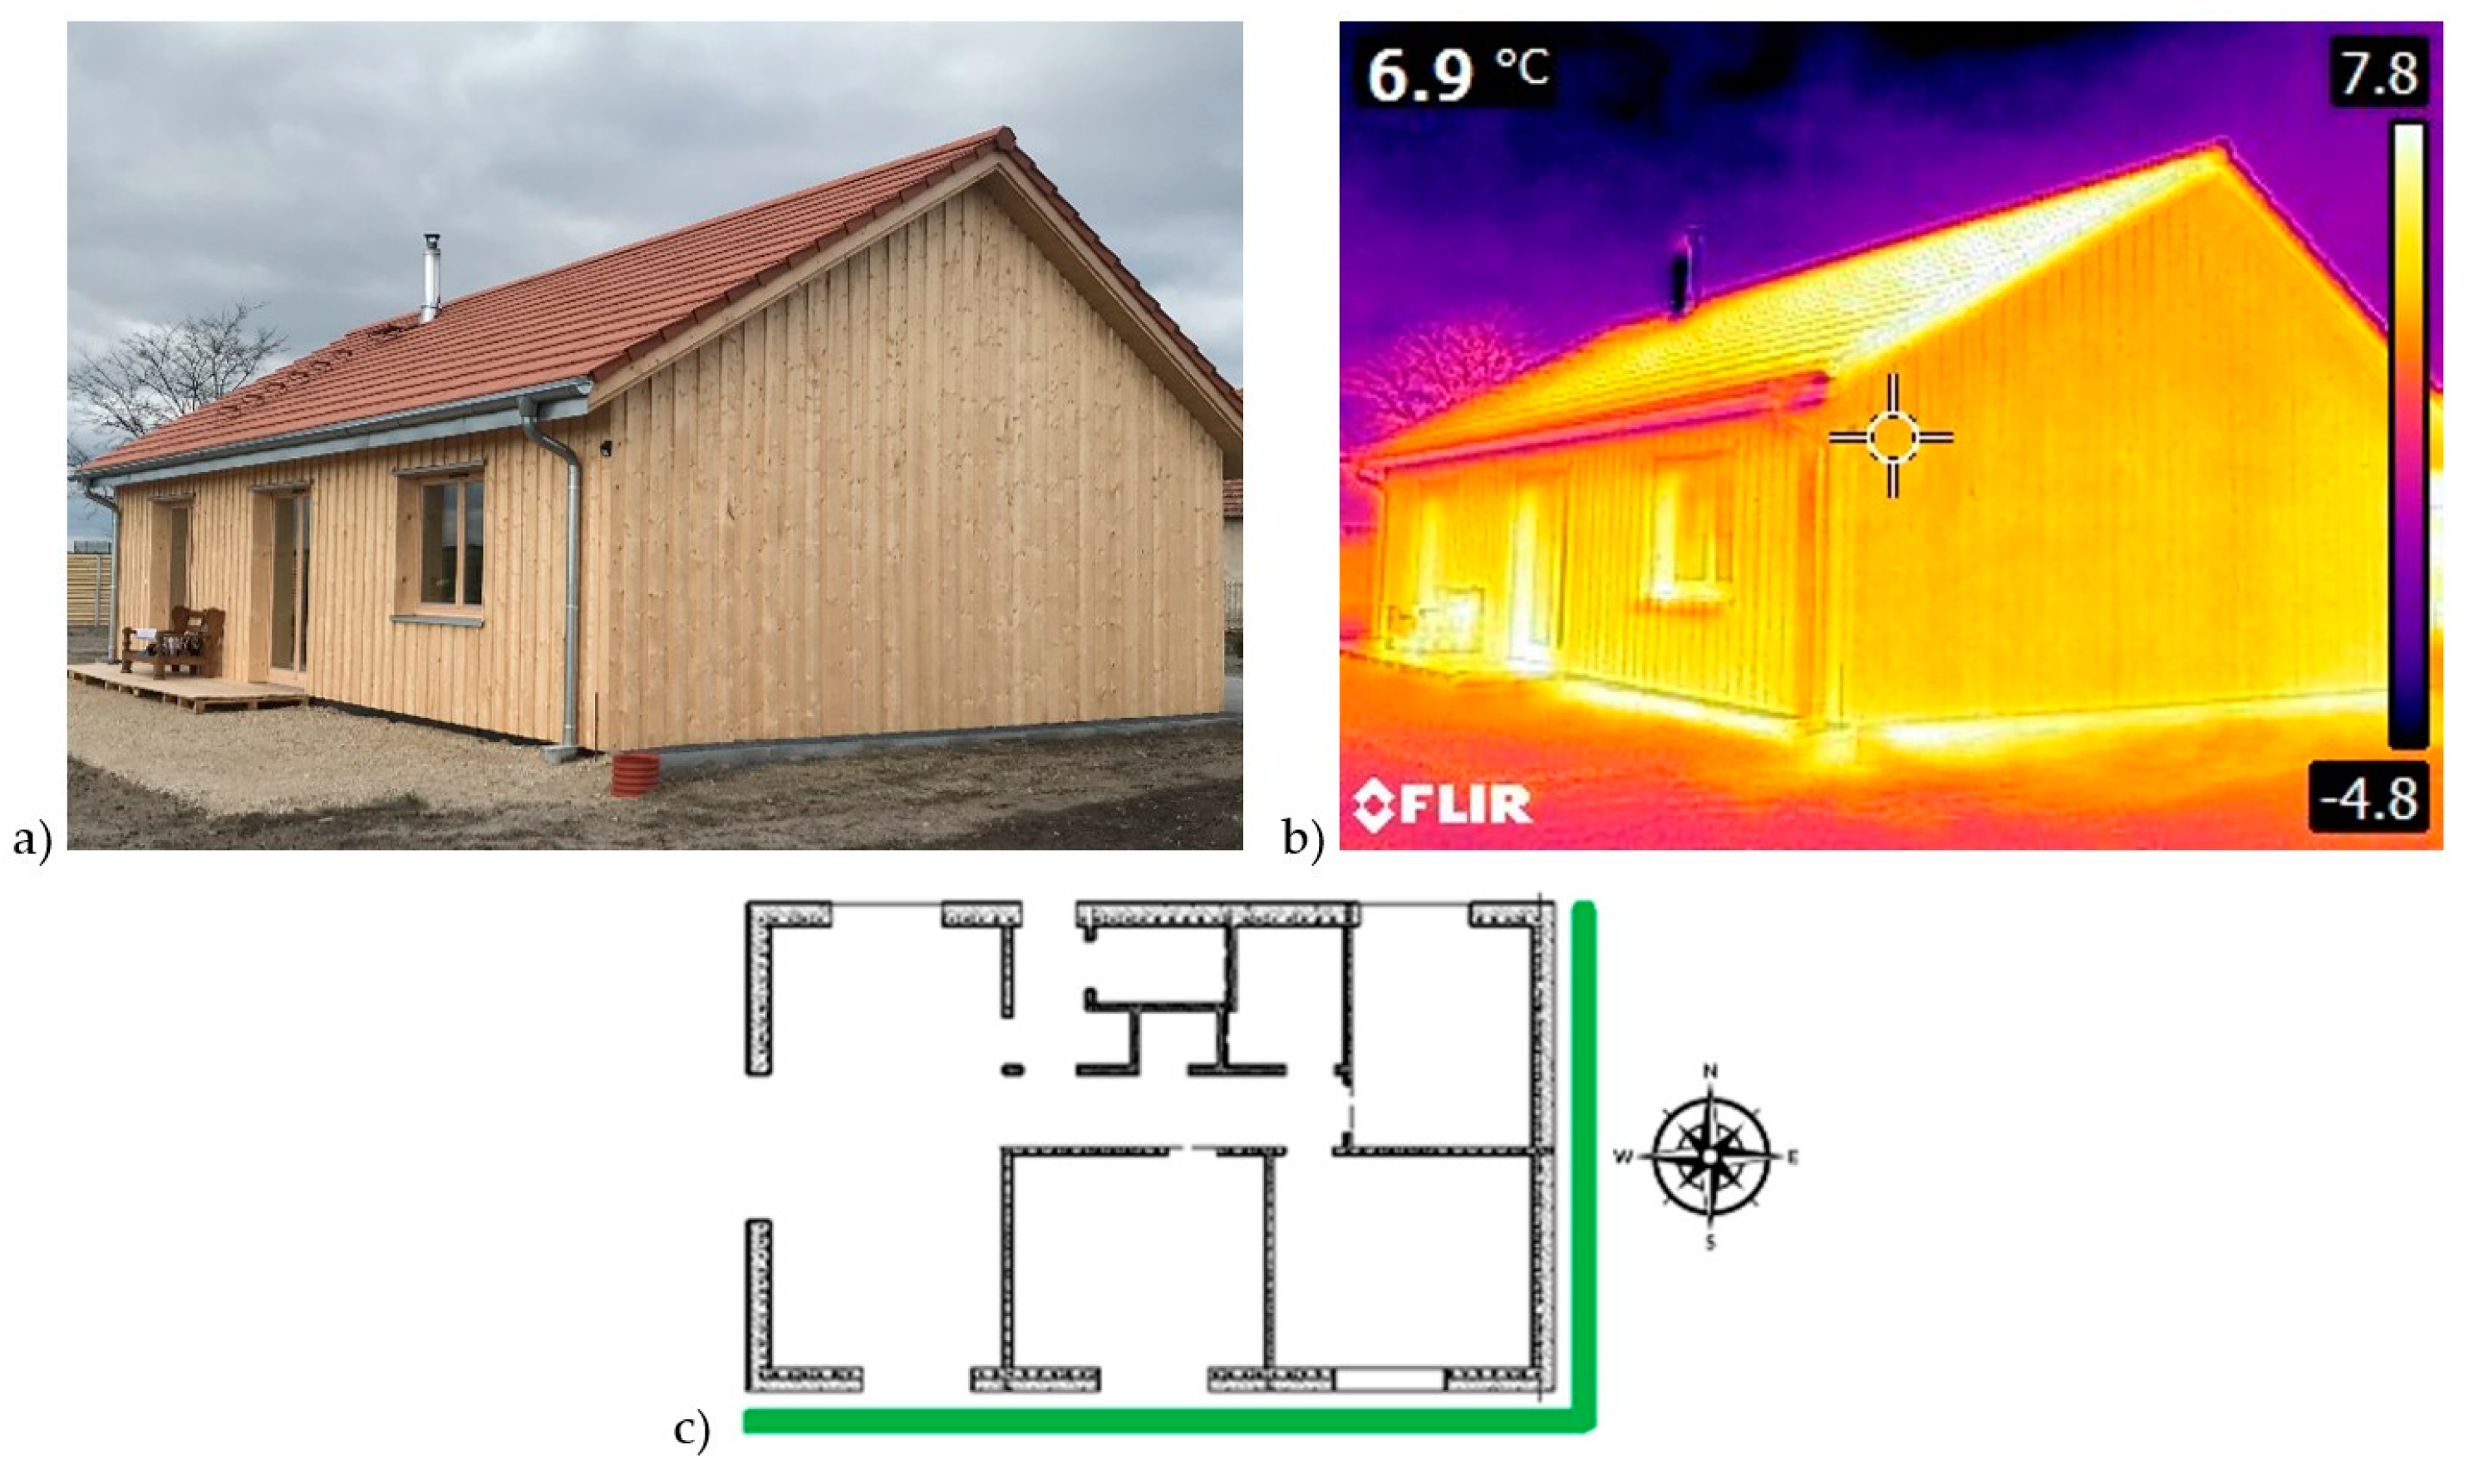
The largest leaks in the building envelope were found at the junction line between the longitudinal walls and the roof. In the case of the north wall, there are several spots of air leakage. In the case of the south wall, the thermovision image shows a continuous thermal bridge running along the entire contact line between the wall and the roof (Figure 9). No places with reduced temperature were recorded in any of the thermograms within the prefabricated DCLT panels. However, this fact is not a sufficient basis to conclude that these panels are airtight. The air permeability of DCLT panels should be laboratory tested, e.g., using an airtight chamber equipped with an airflow meter and a manometer [44].

3.3. Coefficient of Thermal Conductivity of Wood Wool

The results of thermal conductivity coefficient measurements for individual wood wool samples are summarized in Table 5. The final value of this coefficient for a given wool type was determined as the arithmetic mean of all values obtained in accordance with the standard [45].

3.4. Energy Performance Certificate

Before proceeding with the calculations for the energy performance certificate, the linear heat transfer coefficients ψe of the structural nodes of the analyzed building have been determined using the THERM software. Example temperature distributions and the values of heat transfer coefficient obtained from THERM software in the case of a two-external wall connection (convex corner) are shown in Figure 12. Values of linear heat transfer coefficients of all thermal bridges occurring in the building are summarized in Table 6. They are given twice, once in case of calculations carried out assuming the values of heat transfer coefficients of wood wool according to the manufacturer’s declaration and second after taking the values of these coefficients according to measurement results.
The calculation of the energy performance of the building took into account the demand for thermal energy for heating the building and for preparing domestic hot water. The influence of building airtightness on its heat balance is taken into account by the ventilation heat transfer coefficient Hve described by the Equation (2) [46].
H v e = ρ a c p n 50 V ,
where: ρa denotes air density [kg/m3], cp specific heat [J/(kg∙°C)], V volume of heated zone [m3].The calculations have been performed four times: first, with the value of parameter n50, recommended for energy-efficient buildings (n50 = 1) and insulation thermal conductivity values declared by the manufacturer (first case); second, with the value of parameter n50 as for energy efficient buildings and the thermal conductivity of the wood wool obtained from the experiment (second case); third, with the n50 obtained from the tightness test (n50 = 4.77) and the values of thermal conductivity coefficients of insulation declared by manufacturer (third case); fourth, with the n50 obtained from the airtightness test and the values of thermal conductivity coefficients of wood wool obtained from measurements (fourth case). The values of the obtained energy demand indices are summarized in Table 7.

4. Discussion

The value obtained for the analyzed building of the parameter n50 = 4.77 h−1 is very high. Polish legal regulations [47] recommend that the airtightness of buildings should be at a much higher level, i.e., in the case of buildings with gravitational or hybrid ventilation, n50 should be less than 3.0 h−1, while in buildings with mechanical ventilation, n50 should not exceed 1.5 h−1. In the case of passive and energy efficient buildings, recommendations concerning n50 are even stricter, and the maximum values of this parameter are 0.6 h−1 and 1.0 h−1 respectively [24]. The data presented in [48] show that, on average, statistically similar air exchange rates are exhibited by timber frame houses built on site (n50 = 4.5 h−1) or with cellulose insulation and an air barrier in the form of a sheet of paper (n50 = 4.7 h−1). Wood log homes also have low airtightness (n50 = 6.0 h−1). Buildings made of CLT, with a similar envelope construction as DCLT, typically report airtightness at a much higher level [15]. As there is no reliable research confirming the airtightness of DCLT panels, it should be stated that in the considered object, the air leakage through panels and, to a large extent, execution errors in the form of badly made connections of particular elements are responsible for high air infiltration. The authors of the paper [49] presented the results of air leakage measurements of eight joint types between the wooden wall frame structure and other building partitions. The research was conducted in the laboratory and in the field on the existing facilities. The results of measurements carried out in the field were about 10 times higher than the values determined on the basis of laboratory data. According to the authors, this discrepancy is caused mainly by the quality of the connections made on the construction site and the fact that there are additional places of air leakage in the real objects.
According to [16,22], typical air leakage places are, among others, connections of the ceiling and floor with the external wall and connections of windows and doors with the external wall. The tracer gas test results and thermograms confirm that this is also the case for the building under consideration. In the case of external wall-ceiling joints, thermograms show, characteristic of air leakage, thermal anomalies of irregular shape, with significant temperature fluctuations, forming characteristic streaks. In the case of insufficient insulation of joint elements, thermal anomalies of regular shape with uniform temperature distribution and clearly marked boundaries are usually present [43]. The comparison of temperature values in the joint in question, read from thermograms, with temperature distributions obtained using THERM software for the same ambient conditions, indicates that cooling of the joint elements is much greater than that which could occur as a result of execution errors related to the discontinuity of thermal insulation. Testing with tracer gas also indicated that air is entering the building through the gap between the jamb and the wall edge. The comparison of temperature distributions along selected lines in the pictures in question with values obtained from numerical calculations of the wall/door junction indicates the fact that thermal anomalies observed in this place are caused by the difference in thermal insulating power of the elements comprising the junction and additionally by heat transfer of leaking air. However, it should be noted here that the joints may have initially been tight and the gaps may have been created by shrinkage of the timber panels caused by changes in the moisture content of the elements [16,44]. Nevertheless, all joints should have been locally sealed carefully with an anti-wind membrane and self-adhesive tape [16,49].
The assessment of the thermal insulation properties of materials is the first step in evaluating the insulation performance of the building envelope. Recently, a number of new, environmentally friendly materials have appeared on the construction market to meet growing demands for reducing the consumption of non-renewable primary energy. However, the repeatability in terms of thermal performance of these materials has not been as well documented as in the case of traditional insulation materials and may raise some doubts [50]. Therefore, the authors of this paper decided to investigate the thermal conductivity coefficient of the wood wool used to insulate the object under consideration. In the case of soft wool with density of approximately 60 kg/m3, the thermal conductivity coefficient of the material declared by the manufacturer was 0.036 W/(m∙K), while the measured value of this coefficient was at the level of 0.0395 W/(m∙K) (Table 5), i.e., it was 9.7% higher. In the case of hard wool with a density of approximately 100 kg/m3, the declared and measured values of the coefficient were 0.038 W/(m∙K) and 0.0424 W/(m∙K) respectively, i.e., they differed by 11.6%. Since the declared values of thermal conductivity coefficient of insulating materials are determined with the use of samples of rather large size (e.g., 60 cm × 60 cm), it may be assumed that the obtained differences may be partly caused by a bigger error resulting from lateral heat losses, which is more significant in the case of small samples used for measurements [40]. However, in the literature, we can find papers indicating that there is no unambiguous relation between measurement results and the size of samples used [50], and that irrespective of the size of samples, using an appropriate test procedure, repeatable measurement results can be obtained (the scatter of measurements was ±1.3% for sample sizes ranging from 80 cm × 80 cm to 60 cm × 60 cm) [51]. In the presented case, the fact that only one surface of the specimen was the original manufacturer’s surface may also be relevant, while the other surface was characterized by greater unevenness. This usually results in an uneven distribution of contact resistances between the apparatus plate and the sample surface in question and a slight overestimation of the measurement results. This phenomenon may have played a role in the case of samples made of hard wool in which it was very difficult to obtain an even surface and for which we observe a certain scatter between the values of heat conductivity coefficient determined using individual samples (the maximum deviation from the average value was 3.07% in this case and 0.51% in the case of results obtained on the basis of soft wool tests). It is also worth mentioning here the results of measurements of wood wool samples from the Polish market, reported in [52]. The average value of thermal conductivity coefficient for the wool of density approximately 60 kg/m3 was 0.0391 W/(m∙K), while for the wool of density approximately 100 kg/m3–0.0381 W/(m∙K). The first of these values coincides with the value obtained in this work, while the second coincides with the value declared by the manufacturer. On the basis of the results presented in the article [52] and the present work, it may be concluded that the thermal parameters of the analyzed wood wool may change by up to 11% depending on the batch delivered.
The values of linear heat transfer coefficients of structural nodes, calculated with THERM software and listed in Table 6, indicate that all structural details have been well designed and, when done properly, will not result in the formation of thermal bridges or increase of heat loss by penetration in the analyzed building.
From the data summarized in Table 7 concerning the energy performance indicators of the analyzed building at different values of the parameter n50 and heat transfer coefficients of wood wool, it can be seen that the object in consideration in all cases meets the requirements for the indicator of demand for non-renewable primary energy, which had to be met by single-family houses erected in 2019 (EP ≤ 95 kWh/(m2∙year) [53]). At the same time, the building under consideration corresponds to the standard of an energy-efficient building, which in Polish conditions is determined by the indicator of heat demand for heating and ventilation EUH. This indicator, according to the guidelines of the National Fund for Environmental Protection and Water Management for energy efficient buildings, should not be higher than 40 kWh/(m2∙year) [54]. From the data presented in Table 7, it also can be seen that an approximately 10% increase in the thermal conductivity coefficient of wood wool, which insulates the walls and ceilings of the building, results in only a ~2% increase in heating demand and the value of indicator EUH is only 2.11%. Such a small impact of changes in the insulation of wood wool on the demand for heat for heating is due to the fact that the building has gravity ventilation and heat loss for heating of ventilation air is a significant part of total heat loss from the building (~48% in cases with parameter n50 = 4.77 h−1 and ~40% in cases with parameter n50 = 1.0 h−1). The EUH ratio and the heating demand, on the other hand, are much more influenced by the building air infiltration intensity, described by the parameter n50. When the value of this parameter is changed from 1.0 h−1 to 4.77 h−1, there is an increase in heat demand and EUH ratio by as much as 40.1%. The results obtained confirm the conclusions of other researchers [15,17,18,22,26] on the significant influence of the tightness of the building on its energy consumption. Finally, it is worth noting that, despite the defects detected in the building, its users are satisfied with the building. They do not feel any thermal discomfort caused by uncontrolled air streams and they praise the specific microclimate inside the building.

5. Conclusions

This paper presents the results of an airtightness test and thermal imaging study of a single-family building with gravity ventilation, constructed with the unusual technology, using panels of dowelled cross-laminated timber (DCLT). Due to the materials used, this building can be considered an ecological object. The building junctions where the largest thermal anomalies were detected in the thermograms (exterior wall/ceiling and exterior wall/window junction) were modeled in THERM software to determine the temperature distributions corresponding to the conditions of the thermovision measurements. The created models took into account the possibility of thermal insulation discontinuities in the joint. The resulting distributions were compared with the temperature values from the thermogram to determine the causes of the thermal anomaly present. Measurements were also taken of the thermal conductivity coefficient of two types of wood wool as insulation of the walls and ceilings of the analyzed object. Then, using the THERM software, the linear heat transfer coefficients of the building structural nodes were determined numerically. The values of these coefficients were entered into the software ArCADia-TERMOCAD version PRO 7.4, used for calculations of energy efficiency of buildings. Energy performance calculations were carried out four times, for each possible combination of parameters: n50 = 4.77 h−1 (leakage test result), n50 = 1.0 h−1 (recommended value for energy-efficient buildings), λ of wood wool according to manufacturer’s declaration, λ of wood wool based on measurements. The following was found:
  • The air exchange rate, determined from the airtightness test) in the building at a pressure difference of 50 Pa is n50 = 4.77 h−1 and is significantly higher than the value of this parameter recommended for energy-efficient buildings (n50 = 1.0 h−1).
  • Tests using tracer gas and a thermal imaging camera revealed air leaks at the junction of the building elements. The largest leaks in the building envelope were found at the junction of the longitudinal walls with the roof and at the junction of the external walls with the window frames.
  • The irregular shape of the low temperature area at the junction of the external wall and the ceiling confirms the presence of air leakage at the junction of the joint elements. In some points the temperature drops even to 13.6 °C (with the measurement temperature of 20.1 °C). The comparison of temperatures read from thermograms in the place of occurrence of thermal anomalies with temperature distributions calculated numerically proves that possible discontinuities of thermal layer could not lead to such significant temperature drops; convective heat transfer takes place at the junction of elements.
  • No air leakage within the prefabricated DCLT panels was recorded on any thermograms, but laboratory testing would be required to conclusively determine their airtightness.
  • The thermal conductivity coefficients of the wood wool used to insulate the building, determined using a plate heat flux meter HFM 446 Lambda Small, are 9.7% and 11.6% higher than the values declared by the manufacturer for soft wool (~60 kg/m3) and hard wool (~110 kg/m3) respectively. Hence, the conclusion is that the thermal parameters of the analyzed wood wool may change by up to 11% depending on the batch delivered.
  • Increasing by ~10% the thermal conductivity coefficient of wood wool, which is insulating the walls and ceiling of the building, results in only 2.1% increase in heat demand for heating and the value of index EUH.
  • When changing the value of n50 parameter from 1.0 h−1 to 4.77 h−1, we observe an increase of the heating demand and EUH value by 40.1%. At the same time, the indicators of final energy demand EK and non-renewable primary energy EP increase by 18.1%. These results confirm the fact that the airtightness of the building is very important for its energy intensity.
  • The study shows that numerous air leaks occurring mainly in the line of connections between the exterior walls and the ceiling are primarily responsible for the building’s poor air-tightness. In order to improve the energy performance certificate of the analyzed building, the connections of the exterior walls with the ceiling should be sealed with anti-wind film and adhesive tape, and additionally the exterior walls with windows using, for example, strips of windproof material and pressure strips. This will reduce the heat demand for heating by up to 40%.

Author Contributions

Conceptualization, J.Ś.-P. and S.P.; methodology, J.Ś.-P. and S.P.; software, A.W.; validation, S.P. and J.Ś.-P.; formal analysis, J.Ś.-P.; investigation, S.A., A.W., and M.B.; resources, J.Ś.-P. and S.P.; data curation, J.Ś.-P., S.P., and S.A.; writing—original draft preparation, J.Ś.-P. and S.P.; writing—review and editing, S.A. and S.P.; visualization, S.A.; supervision, S.A. and M.B.; project administration, S.P. and J.Ś.-P.; funding acquisition, J.Ś-P. All authors have read and agreed to the published version of the manuscript.

Funding

This research was funded by OPOLE UNIVERSITY OF TECHNOLOGY, grant DELTA number 069/21.

Data Availability Statement

Not applicable.

Conflicts of Interest

The authors declare no conflict of interest.

References

  1. Pereira, M.C.d.M.; Pascal Sohier, L.A.; Descamps, T.; Junior, C.C. Doweled cross laminated timber: Experimental and analytical study. Constr. Build. Mater. 2021, 273, 121820. [Google Scholar] [CrossRef]
  2. Santi, S.; Pierobon, F.; Corradini, G.; Cavalli, R.; Zanetti, M. Massive wood material for sustainable building design: The Massiv–Holz–Mauer wall system. J. Wood Sci. 2016, 62, 416–428. [Google Scholar] [CrossRef] [Green Version]
  3. Kolb, J. Systems in Timber Engineering. In Systems in Timber Engineering; Birkhäuser: Berlin, Germany; Boston, MA, USA, 2008; Volume 319. [Google Scholar]
  4. Bucklin, O.; Menges, A.; Amtsberg, F.; Drexler, H.; Rohr, A.; Krieg, O.D. Mono-material wood wall: Novel building envelope using subtractive manufacturing of timber profiles to improve thermal performance and airtightness of solid wood construction. Energy Build. 2022, 254, 111597. [Google Scholar] [CrossRef]
  5. Hill, C.A.S.; Dibdiakova, J. The environmental impact of wood compared to other building materials. Int. Wood Prod. J. 2016, 7, 215–219. [Google Scholar] [CrossRef]
  6. Tsai, M.T.; Lin, W.T. Efficiency of Energy Consumption between Reinforced Concrete Structure and Cross-Laminated Timber Based Hybrid Structure in East Asian Cities. Energies 2021, 15, 165. [Google Scholar] [CrossRef]
  7. Pochwała, S.; Makiola, D.; Anweiler, S.; Böhm, M. The Heat Conductivity Properties of Hemp–Lime Composite Material Used in Single-Family Buildings. Materials 2020, 13, 1011. [Google Scholar] [CrossRef] [Green Version]
  8. Gasparri, E.; Aitchison, M. Unitised timber envelopes. A novel approach to the design of prefabricated mass timber envelopes for multi-storey buildings. J. Build. Eng. 2019, 26, 100898. [Google Scholar] [CrossRef]
  9. Buck, D.; Wang, X.A.; Hagman, O.; Gustafsson, A. Comparison of Different Assembling Techniques Regarding Cost, Durability, and Ecology—A Survey of Multi-layer Wooden Panel Assembly Load-Bearing Construction Elements. BioResources 2015, 10, 8378–8396. [Google Scholar] [CrossRef] [Green Version]
  10. Asdrubali, F.; Ferracuti, B.; Lombardi, L.; Guattari, C.; Evangelisti, L.; Grazieschi, G. A review of structural, thermo-physical, acoustical, and environmental properties of wooden materials for building applications. Build. Environ. 2017, 114, 307–332. [Google Scholar] [CrossRef]
  11. Frihart, C.R.; Hunt, C.G. Adhesives with Wood Materials: Bond Formation and Performance. In Wood Handbook: Wood as An Engineering Material; United States Department of Agriculture, Forest Service, Forest Products Laboratory: Madison, WI, USA, 2010. [Google Scholar]
  12. IARC Classifies Formaldehyde as Carcinogenic. Oncol. Times 2004, 26, 72. [CrossRef]
  13. Thoma, E. Vollholz Häuser: Das Baum-Prinzip für Naturnahes Wohnen; Brandstätter: Zirndorf, Germany, 2008; p. 175. [Google Scholar]
  14. Janowska-Renkas, E.; Król, A.; Pochwała, S.; Pałubski, D.; Adamska, M.; Klementowski, I. The Fire Resistance and Heat Conductivity of Natural Construction Material Based on Straw and Numerical Simulation of Building Energy Demand. Energies 2022, 15, 1155. [Google Scholar] [CrossRef]
  15. Cho, H.M.; Park, J.H.; Wi, S.; Chang, S.J.; Yun, G.Y.; Kim, S. Energy retrofit analysis of cross-laminated timber residential buildings in Seoul, Korea: Insights from a case study of packages. Energy Build. 2019, 202, 109329. [Google Scholar] [CrossRef]
  16. Skogstad, H.B.; Gullbrekken, L.; Nore, K. Air leakages through cross laminated timber (CLT) constructions. In Proceedings of the NSB 2011 9th Nordic Symposium on Building Physics, Tampere, Finland, 29 May–2 June 2011. [Google Scholar]
  17. Dodoo, A.; Gustavsson, L.; Sathre, R. Lifecycle primary energy analysis of low-energy timber building systems for multi-storey residential buildings. Energy Build. 2014, 81, 84–97. [Google Scholar] [CrossRef]
  18. Setter, L.; Smoorenburg, E.; Wijesuriya, S.; Tabares-Velasco, P.C. Energy and hygrothermal performance of cross laminated timber single-family homes subjected to constant and variable electric rates. J. Build. Eng. 2019, 25, 100784. [Google Scholar] [CrossRef]
  19. Prignon, M.; Van Moeseke, G. Factors influencing airtightness and airtightness predictive models: A literature review. Energy Build. 2017, 146, 87–97. [Google Scholar] [CrossRef]
  20. Šadauskiene, J.; Šeduikyte, L.; Paukštys, V.; Banionis, K.; Gailius, A. The role of air tightness in assessment of building energy performance: Case study of Lithuania. Energy Sustain. Dev. 2016, 32, 31–39. [Google Scholar] [CrossRef]
  21. Relander, T.O.; Holøs, S.; Thue, J.V. Airtightness estimation—A state of the art review and an en route upper limit evaluation principle to increase the chances that wood-frame houses with a vapour- and wind-barrier comply with the airtightness requirements. Energy Build. 2012, 54, 444–452. [Google Scholar] [CrossRef]
  22. Kalamees, T. Air tightness and air leakages of new lightweight single-family detached houses in Estonia. Build. Environ. 2007, 42, 2369–2377. [Google Scholar] [CrossRef]
  23. Meiss, A.; Feijó-Muñoz, J. The energy impact of infiltration: A study on buildings located in north central Spain. Energy Effic. 2015, 8, 51–64. [Google Scholar] [CrossRef]
  24. Guillén-Lambea, S.; Rodríguez-Soria, B.; Marín, J.M. Air infiltrations and energy demand for residential low energy buildings in warm climates. Renew. Sustain. Energy Rev. 2019, 116, 109469. [Google Scholar] [CrossRef]
  25. Martin, U.; Blanchet, P.; Potvin, A. Modeling the impact of assembly tolerances regarding air leaks on the energy efficiency and durability of a cross-laminated timber structure. BioResources 2019, 14, 518–536. [Google Scholar] [CrossRef]
  26. Jokisalo, J.; Kurnitski, J.; Korpi, M.; Kalamees, T.; Vinha, J. Building leakage, infiltration, and energy performance analyses for Finnish detached houses. Build. Environ. 2009, 44, 377–387. [Google Scholar] [CrossRef]
  27. Kim, S.; Chang, Y.S.; Park, J.S.; Shim, K.B. Analysis of Airtightness and Air Leakage of Wooden Houses in Korea. J. Korean Wood Sci. Technol. 2017, 45, 828–835. [Google Scholar] [CrossRef]
  28. Download—Holz100 Canada Inc. Available online: https://www.holz100canada.com/downloads.html (accessed on 11 April 2022).
  29. UNE EN 12207:2017; Windows and Doors—Air permeability—Classification—European Standards. Available online: https://www.en-standard.eu/une-en-12207-2017-windows-and-doors-air-permeability-classification/ (accessed on 11 April 2022).
  30. Panel Types, Surfaces & Technical Details—KLH UK Limited. Available online: https://www.klhuk.com/panel-types-surfaces-technical-details/#technical-details (accessed on 11 April 2022).
  31. Kukk, V.; Kalamees, T.; Kers, J. The effects of production technologies on the air permeability and crack development of cross-laminated timber. J. Build. Phys. 2019, 43, 171–186. [Google Scholar] [CrossRef]
  32. Gesund Und Nachhaltig Wohnen im Thoma Holzhaus. Available online: https://www.thoma.at/ (accessed on 11 April 2022).
  33. HFM 446 Lambda Eco-Line—Heat Flow Meter (HFM)/Guarded Hot Plate/Pipe (GHP)/HotBox Test Chambers (TDW)—Products—NETZSCH Analyzing & Testing. Available online: https://analyzing-testing.netzsch.com/en/products/thermal-conductivity/hfm-446-lambda-eco-line (accessed on 11 April 2022).
  34. Discover ArCADia BIM Professional CAD Software that Lets You Create, Edit, View and Markup Any Kind of 2D and 3D DWG File with Greater Ease, Speed, and Efficiency. Available online: https://arcadiabimsystem.com/ (accessed on 11 April 2022).
  35. THERM Documentation | Windows and Daylighting. Available online: https://windows.lbl.gov/therm-documentation (accessed on 11 April 2022).
  36. ISO 9972:2015; Thermal Performance of Buildings—Determination of Air Permeability of Buildings—Fan Pressurization Method. Available online: https://www.iso.org/standard/55718.html (accessed on 11 April 2022).
  37. PN EN 13187:2001; Thermal Performance of Buildings—Qualitative Detection of Thermal Irregularities in Building Envelopes—Infrared Method. Available online: https://infostore.saiglobal.com/en-gb/Standards/PN-EN-13187-2001-928930_SAIG_PKN_PKN_2190857/ (accessed on 11 April 2022).
  38. FLIR E6-XT; Infrared Camera with Extended Temperature Range | Teledyne FLIR. Available online: https://www.flir.eu/products/e6-xt/ (accessed on 11 April 2022).
  39. UNE EN 12664:2002; Thermal Performance of Building Materials and Products. Determination of Thermal Resistance by Means of Guarded Hot Plate and Heat Flow Meter Methods. Dry and Moist Products of Medium and Low Thermal Resistance—European Standards. Available online: https://www.en-standard.eu/une-en-12664-2002-thermal-performance-of-building-materials-and-products-determination-of-thermal-resistance-by-means-of-guarded-hot-plate-and-heat-flow-meter-methods-dry-and-moist-products-of-medium-and-low-thermal-resistance/ (accessed on 11 April 2022).
  40. UNE EN 12667:2002; Thermal Performance of Building Materials and Products. Determination of Thermal Resistance by Means of Guarded Hot Plate and Heat Flow Meter Methods. Products of High and Medium Thermal Resistance—European Standards. Available online: https://www.en-standard.eu/une-en-12667-2002-thermal-performance-of-building-materials-and-products-determination-of-thermal-resistance-by-means-of-guarded-hot-plate-and-heat-flow-meter-methods-products-of-high-and-medium-thermal-resistance/ (accessed on 11 April 2022).
  41. Jang, S.S.; Ha, B. Airtightness of Light-Frame Wood Houses built in Daejeon and Chungnam Area. J. Korean Wood Sci. Technol. 2017, 45, 147–158. [Google Scholar] [CrossRef] [Green Version]
  42. Chan, W.R.; Nazaroff, W.W.; Price, P.N.; Sohn, M.D.; Gadgil, A.J. Analyzing a database of residential air leakage in the United States. Atmos. Environ. 2005, 39, 3445–3455. [Google Scholar] [CrossRef] [Green Version]
  43. Taylor, T.; Counsell, J.; Gill, S. Energy efficiency is more than skin deep: Improving construction quality control in new-build housing using thermography. Energy Build. 2013, 66, 222–231. [Google Scholar] [CrossRef]
  44. Kukk, V.; Bella, A.; Kers, J.; Kalamees, T. Airtightness of cross-laminated timber envelopes: Influence of moisture content, indoor humidity, orientation, and assembly. J. Build. Eng. 2021, 44, 102610. [Google Scholar] [CrossRef]
  45. ISO 10456:2007/Cor 1:2009; Building Materials and Products—Hygrothermal Properties—Tabulated Design Values and Procedures for Determining Declared and Design Thermal Values—Technical Corrigendum 1. Available online: https://www.iso.org/standard/55597.html (accessed on 11 April 2022).
  46. EN 12831-1:2017; Energy Performance of Buildings—Method for Calculation of the Design Heat Load. Available online: https://standards.iteh.ai/catalog/standards/cen/4c907284-01a1-4023-afef-c55a6c9ebc21/en-12831-1-2017 (accessed on 11 April 2022).
  47. Buildings and Their Location—Polish Technical Conditions 2018—Part III Buildings and Rooms. Available online: https://depot.ceon.pl/handle/123456789/17633 (accessed on 11 April 2022).
  48. Vinha, J.; Manelius, E.; Korpi, M.; Salminen, K.; Kurnitski, J.; Kiviste, M.; Laukkarinen, A. Airtightness of residential buildings in Finland. Build. Environ. 2015, 93, 128–140. [Google Scholar] [CrossRef] [Green Version]
  49. Kalamees, T.; Alev, Ü.; Pärnalaas, M. Air leakage levels in timber frame building envelope joints. Build. Environ. 2017, 116, 121–129. [Google Scholar] [CrossRef]
  50. Baldinelli, G.; Bianchi, F.; Gendelis, S.; Jakovics, A.; Morini, G.L.; Falcioni, S.; Fantucci, S.; Serra, V.; Navacerrada, M.A.; Díaz, C.; et al. Thermal conductivity measurement of insulating innovative building materials by hot plate and heat flow meter devices: A Round Robin Test. Int. J. Therm. Sci. 2019, 139, 25–35. [Google Scholar] [CrossRef]
  51. Rasmussen, E.; Stacey, C.; Koenen, A.; Kurkinen, E.-L.W. Comparative Testing of Thermal Conductivity for Thermal Insulation Products: The European Keymark Experience for More Than 50 Equipment at 25 Test Institutes. In Proceedings of the 32nd International Thermal Conductivity Conference, West Lafayette, IN, USA, 27 April–1 May 2014. [Google Scholar]
  52. Miros, A.; Bajorek, A.; Kubacki, J.M.; Kubacki, J.; Chełkowski, A. Examination of the Thermal Conductivity of the Wood Wool Products for Thermal Insulation of Moisture Sorption. In Proceedings of the International Conference on Heat Transfer and Fluid Flow, Prague, Czech Republic, 11–12 August 2014; p. 188. [Google Scholar]
  53. Announcement of the Minister of Investment and Development of 8 April 2019 on the Announcement of the Consolidated Text of the Regulation of the Minister of Infrastructure on Technical Conditions to Which Buildings and Their Location Should Conform; National Development and Reform Commission: Beijing, China, 2019.
  54. Current Implementation Effects/Subsidies for Energy Efficient Houses/Programmes 2015-2020/National Measures/Financing Offer; Ministry of Finance of the People’s Republic of China: Beijing, China, 2015.
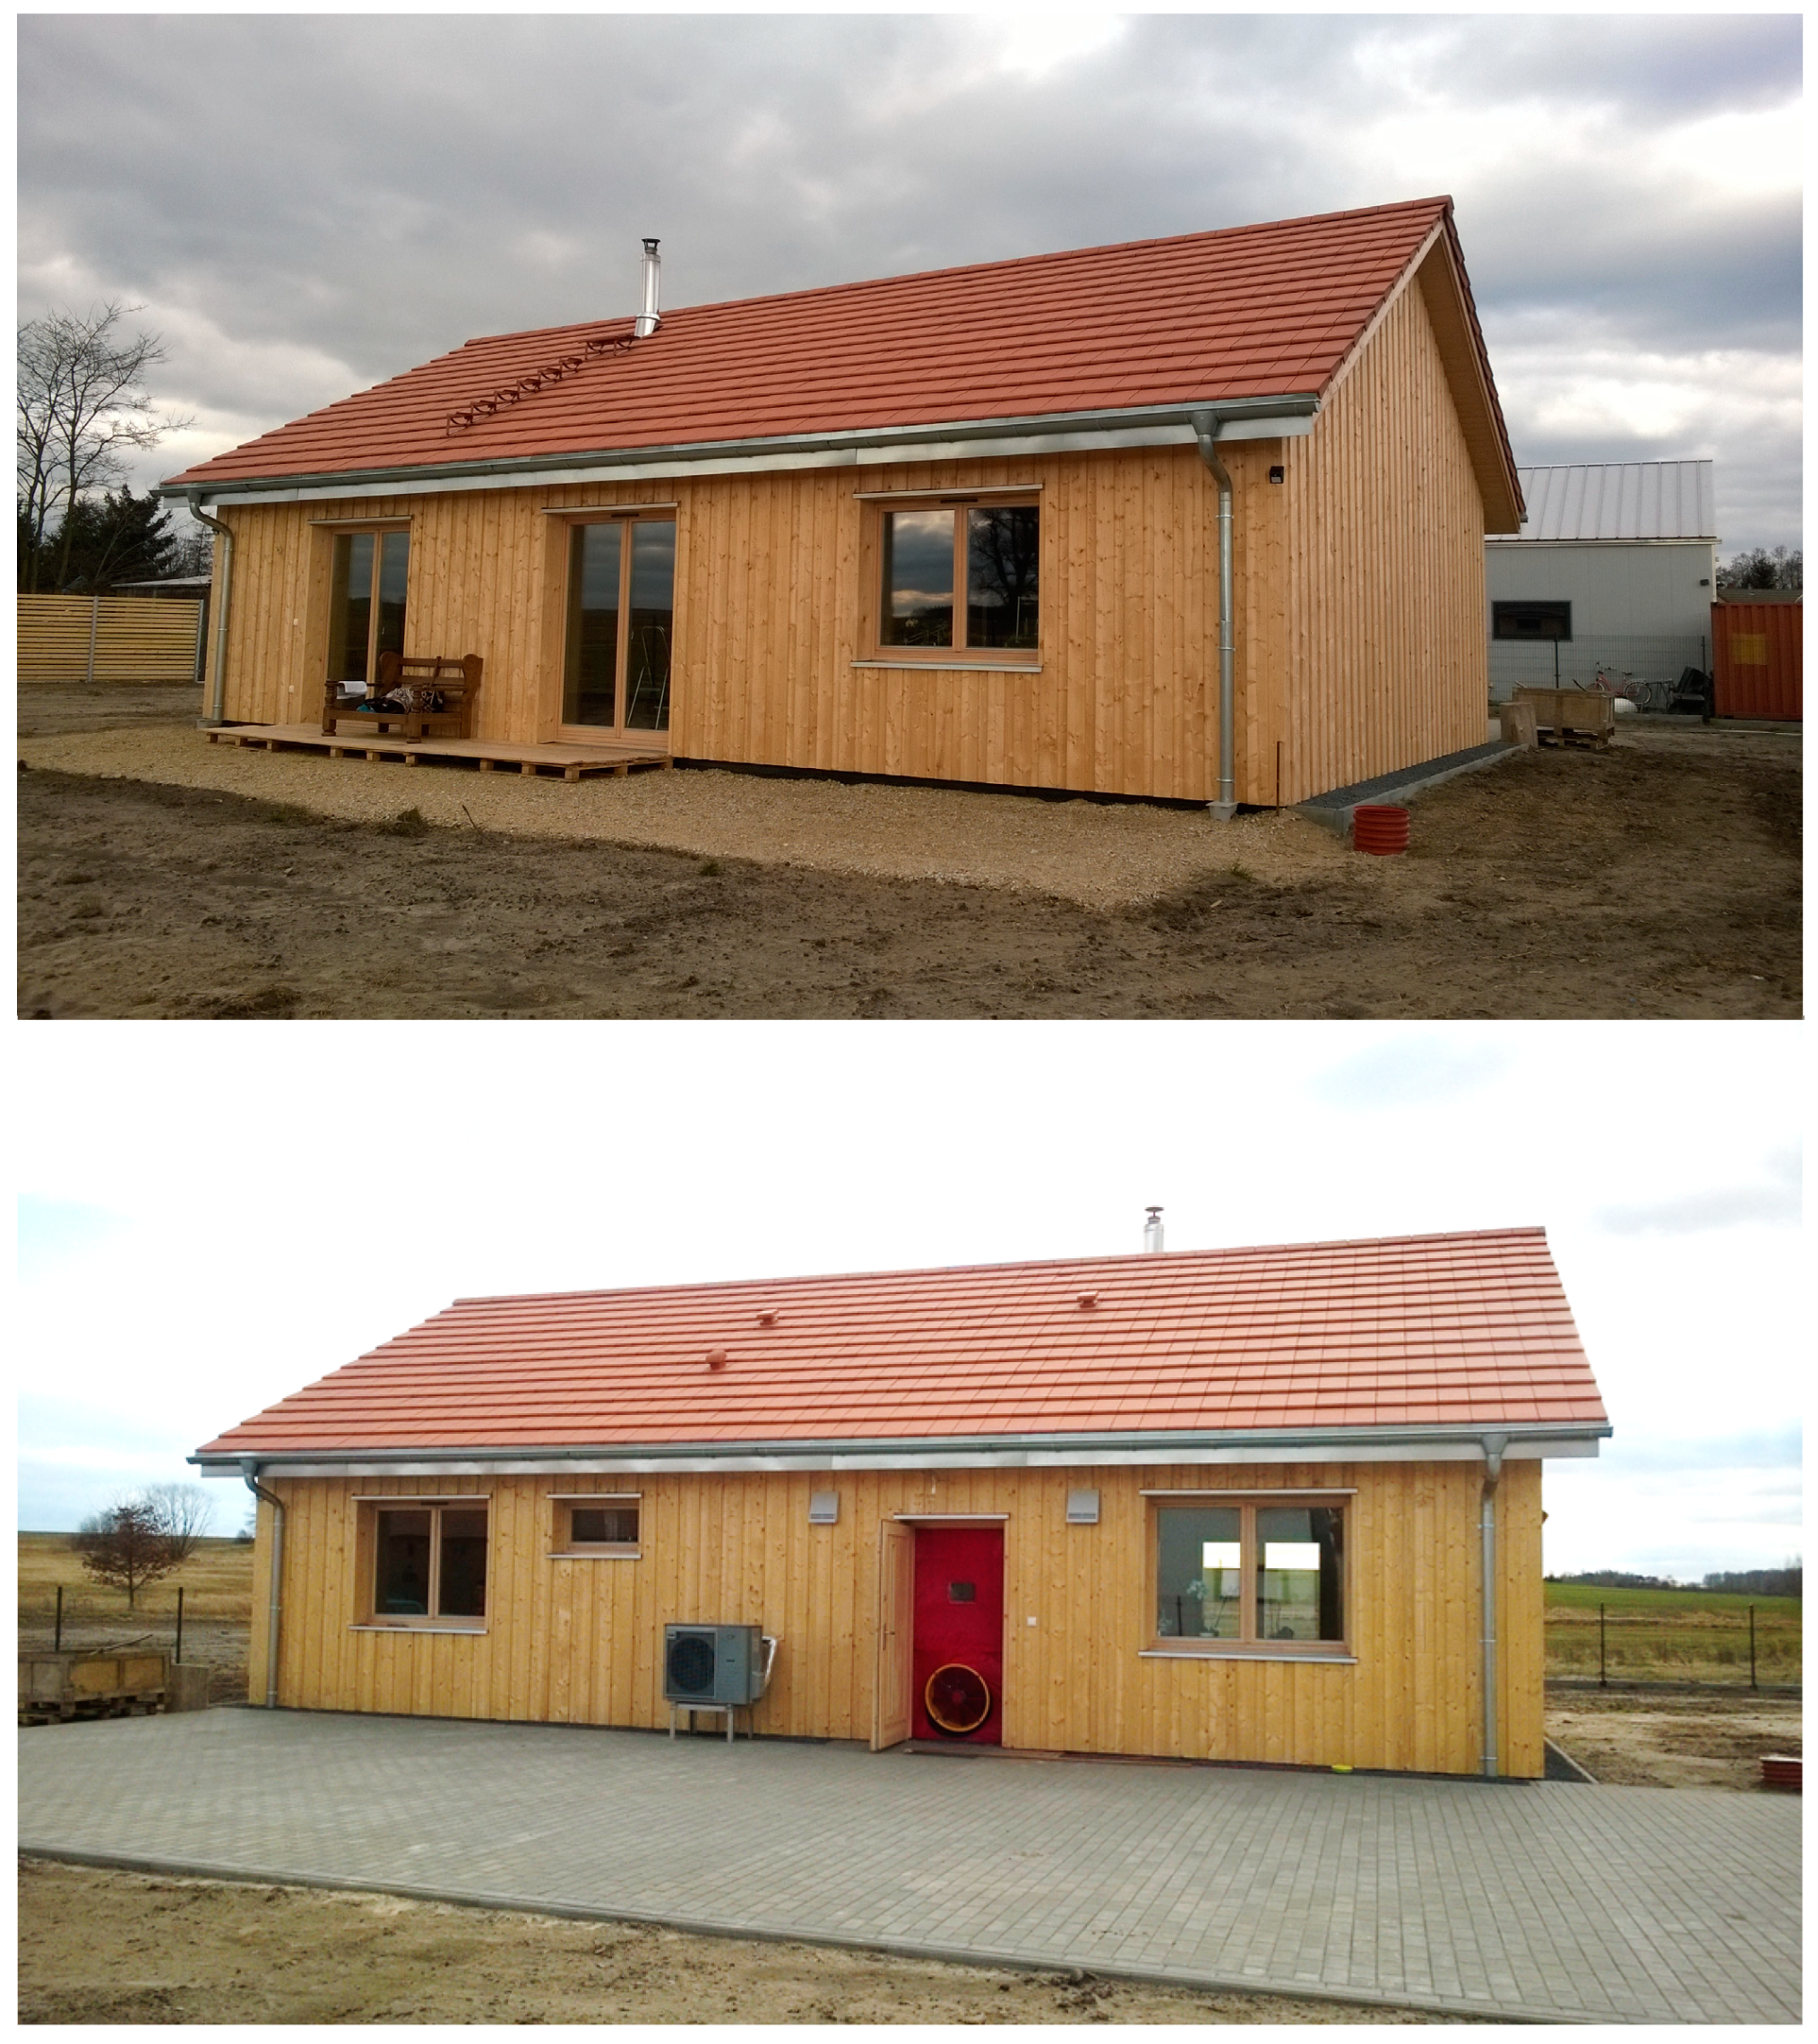
Figure 1. View of the surveyed building. Top—south elevation, bottom—north elevation with blower door fan and heat pump attached.
Energies 15 09029 g001
Figure 2. A fragment of the external wall of the analysed building.
Energies 15 09029 g002
Figure 3. HFM 446 Lambda apparatus for measuring the coefficient of thermal conductivity.
Energies 15 09029 g003
Figure 4. Wood wool samples.
Energies 15 09029 g004
Figure 5. Dependency diagram of the generated negative pressure as a function of the air flow through the leaks.
Energies 15 09029 g005
Figure 6. Imaging results: partial internal view of the north and west exterior wall (top left), relevant thermogram (middle), plan of the building with the analyzed part of the wall marked in green (top right), temperature profiles along marked lines (bottom).
Energies 15 09029 g006
Figure 7. Imaging results: (a) partial internal view of the south and west exterior wall, (b) relevant thermogram, (c) plan of the building with the analyzed part of the wall marked in green, (d) temperature profiles along marked lines.
Energies 15 09029 g007
Figure 8. Imaging results: (top) partial internal view of the south and east exterior wall and plan of the building with the analyzed part of the wall marked in green, (middle) relevant thermogram, (bottom) temperature profiles along marked lines.
Energies 15 09029 g008
Figure 9. Imaging results: (a) partial external view of the south and east exterior wall, (b) relevant thermogram, (c) plan of the building with the analyzed part of the wall marked in green.
Energies 15 09029 g009
Figure 10. Temperature distributions at the junction of the exterior wall and the ceiling in two cases of discontinuity of the insulation layers of the joint elements: (a) the first case—the ceiling insulation ends at the junction of the supporting layer and the wall insulation, (b) the second case—the ceiling insulation ends at the inner surface of the supporting layer of the wall.
Energies 15 09029 g010
Figure 11. Temperature distribution at the junction between the external wall and the window.
Energies 15 09029 g011
Figure 12. Temperature distribution and the value of the heat transfer coefficient in the case of convex corner between external walls.
Energies 15 09029 g012
Table 1. Layers of external wall of the analyzed building.
NoMaterialHeat Conduction Coefficient (W/m∙K)Thermal Resistance (m2∙K/W)Thickness (cm)
1Solid wood0.1201.4217
2Wood wool0.0383.7814
3Airlock-0.183
4Façade planks0.1300.1542
Heat transfer coefficient [W/(m2∙K)]0.178
Table 2. Ceiling layers of the analyzed building.
NoMaterialHeat Conduction Coefficient (W/m∙K)Thermal Resistance (m2∙K/W)Thickness (cm)
1Wood wool0.0363.8914
2Wood wool/Beam0.036/0.134.44/1.2316
3Airlock-0.164
4Clay board0.80.0252
Heat transfer coefficient [W/(m2∙K)]0.125
Table 3. Floor layers of the analyzed building.
NoMaterialHeat Conduction Coefficient (W/m∙K)Thermal Resistance (m2∙K/W)Thickness (cm)
1Cement screed1.00.077
2Styrofoam0.0362.7810
3Concrete slab1.70,1220
4Styrofoam0.0355.7120
5Lean concrete1.150.0910
Heat transfer coefficient [W/(m2∙K)]0.098
Table 4. Results of pressure leakage test of the examined building.
No.ParameterResults95% Confidence IntervalUncertainty
1Air flow at 50 Pa, V50 [l/s]344.17334.40354.20+/−2.9%
2Air changes at 50 Pa, n50 [/h]4.7734.5674.898+/−3.5%
3Permeability at 50 Pa, q50 [l/s/m2]1.2121.1701.255+/−3.5%
4Specific leakage at 50 Pa, w50 [l/s/m2]3.68093.55223.8096+/−5.5%
5Effective leakage area at 50 Pa, EfLA50 [cm2]377.7367.0388.6+/−2.9%
6Equivalent leakage area at 50 Pa, AL [cm2]619.1601.6637.1+/−2.9%
7Normalized leakage area at 50 Pa, NLA50 [cm2/m2]1.33021.2841.377+/−3.5%
Table 5. Heat transfer coefficients values of wood wool samples.
MaterialThe λ Coefficient
of Sample
[W/(m·K)]
The λ Coefficient
of Material
[W/(m·K)]
Soft wool
~60 kg/m3
0.03950.0395
0.0393
0.0395
Hard wool
~110 kg/m3
0.04260.0424
0.0435
0.0411
Table 6. Values of linear heat transfer coefficients of thermal bridges.
Bridge Type The   ψ e Coefficient
(the λ Value of Wood Wool according to the Manufacturer’s Declaration)
[W/(m·K)]
The   ψ e Coefficient
(the λ Value of Wood Wool Obtained from the Measurements)
[W/(m·K)]
Convex corner−0.0286−0.0323
External wall/internal wall0.0−0.0011
External wall/window−0.0311−0.0334
External wall/floor on the ground−0.4193−0.4516
External wall/ceiling−0.0669−0.0725
Door/floor on the ground−0.4489−0.4489
External wall/door−0.0365−0.0394
Table 7. Energy consumption of the studied building in four analyzed cases.
Energy Characteristics IndicatorsFirst CaseSecond CaseThird CaseFourth Case
Heat demand for heating and ventilation kWh/year2578.84
(100%)
2633.33
(102.1%)
3612.28
(140.1%)
3671.00
(142.4%)
Usable energy demand for heating E U H kWh/(m2 × year)27.58
(100%)
28.16
(102.1%)
38.63
(140.1%)
39.26
(142.4%)
Annual usable energy demand
E U H + W kWh/(m2 × year)
54.51
(100%)
55.16
(101.2%)
66.71
(122.4%)
67.40
(123.7%)
Annual final energy demand
E K kWh/(m2 × year)
27.68
(100%)
27.94
(100.9%)
32.69
(118.1%)
32.97
(119.1%)
Annual demand for nonrenewable primary energy E P kWh/(m2 × year)83.04
(100%)
83.83
(100.9%)
98.06
(118.1%)
98.91
(119.1%)
Publisher’s Note: MDPI stays neutral with regard to jurisdictional claims in published maps and institutional affiliations.