Article

Water Vapor Blending Ratio Effects on Combustion Thermal Performance and Emission of Hydrogen Homogeneous Charge Compression Ignition

1
School of Mechanical and Energy Engineering, Shaoyang University, Shaoyang 422000, China
2
Key Laboratory of Hunan Province for Efficient Power System and Intelligent Manufacturing, Shaoyang University, Shaoyang 422000, China
*
Authors to whom correspondence should be addressed.
Energies 2022, 15(23), 9055; https://doi.org/10.3390/en15239055
Submission received: 29 October 2022 / Revised: 21 November 2022 / Accepted: 27 November 2022 / Published: 29 November 2022

Abstract

:
A numerical model of the micro-free-piston engine was developed and its correctness was verified by the comparison between the simulation and referential experiment results under the same work conditions. Based on this numerical model, the effects of the water vapor blending ratio (α) on combustion thermal performance and emission characteristics of hydrogen (H2) homogeneous charge compressing ignition (HCCI) were investigated numerically. The water vapor impact on combustion temperature was analyzed as well. The simulation results reveal that when the initial equivalent ratio is 0.5, blending H2 with water vapor can delay the ignition time and prolong the whole process. At the same time, the addition of water vapor to H2 decreases the peak combustion temperature and pressure, which will alleviate the detonation phenomenon of the combustion chamber. Moreover, the power output capacity and NOx emissions decrease with the increase in α. When α increases to 0.8, the mixture gas cannot be compressed to ignite. Finally, the dilution effect, thermal effect, and chemical effect of water vapor all have the potential to lower the combustion temperature and the dilution effect plays the leading role.

1. Introduction

In 1979, Onishi et al. [1] proposed HCCI, an alternative engine combustion mode. Briefly, HCCI entails compressing a fuel–air mixture until it ignites spontaneously, and the ignition occurs simultaneously at any point within the combustion chamber. This kind of ignition approach could reduce NOx emissions and particular matter in comparison to spark ignition and compression ignition combustion [2]. In 2002, Aichlmayr et al. [3] developed a 10 W micro-HCCI free-piston engine and presented various considerations for its design. One year later, Aichlmayr et al. [4] carried out a single-shot experiment in a Pyrex tube filled with a fuel–air mixture. The results revealed that it was possible to implement HCCI in a space of 3 mm in diameter and 0.3 mm in length, indicating the viability of a micro-HCCI free-piston engine. Since then, the micro-HCCI free-piston engine has attracted the attention of many research institutions.
Due to the absence of several moving parts, such as the crankshaft, connecting rod, and flywheel, the free-piston engine has less frictional loss and a greater power-to-weight ratio (i.e., a higher power density of the device) [5]. Additionally, because HCCI combustion does not require any ignition device, the structure of the micro-HCCI free-piston engine becomes further simplified, making the device easy to miniaturize. Therefore, it has the potential to be the micro-power source for MEMS (micro-electro-mechanical systems). Up to now, many research outcomes have been obtained in this area. The mass and initial speed of the free piston and the initial temperature and pressure of the mixture inside the combustion chamber could all impact the combustion of the micro-HCCI free-piston engine [6,7]. Bai et al. [8] adopted experiments and numerical simulation methods to investigate the initial kinetic energy in the starting phase of a micro-HCCI free-piston engine fueled with methane, the results revealed the existence of a critical initial kinetic energy and that the mixture in the micro-HCCI free-piston could be compressed to ignite successfully when the initial kinetic energy of the piston was greater than the critical kinetic energy. Yu et al. [9] and Wang et al. [10,11] found that some methods such as mixture preheating, catalyzing, and H2 addition could reduce the critical initial kinetic energy of the piston so that the ignition limit was broadened. Recently, Zainal A et al. [12] found that the aspect ratio significantly impacted the performance of the free-piston, and the combustion of the device improved as the aspect ratio increased. Bai et al. [13] investigated the scavenging process of the micro-free-piston engine numerically, the results showed that intake and exhaust structure parameters had a significant impact on the scavenging process and found the optimal design size of those parameters.
As the cleanest fuel, H2 does not produce any pollution to the environment. Up till now, there have not been many studies on pure H2 combustion in micro-HCCI free-piston engines. In the early studies, H2 was mostly used as an additive and burned after mixing with other gases. However, due to the low ignition energy, rapid flame speed, and high combustion temperature of H2, the combustion of pure H2 has some challenges, such as high-pressure rise rate, early combustion, and high NOx emission [14]. For conventional crankshaft engines fueled with H2, humidified combustion is an effective method to solve the challenges mentioned above. Humidified combustion is usually divided into three categories based on the method of humidification: blending fuel with water vapor, blending oxidizer with water vapor, and injecting water or water vapor directly into the combustion chamber [15]. The water or water vapor not only absorbs heat when the fuel burns in the combustion chamber but also slows down the chemical reaction during combustion [16], thus reducing the combustion temperature and pressure. Dhyani et al. [17] studied the effects of cool exhaust gas recirculation (EGR) and water injecting strategies on the control of backfire and NOx emissions, they found that backfire and NOx emissions could be more effectively controlled by water injection. Lu et al. [18] studied the effects of water injection on the combustion characteristics of the H2 engine, and the results showed that an appropriate proportion of water injected into the cylinder during the intake process could increase the engine output power, reduce NOx emission, and effectively keep the engine operation stably. Xu et al. [19] studied the H2-fueled engine with a water injection system. The results showed that directly spraying water into the cylinder could effectively reduce the combustion temperature and pressure, which would alleviate the detonation phenomenon and reduce NOx emissions.
Currently, research studies on the humidified combustion of H2-fueled engines focus primarily on the conventional crankshaft engines and barely on the micro-HCCI free-piston engine. In this paper, the effects of blending fuel (H2) with water vapor on the combustion and NOx emission characteristics of a micro-HCCI free-piston engine will be studied numerically, and the effects of water vapor on combustion temperature and their relative magnitude will be analyzed as well, to provide a theoretical basis to alleviate the detonation phenomenon and reduce the NOx emissions of a micro-HCCI free-piston engine, and further popularize the application of H2.

2. Simulation Method and Verification

2.1. Physical Model and Grid

Figure 1 is the physical model of the micro-HCCI free-piston engine. The free piston is provided an initial velocity and then compresses the mixture gas filled in the combustion chamber in advance. When the temperature of the mixture gas reaches its spontaneous combustion temperature, the mixture gas will be compressed to ignite and then expands and pushes the piston back.
To simplify the model, it is assumed that the temperature, pressure, and component concentration at each point in the combustion chamber are the same. The friction and thermal deformation of materials are ignored. Thus, the equation of the free piston motion is:
m d 2 x d t 2 = p p A
where p is the absolute pressure in the cylinder, and A is the cross-sectional area of the free piston.
In consideration of the symmetry of the combustor, the axisymmetric swirl grid is employed to simulate calculation, which can achieve enough accuracy and also greatly reduce the time of calculation. The grid of the physical model is shown in Figure 2. The top of the combustion chamber is the combustion reaction region, which is encrypted. The cylinder wall is the boundary layer, which is encrypted as well. As for the leakage clearance, the method proposed by Bai [20] is implemented, namely, transferring the leakage to the top of the combustion chamber, and defining the leakage outlet as the pressure outlet. The free piston is provided with an initial velocity by compiling the UDF file. The dynamic laying model is employed to calculate the dynamic mesh. To achieve the accuracy of dynamic mesh calculation, the time step is set as 2 × 10⁻⁷ s.

2.2. Mathematical Model

In the numerical simulation of this paper, the mass, momentum, and energy conservation equations of fluid and the component conservation equation of chemical reaction are used for calculation. The conservation equations of mass, momentum, energy, and component are, respectively, shown in Equations (2)–(5):
ρ t + x i ρ u i = s m
ρ u t t + x j ρ u j u i τ i j = p x i + s i
ρ d e d t = τ i j u i x j q i x i + s h
t ρ Y S + x j ρ u j Y S + F S , j = R S
where ρ is the fluid density, t is time, xi is the Cartesian coordinates (x = 1, 2, 3), ui is the absolute rate of fluid in the direction of xi, sm is the quality generation source, ut is the instantaneous velocity of the fluid in the direction t, xj is the Cartesian coordinates (t = 1, 2, 3), uj is the absolute rate of fluid in the direction of xj, τij is the stress tensor, p is pressure, si is energy generation source, e is unit mass with fluid internal energy, qi is energy flux of xi direction, sh is energy generation source, YS is the mass fraction of the component, FS,j is diffusion flow, RS is reaction rate of mass of the component.

2.3. Mesh Independence Analysis

In the numerical calculation, the number of grids can have a direct impact on the calculation results and cost of time. Based on a combustion chamber with a length of 20 cm, a diameter of 3 cm, and no leakage gap, its total mesh length is 20 cm and its total width is 1.5 cm. The mesh is divided into different numbers of grids, and the calculations under the same conditions are carried out. The mesh information and the calculation results are shown in Table 1. It can be seen from Table 1 that, with the increase in nodes of length direction or width direction, there is little variation in the peak temperature and pressure. The biggest variation in peak temperature and peak pressure is 0.09% and 1.36%, respectively. It can be concluded that, when the number of grids reaches a certain level, the number of grids has little effect on the calculation results. In the consideration of the cost of time, the mesh with 80 nodes of length direction and 15 nodes of width direction is employed in calculations in this paper.

2.4. Model Validation

Bai et al. [8] carried out the single stroke experiment to study the methane HCCI combustion process of a micro-free-piston power device at Jiangsu University, and Figure 2 shows the schematic of the experimental system. As shown in Figure 3, the mixture gas is filled in the micro-combustion chamber in advance by the premixed gas system consisting of a high-pressure O2 cylinder, gas container, flow meter, and flowmeter controller. The N2 cylinder provides power to drive the gas hammer to strike the injector pin, and then the injector pin strikes the free piston to compress the mixture gas with a certain velocity. The combustion process and the displacement of the free piston can be captured by a high-speed digital camera.
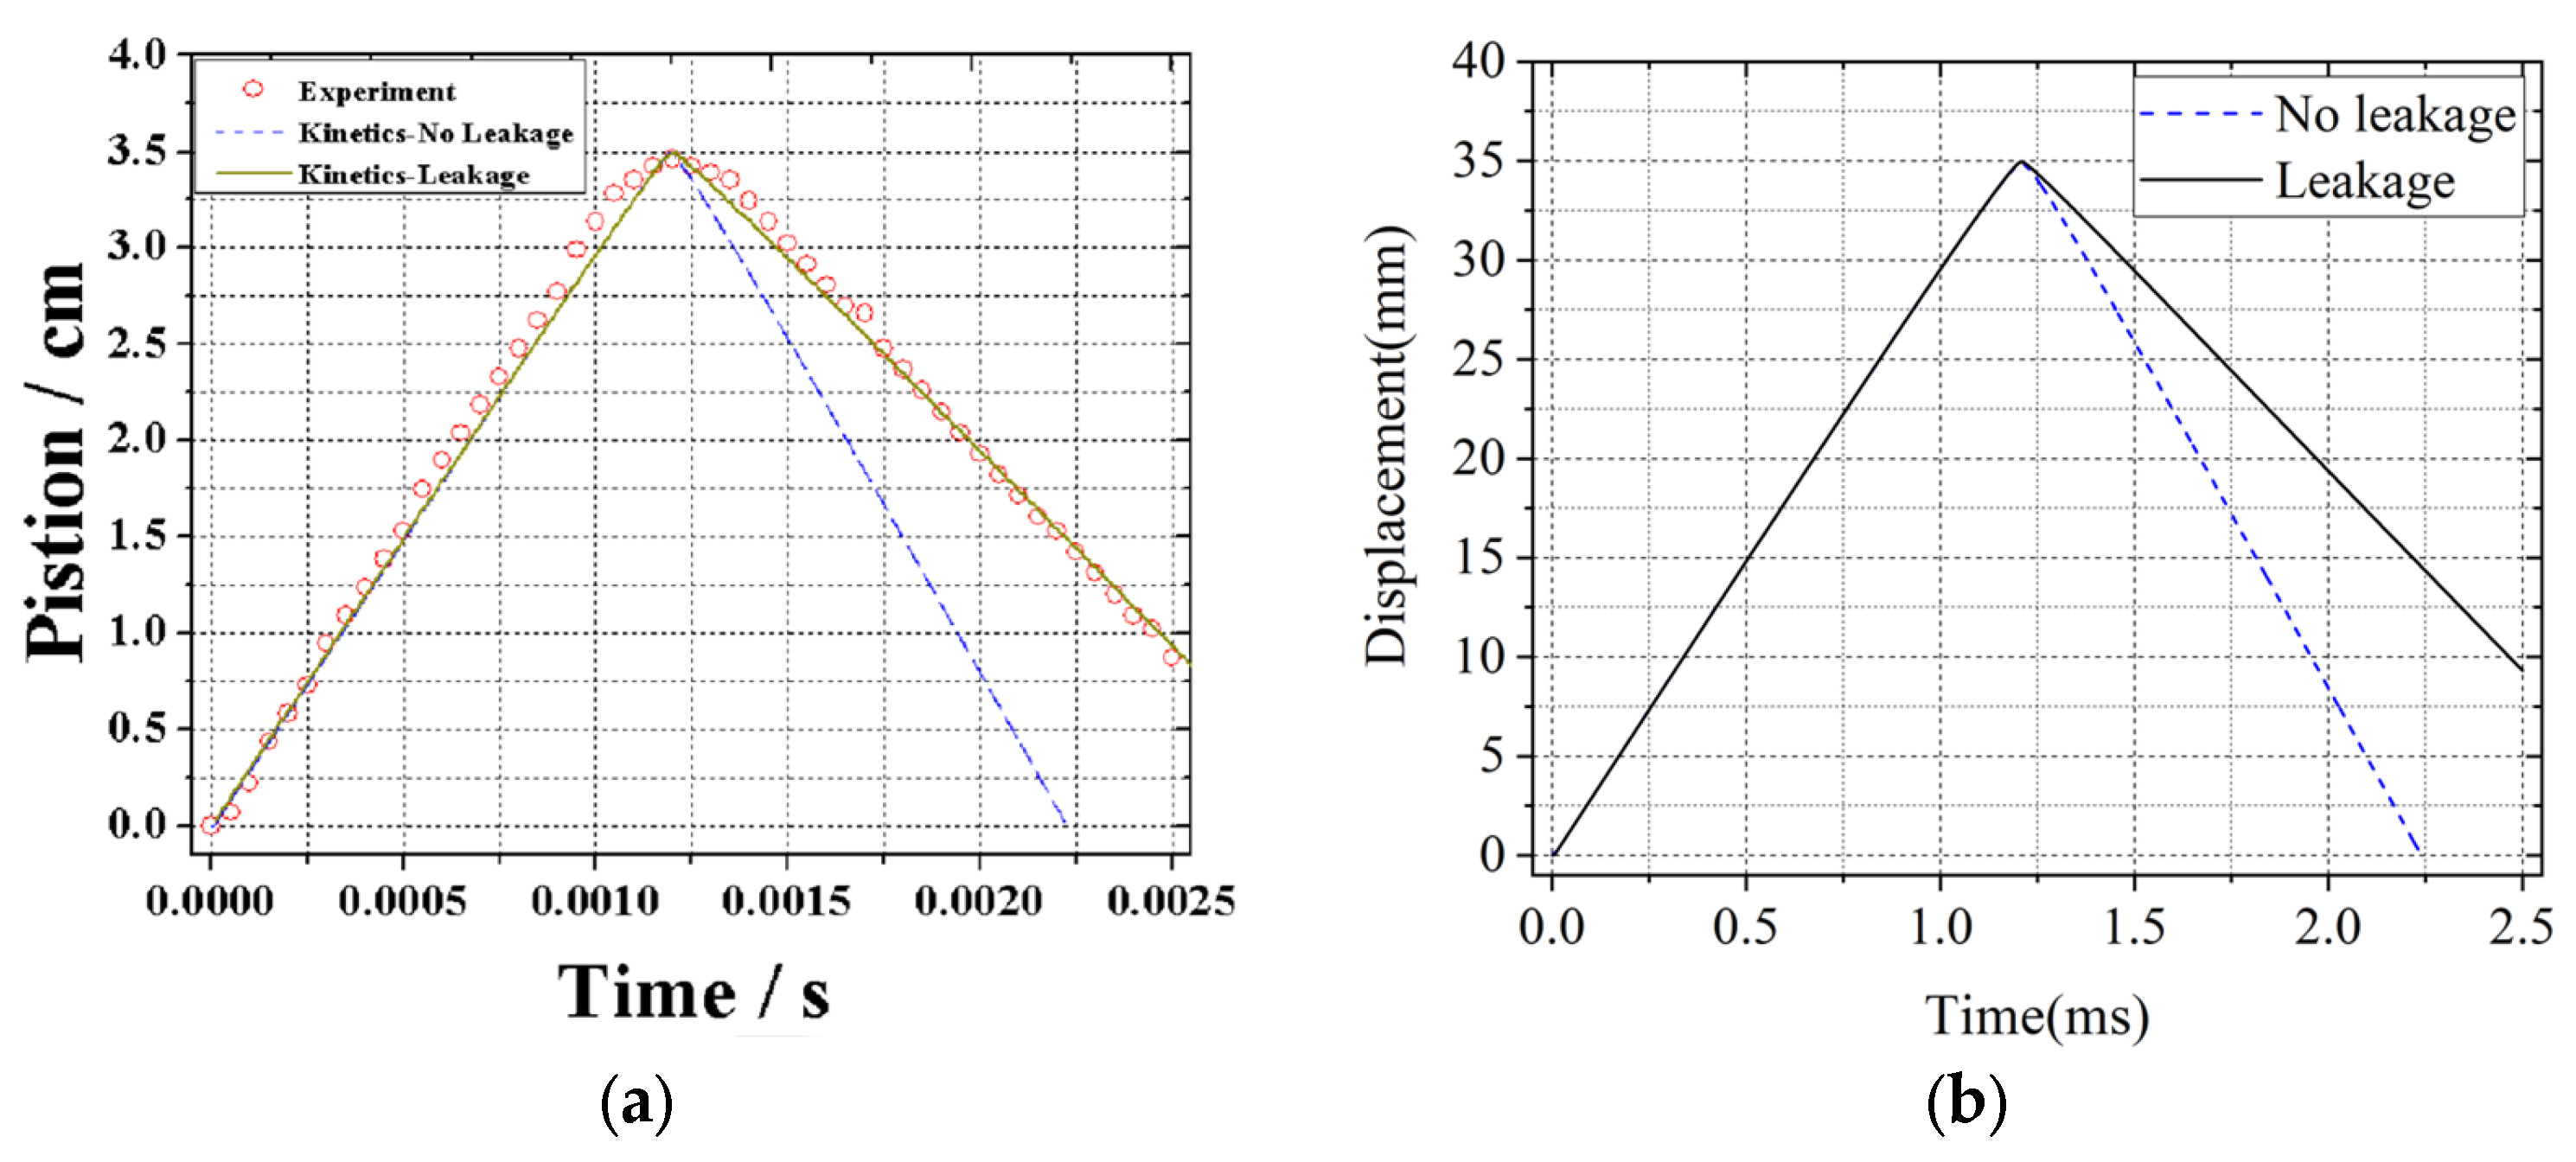
To verify the correctness and reliability of the numerical model of this paper, the numerical simulation under the same conditions as Bai’s experiment is carried out, and the conditions of the experiment are listed in Table 2. The mechanism of methane combustion includes 17 steps and 24 components [21].
Figure 4 is a comparison of the simulation results and the experiment results: (a) is the piston displacement curves of the reference experiment, and (b) is the piston displacement curves calculated by the numerical model of this paper. It can be seen from these two pictures that the simulation results under leakage condition meet the experiment results with high consistency, which proves the correctness of this numerical model and provides basic conditions for the following numerical simulation of H2 combustion.

2.5. Simulation Conditions

The main purpose of this paper is to study the effects of the water vapor blending ratio on H2 HCCI combustion and emission characteristics. Therefore, adiabatic and leak-free conditions are adopted in the following simulations. The water vapor blending ratio is defined as adding water vapor to H2, regarding water vapor as a kind of fuel and replacing part of H2, and the total volume of the mixture of H2 and water vapor in the cylinder remains the same. Thus, the water vapor blending ratio can be expressed as:
α = V w v V M I X = V w v V w v + V H 2
where α is the water vapor blending ratio, VMIX is the total volume of fuel, VWV is the volume of water vapor, and VH2 is the volume of H2.
The H2 reaction mechanism, developed by O’Conaire [22], is adopted, which includes 9 components and 19 steps. Numerical simulation conditions and solver settings are listed in Table 3.

3. Results and Discussion

3.1. The H2 Ignition Process

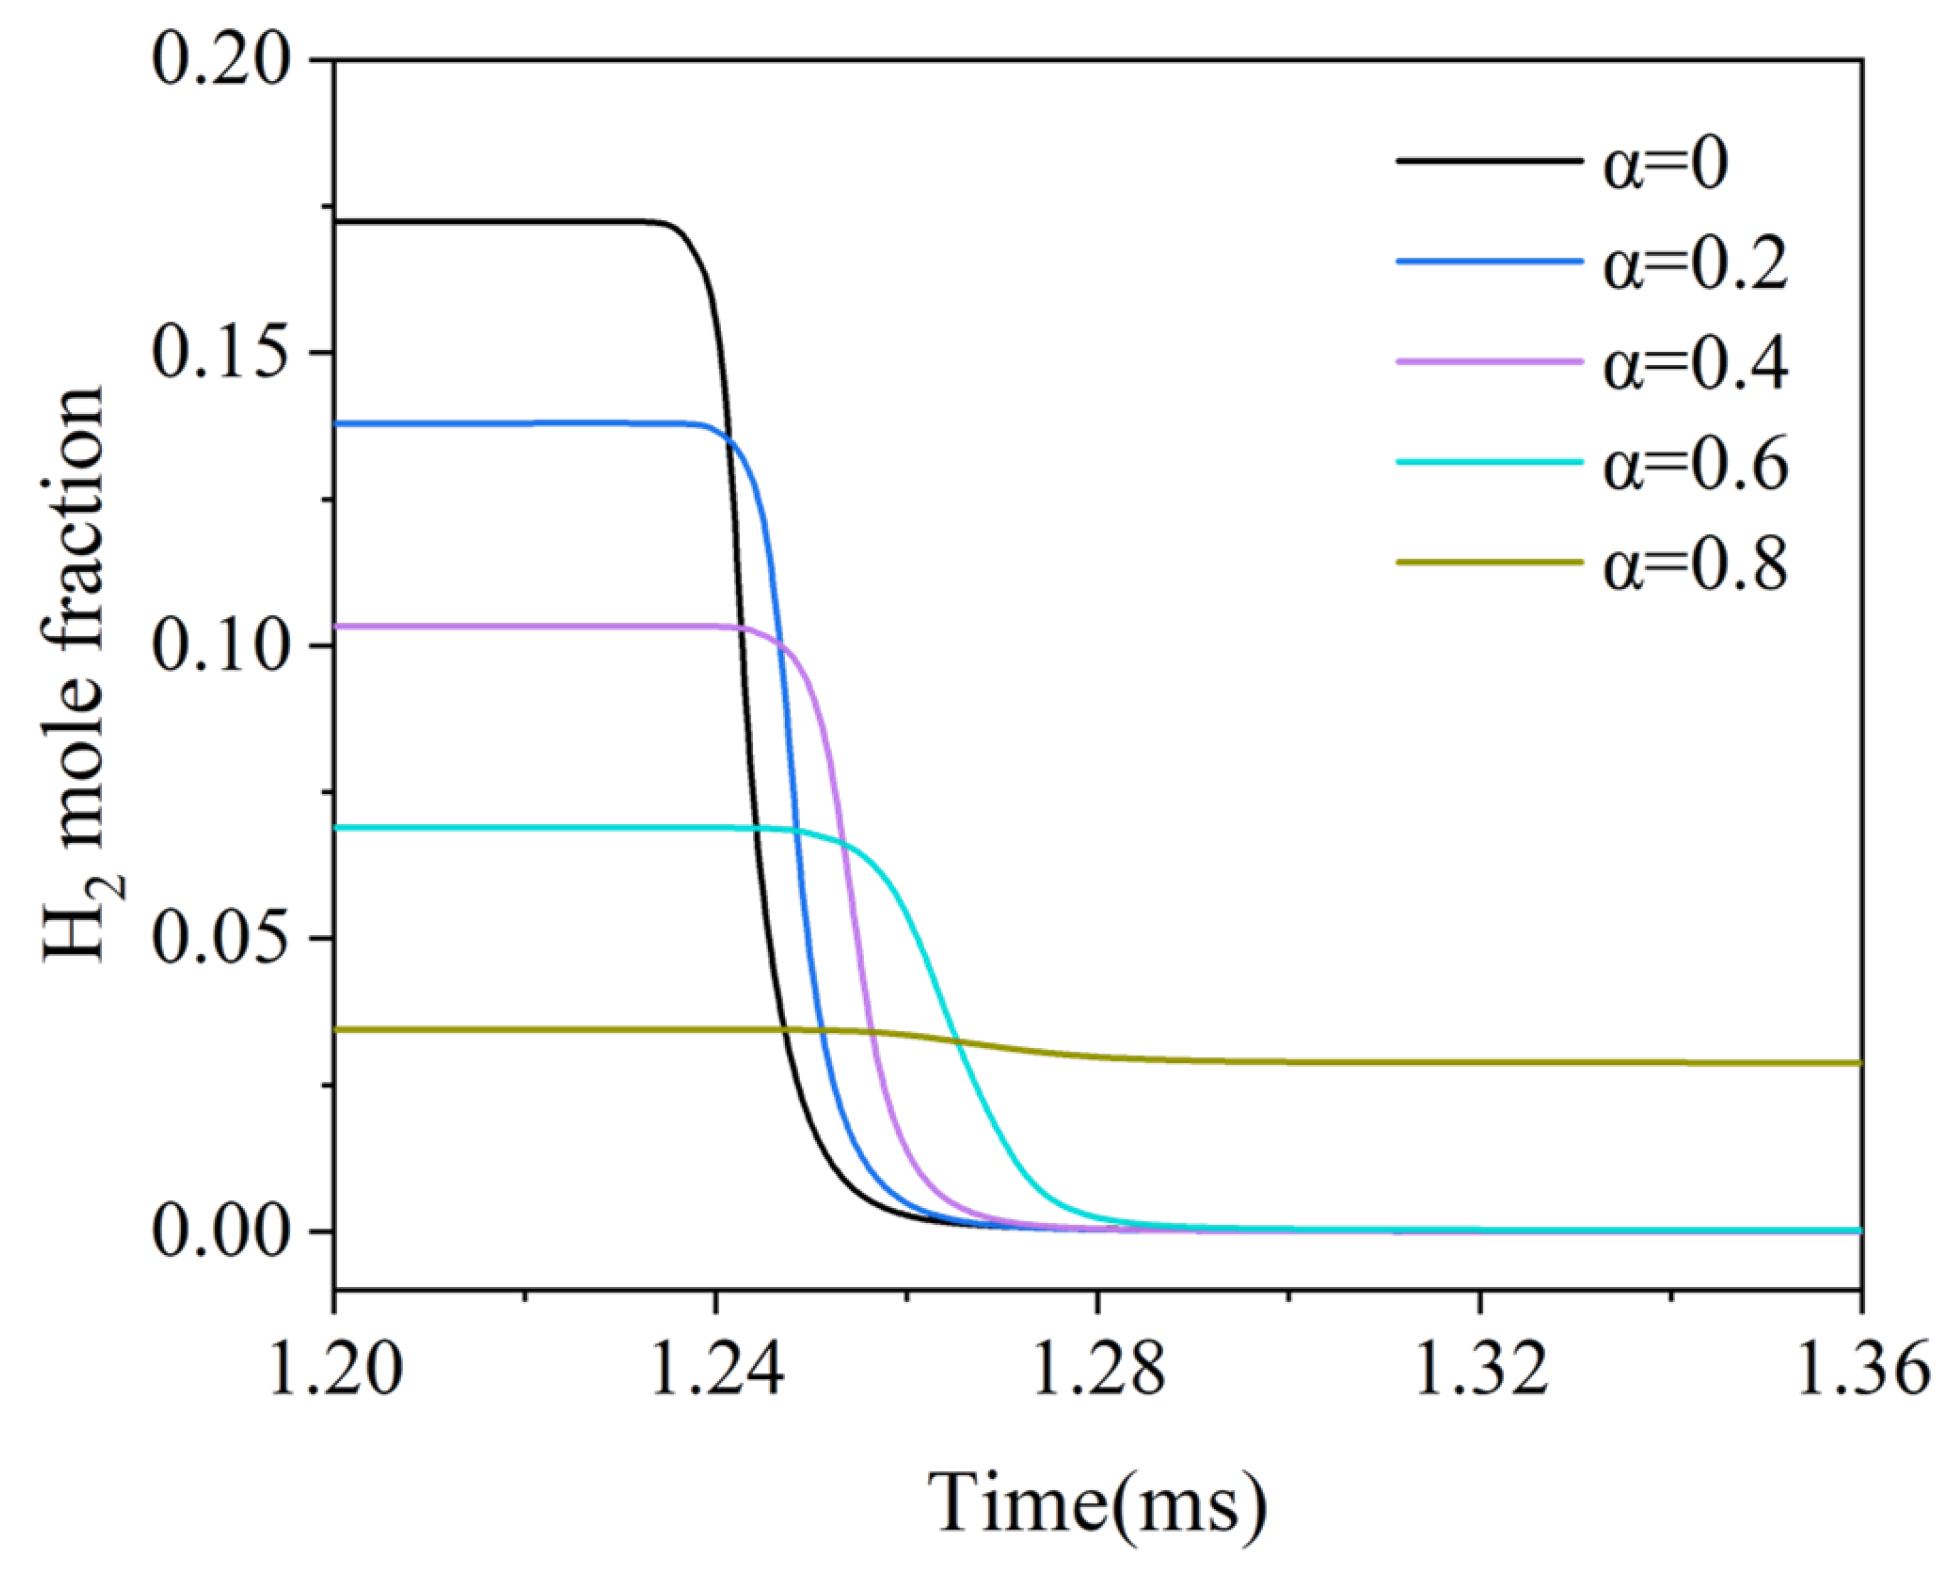
Figure 5 is the variation curves of the mole fraction of H2 under different α. When α is 0, 0.2, 0.4, and 0.6, the H2 mole fraction decreases to 0 rapidly after reaching a certain time, which indicates that full compressed ignition occurs under these conditions. However, when α reaches 0.8, the H2 mole fraction decreases slightly, meaning that the compression ignition does not occur obviously in the combustion chamber. It can also be found from the figure that the slope of H2 consumption decreases with the increase in α, indicating that the chemical reaction rate of H2 decreases. The chemical reaction rate strongly depends on the concentration of reactants, and the lower the concentration of reactants, the slower the chemical reaction rate. Because the volume fraction of water vapor in the mixture increases, the concentration of H2 in the mixture decreases, which results in a reduction in the number of molecules. Thus, the chemical reaction rate of H2 slows down.
Figure 6 shows the variation curves of the mole fraction of H2O2 under different α. According to the method proposed by Westbrook [23], it can be seen as the ignition point of any hydrogen fuel when the concentration of H2O2 reaches the maximum and then decomposes into OH immediately. It can be seen from the diagram that when α is 0, 0.2, 0.4, and 0.6, the H2O2 mole fraction increases firstly and then decomposes rapidly, and the corresponding ignition time is 1.242 ms, 1.246 ms, 1.252 ms, and 1.261 ms, respectively. The ignition time delays with the increase in α. The decrease in the concentration of H2 leads to the decrease in the concentration of H, O, and OH radicals, which slows down the chemical reaction rate [24,25], thus, the maximum value of the mole fraction of H2O2 keeps moving backward. Therefore, blending H2 with water vapor can delay the ignition time. When α reaches 0.8, the H2O2 mole fraction increases firstly, and then decomposes just a little, then it continues to increase. It also can be deduced that there is no obvious ignition phenomenon in the combustion chamber. Therefore, it can be concluded that blending H2 with water vapor can delay the compression ignition time and slow the speed of combustion as well. When α reaches a certain value, full compression ignition of H2 could not be achieved in the combustion chamber.

3.2. The Combustion Temperature and Pressure

Figure 7 and Figure 8 present the variation curves of combustion temperature and pressure under different α. When α is 0, 0.2, 0.4, and 0.6, the combustion temperature and pressure rise sharply after a certain point and then decrease, which indicates that H2 is compressed to ignite and releases energy under these conditions. With the increase in α, the maximum temperature and pressure decrease, and the pressure rise rate decreases as well. This is mainly because with the increase in α, the mole fraction of H2 decreases, which leads to the decrease in heat released during combustion. The specific heat capacity of water vapor is much larger than that of air, and water vapor can absorb heat in the combustion chamber quickly, which can reduce the temperature and pressure [26]. The more water vapor contained in the cylinder, the more heat is lost. Thus, with the increase in α, the heat absorbed by water vapor increases, and the temperature and pressure decrease. In the meantime, with the increase in α, the moments of peak temperature and pressure move backward. It can be judged from this information that the ignition time delays with the increase in α, which is consistent with the previous conclusion. When α reaches 0.8, according to the analysis above, there is no obvious ignition in the combustor, so the temperature and pressure do not rise sharply, and the curves present a symmetrical distribution. The reduction in temperature is conducive to reducing NOx emissions, and the reduction in pressure can alleviate the detonation phenomenon.

3.3. The Free Piston Movement Process

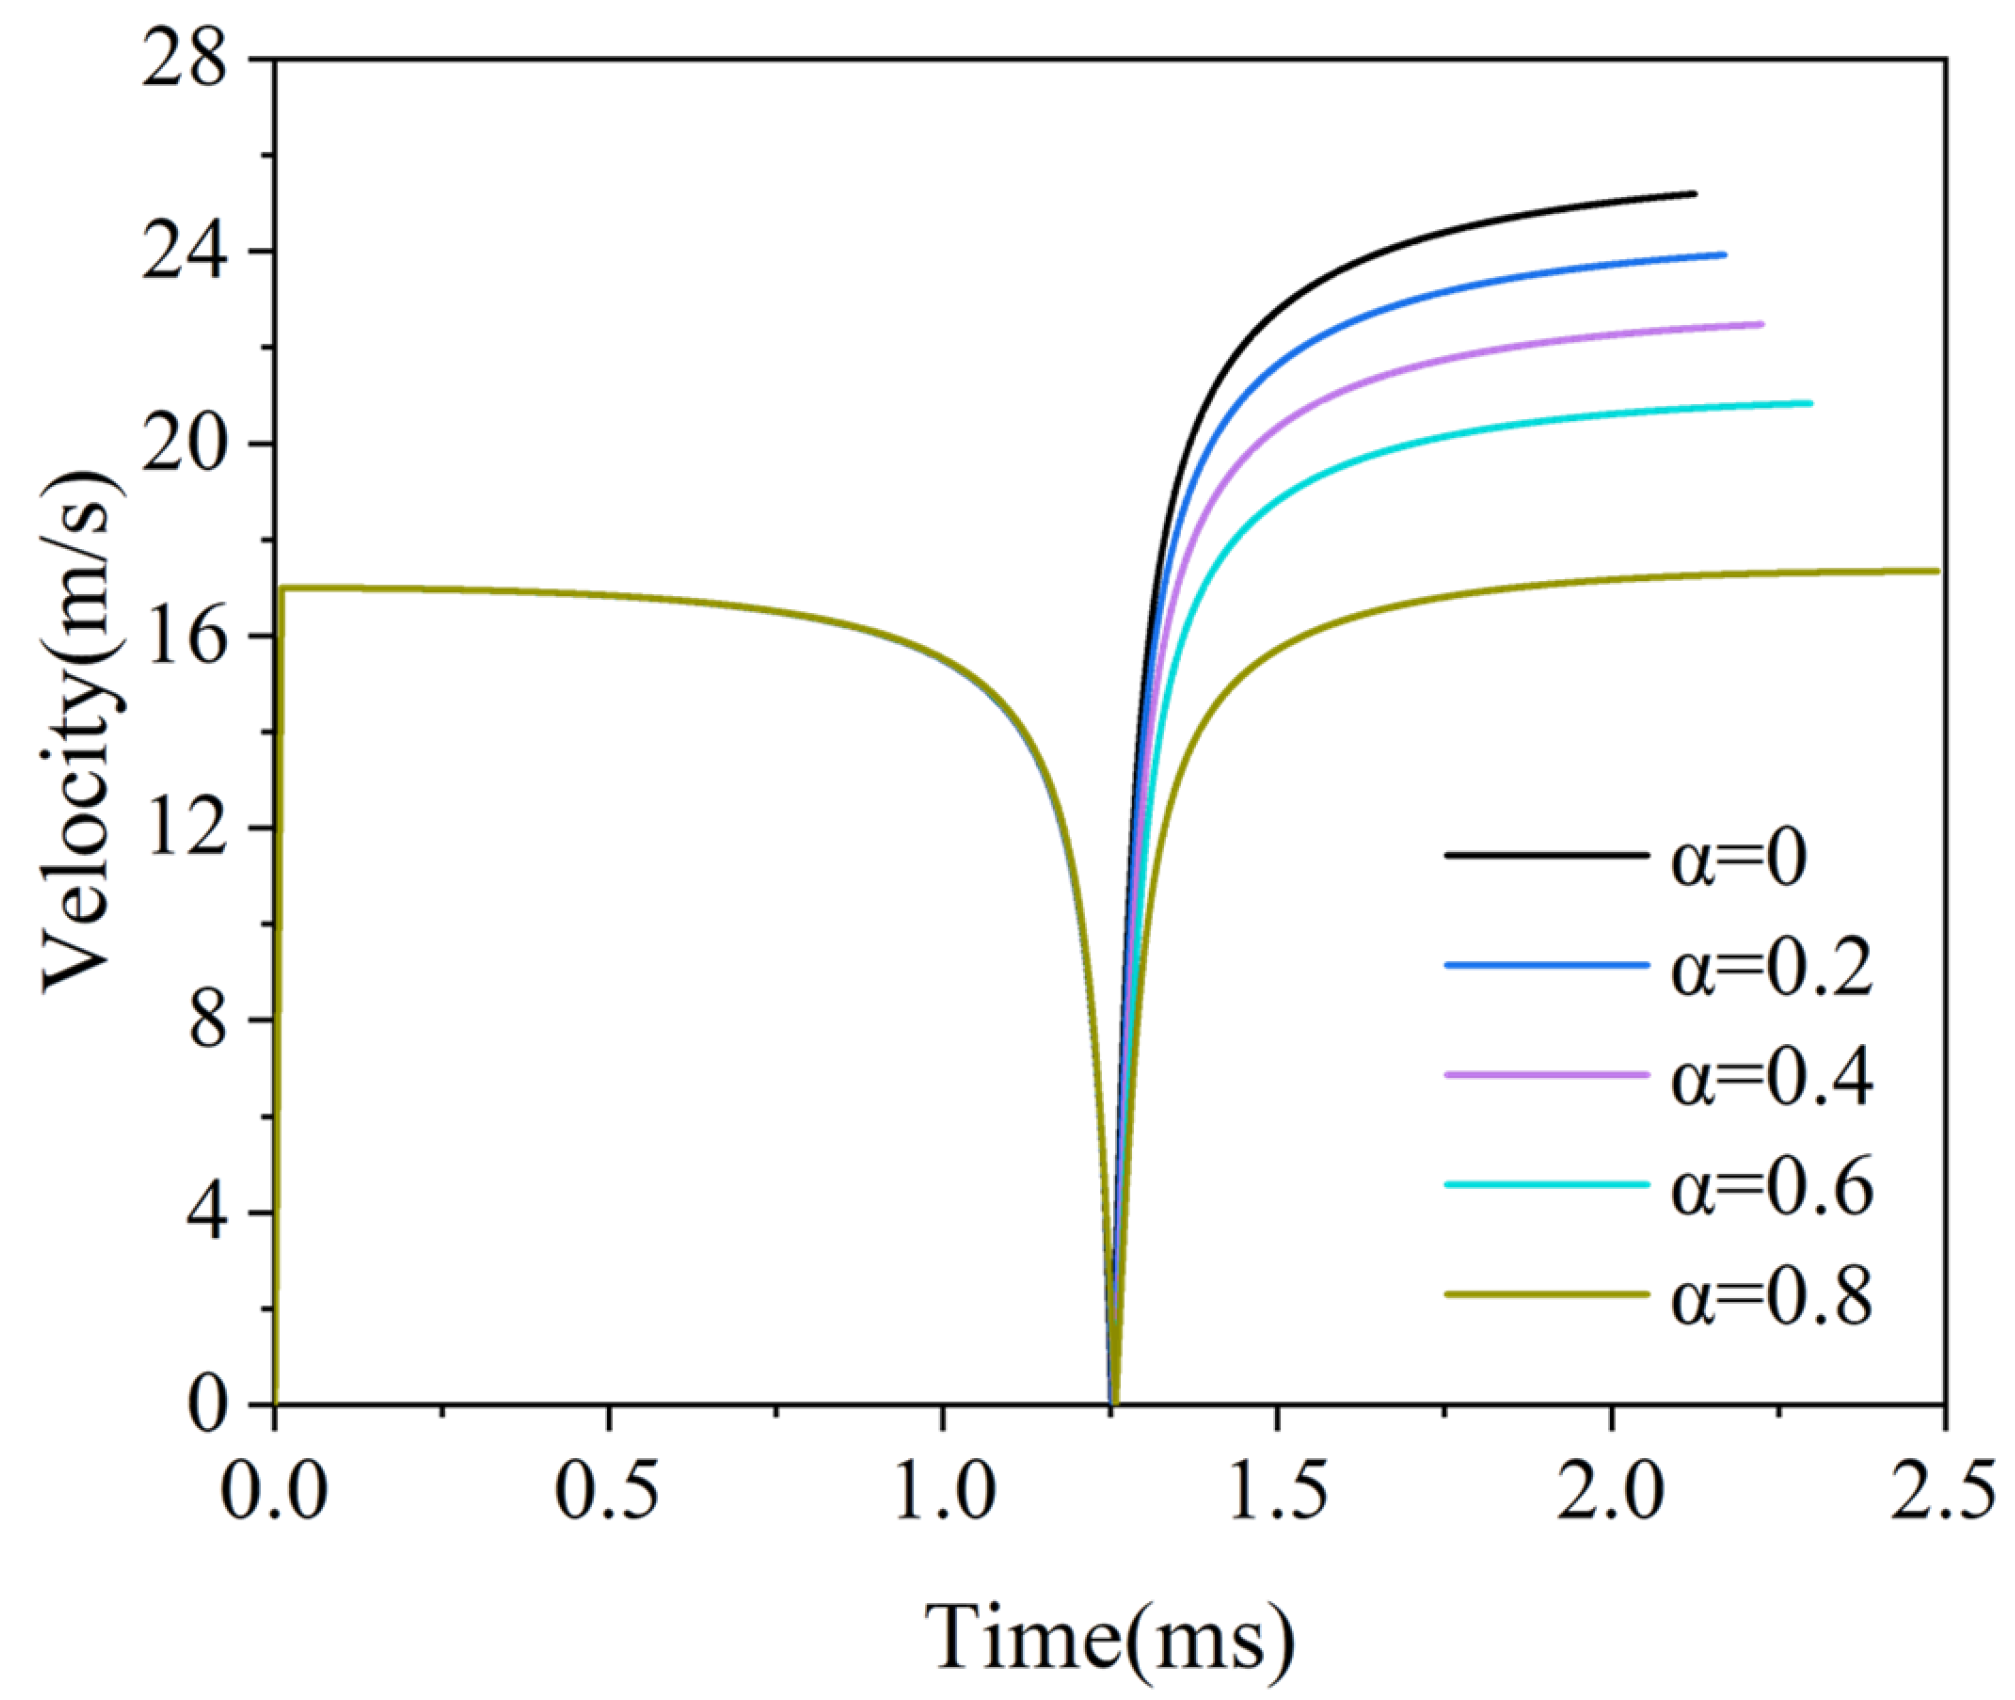
The movement of the free piston is determined by the force on both sides. The velocity of the piston in the return process reflects the strength of the combustion and work capacity of an engine. The higher the pressure in the combustion chamber, the stronger the force exerted on the piston, and the faster the speed achieved by the piston. On the contrary, the return velocity of the piston decreases with the decrease in the pressure in the combustion chamber.
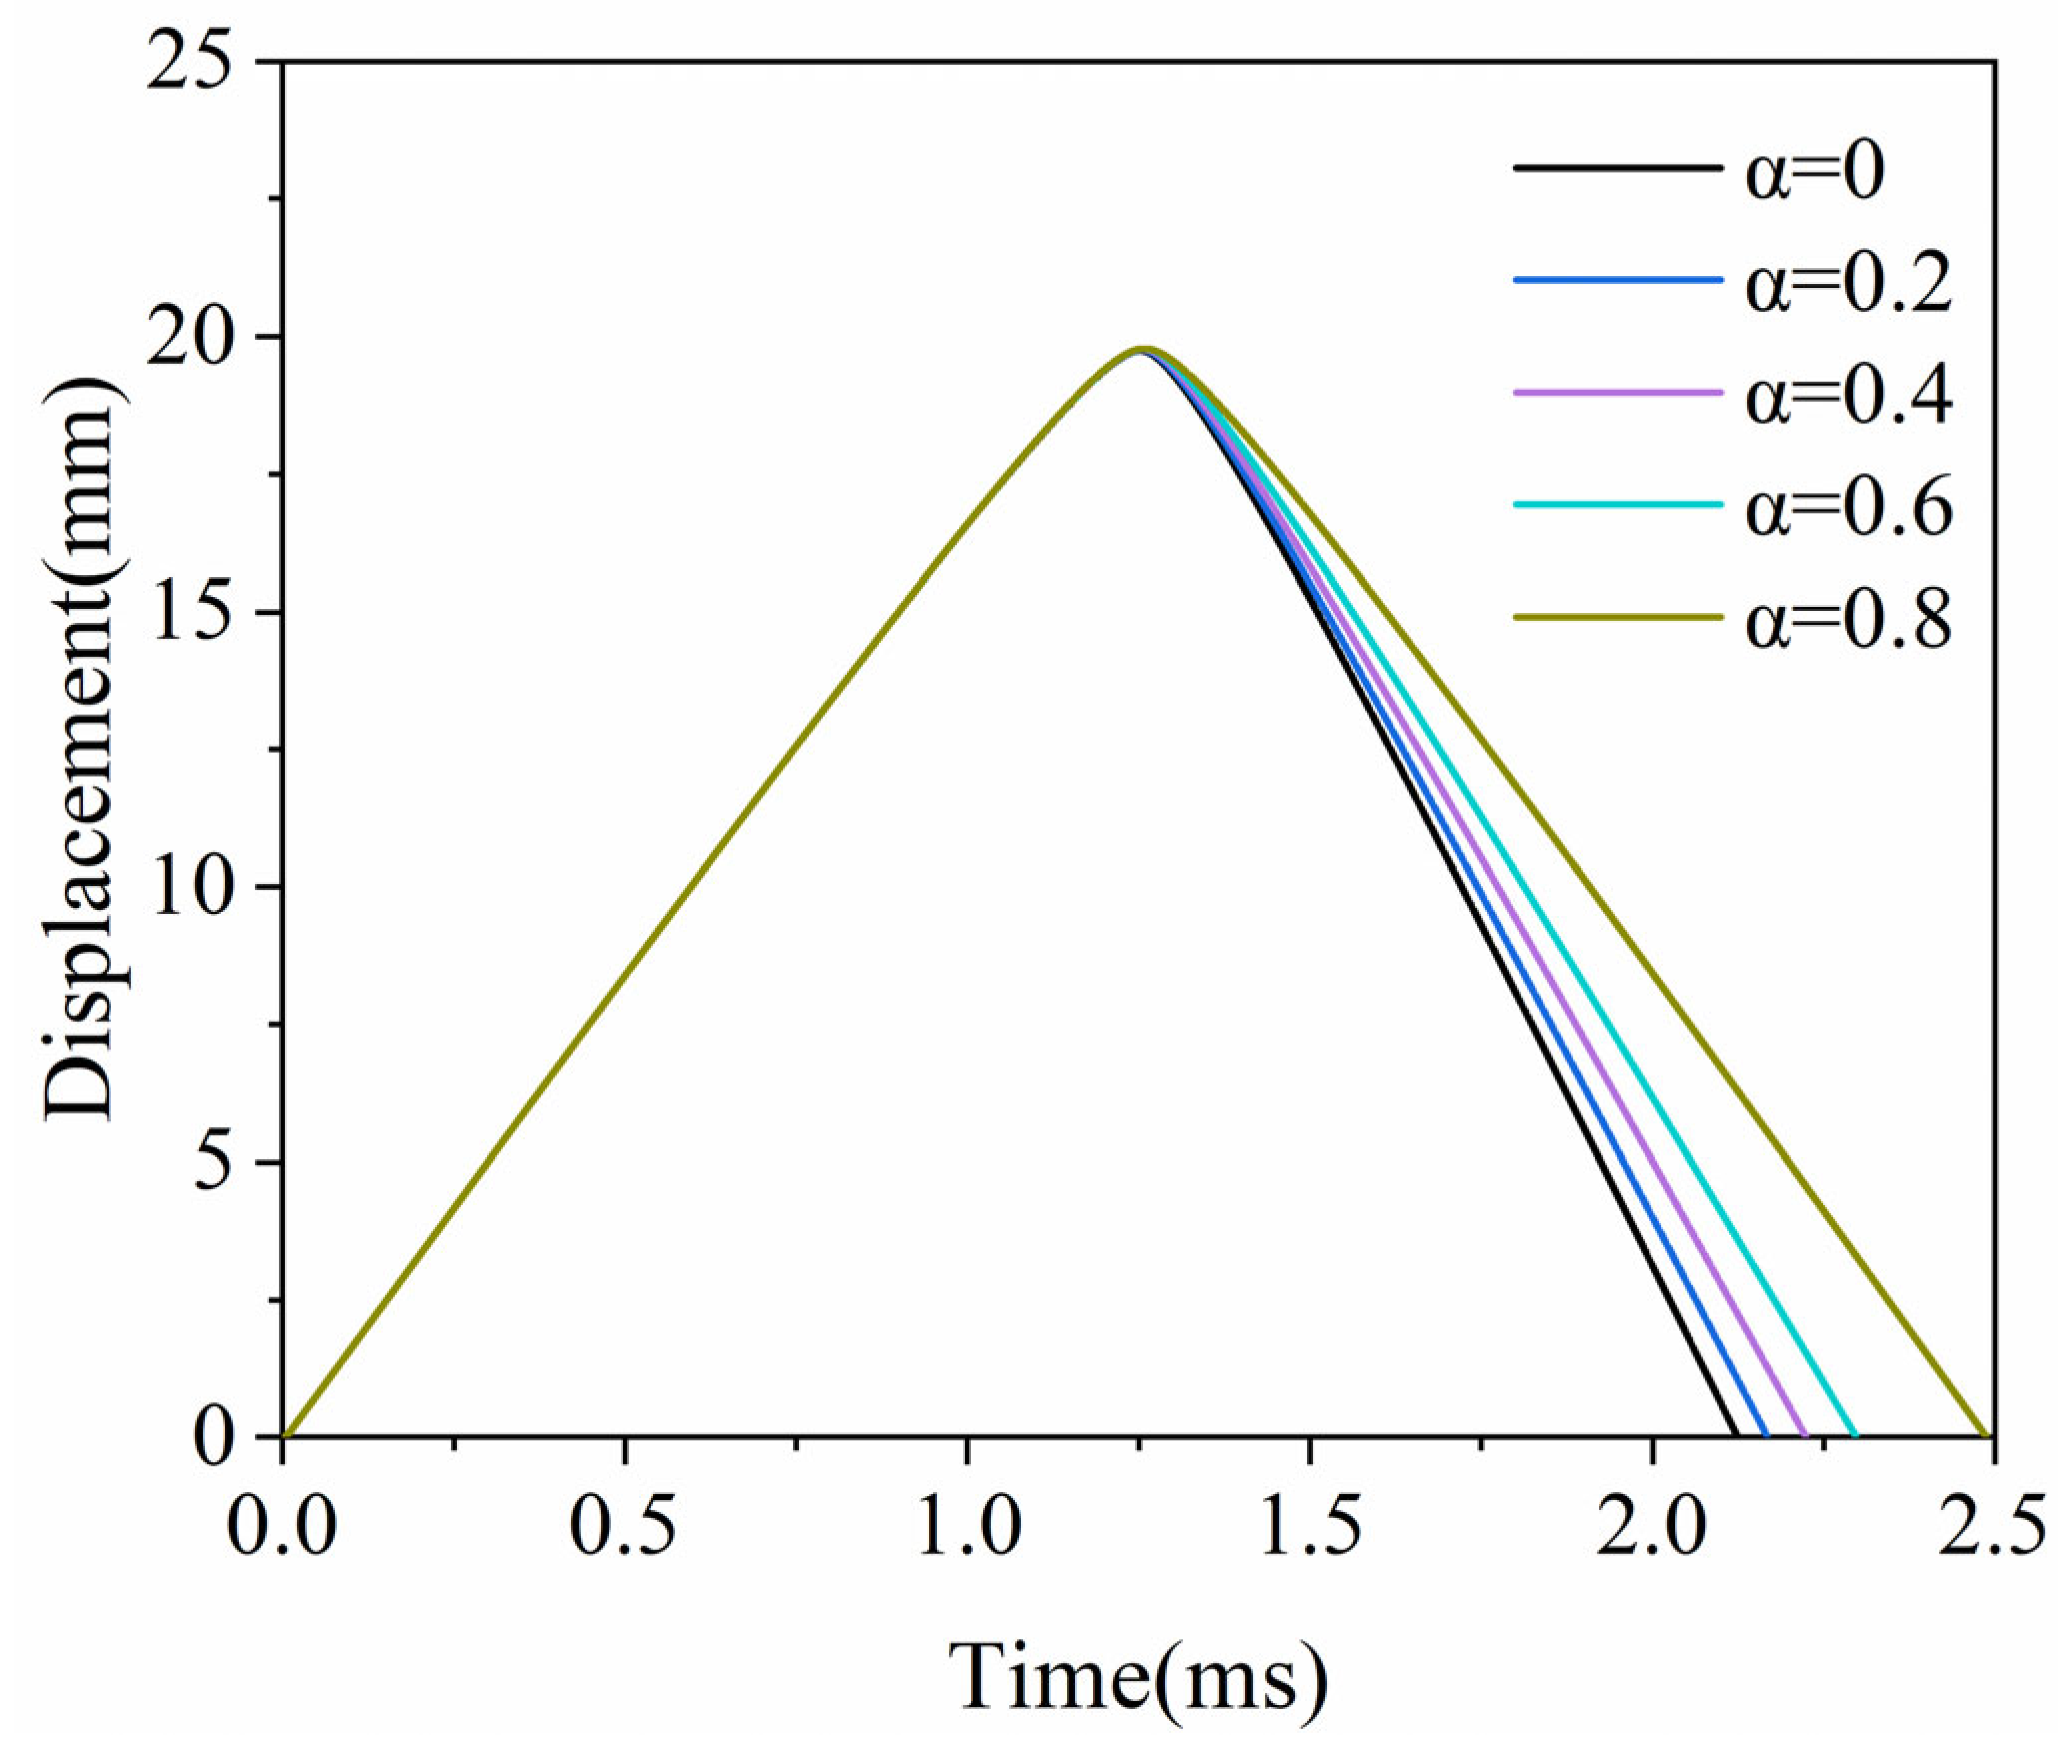
Figure 9 and Figure 10, respectively, show the variation curves of the piston velocity and displacement under different α. When α is 0, 0.2, 0.4, and 0.6, the return velocity of the piston is higher than the initial velocity, which means that compression ignition occurs, and the piston obtains kinetic energy. With the increase in the α, the return velocity of the piston gradually decreases, and the time when the piston returns to the initial place delays, indicating that the piston operating frequency decreases, and the external power capability of the device per unit time decreases. This is because in the previous analysis, with the increase in α, the combustion pressure decreases, and the force exerted on the piston becomes weaker, which leads to a decrease in the return velocity of the piston. When α reaches 0.8, according to the analysis above, there is no obvious ignition in the combustor, so the return velocity of the piston is almost the same as the initial velocity.

3.4. The Power Capacity of the Micro-Free-Piston Engine

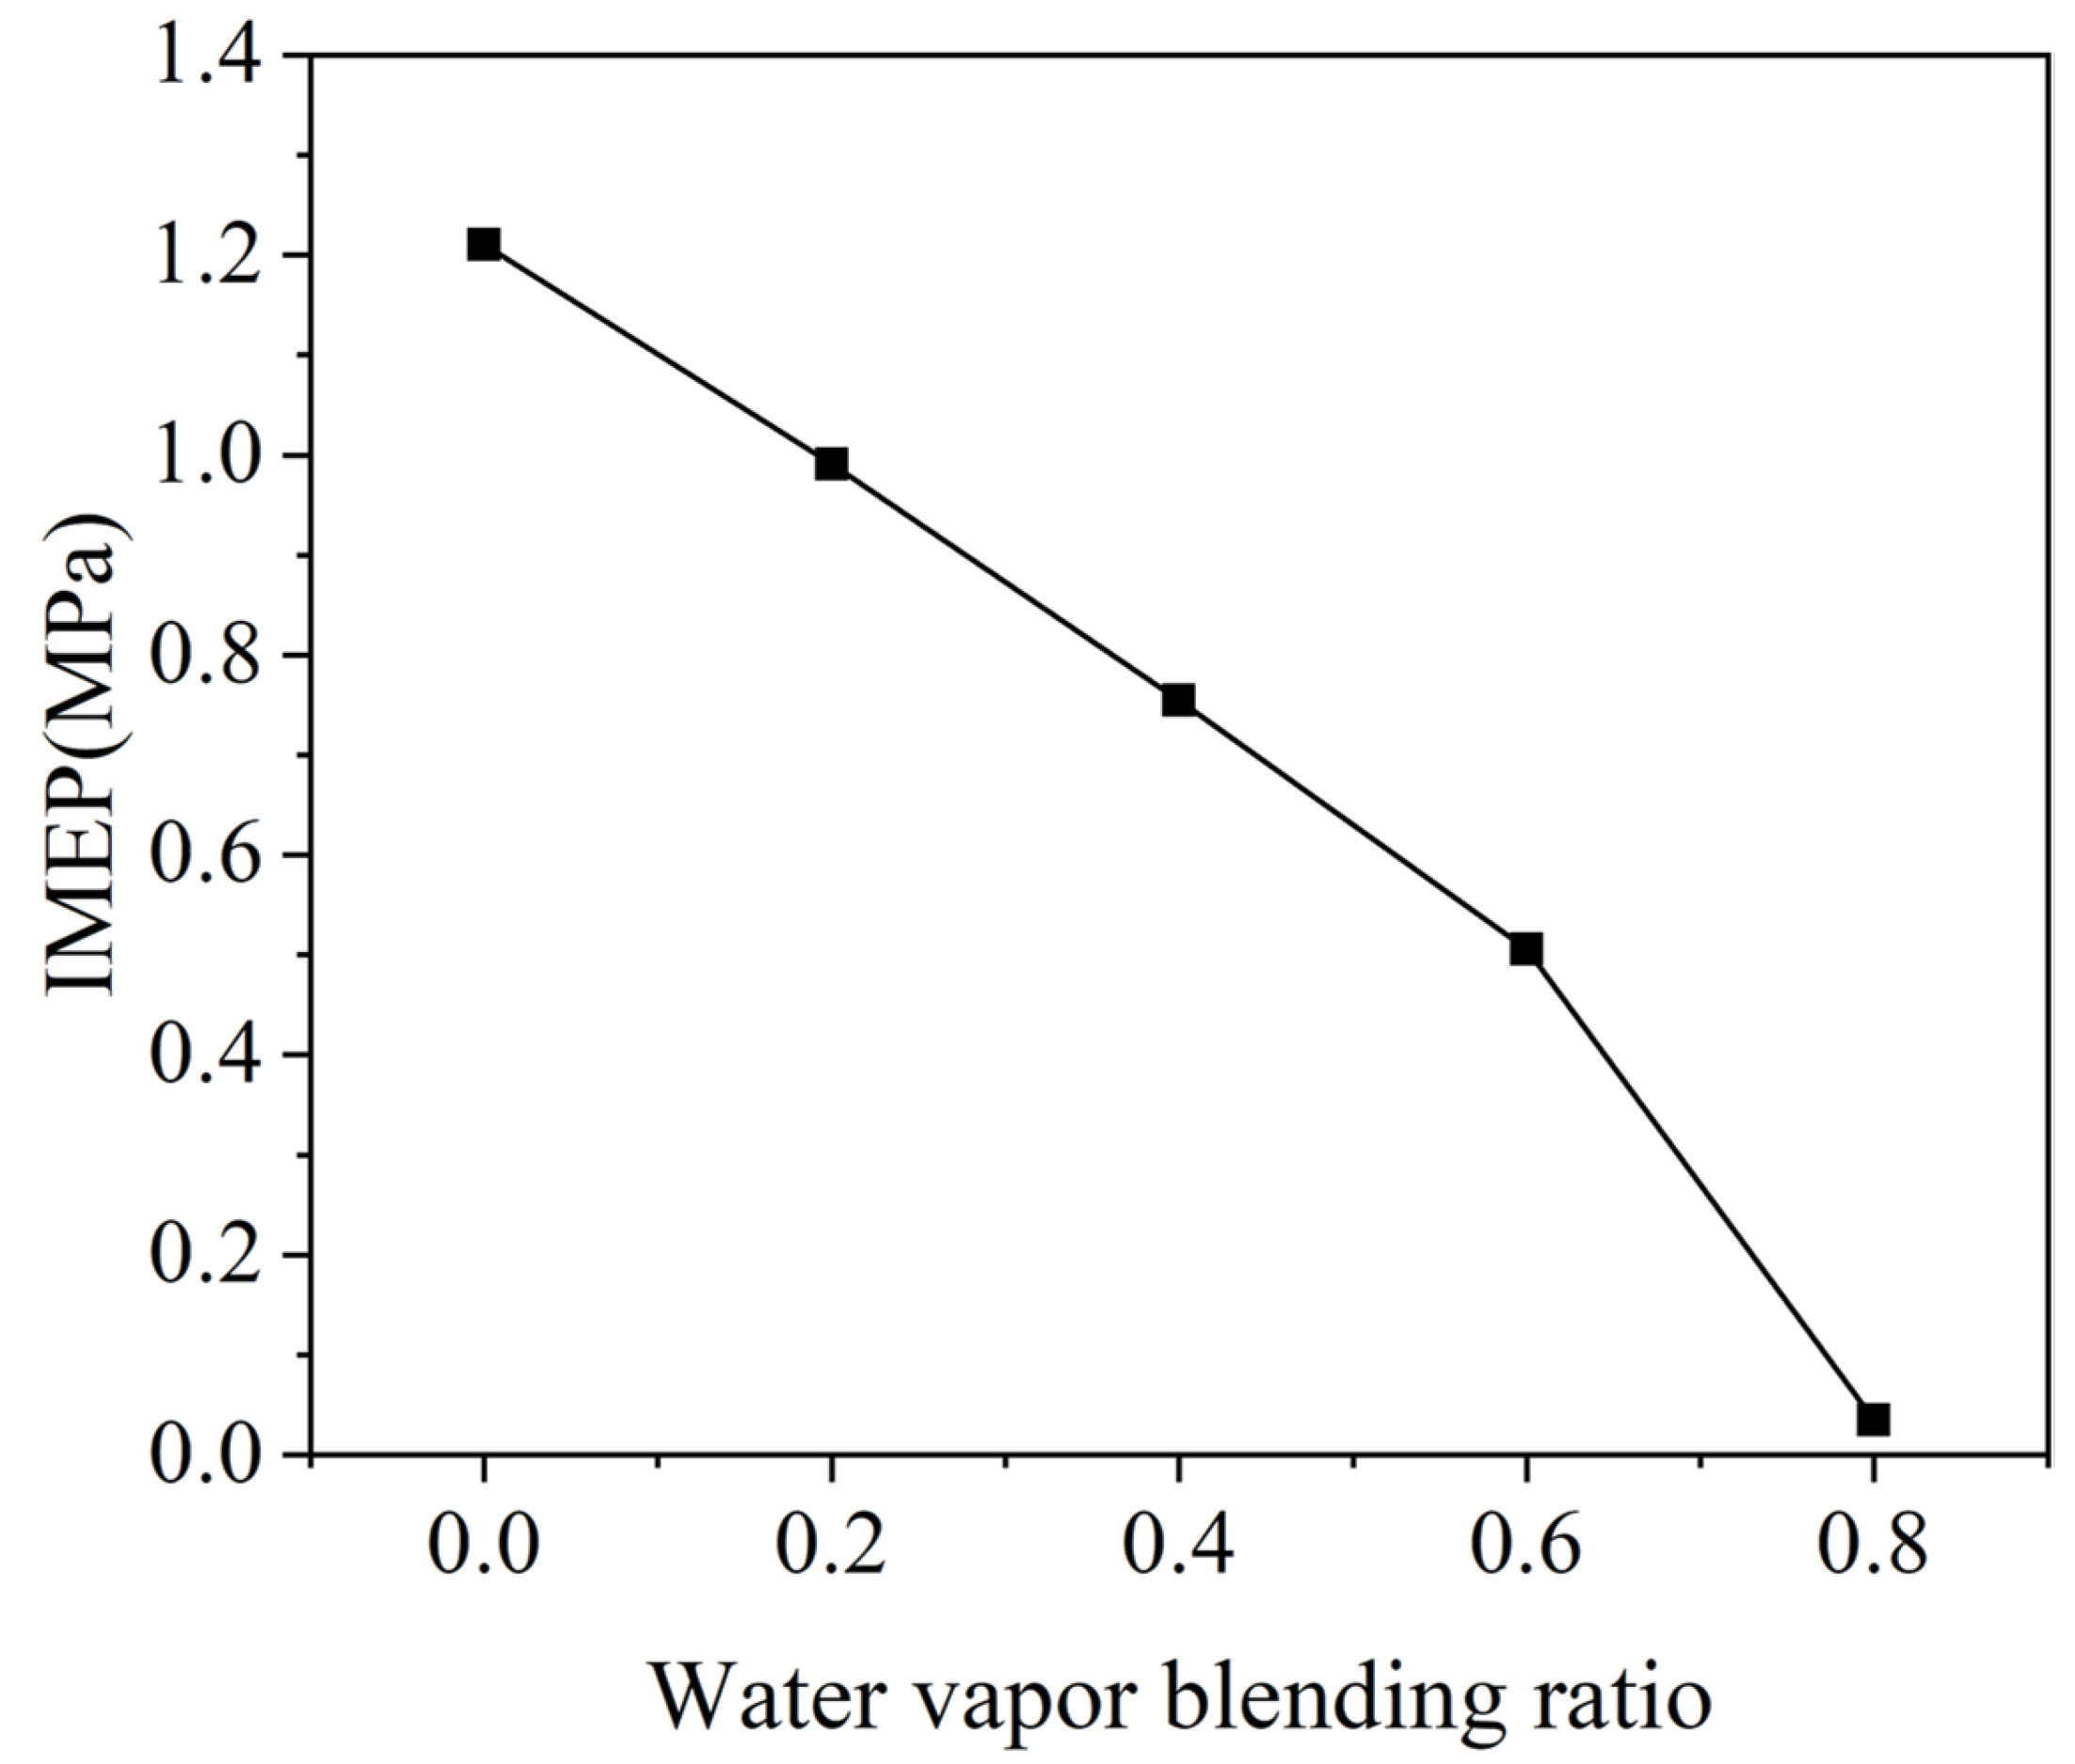
The indicated mean effective pressure (IMEP) is a significant parameter to analyze the power output performance of an engine. Figure 11 and Figure 12, respectively, plot the P-V diagram and IMEP under different α. As can be seen from these two figures, with the increase in α, the area of the P-V diagram decreases, and so does IMEP. When α is 0, 0.2, 0.4, 0.6, and 0.8, the corresponding indicator work is 0.171 J, 0.14 J, 0.107 J, 0.071 J, and 0.005 J, and the corresponding IMEP is 1.21 MPa, 0.99 MPa, 0.75 MPa, 0.51 MPa, and 0.04 MPa, respectively. The micro-HCCI free-piston engine almost loses power output capacity when α reaches 0.8.
This is because water vapor cannot be ignited and has a larger specific heat capacity, which can absorb more heat during combustion. With the increase in α, the combustion temperature decreases, which inhibits the chemical reaction rate and energy release of the mixture [27]. Moreover, the increase in water vapor decreases the total amount of fuel, which decreases the heat release [28]. Under the factors mentioned above, the power output performance deteriorates when α increases.

3.5. The NOx Emissions

The only combustion product of the H2 and O2 mixture under stoichiometry is water. However, under the high-temperature condition in the combustion chamber, NOx may be oxidized from N2 in the mixture and expels from the H2-fuel engine [19]. NOx is one of the main substances that lead to acid rain, photochemical smog, and other environmental problems, and it causes a lot of harm to the environment. Reducing NOx emissions is helpful to popularize the application of H2-fuel engines. The main factors for NOx formation are O2 concentration, high combustion temperature, and high-temperature residence time [29]. Up to now, there are three main reaction mechanisms to describe the NOx formation process: thermal NOx, fuel NOx, and prompt NOx. Thermal NOx is produced by the oxidation of N2 in the high-temperature environment. Fuel NOx depends on the oxidization of nitride contained in the fuel during the combustion process. Additionally, the prompt NOx mechanism requires CH atomic groups to hit the N2 molecular to create a series of chemical reactions, and the intermediate products are eventually oxidized to NOx.
In the H2 combustion process, because NOx is only oxidized from N2 in the mixture gas in the cylinder under the high-temperature conditions, the thermal NOx is the main mechanism to describe the NOx formation of H2 combustion. Thermal NOx strongly depends on the combustion temperature [30], and specifically when the combustion temperature reaches above 1800 K, the rate of NOx formation increases exponentially with the increase in the combustion temperature [31]. Reducing the peak combustion temperature is an efficient method of NOx emission control.
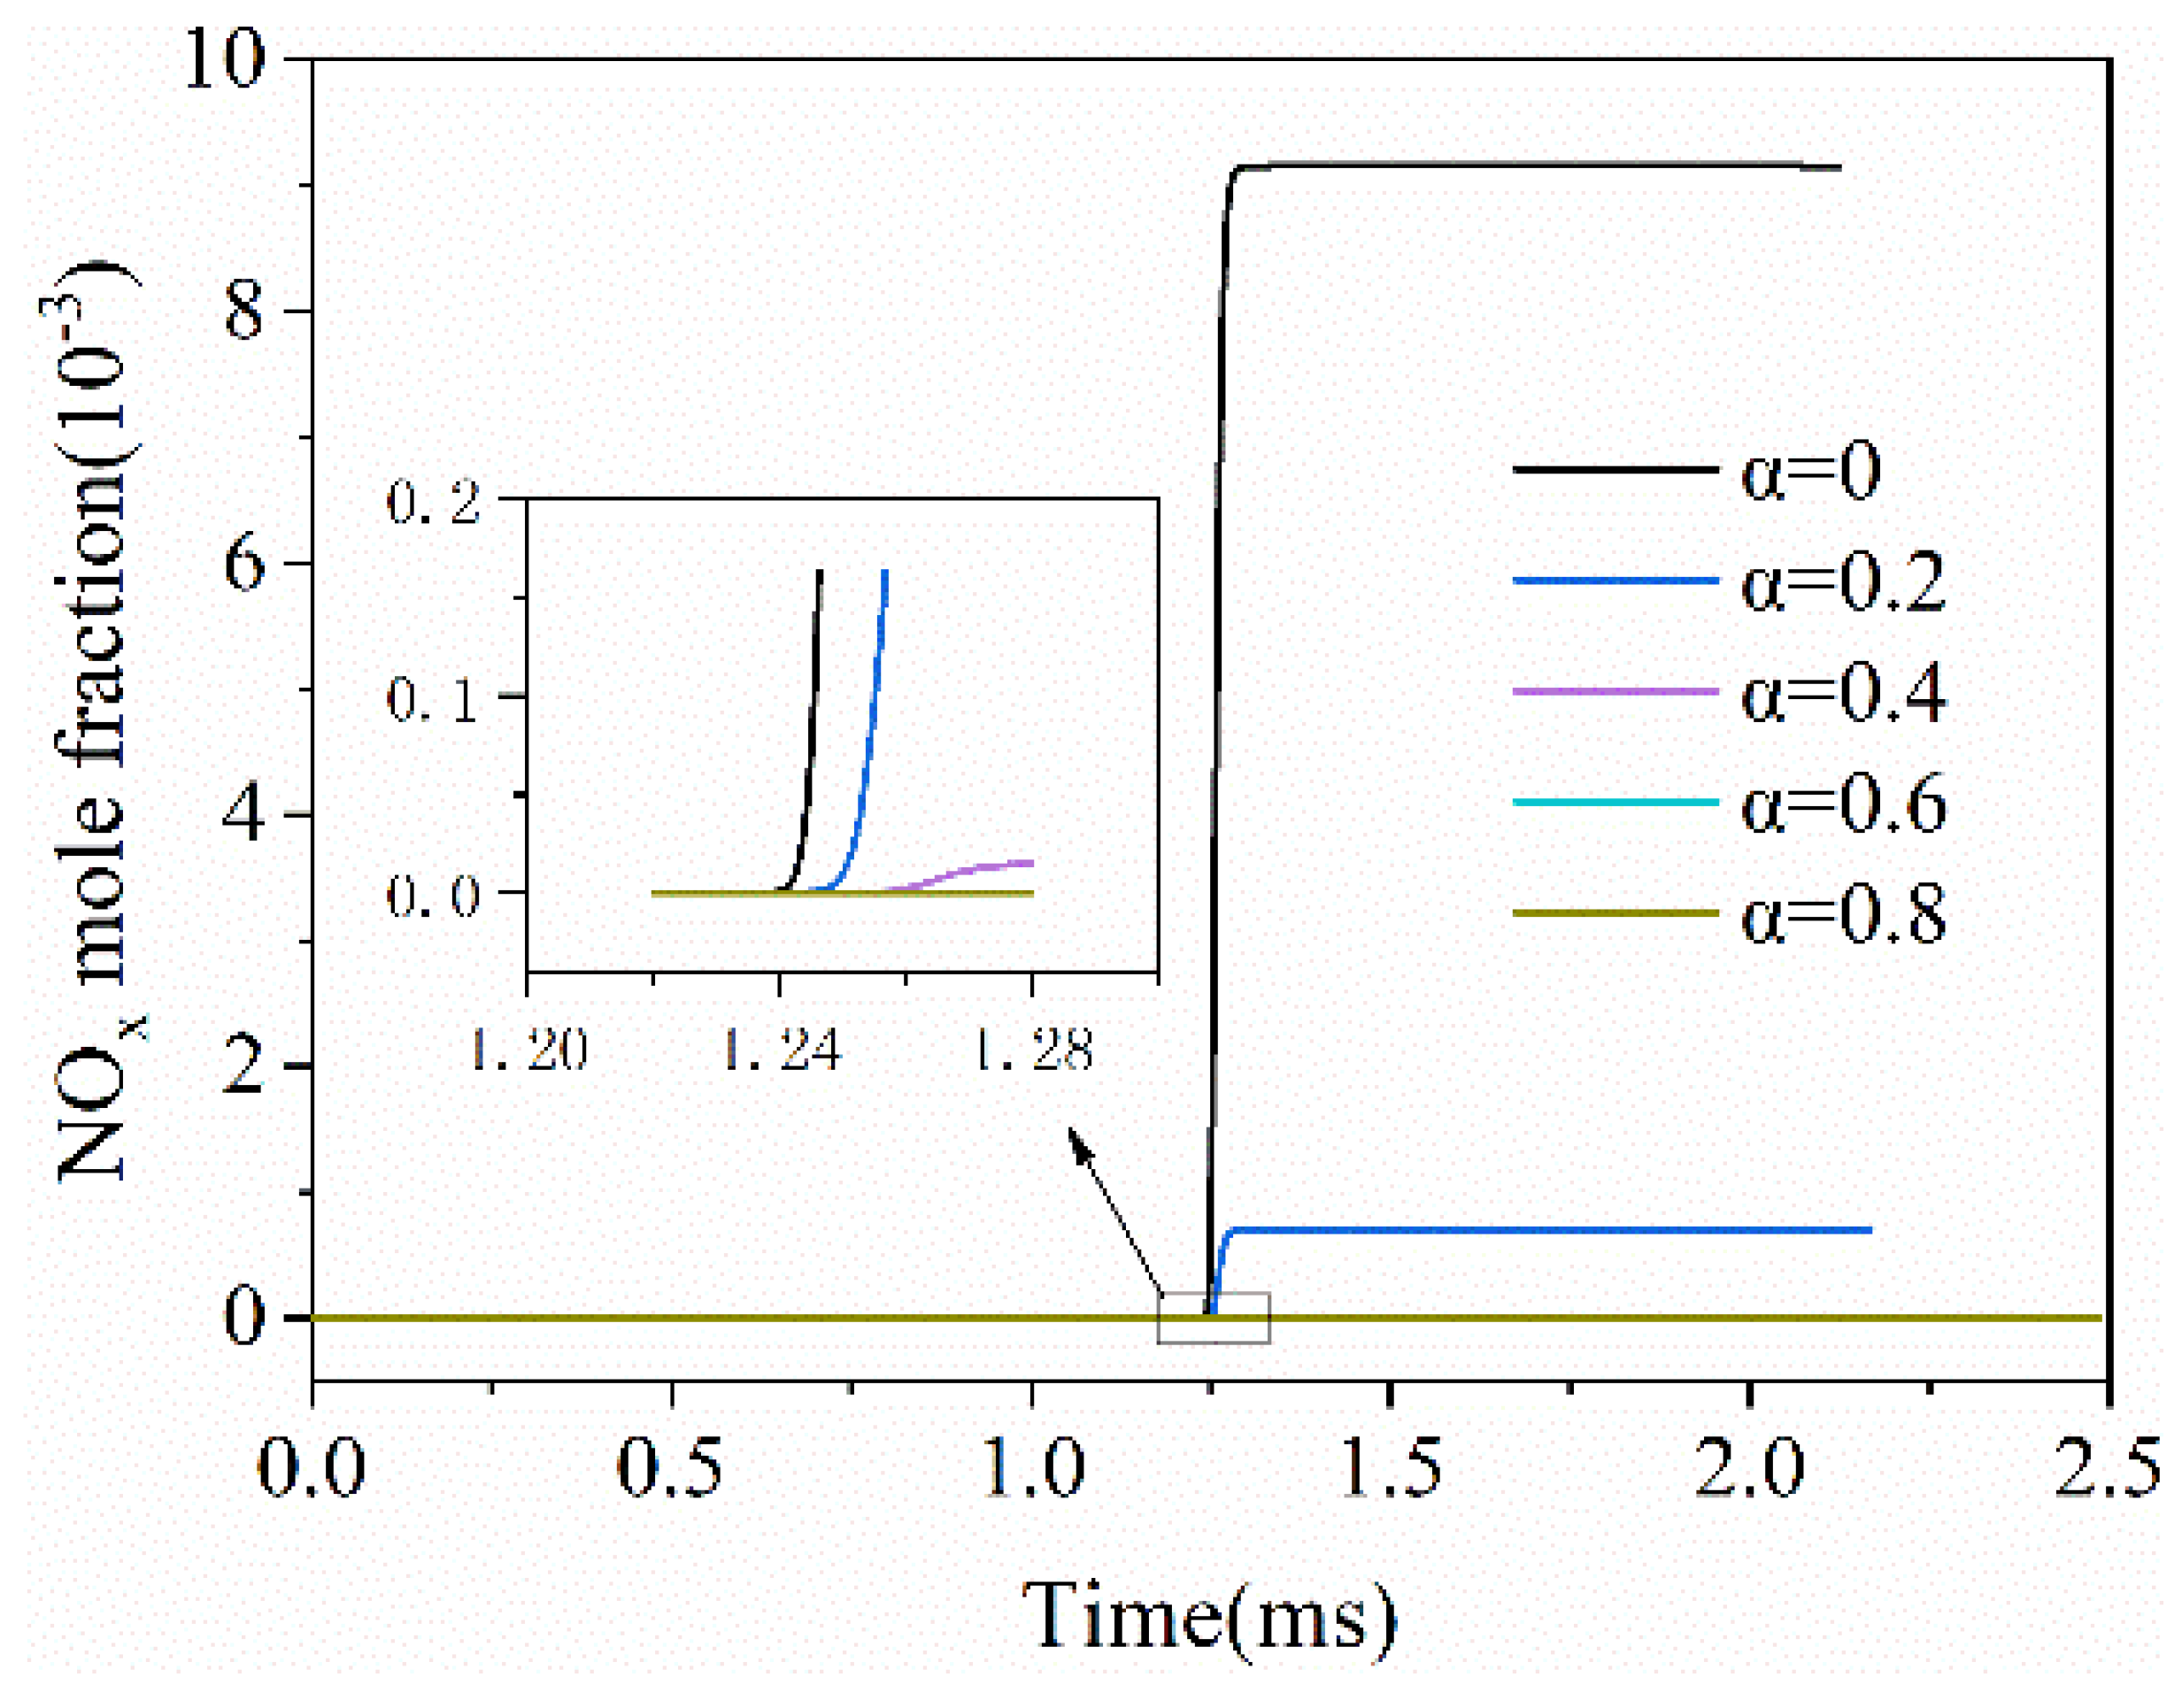
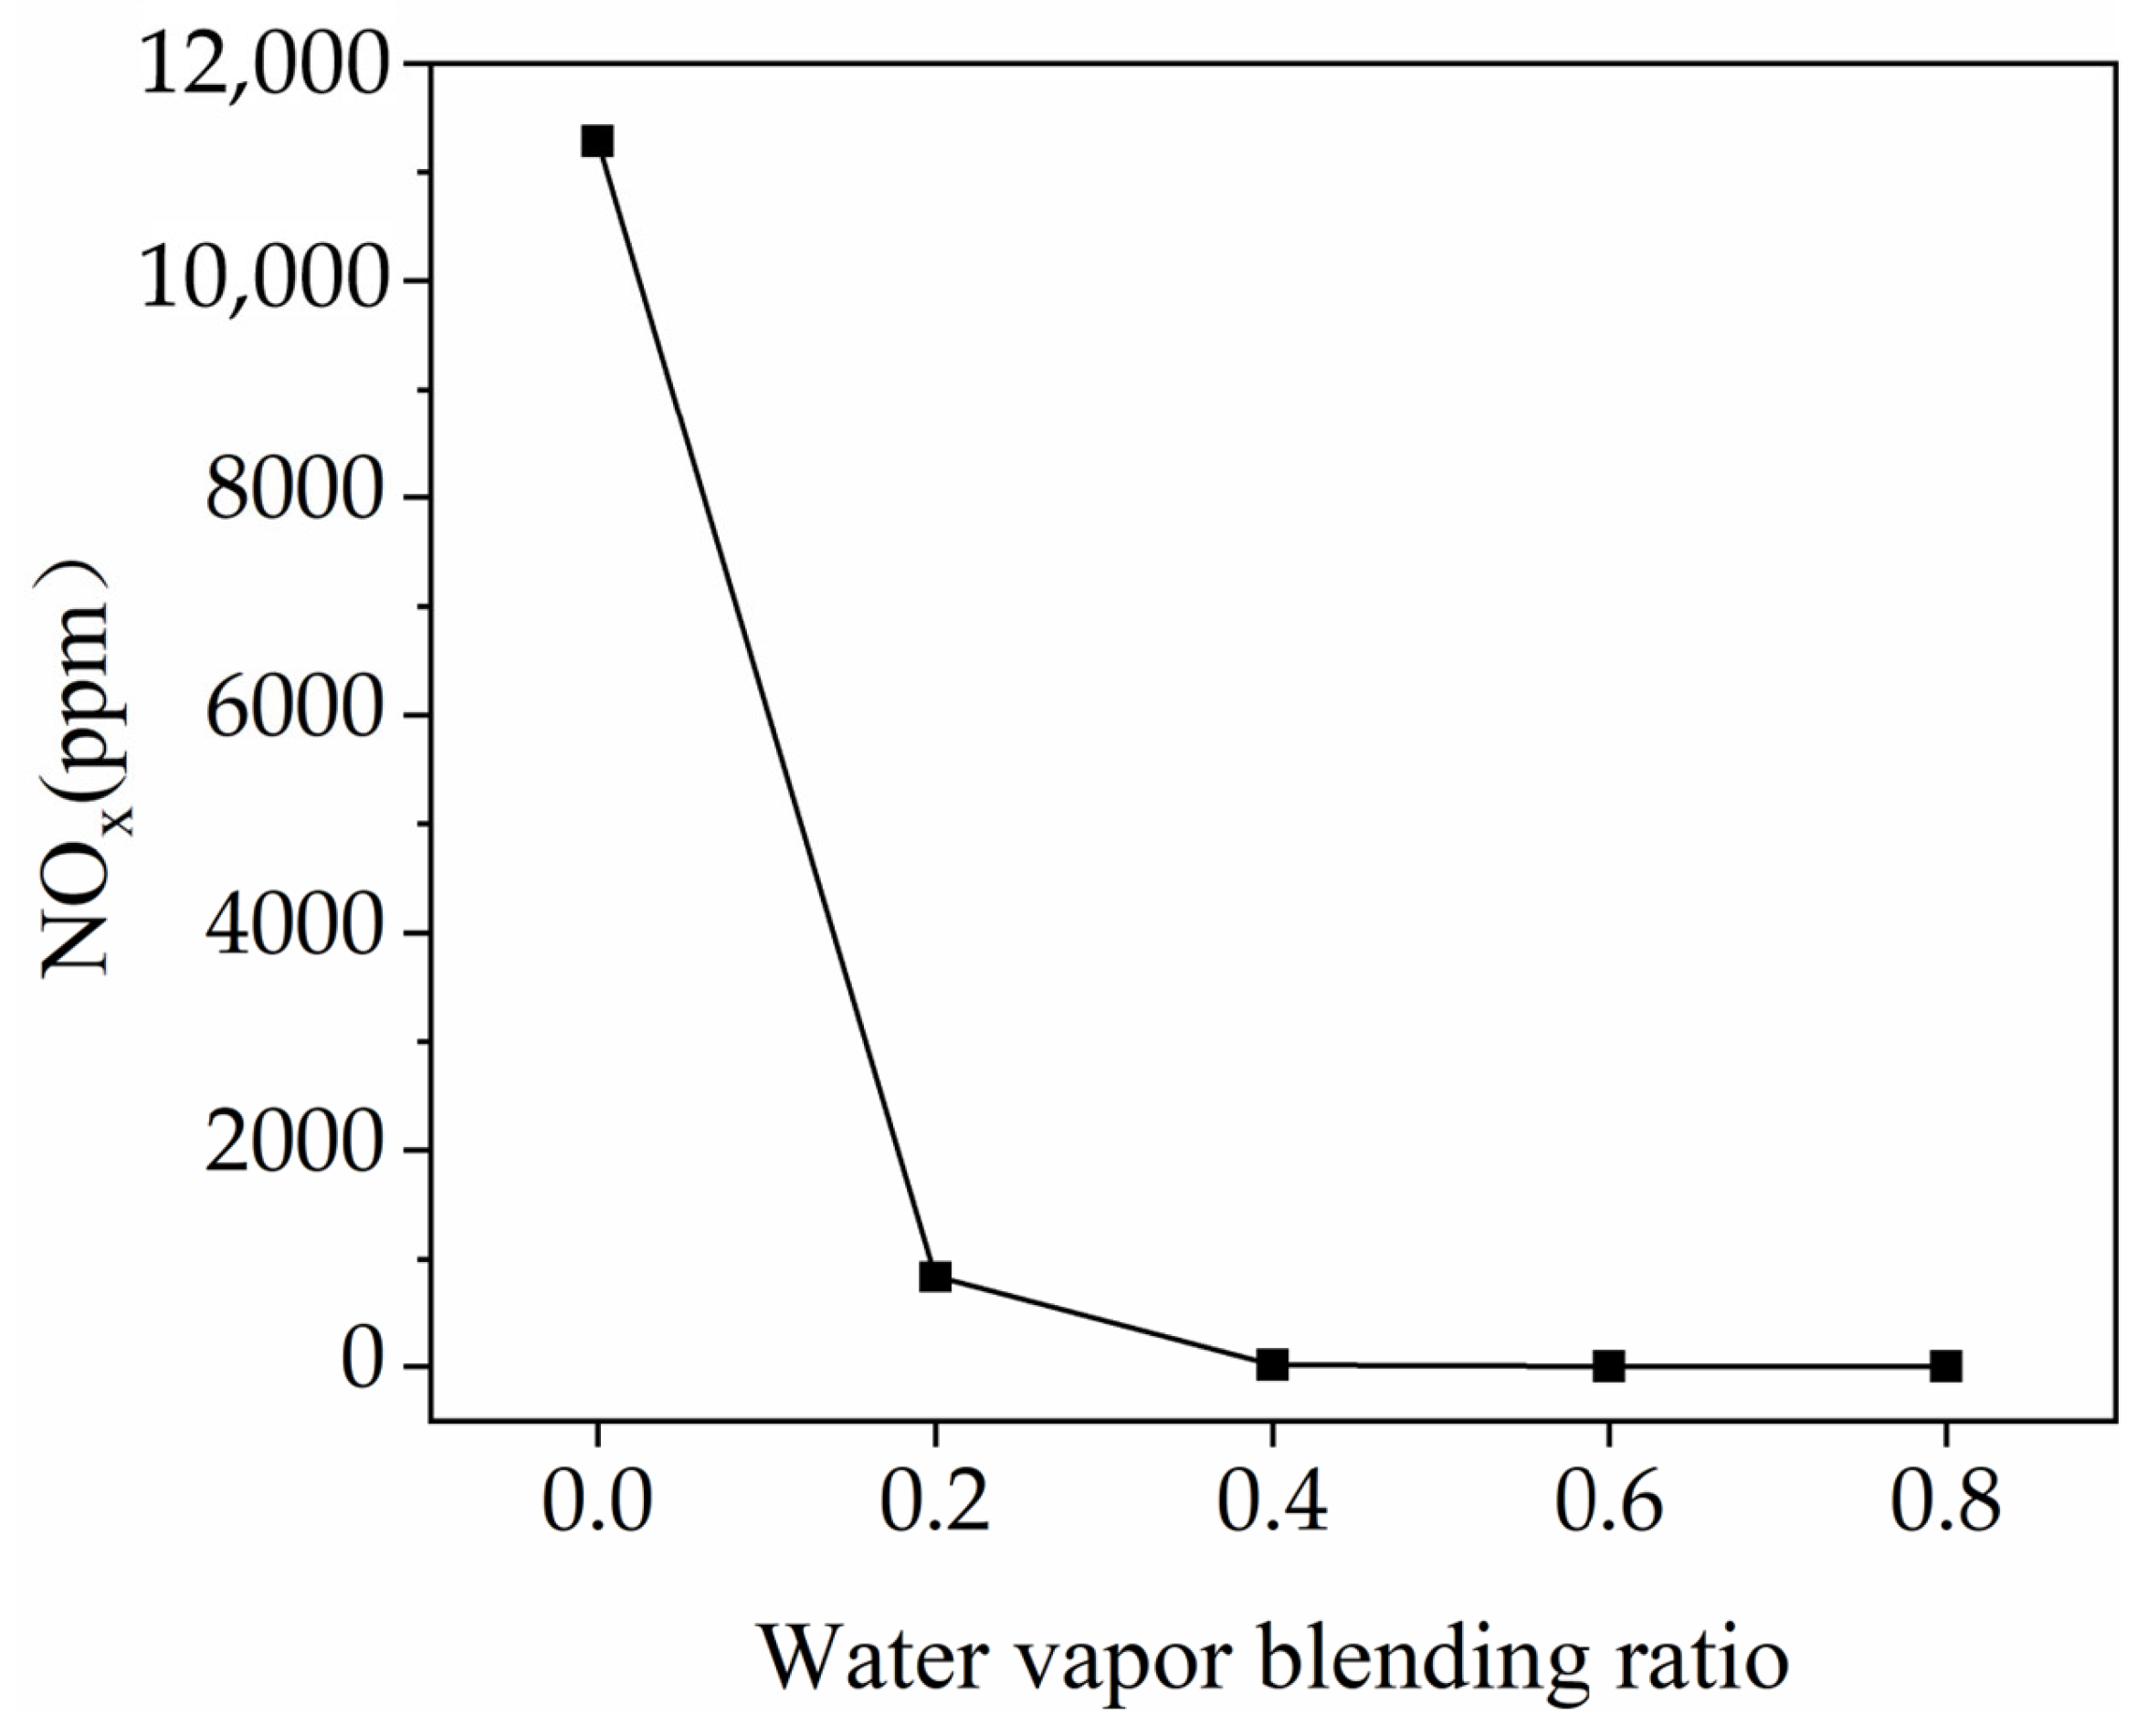
Figure 13 and Figure 14, respectively, show the variation curves of NOx mole fraction and NOx emissions under different α. Additionally, Table 4 is the impact of α on NOx formation conditions. It can be seen from the figures that, with the increase in α, NOx mole fraction and emission decrease rapidly. For example, NOx emissions decrease from 11,283 ppm to 830 ppm when α increases from 0 to 0.2, and about 93% of NOx emissions could be reduced. Furthermore, we can see from Figure 13 that the slope of the curve decreases with the increase in α, and the point at which NOx generations begins moves backward. Water vapor can effectively inhibit the formation and reaction rate of NOx during H2 combustion. It can be seen from Table 4 that α does not affect the concentration of O2, but the peak temperature and the high-temperature residence time reduce with the increase in α. Reducing the temperature can significantly inhibit the formation of thermal NOx [32], and reducing the residence time can shorten the reaction time of nitrogen [33]. These two factors work together to reduce the NOx emissions. The possible reason for this may be that the specific heat capacity of water vapor is much larger than that of air, so the air mixed with water vapor has a larger specific heat capacity and absorbs more heat during combustion, which can significantly reduce the combustion temperature in the combustion chamber. Additionally, because the concentration of H2 decreases, the energy released from combustion decreases with the increase in α, which also can reduce the combustion temperature. Moreover, because the ignition time delays and the energy released decreases with the increase in α, the time at which the combustion temperature reaches 1800 K becomes later, and the time at which the combustion temperature decreases to 1800 K is earlier. When α is 0.6 and 0.8, the peak temperature is 1836 K and 1386 K, and the high-temperature residence time is 0.01 ms and 0, respectively. Under these conditions, the NOx emissions are almost 0, because the temperature is so low and the time is so short that NOx is not able to be oxidized from N2.

3.6. The Analysis of the Effects of Water Vapor on Combustion Temperature

The effects of water vapor on combustion include physical effect and chemical effect, and the physical effect can be divided into dilution effect and thermal effect [34]. The dilution effect is defined as blending H2 with water vapor, reducing the concentration of H2. Since the thermodynamic properties of water vapor are different from those of air, the thermal effect refers to the change in the thermodynamic properties of the mixture gas after mixing with water vapor. The chemical effect means the direct participation of water vapor in chemical reactions and three-body reactions during H2 combustion. According to the dilution method proposed by Hu [27], when the diluent is N2, the thermal effect and the chemical effect can be ignored because N2 neither obviously changes the thermodynamic properties of the mixture gas nor participates in any reaction. Therefore, there is only a dilution effect when H2 is blended with N2. Thus, the temperature discrepancy caused by the dilution effect (Δt1) can be expressed as:
Δ t 1 = T H 2 T N 2
where TH2 is the maximum combustion temperature of pure H2, and TN2 is the maximum combustion temperature of the mixture of H2 and N2.
Secondly, to isolate the chemical effect of water vapor, a virtual component FH2O, which has the same thermodynamic and transport properties as water vapor and does not participate in any reaction, is created. When blending H2 with FH2O, there is a dilution effect and thermal effect. Thus, the temperature discrepancy caused by the thermal effect (Δt2) can be expressed as:
Δ t 2 = T N 2 T F H 2 O
where TFH2O is the maximum combustion temperature of the mixture of H2 and FH2O.
Finally, the temperature discrepancy caused by the chemical effect (Δt3) can be expressed as:
Δ t 3 = T F H 2 O T w v
where TWV is the maximum combustion temperature of the mixture of H2 and water vapor.
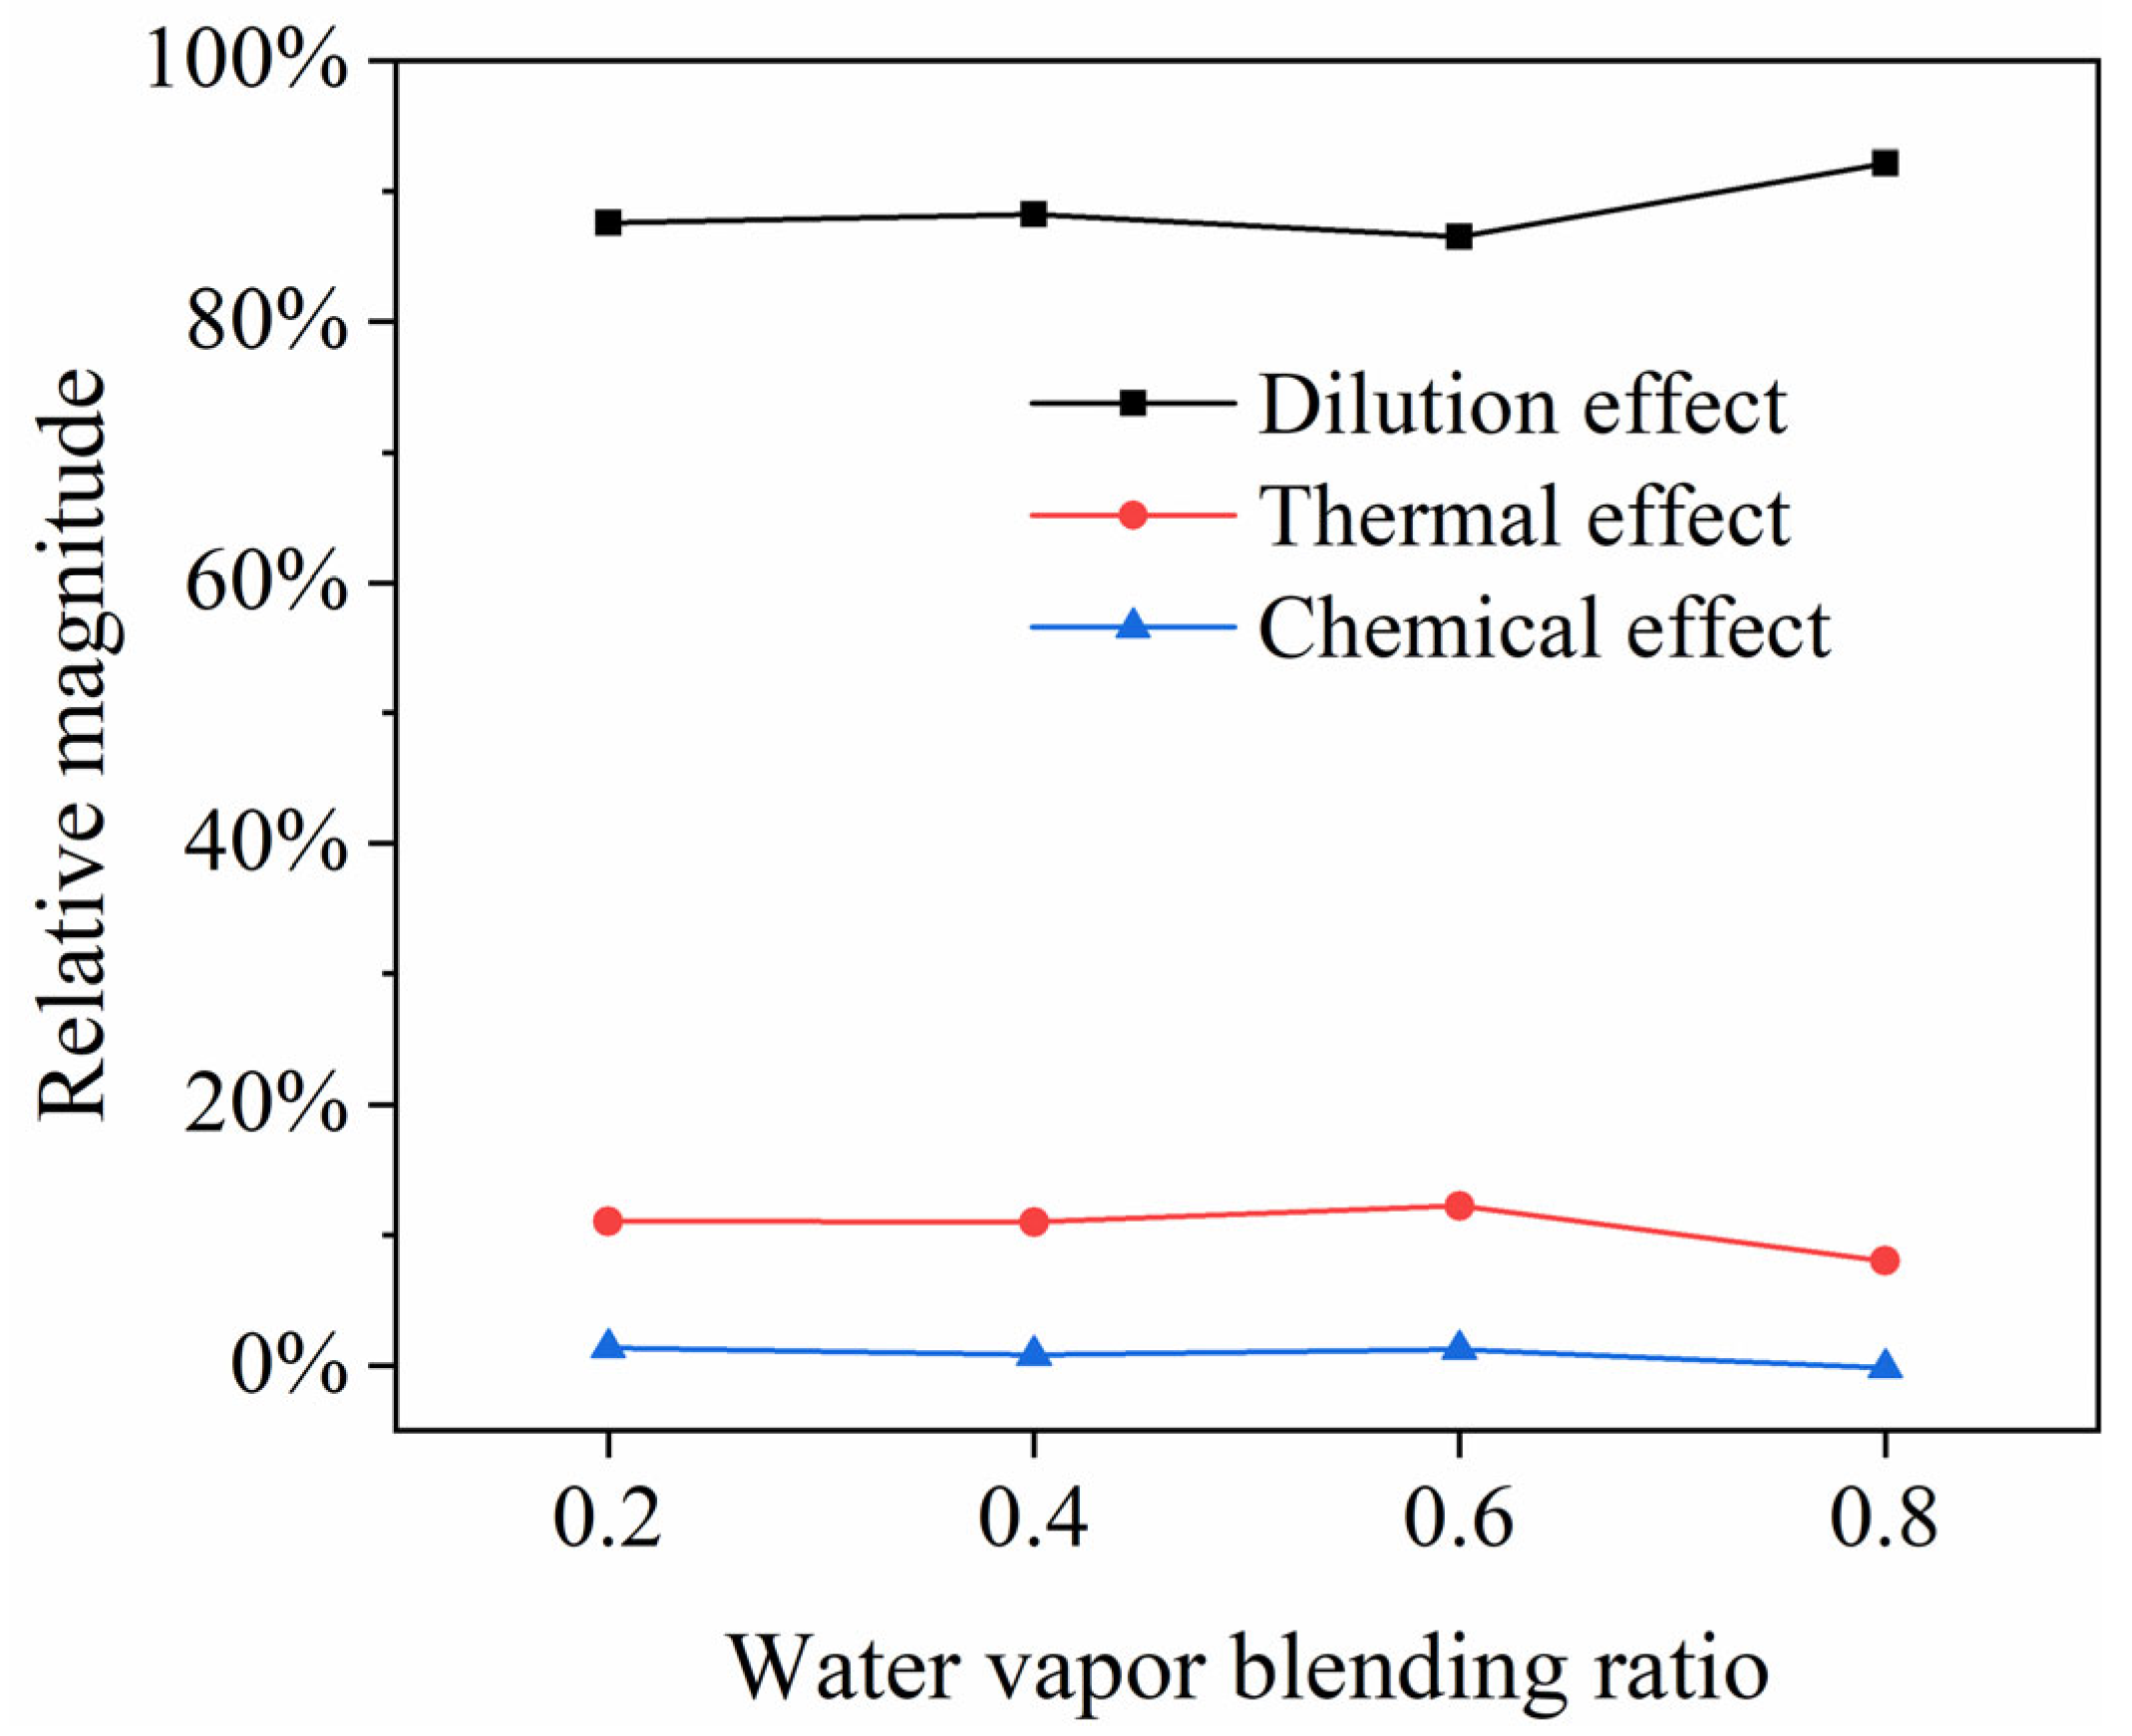
Figure 15 shows the different effects of water vapor on combustion temperature. As can be seen from the figure, the most significant effect which leads to a temperature reduction is the dilution effect, followed by the thermal effect, and the least significant is the chemical effect, because the dilution effect reduces the H2 concentration in the mixture, which directly reduces the heat release during combustion [35]. Similar results could be found in many pieces of research [34]. Figure 16 presents the relative magnitude of the effects of water vapor. It can be seen from the diagram that, when H2 is compressed to ignition fully, such as when α is 0, 0.2, 0.4, and 0.6, the relative magnitudes of the dilution effect, thermal effect, and chemical effect are about 87.4%, 11.4%, and 1.1%, respectively. However, when H2 does not burn fully, such as when α reaches 0.8, the dilution effect increases, while the thermal effect and the chemical effect decrease.

4. Conclusions

A numerical model of the micro-free-piston engine was set up to study the effects of water blending ratio on H2 HCCI combustion and emission characteristics, and the effects of water vapor on combustion temperature were analyzed. The main conclusions are listed as follows:
(1)
After blending H2 with water vapor, the ignition time of H2 HCCI delays, and the power output capacity of the micro-free-piston engine declines. With the increase in α, the combustion of the mixture gas continues to deteriorate. When α reaches 0.8, there is no obvious ignition in the combustion chamber.
(2)
The maximum temperature and pressure in the combustor decrease with the increase in α. The rate of pressure increase declines after blending H2 with water vapor, which is beneficial to alleviate detonation in the combustor.
(3)
Blending H2 with water vapor is an efficient means of reducing NOx emissions. When α increases from 0 to 0.2, NOx emissions decrease by 93%.
(4)
The dilution effect, thermal effect and chemical effect of water vapor can all reduce the combustion temperature. Among those three kinds of effects above, the dilution effect has the most significant impact on the reduction in the combustion temperature, accounting for about 87.4% of all effects, followed by the thermal effect and the chemical effect. When H2 does not burn fully in the combustion chamber, the dilution effect increases, while the thermal effect and chemistry effect decrease.
This paper mainly investigates the influence of the water blending ratio on combustion and emission characteristics of micro-H2 HCCI free piston engine and focuses on the changing trends and laws. Therefore, some specific working conditions are not taken into account, such as low and high operating conditions. In future research, it is necessary to figure out which water blending ratio is the optimum choice under different working conditions. Furthermore, due to the limited time, some important parameters, such as the equivalent ratio, the initial temperature and pressure of the mixture, are not considered in this paper. To further study this field, those parameters mentioned above should be employed to investigate the combustion and emission characteristics.

Author Contributions

Conceptualization, W.Y. and J.F.; Methodology, W.Y. and J.F.; Software, X.H. and J.F.; Formal analysis, X.H. and J.F. Resource, W.Y.; Data curation, X.H. and Y.M.; Writing—original draft preparation, X.H.; Writing—review and editing, W.Y. and J.F.; Visualization, G.L. and Q.H. All authors have read and agreed to the published version of the manuscript.

Funding

This research was funded by National Natural Science Foundation of China, grant number 52076141; Hunan Provincial Natural Science Foundation of China, grant number 2022JJ50025; Postgraduate Scientific Research Innovation Project of Hunan Province, grant number CX20211275; Shaoyang University Innovation Foundation for Postgraduate, grant number CX2021SY005.

Data Availability Statement

The data presented in this study are available on request from the corresponding author.

Conflicts of Interest

The authors declare no conflict of interest.

References

  1. Onishi, S.; Jo, S.H.; Shoda, K.; Jo, P.D.; Kato, S. Active Thermo-Atmosphere Combustion (ATAC)—A NEW Combustion Prosess for Internal Combustion Engines. SAE Int. 1979, 88, 1851–1860. [Google Scholar]
  2. Duan, X.; Lai, M.-C.; Jansons, M.; Guo, G.; Liu, J. A review of controlling strategies of the ignition timing and combustion phase in homogeneous charge compression ignition (HCCI) engine. Fuel 2021, 285, 119142. [Google Scholar] [CrossRef]
  3. Aichlmayr, H.T.; Kittelson, D.B.; Zachariah, M.R. Miniature free-piston homogeneous charge compression ignition engine-compressor concept—Part I: Performance estimation and design considerations unique to small dimensions. Chem. Eng. Sci. 2002, 57, 4161–4171. [Google Scholar] [CrossRef]
  4. Aichlmayr, H.T.; Kittelson, D.B.; Zachariah, M.R. Micro-HCCI combustion: Experimental characterization and development of a detailed chemical kinetic model with coupled piston motion. Combust. Flame 2003, 135, 227–248. [Google Scholar] [CrossRef]
  5. Zhou, Y.; Sofianopoulos, A.; Lawler, B.; Mamalis, S. Advanced combustion free-piston engines: A comprehensive review. Int. J Engine Res. 2020, 21, 1205–1230. [Google Scholar] [CrossRef] [Green Version]
  6. Bai, J.; Wang, Q.; He, Z.X.; Zhang, P.G. Influence of Piston Initial State on HCCI Combustion in Micro Free-Piston Engine Using Experiment Images and CFD Analysis. Adv. Mater. Res. 2013, 724–725, 1350–1354. [Google Scholar] [CrossRef]
  7. Wang, Q.; Xie, Q.; Bai, J.; Zhang, P.G.; Liu, Y.; Zhang, J.B. Effect of mixture initial conditions on HCCI combustion in micro combustion chamber. Chin. Intern. Combust. Engine Eng. 2014, 35, 18–24. [Google Scholar]
  8. Bai, J.; Wang, Q.; He, Z.; Li, C.; Pan, J. Study on methane HCCI combustion process of micro free-piston power device. Appl. Therm. Eng. 2014, 73, 1066–1075. [Google Scholar] [CrossRef]
  9. Yu, L.L.; Wang, Q.; Huang, R.; Zhao, Y.; Bai, J. Combustion Properties of Hydrogen-Enriched Methane in Micro-Power Plants. J. Henan Univ. Sci. Technol. 2019, 40, 30–36. [Google Scholar]
  10. Wang, Q.; Zhao, Y.; Wu, F.; Bai, J. Study on the combustion characteristics and ignition limits of the methane homogeneous charge compression ignition with hydrogen addition in micro-power devices. Fuel 2019, 236, 354–364. [Google Scholar] [CrossRef]
  11. Wang, Q.; Wu, F.; Zhao, Y.; Bai, J.; Huang, R. Study on combustion characteristics and ignition limits extending of micro free-piston engines. Energy 2019, 179, 805–814. [Google Scholar] [CrossRef]
  12. Mohammed, S.E.; Aziz, A.R.A.; Baharom, M.B.; Jaffry, A.; Ismael, M.A. Effect of aspect ratio on the performance characteristics of free piston linear generator engine fueled by hydrogen. Int. J. Hydrogen Energy 2021, 46, 10506–10517. [Google Scholar]
  13. Bai, J.; Sun, S.N.; Wang, Q. Numerical Simulation Study on the Influence of Intake and Exhaust Structure Parameters on Scavenging Process of Micro Free-Piston Engine. Chin. Intern. Combust. Engine Eng. 2021, 42, 42–51. [Google Scholar]
  14. Zhao, F.; Zhang, H.J. Analysis of Application Prospect for Hydrogen Combustion Engines. China Resour. Compr. Util. 2020, 38, 72–74. [Google Scholar]
  15. Xi, D.; Wang, Y.; Liu, J.Z.; Zhou, J.H. Current Status in the Study of the Humidified Combustion. J. Eng. Therm. Energy Power 2014, 29, 1–6+103. [Google Scholar]
  16. Du, G.; Wang, Z.; Wang, D.; Wang, X.; Fu, X. Study on the effect of water addition on combustion characteristics of a HCCI engine fueled with natural gas. Fuel 2020, 270, 117547. [Google Scholar] [CrossRef]
  17. Lu, H.B.; Yao, Q.H. Numerical Simulation of Hydrogen Engine Cylinder’s Combustion with Water Injection. Phys. Gases 2021, 6, 37–47. [Google Scholar]
  18. Dhyani, V.; Subramanian, K.A. Control of backfire and NOx emission reduction in a hydrogen fueled multi-cylinder spark ignition engine using cooled EGR and water injection strategies. Int. J. Hydrogen Energy 2019, 44, 6287–6298. [Google Scholar] [CrossRef]
  19. Xu, P.; Ji, C.; Wang, S.; Cong, X.; Ma, Z.; Tang, C.; Meng, H.; Shi, C. Effects of direct water injection on engine performance in a hydrogen (H2)-fueled engine at varied amounts of injected water and water injection timing. Int. J. Hydrogen Energy 2020, 45, 13523–13534. [Google Scholar] [CrossRef]
  20. Bai, J.; Wang, Q.; Xie, Q.; Zhang, P.G. Effect of leakage on working process of micro free-piston engine. J. Jiangsu Univ. 2014, 35, 14–19. [Google Scholar]
  21. Jiang, Y.; Qiu, R. Reduction and optimization of methane combustion mechanism based on PCAS and genetic algorithm. Fire Saf. Sci. 2014, 23, 41–49. [Google Scholar]
  22. Ó Conaire, M.; Curran, H.J.; Simmie, J.M.; Pitz, W.J.; Westbrook, C.K. A comprehensive modeling study of hydrogen oxidation. Int. J. Chem. Kinet. 2004, 36, 603–622. [Google Scholar] [CrossRef]
  23. Curran, H.J.; Gaffuri, P.; Pitz, W.J.; Westbrook, C.K. A Comprehensive Modeling Study of n-Heptane Oxidation. Combust. Flame 1998, 114, 149–177. [Google Scholar] [CrossRef]
  24. Xie, Y.; Wang, J.; Xu, N.; Yu, S.; Zhang, M.; Huang, Z. Thermal and Chemical Effects of Water Addition on Laminar Burning Velocity of Syngas. Energy Fuels 2014, 28, 3391–3398. [Google Scholar] [CrossRef]
  25. Xie, Y.; Wang, J.; Xu, N.; Yu, S.; Huang, Z. Comparative study on the effect of CO2 and H2O dilution on laminar burning characteristics of CO/H2/air mixtures. Int. J. Hydrogen Energy 2014, 39, 3450–3458. [Google Scholar] [CrossRef]
  26. Xu, P.; Ji, C.; Wang, S.; Cong, X.; Ma, Z.; Tang, C.; Meng, H.; Shi, C. Effects of direct water injection on engine performance in engine fueled with hydrogen at varied excess air ratios and spark timing. Fuel 2020, 269, 117209. [Google Scholar] [CrossRef]
  27. Hu, E.; Jiang, X.; Huang, Z.; Iida, N. Numerical Study on the Effects of Diluents on the Laminar Burning Velocity of Methane–Air Mixtures. Energy Fuels 2012, 26, 4242–4252. [Google Scholar] [CrossRef]
  28. Zhao, Y.; Wang, Q.; Wu, F.; Bai, J. Effect of the Blending Ratio of CO2 on Combustion Characteristics of Methane Homogeneous Charge Compression Ignition. Trans. CSICE 2019, 37, 385–392. [Google Scholar] [CrossRef]
  29. Wang, L.; Yang, Z.; Huang, Y.; Liu, D.; Duan, J.; Guo, S.; Qin, Z. The effect of hydrogen injection parameters on the quality of hydrogen–air mixture formation for a PFI hydrogen internal combustion engine. Int. J. Hydrogen Energy 2017, 42, 23832–23845. [Google Scholar] [CrossRef]
  30. Sun, X.; Liu, H.; Duan, X.; Guo, H.; Li, Y.; Qiao, J.; Liu, Q.; Liu, J. Effect of hydrogen enrichment on the flame propagation, emissions formation and energy balance of the natural gas spark ignition engine. Fuel 2022, 307, 121843. [Google Scholar] [CrossRef]
  31. Soloiu, V.; Duggan, M.; Harp, S.; Vlcek, B.; Williams, D. PFI (port fuel injection) of n-butanol and direct injection of biodiesel to attain LTC (low-temperature combustion) for low-emissions idling in a compression engine. Energy 2013, 52, 143–154. [Google Scholar] [CrossRef]
  32. Veza, I.; Irianto; Tuan Hoang, A.; Yusuf, A.A.; Herawan, S.G.; Soudagar, M.E.M.; Samuel, O.D.; Said, M.F.M.; Silitonga, A.S. Effects of Acetone-Butanol-Ethanol (ABE) addition on HCCI-DI engine performance, combustion and emission. Fuel 2023, 333, 126377. [Google Scholar] [CrossRef]
  33. Wang, G.; Guiberti, T.F.; Cardona, S.; Jimenez, C.A.; Roberts, W.L. Effects of residence time on the NOx emissions of premixed ammonia-methane-air swirling flames at elevated pressure. Proc. Combust. Inst. 2022, in press. [Google Scholar] [CrossRef]
  34. Yu, Z.Y.; Ment, S.; Qian, Y.J.; Tang, F.; Bian, S.; Zhuang, Y. Effects of different initial temperature and water vapor dilution ratios on laminar flame characteristics of ethanol/isooctane mixture. Chin. Intern. Combust. Engine Eng. 2021, 42, 16–23. [Google Scholar]
  35. Wang, S.; Zhai, Y.; Wang, Z.; Hou, R.; Zhang, T.; Ji, C. Comparison of air and EGR with different water fractions dilutions on the combustion of hydrogen-air mixtures. Fuel 2022, 324, 124686. [Google Scholar] [CrossRef]
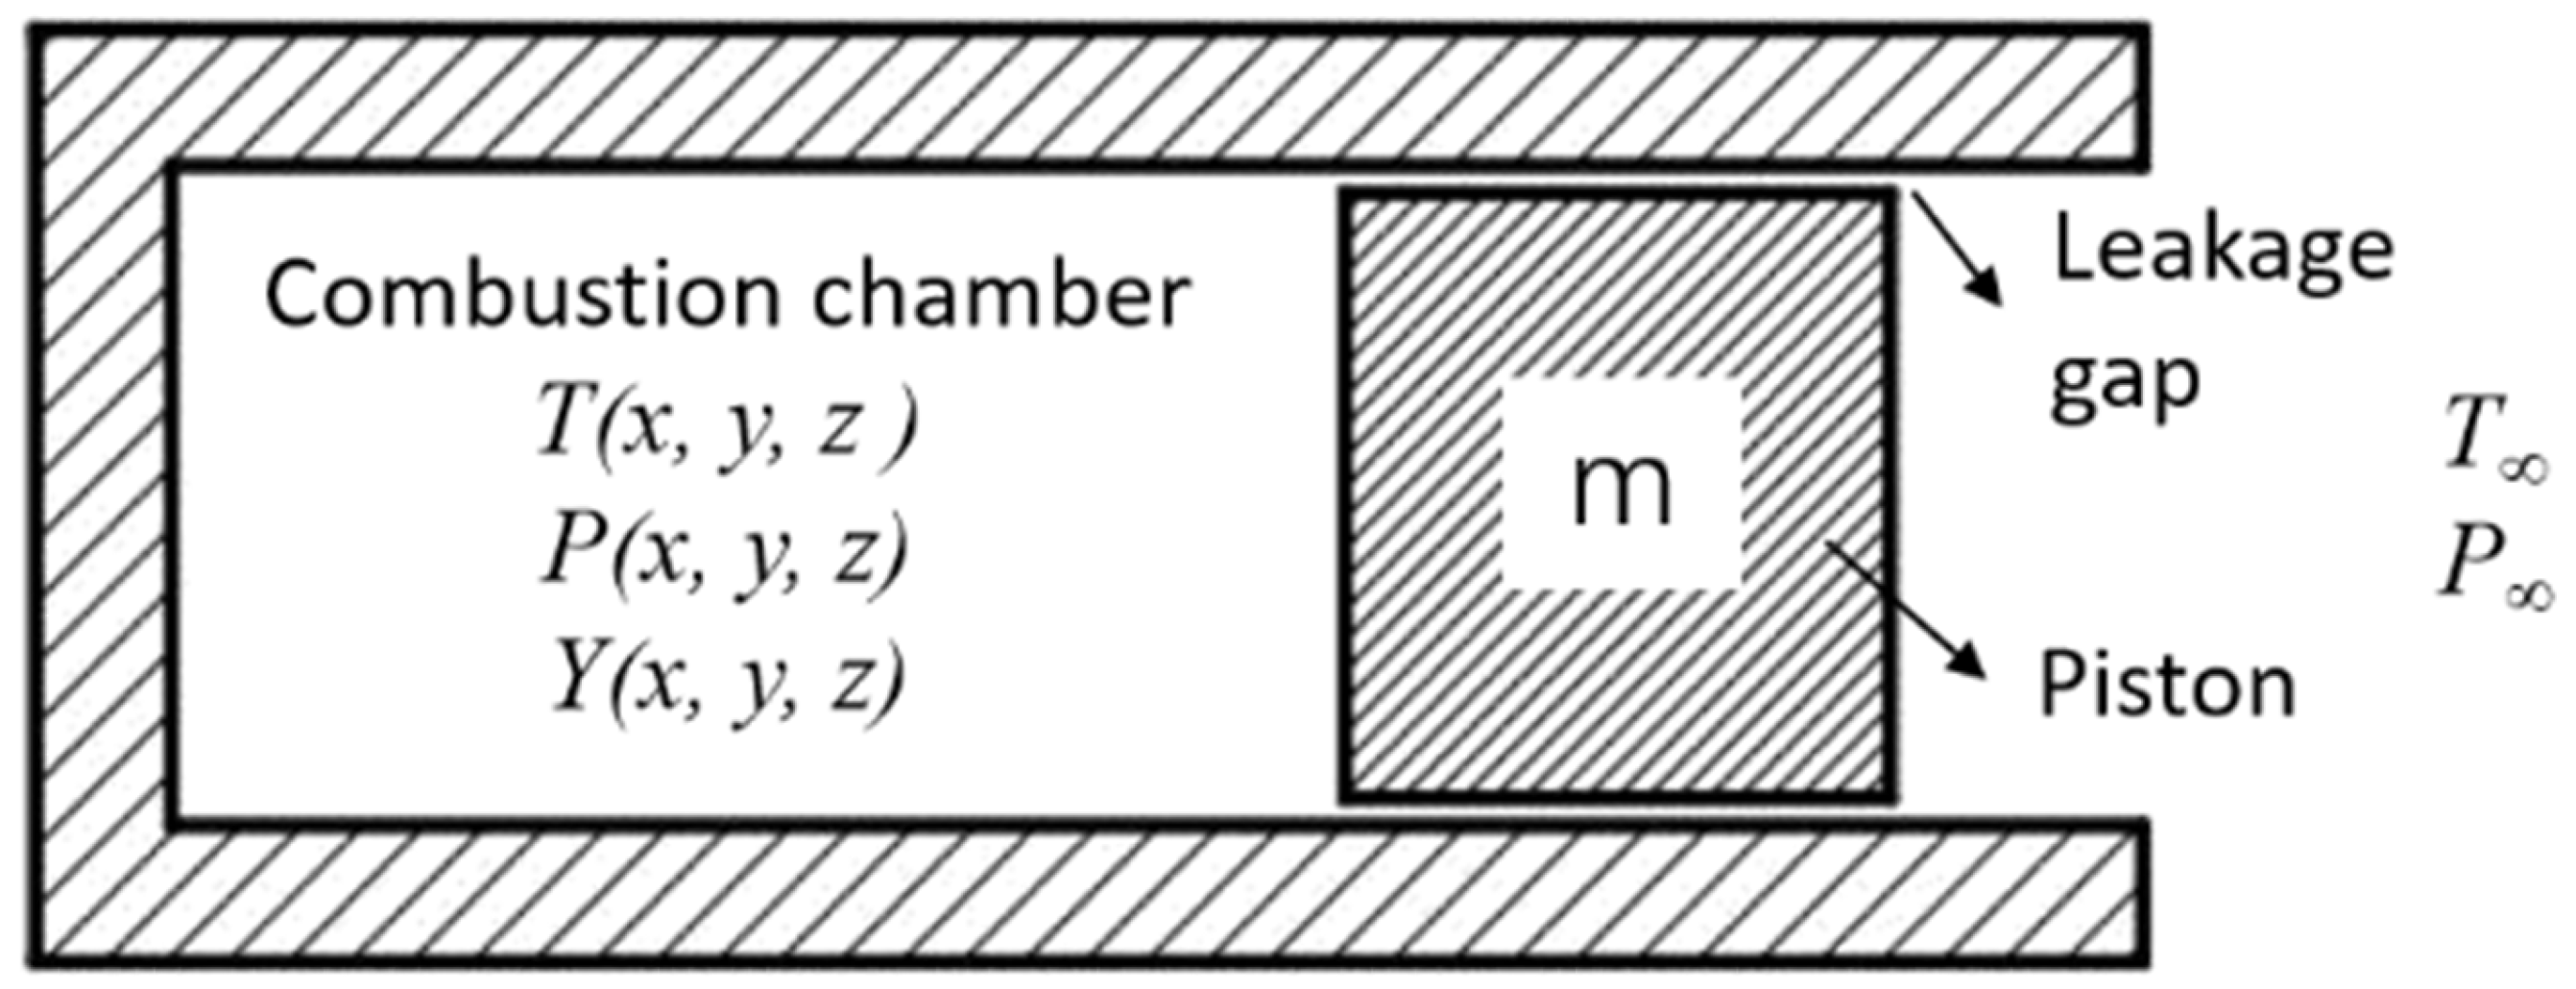
Figure 1. Physical model of micro-HCCI free-piston engine.
Energies 15 09055 g001
Figure 2. Grid of the micro-HCCI free-piston engine.
Energies 15 09055 g002
Figure 3. Schematic of the experimental system [8].
Energies 15 09055 g003
Figure 4. Comparison of the simulation results and the experiment results: (a) Curves of piston displacement [8]; (b) simulation curves of piston displacement.
Energies 15 09055 g004
Figure 5. Variation curves of the mole fraction of H2 under different α.
Energies 15 09055 g005
Figure 6. Variation curves of the mole fraction H2O2 under different α.
Energies 15 09055 g006
Figure 7. Variation curves of combustion temperature under different α.
Energies 15 09055 g007
Figure 8. Variation curves of combustion pressure under different α.
Energies 15 09055 g008
Figure 9. Variation curves of the piston velocity under different α.
Energies 15 09055 g009
Figure 10. Variation curves of the piston displacement under different α.
Energies 15 09055 g010
Figure 11. P-V diagram of the micro free-piston engine under different α.
Energies 15 09055 g011
Figure 12. IMEP of the micro-free-piston engine under different α.
Energies 15 09055 g012
Figure 13. Variation curves of NOx mole fraction under different α.
Energies 15 09055 g013
Figure 14. The variation curve NOx emissions under different α.
Energies 15 09055 g014
Figure 15. Effects of water vapor on combustion temperature.
Energies 15 09055 g015
Figure 16. The relative magnitude of effects of water vapor.
Energies 15 09055 g016
Table 1. The mesh information and the calculation results.
Nodes of the Length DirectionNodes of the Width DirectionNumber of GridsPeak
Temperature
(K)
Peak Pressure (MPa)
801511062815.38 67.70
2015012815.97 68.22
2518962814.16 68.24
1001513862815.84 67.77
2018812816.02 68.24
2523762814.77 68.42
1201516662815.66 67.82
2022612816.74 68.20
2528562814.63 68.62
Table 2. The settings of the initial simulation conditions.
ParametersValue
Length of combustor (mm)35
Diameter of the piston (mm)3
Leakage clearance (μm)5
Mass of piston (g)1
Initial velocity of the piston (m/s)30
Initial temperature of mixture gas (K)300
Initial pressure in the cylinder (MPa)0.1
GasMethane
Equivalent ratio0.5
Temperature of walls (K)300
Table 3. Numerical simulation conditions and solver settings.
ParametersValue
Length of combustor (mm)20
Diameter of the piston (mm)3
Mass of piston (g)1
Initial velocity of the piston (m/s)17
Initial temperature of mixture gas (K)300
Initial pressure in combustor (Pa)10, 1325
GasH2
Equivalent ratio0.5
Temperature of walls (K)300
α0, 0.2, 0.4, 0.6, 0.8
Turbulence modelRNG κ-ε model
Reaction modelEDC model
Spatial discretizationSecond-order upwind scheme
AlgorithmPISO
Table 4. The impact of α on NOx formation conditions.
αPeak
Temperature (K)
O2 Mole
Fraction before Combustion
Residence Time above 1800 K (ms)NOx Mole Fraction
(10−3)
NOx (ppm)
02806.920.170.129.1511,283.79
0.22511.460.170.080.67793.65
0.42200.110.170.050.0217.22
0.61835.680.170.010.000.05
0.81386.220.170.000.000.00
Publisher’s Note: MDPI stays neutral with regard to jurisdictional claims in published maps and institutional affiliations.