Article

Experimental and Prenemilary Numerical Evaluation of Pressure Drops under the Conditions of the Stratified Gas-Liquid Flow in a Horizontal Pipe Filled with Metal Foam

by
Jerzy Hapanowicz
1,*,
Adriana Szydłowska
1 and
Jacek Wydrych
2
1
Department of Process and Environmental Engineering, Faculty of Mechanical Engineering, Opole University of Technology, St. Mikołajczyka 5, 45-271 Opole, Poland
2
Department of Thermal Engineering and Industrial Facilities, Faculty of Mechanical Engineering, Opole University of Technology, St. Mikołajczyka 5, 45-271 Opole, Poland
*
Author to whom correspondence should be addressed.
Energies 2022, 15(23), 9068; https://doi.org/10.3390/en15239068
Submission received: 3 November 2022 / Revised: 18 November 2022 / Accepted: 28 November 2022 / Published: 30 November 2022

Abstract

:
The paper reports the results of experimental tests and numerical simulations related to the pressure drop during two-phase air-water mixture flow through a pipe containing metal foam packing. Aluminium foam with 40 PPI open cells was used in the tests. A horizontal pipe with an internal diameter of 10 mm was used, and the foam only occupied a section of the pipe length equal to 240 mm. In the section of the pipe upwards of the foam, stratified flow pattern was generated, i.e., the most characteristic type for the gas-liquid flow. The results of the experimental research were compared with the values derived on the basis of the empirical method, which was developed for several different metal foams and two-phase systems. The values derived from measurements and calculations were subsequently applied to validate one numerical simulation method that is known to be particularly applicable for two-phase gas-liquid flow through metal foams. As a final result, the phenomena resulting from the presence of foam in the stratified flow through a gas-liquid system, the deficiencies of the methods applied in calculating pressure drops and modeling their values in accordance with the adopted numerical procedure were indicated. All research and modelling were carried out with the purpose of testing the potential of metal foam use in pipes dedicated to heat exchanger design, particularly ones intended to improve energy efficiency.

1. Introduction

According to the definition given by Evans et al. [1], open-cell metal foams constitute a type of multi-purpose porous media. Their internal structure results from the liquefaction, foaming, and solidification of the metal structure. According to the terminology adopted by de Schampheleire et al. [2], several characteristic components can be identified in the foam skeleton. The skeleton of the material is made of fine struts. Their individual ends are combined forming the so-called nodes. The free space in the skeleton consists of open cells that are combined with one another. The places where such connections occur are called pores, although they are actually represented by “windows” on the cell walls. It is through them that the flow of fluids between cells is possible, and thus through the entire foam structure.
Metal foams are characterized by a very high porosity (over 90%) and a considerable specific surface area. Despite low density, they demonstrate adequate mechanical properties. A typical metal used in the production of foams is aluminum, which makes the thermal conductivity of such porous material relatively high (Paek et al. [3]).
As a result of the special characteristics of metal foams, attempts have been made over time to use them in various fields of technology, as reported in a study by Banhart in [4]. One of them aims at heat transfer enhancement, in terms of the performance of heat transfer, through the surfaces that separate the fluids in process apparatus. In heat exchangers, metal foams can then be applied as tube packing (Tadrist et al. [5], Zhu et al. [6]) or the space between the plates (Abadi et al. [7]). Alternatively, solutions based on the use of a foam layer applied to develop the outer surface of the pipe are also proposed (Hooman et al. [8]). In such a case, it acts as a specific rib.
Based on the study by Abagi et al. [9] and Ji et al. [10], we can conclude that the existence of metal foams in pipes leads to the enhancement of heat transfer in the exchanger. However, for a full assessment of performance in terms of heat exchange, it is also necessary to take into account the energy expenditure related to pumping substances that are applied for heat transfer. The presence of foam inside the pipe can greatly increase the resistance of the fluid to flow. The measure of the energy efficiency of the EE exchanger is the relationship between the thermal power of the PQ apparatus and the power of the pumping device’s PCF fluids, required for its adequate operation.
E E = P Q P C F .
We can note that the purpose of heat exchanger optimization calculations involves the search for a maximum value of the Function (1). Thus, the excessive demand for power necessary to pump fluids, can counteract the increase in the heat output of the apparatus, achieved by the use of metal foam.
Bearing the above considerations in mind, research was undertaken with the purpose of developing methods designed to predict the resistance to the flow of substances through metal foams. Regarding monophasic fluids, it is worth mentioning the relatively new publications by Bağcı and Dukhan [11], Kouidri and Madani [12] or Wang and Guo [13]. Their authors unanimously indicate that the foam permeability, and the effect of the Reynolds number on single-phase pressure drops through a specific metal foam, are not constant, as they are relative to the flow velocity and to the properties of a specific substance. For this reason, the empirical equations that describe the hydrodynamics of fluid flow through metal foams should not be used at velocities beyond the range in which the experiments necessary for their development were carried out.
Heat exchange between the pipe wall and the substance flowing in it also occurs in the conditions characterized by the two-phase flow. The typical examples include processes taking place in condensers and evaporators of refrigeration equipment. It turns out that in relation to this group of process apparatuses, attempts have been made to use metal foams as elements enhancing heat transfer. The results of research in this area is presented, for example, in two papers by Hu et al. [14,15].
The focus areas discussed in publications related to the assessment of two-phase flow hydrodynamics in metal foam are considerably varied. In addition to presenting the results of flow resistance measurements (Ji and Xu [16]), they also describe changes in two-phase structures (Zhu et al. [17], Tourvieille et al. [18]), and attempt to link the course of the observed phenomena with the foam microstructure in detail, and with the surface condition of its microfiber (Lai et al. [19]). However, two main statements are common in the majority of the works mentioned above, as well as a number of others that relate to this area.
The first statement relates to the need to conduct well-planned, tedious and often costly experimental research. The study of two-phase flow through metal foams requires design and building of a dedicated measuring setup and its equipment with systems enabling the measurement of several parameters at the same time. Sometimes it is even desirable to physically observe the conditions that occur in the middle of the channel. It is extremely difficult because the presence of foam prevents direct observation of the substance flow.
The second common thing in these publications is that in every case, their authors emphasize the individual nature of the research results that are presented, as well as indicate the limited scope of application of the computational methods developed on their basis. This fact poses considerable difficulties in the process of engineering design of actual technical objects. In practice, the designer should have access to the methods developed for the considered foam. Moreover, such methods need to be validated within the required range of flow parameters dedicated to specific substances. This fact imposes the need to conduct experiments, i.e., laboratory work outside the area of typical engineering activities. In such a case, numerical simulation techniques can serve as potential assistance.
A variety of approaches to numerical simulation of substance flow through metal foams, and thus calculate the flow resistance are proposed in the literature in this area. The principal differences involve the methods adopted for modeling the internal structure of the open-cell foam. Wu et al. [20] and Bai and Chung [21] simulated a single-phase flow through a metal foam with a model structure consisting of Kelvin cells. In contrast, in the study reported by Nie et al. [22], the complexity of the foam structure was derived on the basis of tessellation of the Laguerre-Voronoi 3D model. In other studies, such as those by Diani et al. [23,24], the actual foam pattern gained by the application of the tomographic technique is further utilized in simulations.
Successful results of numerical calculations in laminar flow conditions were reported in the work of Ambrosio et al. [25]. In another paper by Nie et al. [22], it is demonstrated that the k-ε turbulence model is capable of suitably representing hydrodynamic phenomena, in the case of a single-phase flow with a low degree of turbulence, and in the conditions of flow recirculation and the separation of the fluid flux from the surface with significant curvatures. Such conditions may occur in the vicinity of the fibers of the foam skeleton. In turn, the k-ε model was successfully utilized by Wu et al. [20] in simulations of air flow through ceramic foams.
A methodology for conducting numerical testing of two-phase gas-liquid flow in a horizontal pipe with metal foam packing was proposed in Nie et al. [22]. The Eulerian–Lagrangian model was utilized to describe the interfacial interactions, assuming that this model is most suitable for systems with a low liquid void fraction, and that the trajectory and patterns of its dispersed droplets can be tracked successfully. However, these conditions correspond to the dispersion or fog patterns during gas-liquid two-phase flow. As we know, it is formed in the conditions of considerable gas phase flow velocity combined with a low liquid fraction. So far, however, there is a lack of studies based either on experiments or modeling of two-phase flow in a pipe with packing foam in the area of formation of other two-phase structures.
Stratified flow is of particular interest in this area. In this case, the heat transfer of the two-phase substance at the interface with the pipe wall does not assume considerable values, because both phases take the form of laminar flow and they do not mix. Therefore, in such a case, it is feasible to apply foam packing in the pipe, as it will generate the mixing of the fluids, increase the level of turbulence, and additionally act as an internal rib. Compared to an empty pipe, however, the presence of foam packing significantly leads to an increase of the pressure drop of the two-phase mixture. This paper presents the results of experimental studies on this issue, and an attempt was made to simulate the stratified flow of a two-phase gas-liquid system in a horizontal pipe with metal foam packing.
The latter part of the work contains the characteristics of the foam applied in the study and the description of the experimental setup, along with the justification of the adopted range of variations in gas and liquid flow rates. The conditions for conducting numerical calculations and the adopted method of modeling the internal structure of the foam are also described. The measured flow resistances are presented in comparison with the calculated values, which were obtained based on an extensive procedure proposed by other researchers. Then, the measured and calculated flow resistances were compared with the numerically obtained values, indicating the inadequacies of the adopted model. The work ends with conclusions and a short commentary regarding each of them.

2. Experimental Set-Up

2.1. Metal Foam

Open-cell metal foam made of Al6101 aluminium alloy was used as packing inside a specific section of the pipe. It was a standard GoodFellow® (Goodfellow Corporation, Pittsburgh, PA, USA) foam with a pore density of 40PPI. As a commercial product, it was in the form of a plate with a thickness of 30 mm. A series of cylindrical elements were cut from it with the EDM method (Electrical Discharge Method). The diameters of the individual cylinders made it possible to install them tightly inside the copper flow pipe. The actual photos with the foam cylinders and the manner to illustrate how they are embedded in the pipe are shown in Figure 1.
Pore packing per inch (PPI) forms a parameter that is commonly applied by metal foam manufacturers to describe its structure. However, for the analysis of flow phenomena occurring in the foam, and specifically for modeling its skeleton, the knowledge of the PPI value is insufficient. Additionally, it turns out that depending on the method and the type of metal that was used in the production, foams with the same PPI value may differ greatly in porosity, pore diameters, and cell dimensions. Detailed data regarding the internal structure of the foam used in the authors’ own research is summarized in Table 1. For comparison, information with regard to the foam applied in the study by Dyga and Brol is also provided [26].
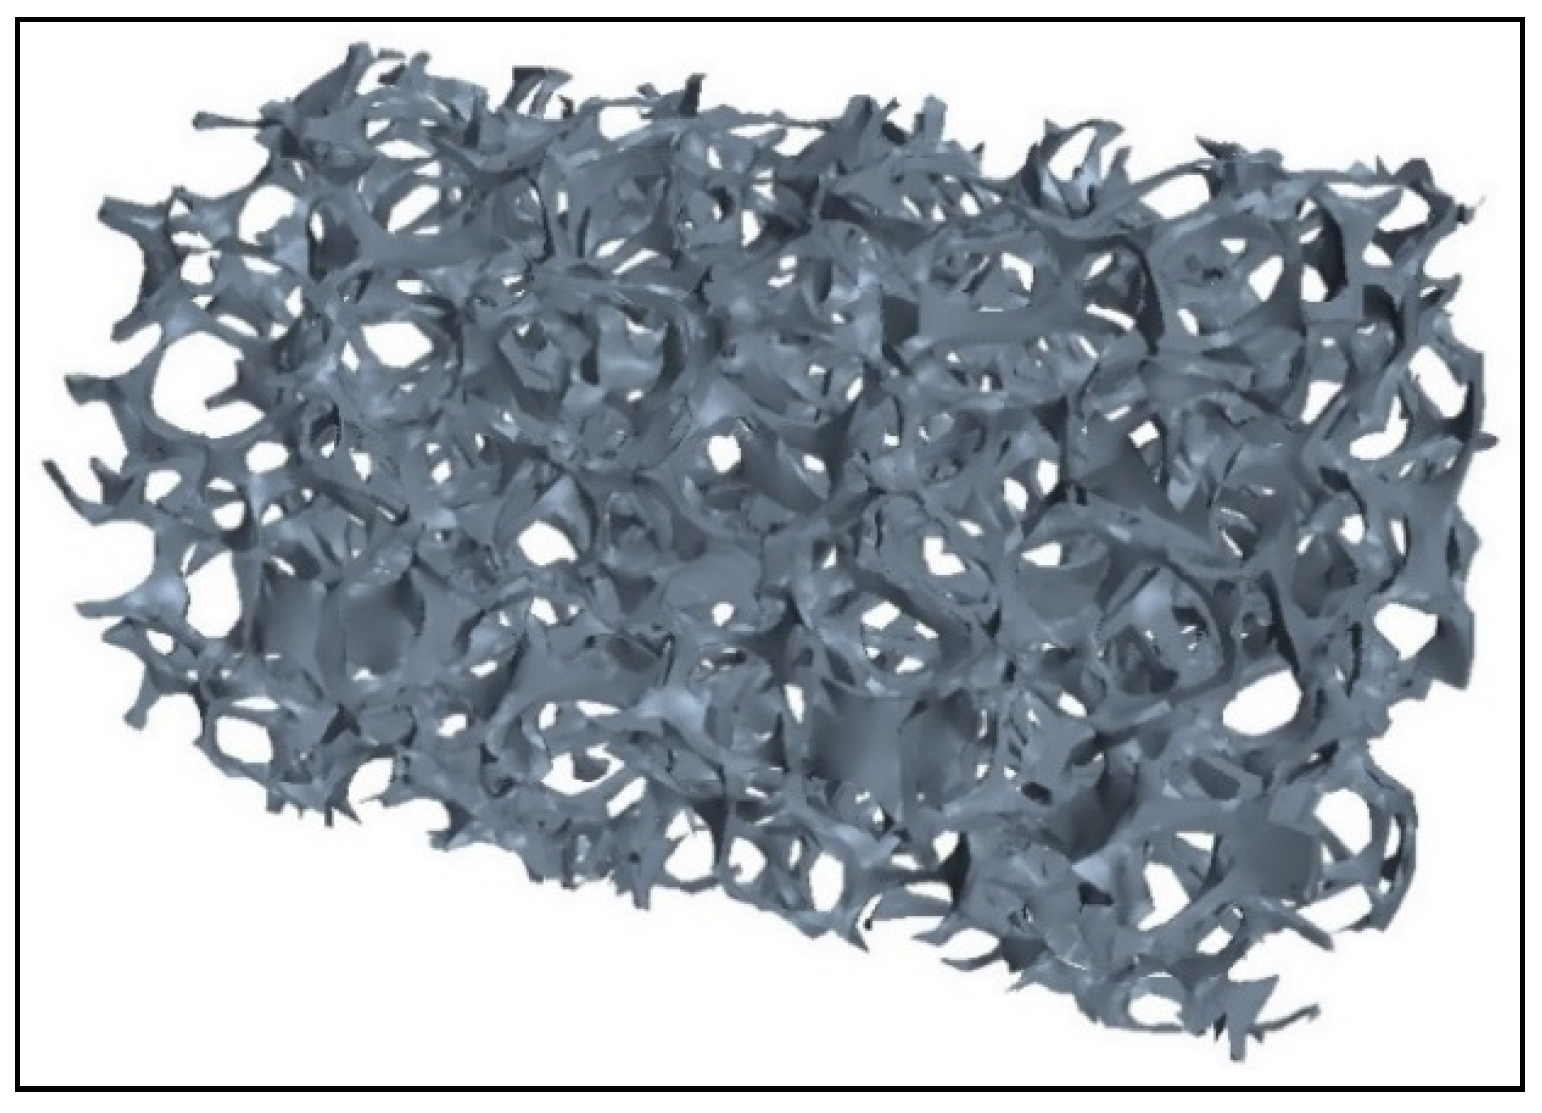
Dedicated experimental measurements are required to obtain the set of data presented in Table 1. For this reason, they are not widely accessible e.g., from websites of foam manufacturers. With regard to this study, information on foam porosity, the size of its cells and pores was obtained by computer microtomography. The use of this method also allowed the generation of a 3D image of the actual structure of the porous material that was applied in the study, which is illustrated in Figure 2. The numerical model developed on this basis was directly applied in the procedure of further CFD (Computational Fluid Dynamics) calculations. In turn, the method of determining the values of foam permeability Ka and Kw shown in Table 1 is described later in this paper. The adopted definition of equivalent diameter de measure is conventional, but it is often found in the works of various authors.

2.2. Measuring Set-Up

The method applied to the couple of components in the experimental set-up, and the measurement system is presented in a schematic form in Figure 3.
Compressed air and tap water formed the components of the two-phase mixture flow. Pressurized air and water tanks AT and WT, respectively, were periodically filled with air and water, and in order to degas water, its tank was initially left open to be drained. The drainage of water from the tank was induced by the pressure of the air that was also pumped into the flow pipe FP. The solution adopted in this manner had two advantages. The first one was designed to achieve identical temperatures of both fluids, since both tanks were located in the same room, and the time needed to execute the experiments was very long. The second advantage was the constant and identical pressure at the inlet to the flow system with each of the fluids, which facilitated the regulation and homogenization of their flow rates. The measurement of the water flux was carried out using the OVZ Kobold® oval wheel water flow meter WFM. In accordance with the research plan described later in the paper, it was assumed that the air flow rate would be constant. For this reason, a typical glass rotameter AR was used for its measurement, and, consequently, the ongoing control of the required values of the parameters was considerably enhanced. The flow rates of both phases were controlled by manual regulating valves RV. Air and water were routed to the horizontal copper flow pipe FP, in which only a part of this pipe houses a metal foam packing inside it. Typical patterns for gas-liquid two-phase flow in an empty pipe were formed in its initial section (upwards of the channel with foam packing). The internal diameter of the pipe was 10 mm, which on the one hand resulted from the typically laboratory nature of the experiments, but on the other hand it corresponded to the diameter of the pipes used in evaporators and condensers of cooling circuits.
The measurements of flow resistance along the length L of a pipe with foam packing was carried out with the use of the HotCold® (HOTCOLD sc, Legionowo, Poland) electronic differential pressure transducer ∆P, identified as DPC7000-D, using the impulse separators IS recommended in [27]. The two-phase mixture was separated in an end separator ES. The temperatures of both phases and the air pressure were measured with electronic transducers dedicated to quantities T and P, using a set of thermocouples and a Peltron® (PELTRON Sp. z o.o., Wiązowna k/Warszawy, Poland) piezoelectric pressure gauge.
All measuring devices (except for the water rotameter) were coupled with a 12-bit analogue-digital measurement card. The software dedicated to it offered the instantaneous and parallel acquisition of signals derived from measurements. Regardless of the accuracy of the electronic pressure, water stream, and temperature transducers declared by the manufacturers, the measurement signals generated by these meters were compared with the reference values. The analysis of the results of this comparison demonstrated that the mean scatter of uncertainty δx of the measurement of quantity xms, in relation to the measured standard xr values,
δ x = 1 n i = 1 n | x r , i x m s , i | x r , i · 100 %
was equal to ±2% for the differential pressure (flow resistance) transmitter, ±1% for the air overpressure transmitter (located downstream of the rotameter at the inlet to the pipe), and ±2% for the water volume flow meter. In turn, the mean uncertainty of temperature measurement of each of the phases was in the range ±0.5 °C. The measuring range of the glass air rotameter with accuracy class 1 was in the range from 1 to 10 dm3/min (1013 hPa; 20 °C).

2.3. Selection of Flow Rates and Results of Measurements

When the scope of the research was initially planned, an assumption was made that it would only be related to such conditions under which a stratified pattern of the two-phase gas-liquid flow would be formed in the section of the empty pipe, upward of the foam packing. This assumption was not accidental. On the one hand, it justified the use of foam as an element applied for the heat transfer enhancement, although it generates additional flow resistance. On the other hand, it greatly simplified the adoption of the initial and boundary conditions in the procedure of numerical modeling of the two-phase flow through the foam applied further in the study. These conditions result directly from the uniform distribution of gas and liquid phases across the cross-section of the pipe.
A common map of flow patterns proposed by Baker [28] was applied to determine the required flow rates of each of the phases. Its accuracy was verified in the work of Troniewski and Ulbrich [29]. Thus, it is also referred to and used in many more recent publications, including those that focus on flows in metal foams, e.g., Dyga and Płaczek [30]. Figure 4 contains a section of this map, and the points corresponding to the projected measurement series are marked on it. The numbers assigned to the following points will be used later in this work. The correction values λ and ψ are applied to ensure that the different physical properties of the actual gas and liquid, compared to air and water, are taken into account. For the studies described in this paper, their values are equal to one, for the following reason:
λ = [ ( ρ g ρ a ) · ( ρ l ρ w ) ] 0.5 ;   ψ = ( σ w σ l ) · [ ( η l η w ) · ( ρ w ρ l ) 2 ] 1 / 3
Due to the compressibility of the gas phase, it is important to perform measurements of its pressure in the characteristic cross-sections of the flow system. This fact is of particular importance in the conditions of flow through metal foams, as considerable pressure drops significantly affect the variations in gas density, and thus its flow velocity. When we consider the above, the pressure in the subsequent sections of the installation was determined in accordance with the diagram shown in Figure 5.
At point ⓪, the current atmospheric pressure was measured using a typical barometer. At the cross-section ➀, the temperature of both phases was controlled, and the air overpressure was measured in relation to the value in the environment. The knowledge of the rotameter calibration conditions, and the actual pressure and temperature of the air flowing in it, made it possible to determine the actual gas mass flow with the rotameter reading equal to 3 dm3/min, which was maintained at a constant level. The gas mass flow rate related to the full cross-section of the empty pipe was assumed to be the inlet superficial mass flux of the air ga,s.
The pressure drop in the section from cross-section ➀ to ➁ was determined on the basis of calculations. For this purpose, a well-known and repeatedly experimentally verified method was used, the authors of which are Lockhart and Martinelli [31]. We can recall that it is based on the model of a two-phase separated system, which corresponds directly to the stratified structure of the two-phase gas-liquid flow. On the basis of using this method, and in accordance with the designations adopted in this work, the resistance of two-phase flow through an empty pipe is given by the equation
Δ P 2 F , e f p = Δ P w , s ·   Φ w 2 ,
where the value of ∆Pw,s is calculated as if only water flow was encountered in the pipe.
For the laminar flow of both phases (stratified flow pattern), the correction value Φw results from the Chisholm equation [32]
Φ w 2 = 1 + 5 X L M + 1 X L M 2 .
The values of parameter XLM are derived from the relationship between the resistance of single-phase flow of gas and liquid in the pipe with a particular diameter and length, that is
X L M 2 = Δ P w , s / Δ P a , s .
In the case described here, the diameter of the flow pipe is 0.01 m, and the length of its empty section in front of the foam is 0.5 m. We can note that this simple method is applied by the authors of many current studies, e.g., [14,16,33,34].
The pressure in cross-section ➀, reduced by the flow resistance determined in this way, was assumed to correspond to the pressure in cross-section ➁, i.e., at the inlet to the metal foam packing. However, it did not correspond to the pressure at the inlet to the section, for the purpose of measuring the flow resistance of the foam, i.e., the pressure occurring in cross-section ➂. This value was determined by taking into account the pressure drop in the initial section of the foam with a length of 0.05 m. The study applied the measurement data related to the flow resistance through the foam (between sections ➂ and ➃) for this purpose. It was assumed that their specific value (∆P/∆L)2F,meas is constant across the entire length of the pipe with foam packing. Finally, the Pin pressure at the inlet to the flow resistance measurement section was adopted to be equal to
P i n = P a t m + P a , r o t Δ P 2 F , e f p 0.05 · ( Δ P Δ L ) 2 F , m e a s ,
where: Patm—atmospheric pressure, Pa,rot—overpressure in the pipe after the air rotameter, and ∆P2F,efp—pressure drop of the two-phase mixture in the section of the empty pipe, are calculated according to Equation (4).
The form of the equation derived in (7), based on the length of the foam segment, enabled the determination the pressure in cross-section ➄. In turn, this value was adopted to correspond to the mean pressure in the section where the measurements of flow resistance were performed.
The temperatures of water and air that were regulated at the inlet to the flow pipe were constant and identical (and resulted from the method of storing these substances described earlier). The subsequent series of experimental studies were performed in the summer, when the temperature in the laboratory room was 25 °C. Hence, this value corresponded to the conditions of the substance flow in the test installation.
A summary of the results of the experiments is provided in Table 2. The numbers applied for the consecutive points (according to the research plan in Figure 4) will be consistently applied in the further sections of this paper. Physical properties of air and water are given for the conditions at the inlet to the flow pipe (after the flow meters). The value of the pressure Pin results from Equation (7), while (∆P/∆L)2F is the measured specific flow resistance of two-phase gas-liquid flow in the pipe section filled with foam 0.15 m long.

3. Numerical Study

Numerical tests were carried out with the use of commercial STAR-CCM+ software, release 13.06. The Eulerian–Multiphase model was used for the simulations, as its suite was specifically designed to carry out numerical calculations for two-phase systems with various degrees of interfacial phase dispersion. The gas-liquid interface was defined using the Multiphase Segregated Flow model. The boundary conditions were set as “inlet velocity” and “pressure outlet”. The adopted air and water flow velocities corresponded to the ones that resulted from experimental tests carried out prior to the simulation.
The novelty of the methodology of numerical simulations applied in this study was that for the initial conditions (i.e., at inlet into the foam pipe section), stratified flow of both fluids was adopted, which corresponded to the stratified flow pattern registered throughout the experimental tests. An assumption was made that water occupies the bottom of the pipe in the amount that corresponded to its volume fraction φw, in the two-phase mixture supplied at the inlet into the flow system, i.e.,
φ w = g w , s · ρ a g w , s · ρ a + g a , s · ρ w .
The simulations were carried out for non-stationary laminar flow that took 10 s of physical time. Each of the steps involved five internal iterations. The final result took the form of the averaged value of the resistances, calculated with a step of 0.1 s, from the first to the tenth second of the real simulation time.
The geometry of the same metal foam used during the experimental tests was further applied in the simulation calculations, in order to best represent the flow conditions. The technique of computed tomography was used for this purpose, and the image of the 3D model obtained in this way of the foam structure is presented in Figure 2. This image was imported into the STAR-CCM+ package. The region occupied by the flow was generated using the same software where the numerical simulations were performed. A polyhedral mesh was utilized for the purpose of these calculations. The complicated geometry of the fluid area in the metal foam zone justified the use of a fine cell mesh. In the sections of the pipe before and after the foam, a mesh with a larger cell size was used, which was beneficial due to the reduction of the required computing memory. As a result, the generated mesh consisted of a total of 1121, and 212 cells, and its 3D view is provided in Figure 6. At the preliminary stage of numerical research, the impact of network independence was not assessed. The values of 1121, and 212 resulted from a compromise between mesh quality parameters, workstation power, and available calculation time (on average two days per point). The parameters contained in the software were used to check the quality of the mesh, orthogonal quality, skewness, and aspect ratio. Their values each time were considered very good. In addition, the grid was controlled by the smallest cell size constraint.
The adopted conditions of numerical simulations ensured the best possible representation of the formerly executed experimental studies. However, it should be noted that the slip between the phases and the surface condition (roughness) of the pipe wall, and the elements forming the metal foam skeleton, were not considered.
In accordance with the study reported in [35], the Multiphase Segregated Flow model normally applied in simulations can be successfully used both for dispersed and segregated systems. In this model each phase is considered as an interpenetrating continuous phase and thus, the mass, momentum, and energy transport equations can be solved for each phase, assuming that they have a common pressure field. According to this model, the volume ratio of fluid i that is occupied by each of the phases is described by the equation
V i = V α i   d V .
The volume ratios of the specific phases need to make up the total of 1. In turn, continuity equation for phase i and phase j takes the following form
t V α i   ρ i   d V + A α i   ρ i   v i   d a = V j i ( m i j m j i )   d V + V S i α d V .
The expression representing the principle of conservation of momentum applies the following form
t V α i   ρ i   d V + A α i   ρ i   v i v i   d a = = V α i   p   d V + V α i   ρ i   g   d V + A [ α i   ( T i + T i t ) ] d a + V M i   d V + V ( F int ) i   d V + + V S i α d V + V i = 1 n ( m i j v j m j i v i )   d V
The heat exchange between the solid elements of the system and the substances flowing in it is neglected in this case. Equations (9)–(11) were developed by application of the original symbols adopted in [35]. The following are represented in them, accordingly:
  • a—area vector, m2
  • g—gravitational acceleration, m/s2
  • mij—mass transfer rate to phase i from phase j, kg/s
  • mji—mass transfer rate to phase j from phase i, kg/s
  • p—pressure, assumed to be equal in all phases, Pa
  • t—time, s
  • Fint—internal forces (including user-defined potential force), N
  • M—interphase momentum transfer per unit volume, N⋅s/m3
  • Siα—phase momentum source term, N/m3
  • Ti—molecular stresses, Pa
  • Tit—turbulent stresses, Pa
  • V—volume, m3
  • α—specific phase volume fraction, -
  • v—velocity, m/s
  • ρ—density, kg/m3
Due to the limitations resulting from the computing power of the workstation, and the large volume of the numerical foam model, simulation calculations were made for a flow pipe filled with foam over a 30 mm section. It was also the length corresponding to a single cylinder-shaped element, which was shown earlier in Figure 1.

4. Results and Discussion

4.1. Experimental Results

The graph in Figure 7 presents the results of the experimental tests. It also presents the measurement uncertainty ranges for subsequent points. The numbers of these points are consistent with Table 2. As it results from the arrangement of points on the graph, within the considered flow conditions, the value (∆P/∆L)2F varies almost linearly as a function of gw,s. We can note that the value of ga,s is almost constant (see Table 2), but the total volume rate of fluid flow in the pipe varies. The linear relationship between the pressure drop and the flow velocity is only characteristic for the laminar region, which, as it is well known, results from the Pouisseuille equation.
Figure 7 also shows the points representing the results of calculations regarding the specific pressure drop that accompanies the two-phase flow, developed on the basis of Equation (4), i.e., for an empty pipe. Their presentation against experimental points provides grounds for assessing the effect of presence of foam on the obvious increase in the pressure drop. The initial range of the vertical axis in the graph assumes a logarithmic scale, which results from a completely different order of resistance values for both considered cases. The values for flow in foam are on average one hundred times greater (~10,000%) than in hollow pipes. This fact makes it questionable to advise the use of foam as an element to increase the energy efficiency of the heat exchanger, according to Equation (1). However, we should clearly emphasize that the research described here concerns the stratified patterns recorded throughout two-phase flow. In this area, the flow resistance in the empty pipe is the lowest, which results from the laminar nature of flow, of both phases, and thus the lack of the effect of their reciprocal mixing and dispersion. Nevertheless, it should be considered that a beneficial effect can be obtained by installing only short lengths of foam packing in the pipe. It can successfully act as a static mixer and thus be considered a flow turbulator. The increase in energy demand for conveying substances in such a pipe may be relatively small, compared to the energy benefits associated with an enhanced heat transfer.
A considerable impediment in the design of heat exchangers is associated with the lack of generally recognized and effective methods of predicting pressure drops during fluid flow in pipes with metal foam packing. The equations proposed so far relate mainly to single-phase flow and to strictly defined foams. Due to this fact, the scope of application of these equations is usually very limited, as indicated by authors themselves. In relation to two-phase flows, there are even fewer proposals. An extensive review and comparison of the methods of calculating the flow resistance of one- and two-phase flows in metal foams is presented in the monograph [36].
A proposition by Dyga and Brol [26] constitutes the most common method of calculating the pressure drop in a pipe with metal foam packing. Its effectiveness was confirmed experimentally, and the scope of its applicability results from the fact that it was developed based on the results of single-phase and two-phase flow tests of gas combined with various liquids, including oil. The research was carried out with the use of metal foams with various structural parameters, one of which was also PPI40 aluminium foam. A summary of its structural parameters can be found in Table 1. Unfortunately, the set of equations proposed by the authors of [26] are very extensive, with some requiring knowledge or determination of additional specific parameters. With the use of symbols and indices adopted in this paper, successive equations have the form given in the section that follows.
The flow resistance of the air-water system in a pipe with foam packing is expressed by the equation
( Δ P Δ L ) 2 F = [ ( Δ P Δ L ) w + ( Δ P Δ L ) a ]   Φ 2 F .
Hence, this forms the total of the resistance that each of the phases would cause while flowing on its own. However, the correction Φ2F helps take into account the fact that a two-phase flow is considered.
The flow resistance of a single-phase water flow is derived based on the equation
( Δ P Δ L ) w = f υ w , s 2 · ρ w 2 · ε 2 1 d e ,
whereas the following should be used for water
( P i n 2 P o u t 2 Δ L ) a = f g a , s 2 ε 2 R a · T a 1 d e .
The manner applied to develop the friction factor is relative to the Reynolds number
R e f = υ f , s · d e · ρ f ε · η f ,
where:
d e = ε 1 ε d p .
The system of equations applied to develop the friction factor is identical for both phases.
{ f = 2260 · Re f 0.9   ,   for   Re f < 150 f = 103 · Re f 0.4 + 12530 · Re f 1.4   ,   for   Re f = 150 ÷ 1300 f = 37 · Re f 0.14 ( ε d p d c d p )   ,   for   Re f > 1300
Amplification factor Φ2F expresses the following equation in the empirical way
Φ 2 F = 1 + C · Re w c 1 · Re a n · [ η l η w ( ρ w ρ l ) 2 ] c 2 .
In the case where water forms the actual liquid phase, the final term of this equation becomes irrelevant. What is more, when the flux of one of the phases disappears Φ2F = 1, Equation (12) takes the correct form for single-phase flow. This fact has been confirmed by experimental data.
The exponent n in Equation (18) should be determined based on the relation
n = D · ( 1 1 f w ) 1 · l o g Γ b 1 + B · D a w b 2 .
Hence, apart from the friction factor developed for water according to (17), two additional parameters play an important role as well.
The first one takes the form
Γ = ( Δ P / Δ L ) w ( Δ P / Δ L ) a υ a , s = υ w , s ,
that is, the relationship between the resistance of a single-phase water flow and the resistance of a single-phase air flow. However, the flow resistance of air flow should be calculated under the assumption that its velocity is the same as that corresponding to the velocity of water. Thus, it is assumed that the volume flow rates of both phases are identical, and the differences in flow resistance are attributable to the different physical properties of the gas and the liquid phases. We can recall at this point that the use of Equation (14) concerning the gas phase requires the knowledge of the inlet pressure Pin.
The second parameter is the Darcy number calculated for water using
D a w = K w 0.25 · d c 2 .
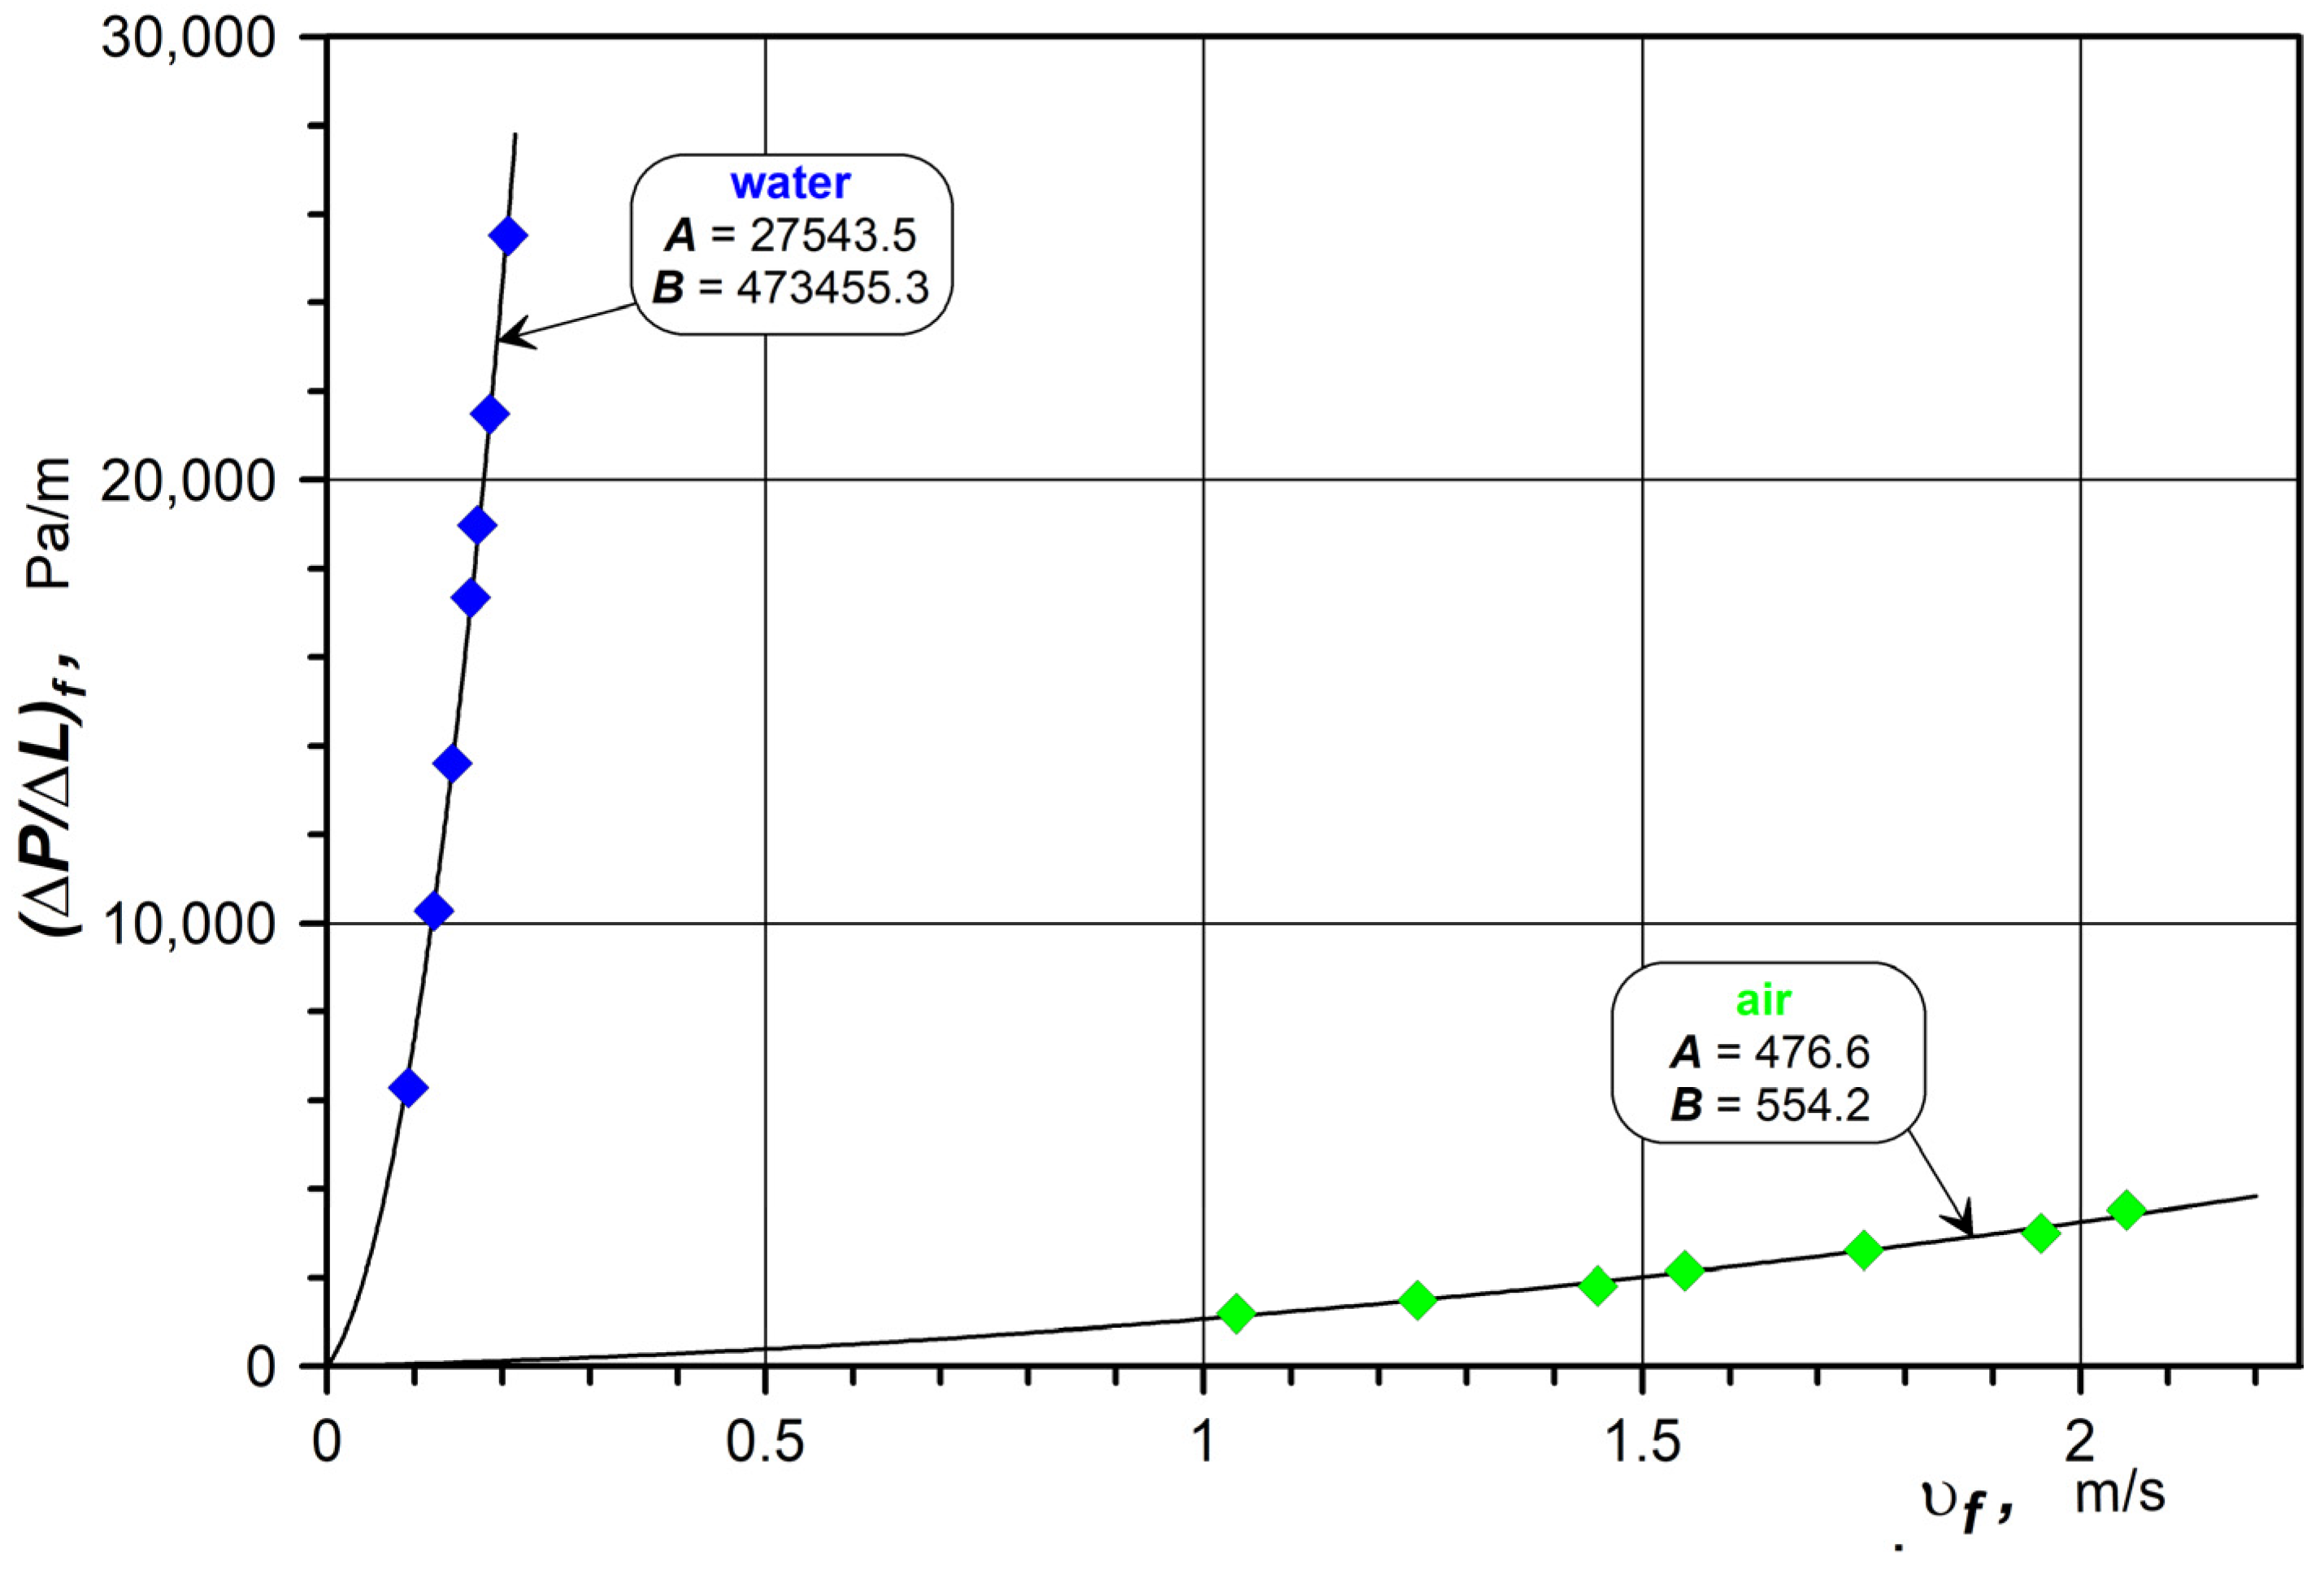
The impediments related to the application of Equation (21) result from the need to have the input as the value of foam permeability for water Kw. Several methods have been proposed for calculating its value. However, the authors agree that the most appropriate way to determine the permeability of a particular foam, for a given fluid, should be based on experimental measurements. The data derived in this way is used to develop the quadratic function resulting from the Dupuit–Forchheimer law commonly applied for porous media
( Δ P Δ L ) f = A · υ f + B · υ f 2 .
The value of foam permeability for any fluid, Kf, its viscosity ηf, and value of A are combined by the relation
K f = η f / A .
In order to determine the permeability of the foam used in this research, additional experiments were performed. The same flow system was applied for this purpose; however, the measurements were performed for a single-phase flow of air and water. The results are given in the diagram presented in Figure 8, and the values of Kw and Ka developed on their basis are already given in Table 1.
The constants and exponents in Equations (18) and (19) are relative to the type of two-phase flow patterns. Their values are given in Table 3.
As we can see, the authors of the method outlined above clearly distinguished the two different instances of two-phase flow. The first applies in the conditions under when the phases are not mixed during the flow. In the second case, the opposite is true. Therefore, we should assume that the first case concerns the laminar flow of both phases. In the second case, the flowing two-phase system, vortices (local turbulences) are formed, which are responsible for the formation of a non-homogeneous two-phase mixture.
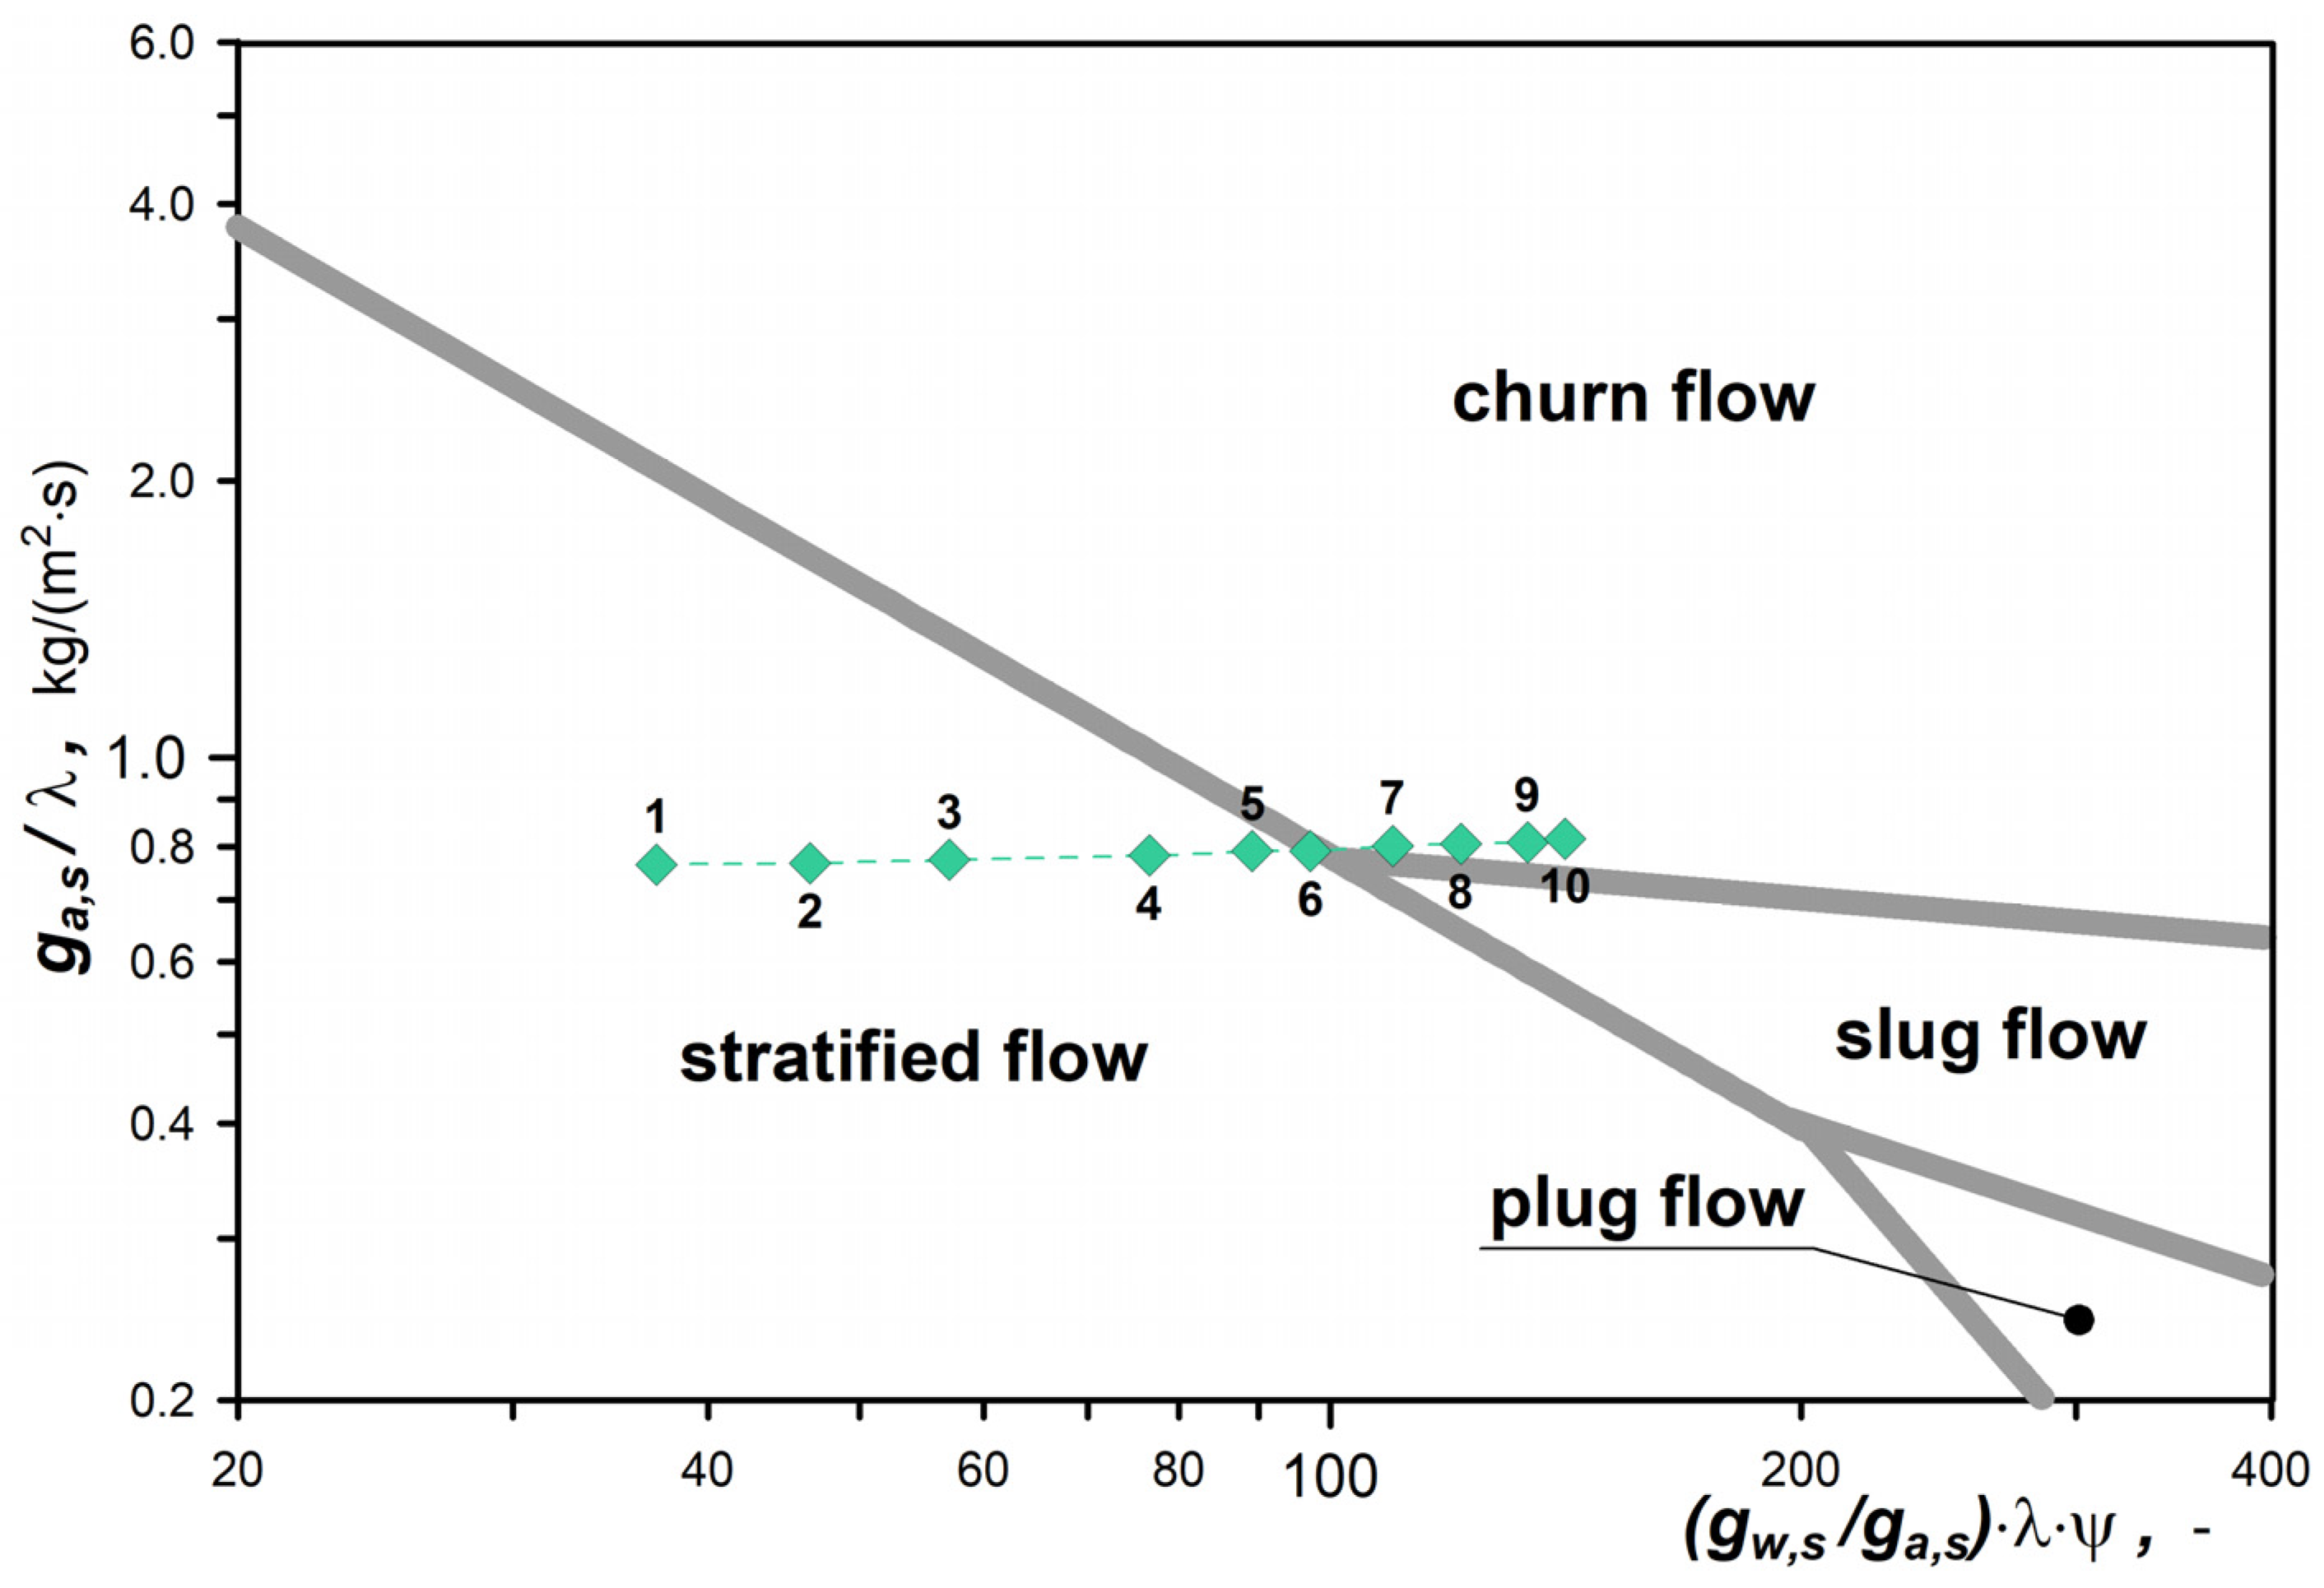
It is very important to note here that in this case, the assessment of the type of two-phase patterns does not relate to the flow in the hollow pipe, but to the one with foam packing inside it. Its presence generates the effect of phase mixing. According to the authors who developed the method for calculating two-phase pressure drops, described here, in a pipe containing metal foam packing, the stratified flow pattern in this foam occupies the area restricted by the conditions defined in the following way:
{ g a , s 71.2 ( g w , s g a , s ) 0.98 ,   f o r   ( g w , s g a , s ) = 1 ÷ 200 g a , s 3050 ( g w , s g a , s ) 1.69 ,   f o r   ( g w , s g a , s ) > 200 .
These conditions form the mathematical record of the functions that express the course of boundary lines on the map of flow patterns, as proposed in the work by Dyga and Płaczek [37]. The map was derived based on the observations and identification of the patterns identified in the gas-liquid two-phase flow formed in a pipe comprising metal foam packing. A section of this map is shown in Figure 9, which indicates the measurement series corresponding to the research conditions conducted for the purpose of this study. The correction values λ and ψ are defined in the equations provided earlier (3).
Based on the comparison of Figure 4 and Figure 9, we can easily note that the presence of foam in the flow tube interfered with the stratified pattern; however, only in relation to a part (half) of the points representing the executed test plan. On the other hand, from the viewpoint of the heat transfer enhancement, flow conditions corresponding to points 6 to 10 provide important insights.
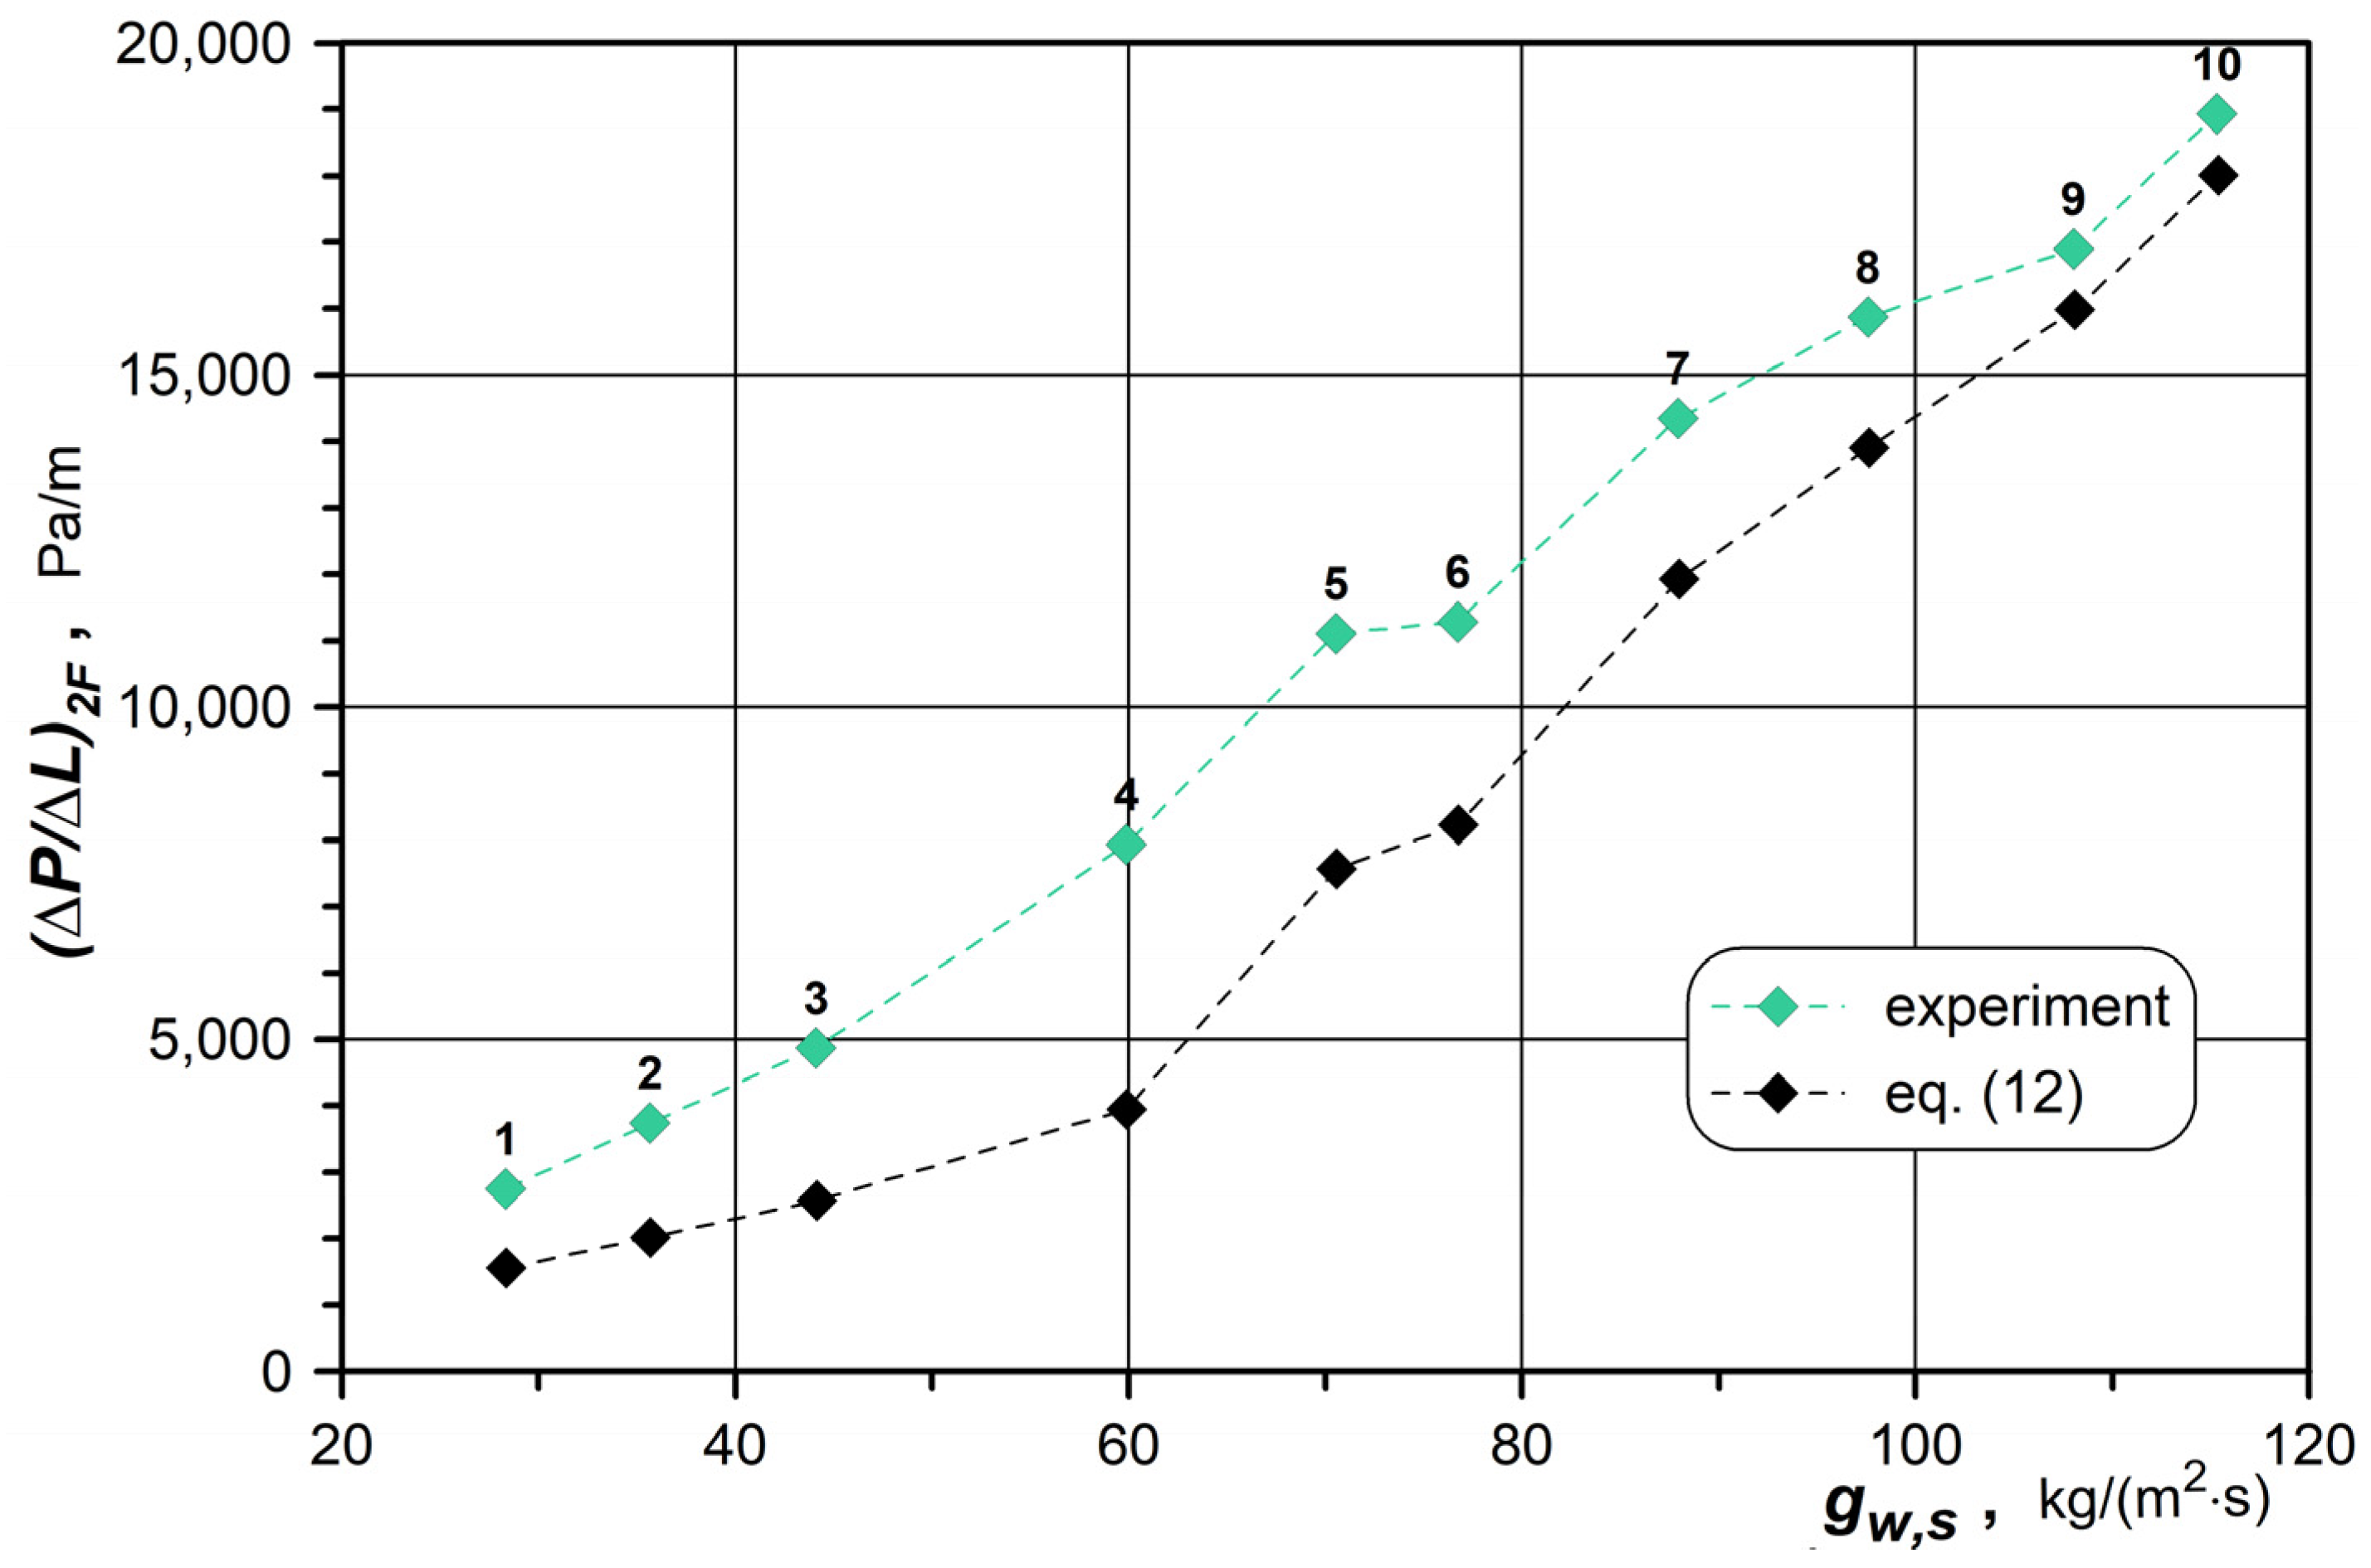
The procedure described here is applied and the results of additional experiments related to the foam permeability are used with the purpose of performing comparative analysis. The results are presented in the chart in Figure 10. As we can see, despite the considerable scope of applicability of the presented calculation method described earlier, results were obtained that were found to be lower in relation to the measured values. However, the differences are more visible in stratified patterns (points 1) than in the case of a more enhanced mixing of the phases (points 610). The mean relative error of the calculated values against the measured values is: 44% for points 15 versus 13% for points 610. The mean accuracy of the calculation method declared by the authors of Equation (12) is in the range ±25%, which applies to 85% of the measurement data needed for its development. Thus, perhaps greater incompatibilities should be forecasted precisely in the case of the typically stratified two-phase flow pattern in the foam. In conditions that promote the enhancement of heat transfer (points 610), the effectiveness of predicting flow resistance based on Equation (12) is sufficiently high for the purposes of heat exchanger design works.
This statement is confirmed by the results of the experimental studies described here, which were carried out by application of a completely different experimental setup regarding foam with slightly different structural parameters.

4.2. Numerical Results

Currently, there is a lack of numerical procedures applicable for calculating the pressure drops dedicated solely to metal foams. For this reason, attempts have been made to utilize the methods developed for the modeling of flow in granular porous media. However, the principal problem is associated with the selection of software, the unambiguous statement of a numerical model to represent the foam structure, and in the case of two-phase fluids, also the determination of the correct mathematical model of such a substance. Only one of the possible proposals in this regard was used in this study. In addition, the main purpose of the simulations performed was to assess the possibility of effective use of the applied procedure, as a tool to support engineering design works.
The enhancement of heat transfer through the pipe with foam is to be expected in such conditions, when its presence causes the effect of mixing the gas with the liquid. For this reason, simulations regarding flow resistance were justified for measuring points 6 to 10. The values obtained numerically are presented versus the experimental data in Figure 11. It also includes points derived based on calculations executed in Equation (12).
Results of simple statistical calculations observed that the numerically determined values of pressure drop are smaller than the measured ones by 31% on average. At the same time, they are on average about 26% lower than the calculated values, according to the empirical Equation (12), i.e., developed based on experimental data concerning strictly defined conditions.
The values of pressure drops determined as a result of the flow simulations, demonstrating underestimated values, suggest that the mathematical models or numerical procedures adopted in their calculations do not take into account all relevant parameters, which is proven to be true.
The numerical simulations did not consider the roughness of the pipe wall, especially along the surface of the foam structure. This seems to play an important role as the details of the roughness, that disturb the hydrodynamic interfacial layer, should be considered in this case, in relation to the small dimensions of the pores and cells, and not in relation to the diameter of the pipe. According to the basics of fluid mechanics, the surface roughness influences the flow resistance in the turbulent flow range. In such a case, it does not matter whether the turbulence is attributable to an increase in the value of the velocity vector or a change in its course.
Without doubt, the effect of phase mixing in the area occupied by foam is related to the local flow turbulence. Thus, the failure to consider the wall interface effects in numerical simulations will lead to the decreased calculated values of flow resistance, which is confirmed in the work by Boomsma et al. [37]. The surface roughness is also not considered by the method expressed by empirical Equation (12). However, it can be assumed that in its case, the effects related to the disturbance of the hydrodynamic boundary layer were accounted for in the results of correlation calculations (Equation (17) and Table 3), with the latter applied to conditions of the actual measurements. Unfortunately, even with the use of currently available and very advanced measurement techniques, an attempt to model the internal structure of the foam, considering the roughness of its surface, forms an overwhelming task. We can add at this point that the surface condition of the foam structure is affected by the technology of its production, and the type of metal (or other material) used.
Another parameter that was not accounted for in the numerical flow simulations was the interfacial slip. Thus, the actual gas and liquid volume fractions not only in the empty pipe but also (and above all) in the porous structure of the foam, was not taken into account. However, the number of studies in this field is very scarce, and an established mathematical description of the results of the experimental research is nearly non-existent. The only attempt to develop a method for calculating interfacial slippage in the foam area was made by Placzek et al. [38]. As a result, it is of no surprise that there are no recommended methods designed for the purpose of creating commercial simulation software, taking into account the effects, resulting from different compositions of the two-phase mixture flowing in the foam layer, compared to the case of an empty pipe. However, we should forecast that the volume fraction of the liquid is greater, which will directly lead to greater flow resistance of the entire mixture.
The level of liquid hold-up in the foam layer may also depend on the wettability of its surface by a particular liquid phase. This was pointed out by Rong et al. [39], whose statement was supported with the results of experimental research. However, it is currently difficult to verify the accuracy of accounting for this parameter in programs suitable for simulation of two-phase flows in metal foams.
The limitations related to the methods applied in numerical simulations, of the two-phase flow through pipes with foam packing, should not demonstrate their lack of adequacy as proposals of effective tools for supporting engineering design works. Apart from determining the values of flow resistance, they provide qualitative and quantitative assessment of the phase distribution in the foam structure. In this way, it is possible to establish flow conditions under which the presence of the foam generates significant disturbance in the two-phase structure, especially in cases of stratified patterns. The classic maps of flow patterns can also offer such a possibility. However, they will not always be effective for foams and flow conditions, other than those for which they are designed. This is particularly important in the case of non-typical design solutions. Effective mixing of phases is favored by an increase in the flow velocity. Importantly, however, this increase should be limited as much as possible as it involves unnecessary energy demand to counteract flow resistance.
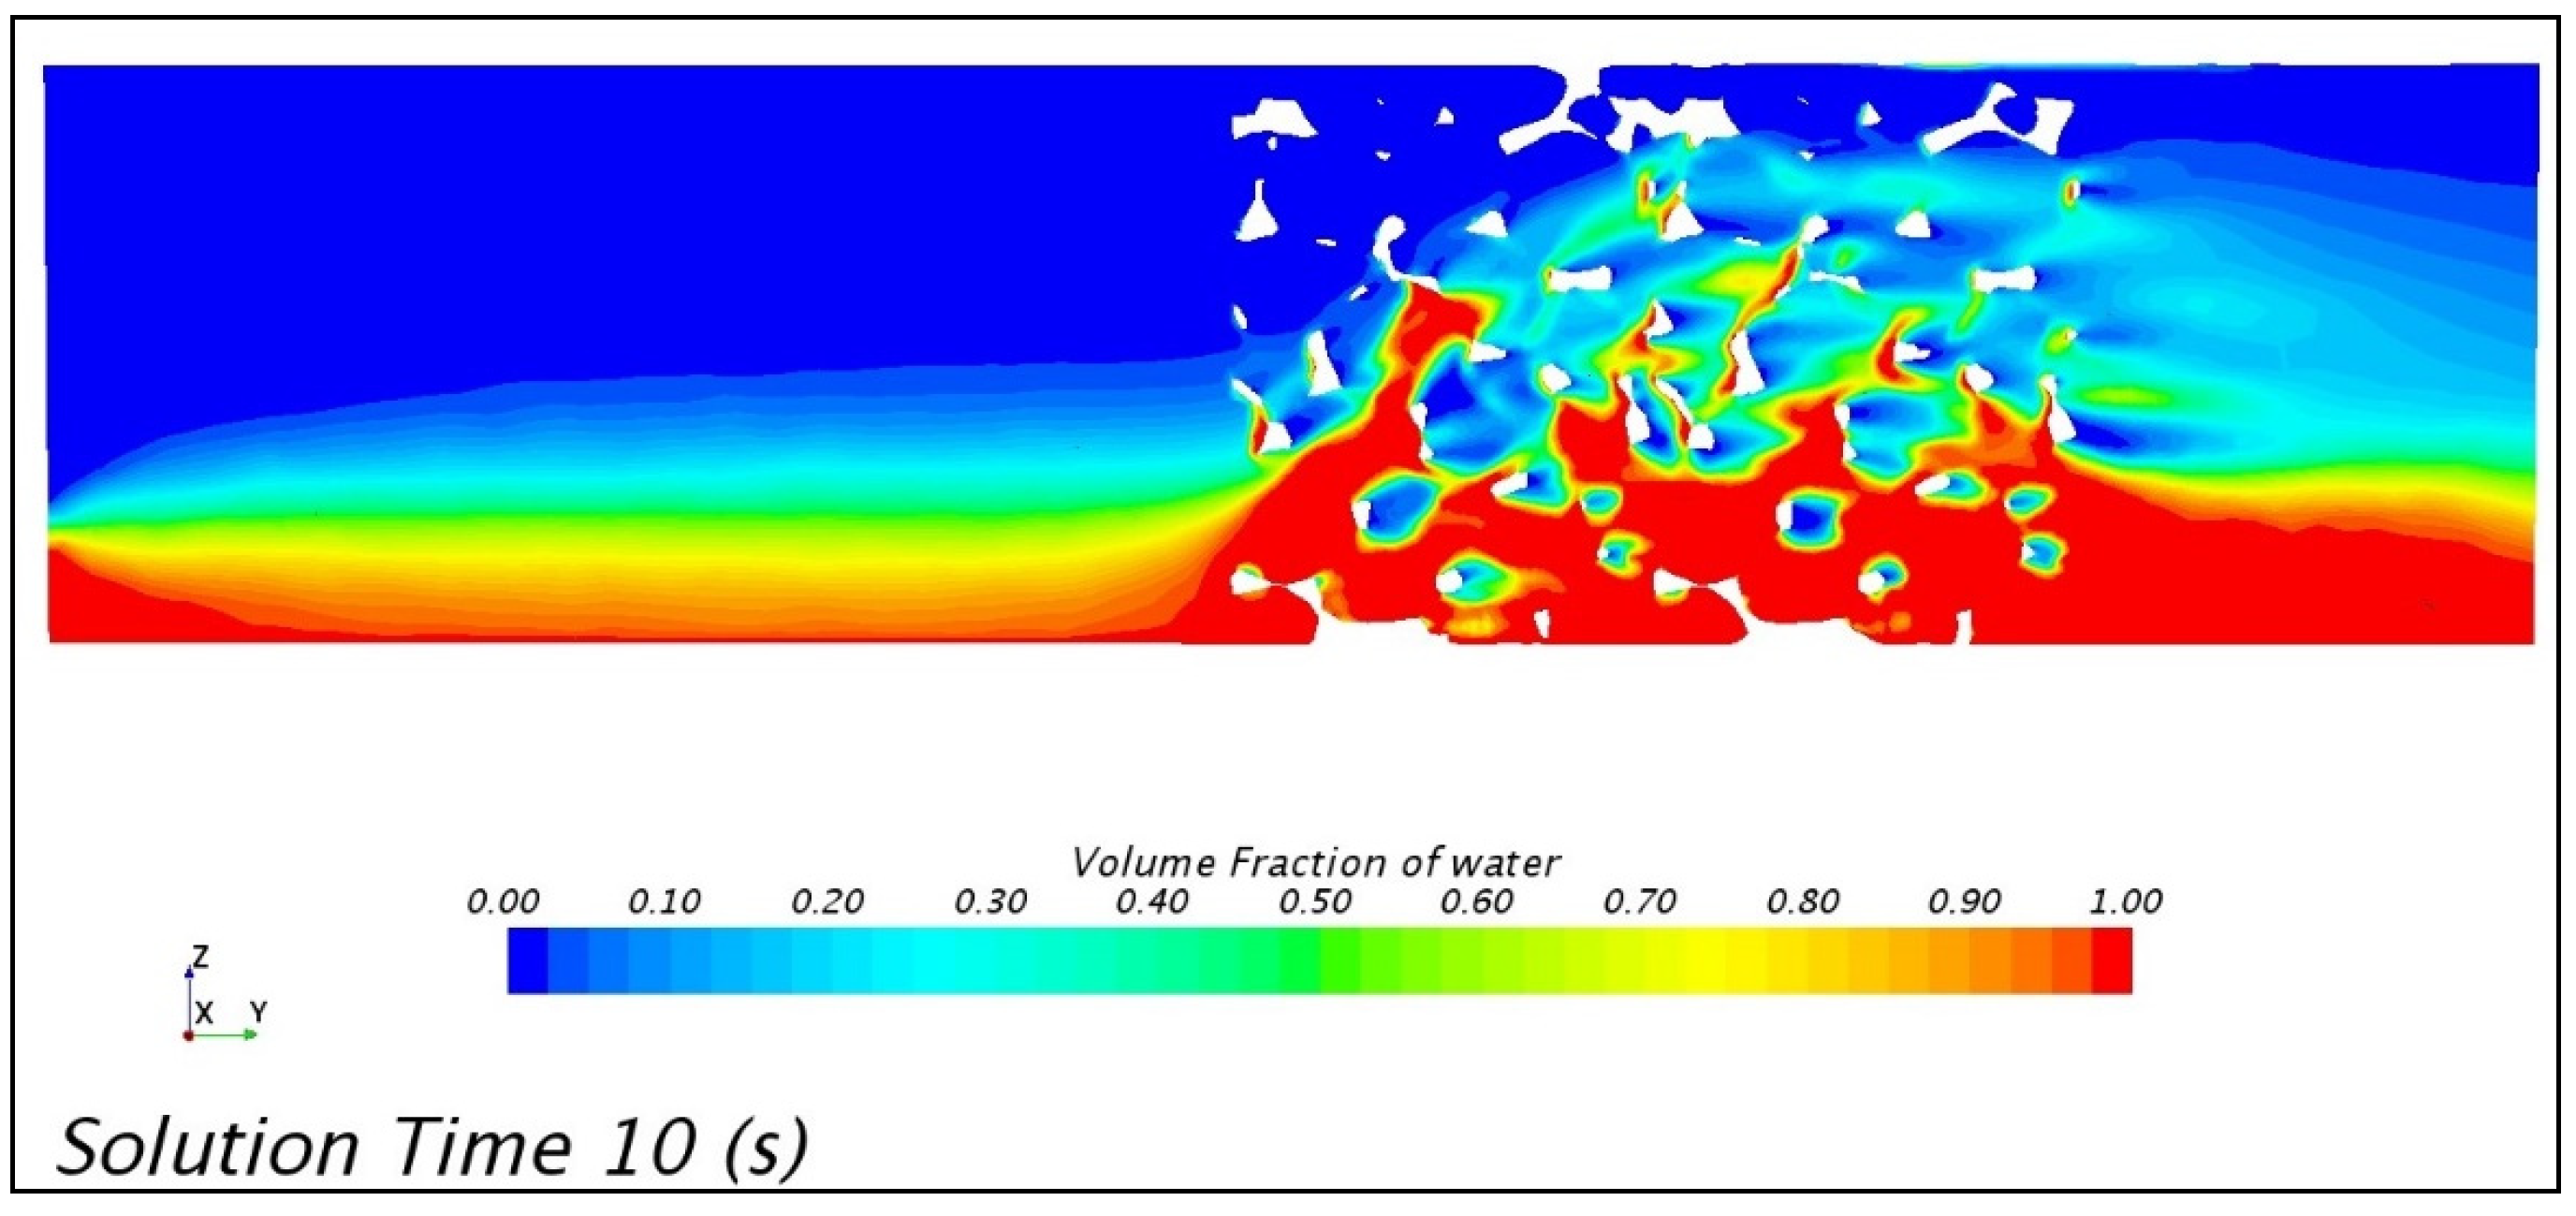
Figure 12 presents the volume fraction of water during the two-phase water-air flow through a pipe, which includes a section containing foam packing. It is one of the images obtained as a result of simulation calculations and represents the conditions for the case presented by point 10 in Table 2.
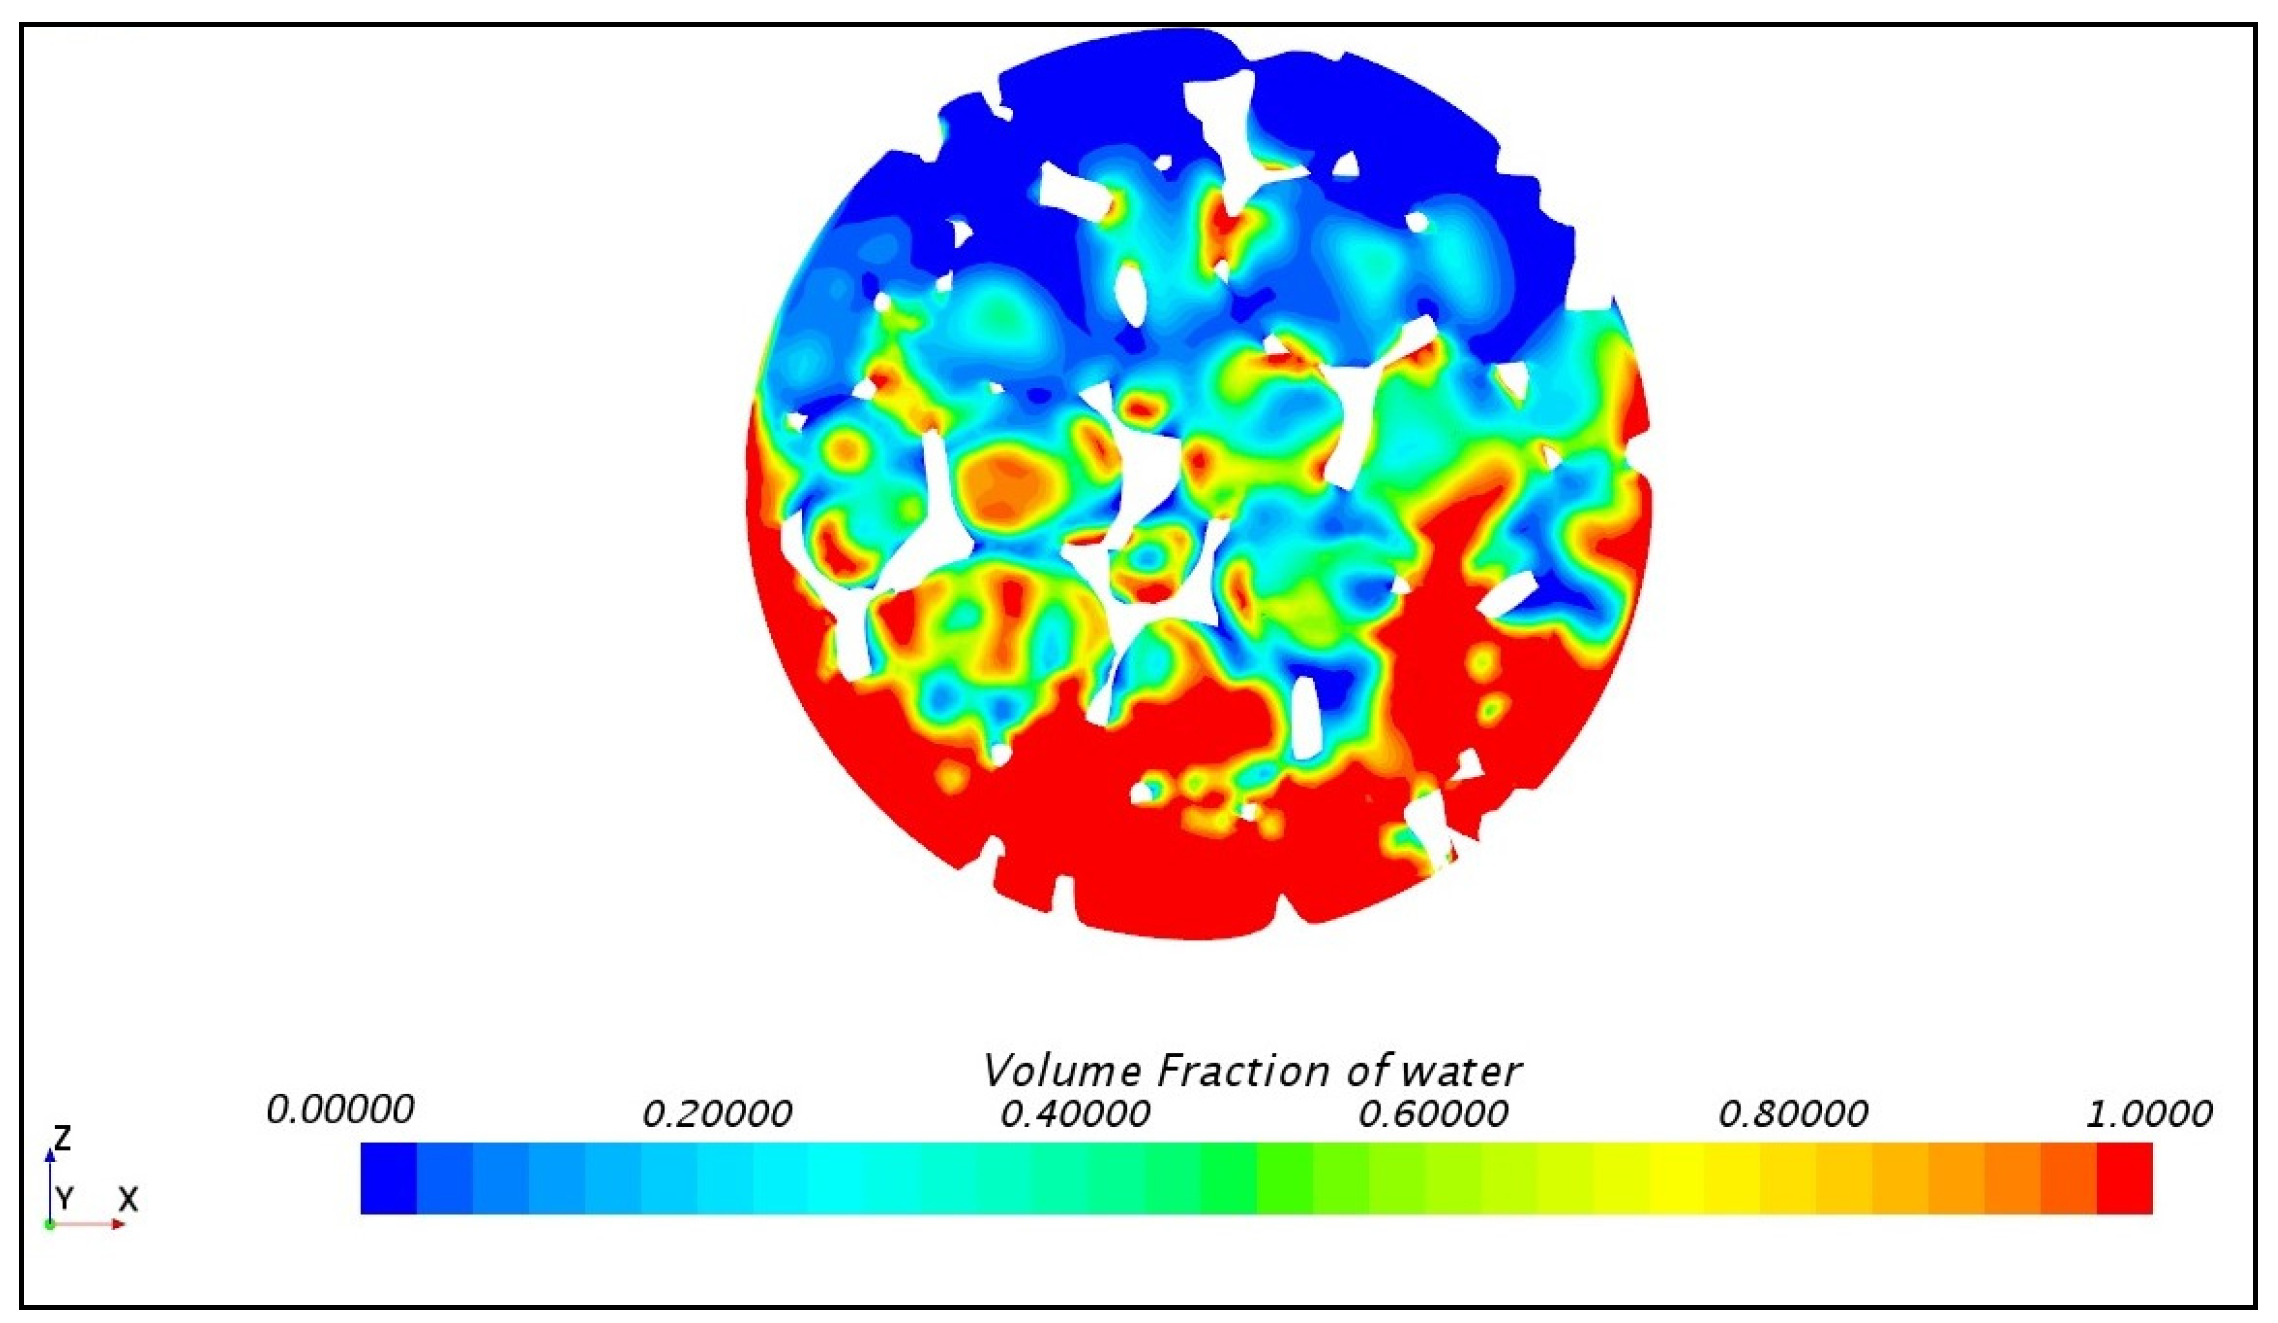
On this basis, we can easily state that the stratified flow pattern formed in the hollow pipe section was disturbed by the foam layer. As a consequence, an interface is generated between the liquid phase and pipe wall as well as the metal foam material along a larger area. This is even better illustrated by the graphic in Figure 13, which relates to the cross section of the foam layer. We can recall here that the assessment of the degree of flow disturbance by the foam is extremely difficult to execute under experimental conditions.
Numerical calculations also provide the means to adjust many other parameters. One of them is the velocity of the components of a certain phase, which is also almost impossible to measure experimentally. For example, during the simulation, images were obtained similar to those in Figure 12 and Figure 13, concerning the local velocities of water and air. As an example, Figure 14 shows the distribution of air velocity obtained numerically for point no. 10. Their analysis makes it possible to gain inference regarding the level of turbulence in specific areas of the porous foam structure, and thus indicate the location representing enhancements in heat transfer enhancements.
In order to carry out numerical simulations in the described manner, it was necessary to have a 3D image of the internal structure of the foam. However, at present, such a picture is easier to obtain compared to experimental data derived from real flow experiments. The assessment of the foam structure by computational microtomography is not as rare as it used to be. It is easy to find centers specializing in this type of research, which have professional equipment that ensures that reliable results are obtained. However, it is worth taking steps to collect such images, in order to create a useful database.

5. Conclusions

The analysis of the results of the conducted research and numerical simulations offers several conclusions. They are particularly suitable for the design of apparatus in which the use of metal foam packing is projected in the flow channels.
  • The presence of metal foam in the pipe leads to a multiple increase in the gas-liquid two-phase pressure drop.
    Comment: This increase is particularly visible when it is compared to the pressure drop that accompanies two-phase mixture flow in a hollow tube, in the form of stratified pattern. In this case, one can forecast a decrease in the total energy efficiency of the heat exchanger, rather than its increase. However, it may be expedient to provide a short length of foam in the inlet section of the pipe. It will then mainly perform the function of a flow turbulator, and not a specific rib inside the flow pipe.
  • The empirical equations applied to forecast the flow resistance in the foam layer take on complex forms.
    Comment: In addition, they sometimes require the inputs of parameter values, which need to be determined individually based on experimentation. This fact makes the practical use of these equations difficult; however, it results from the very complex and peculiar internal structure of the metal foam. When its structure is described only with the PPI value, this proves to be insufficient, both in terms of identification of the course of flow and thermal phenomena.
  • The mere fact of installing metal foam in a pipe does not guarantee that a sufficiently large disturbance of the stratified flow pattern is obtained, and thus the effect of enhanced mixing of the phases achieved.
    Comment: In order to forecast the type of gas-liquid two-phase pattern formed in a pipe containing foam packing, one should generate maps of flow patterns developed specifically for a particular case.
  • The main difficulty in the methodology of numerical simulation of flow through the foam packing is associated with the adequate representation of its actual internal structure.
    Comment: In the place of theoretical models generated for granular layers, it is more suitable to apply 3D images generated by means of computer microtomography. However, even in such a case, it is not possible to represent suitably the roughness of the surface of the solid body (metal), and thus take it into account in the simulations to represent the interface between two-phase mixture and the metal packing during flow through the foam.
  • Interfacial slip should be taken into account in the procedures applied in the numerical modeling of two-phase flow in a pipe with foam packing.
    Comment: However, we should remember that its value is different than the flow in an empty pipe. For this reason, the level of gas packing in the foam skeleton, as well as liquid volume, is also different. Its actual volume ratio may also be determined by the type of foam material (type of metal or non-metallic material), and in particular, the wettability of its surface by the liquid.
  • A variety of numerical modeling techniques can serve as effective tools in assessing the disturbance of two-phase flow pattern in a pipe with foam packing, as the procedure is very difficult to be executed experimentally.
    Comment: In the case when it is unfeasible or non-advisable to conduct laboratory research, the results of numerical calculations can also be applied in forecasting pressure drops. The resulting values are similar to those that can be indicated by the accessible empirical equations (with regard to the case discussed here). However, the execution of numerical calculations requires access to dedicated software and a computer with sufficient computing power; however, this does not guarantee the short duration of simulations anyway. In addition, their results often require additional processing. All this means that the application of numerical simulations when actual flow systems are designed may turn out to be as time-consuming and cost-effective as the experimental studies that can offer the most reliable results.

Author Contributions

Conceptualization, J.H. and A.S.; methodology, A.S. and J.W.; validation, A.S., J.W.; formal analysis, J.W.; investigation, A.S.; data curation, A.S. and J.W.; writing—original draft preparation, J.H.; visualization, J.H. and A.S.; supervision, J.H. All authors have read and agreed to the published version of the manuscript.

Funding

This research received no external funding.

Data Availability Statement

Data is contained within the article (Table 2).

Conflicts of Interest

The authors declare no conflict of interest.

Nomenclature

ddiameter, m
ffriction factor, −
gmass flux, kg/(m2·s)
xmeasured quantity (overall)
DaDarcy number, −
Gmass flow rate, kg/s
Kfoam permeability, m2
Llength, m
Mmolar mass, kg/kmol
Ppressure, Pa
Rspecific gas constant (for air: 288.3), J/(kg·K))
ReReynolds number, −
Vvolume flow rate, m3/s
Ttemperature, K (°C)
XLMLockart-Martinelli parameter, −
Greek symbols
λ, ψcorrection of phase properties, −
ηviscosity, Pa·s
ρdensity, kg/m3
σsurface tension, N/m
υvelocity, m/s
ΔΠflow resistance (drop pressure), Pa
ΔΛlength increment, m
Subscripts
aair
atmatmospheric
ccell
clcomputed value
eequivalent parameter
efpempty flow pipe
ffluid
fpflow pipe
ggas
ininlet
lliquid
msmeasured value
outoutlet
ppore
rreference value
rotrotameter
ssuperficial value (apparent)
wwater

References

  1. Evans, A.; Hutchinson, J.; Ashby, M. Multifunctionality of cellular metal systems. Prog. Mater. Sci. 1998, 43, 171–221. [Google Scholar] [CrossRef]
  2. De Schampheleire, S.; De Jaeger, P.; De Kerpel, K.; Ameel, B.; Huisseune, H.; De Paepe, M. How to Study Thermal Applications of Open-Cell Metal Foam: Experiments and Computational Fluid Dynamics. Materials 2016, 9, 94. [Google Scholar] [CrossRef] [PubMed] [Green Version]
  3. Paek, J.W.; Kang, B.H.; Kim, S.Y.; Hyun, J.M. Effective Thermal Conductivity and Permeability of Aluminum Foam Materials. Int. J. Thermophys. 2000, 21, 453–464. [Google Scholar] [CrossRef]
  4. Banhart, J. Manufacture, characterisation and application of cellular metals and metal foams. Prog. Mater. Sci. 2001, 46, 559–632. [Google Scholar] [CrossRef]
  5. Tadrist, L.; Miscevic, M.; Rahli, O.; Topin, F. About the use of fibrous materials in compact heat exchangers. Exp. Therm. Fluid Sci. 2004, 28, 193–199. [Google Scholar] [CrossRef]
  6. Zhu, Y.; Hu, H.; Sun, S.; Ding, G. Heat transfer measurements and correlation of refrigerant flow boiling in tube filled with copper foam. Int. J. Refrig. 2014, 38, 215–226. [Google Scholar] [CrossRef]
  7. Abadi, G.B.; Moon, C.; Kim, K.C. Experimental study on single-phase heat transfer and pressure drop of refrigerants in a plate heat exchanger with metal-foam-filled channels. Appl. Therm. Eng. 2016, 102, 423–431. [Google Scholar] [CrossRef]
  8. Hooman, K.; Chumpia, A.; Jadhav, P.; Rudolph, V. Metal Foam Heat Exchanger for Dry Cooling. Final Report for ANLEC Project 5-0710-0063. 2013. Available online: https://www.globalccsinstitute.com/archive/hub/publications/120141/metal-foam-heat-exchanger-dry-cooling.pdf (accessed on 10 October 2022).
  9. Abadi, G.B.; Kim, K.C. Experimental heat transfer and pressure drop in a metal-foam-filled tube heat exchanger. Exp. Therm. Fluid Sci. 2017, 82, 42–49. [Google Scholar] [CrossRef]
  10. Ji, W.-T.; Li, Z.-Y.; Qu, Z.-G.; Guo, J.-F.; Zhang, D.-C.; He, Y.-L.; Tao, W.-Q. Film condensing heat transfer of R134a on single horizontal tube coated with open cell copper foam. Appl. Therm. Eng. 2015, 76, 335–343. [Google Scholar] [CrossRef]
  11. Bağcı, Ö.; Dukhan, N. Experimental hydrodynamics of high-porosity metal foam: Effect of pore density. Int. J. Heat Mass Transf. 2016, 103, 879–885. [Google Scholar] [CrossRef]
  12. Kouidri, A.; Madani, B. Experimental hydrodynamic study of flow through metallic foams: Flow regime transitions and surface roughness influence. Mech. Mater. 2016, 99, 79–87. [Google Scholar] [CrossRef]
  13. Wang, H.; Guo, L. Experimental investigation on pressure drop and heat transfer in metal foam filled tubes under convective boundary condition. Chem. Eng. Sci. 2016, 155, 438–448. [Google Scholar] [CrossRef]
  14. Hu, H.; Zhu, Y.; Ding, G.; Sun, S. Effect of oil on two-phase pressure drop of refrigerant flow boiling inside circular tubes filled with metal foam. Int. J. Refrig. 2012, 36, 516–526. [Google Scholar] [CrossRef]
  15. Hu, H.; Zhu, Y.; Peng, H.; Ding, G.; Sun, S. Effect of tube diameter on pressure drop characteristics of refrigerant–oil mixture flow boiling inside metal-foam filled tubes. Appl. Therm. Eng. 2014, 62, 433–443. [Google Scholar] [CrossRef]
  16. Ji, X.; Xu, J. Experimental study on the two-phase pressure drop in copper foams. Heat Mass Transf. 2012, 48, 153–164. [Google Scholar] [CrossRef]
  17. Zhu, Y.; Hu, H.; Sun, S.; Ding, G. Flow boiling of refrigerant in horizontal metal-foam filled tubes: Part 1—Two-phase flow pattern visualization. Int. J. Heat Mass Transf. 2015, 91, 446–453. [Google Scholar] [CrossRef]
  18. Tourvieille, J.-N.; Philippe, R.; de Bellefon, C. Milli-channel with metal foams under an applied gas–liquid periodic flow: External mass transfer performance and pressure drop. Chem. Eng. J. 2015, 267, 332–346. [Google Scholar] [CrossRef]
  19. Lai, Z.; Hu, H.; Ding, G. Effect of porosity on heat transfer and pressure drop characteristics of wet air in hydrophobic metal foam under dehumidifying conditions. Exp. Therm. Fluid Sci. 2018, 96, 90–100. [Google Scholar] [CrossRef]
  20. Wu, Z.; Caliot, C.; Bai, F.; Flamant, G.; Wang, Z.; Zhang, J.; Tian, C. Experimental and numerical studies of the pressure drop in ceramic foams for volumetric solar receiver applications. Appl. Energy 2010, 87, 504–513. [Google Scholar] [CrossRef]
  21. Bai, M.; Chung, J. Analytical and numerical prediction of heat transfer and pressure drop in open-cell metal foams. Int. J. Therm. Sci. 2011, 50, 869–880. [Google Scholar] [CrossRef]
  22. Nie, Z.; Lin, Y.; Tong, Q. Numerical investigation of pressure drop and heat transfer through open cell foams with 3D Laguerre-Voronoi model. Int. J. Heat Mass Transf. 2017, 113, 819–839. [Google Scholar] [CrossRef]
  23. Diani, A.; Bodla, K.K.; Rossetto, L.; Garimella, S.V. Numerical Analysis of Air Flow through Metal Foams. Energy Procedia 2014, 45, 645–652. [Google Scholar] [CrossRef]
  24. Diani, A.; Bodla, K.K.; Rossetto, L.; Garimella, S.V. Numerical investigation of pressure drop and heat transfer through re-constructed metal foams and comparison against experiments. Int. J. Heat Mass Transf. 2015, 88, 508–515. [Google Scholar] [CrossRef] [Green Version]
  25. Ambrosio, G.; Bianco, N.; Chiu, W.K.; Iasiello, M.; Naso, V.; Oliviero, M. The effect of open-cell metal foams strut shape on convection heat transfer and pressure drop. Appl. Therm. Eng. 2016, 103, 333–343. [Google Scholar] [CrossRef] [Green Version]
  26. Dyga, R.; Brol, S. Pressure Drops in Two-Phase Gas–Liquid Flow through Channels Filled with Open-Cell Metal Foams. Energies 2021, 14, 2419. [Google Scholar] [CrossRef]
  27. Hapanowicz, J. Proposition of non-standard method useful for viscosity measurements of unstable two-phase systems coupled with examples of its application. Measurement 2020, 164, 108113. [Google Scholar] [CrossRef]
  28. Baker, O. Simultaneous flow of oil and gas. Oil Gas J. 1954, 53, 185–195. [Google Scholar]
  29. Troniewski, L.; Ulbrich, R. The analysis of flow regime maps of two-phase gas-liquid flow in pipes. Chem. Eng. Sci. 1984, 39, 1213–1224. [Google Scholar] [CrossRef]
  30. Dyga, R.; Płaczek, M. Influence of Hydrodynamic Conditions on the Type and Area of Occurrence of Gas–Liquid Flow Patterns in the Flow through Open–Cell Foams. Materials 2020, 13, 3254. [Google Scholar] [CrossRef]
  31. Lockhart, R.W.; Martinelli, R.C. Proposed correlation of data for isothermal two-phase, two-component flow in pipes. Chem. Eng. Prog. 1949, 45, 39–48. [Google Scholar]
  32. Chisholm, D. A theoretical basis for the Lockhart-Martinelli correlation for two-phase flow. Int. J. Heat Mass Transf. 1967, 10, 1767–1778. [Google Scholar] [CrossRef]
  33. Shi, J.; Zheng, G.; Chen, Z. Experimental investigation on flow condensation in horizontal tubes filled with annular metal foam. Int. J. Heat Mass Transf. 2017, 116, 920–930. [Google Scholar] [CrossRef]
  34. Tourvieille, J.-N.; Philippe, R.; de Bellefon, C. Milli-channel with metal foams under an applied gas–liquid periodic flow: Flow patterns, residence time distribution and pulsing properties. Chem. Eng. Sci. 2015, 126, 406–426. [Google Scholar] [CrossRef]
  35. Siemens PLM Software: UserGuide_13.06. Siemcenter STAR-CCM+. Available online: https://community.sw.siemens.com/s/question/0D54O000061xpUOSAY/simcenter-starccm-user-guide-tutorials-knowledge-base-and-tech-support (accessed on 2 November 2022).
  36. Dyga, R. Wymiana Ciepła i Hydrodynamika Przepływu Przez Piany Metalowe; Studies and Monographs 420; Publishing House of the Opole University of Technology: Opole, Poland, 2015; ISBN 978-83-65235-16-9. (In Polish) [Google Scholar]
  37. Boomsma, K.; Poulikakos, D.; Ventikos, Y. Simulations of flow through open cell metal foams using an idealized periodic cell structure. Int. J. Heat Fluid Flow 2003, 24, 825–834. [Google Scholar] [CrossRef]
  38. Płaczek, M.; Dyga, R.; Witczak, S. Experimental investigation of void fraction in horizontal air-water flow through FeCrAlY foam. Procedia Eng. 2012, 42, 690–703. [Google Scholar] [CrossRef] [Green Version]
  39. Rong, J.; Zhang, T.; Qiu, F.; Xu, J.; Zhu, Y.; Yang, D.; Dai, Y. Design and preparation of efficient, stable and superhydrophobic copper foam membrane for selective oil absorption and consecutive oil–water separation. Mater. Des. 2018, 142, 83–92. [Google Scholar] [CrossRef]
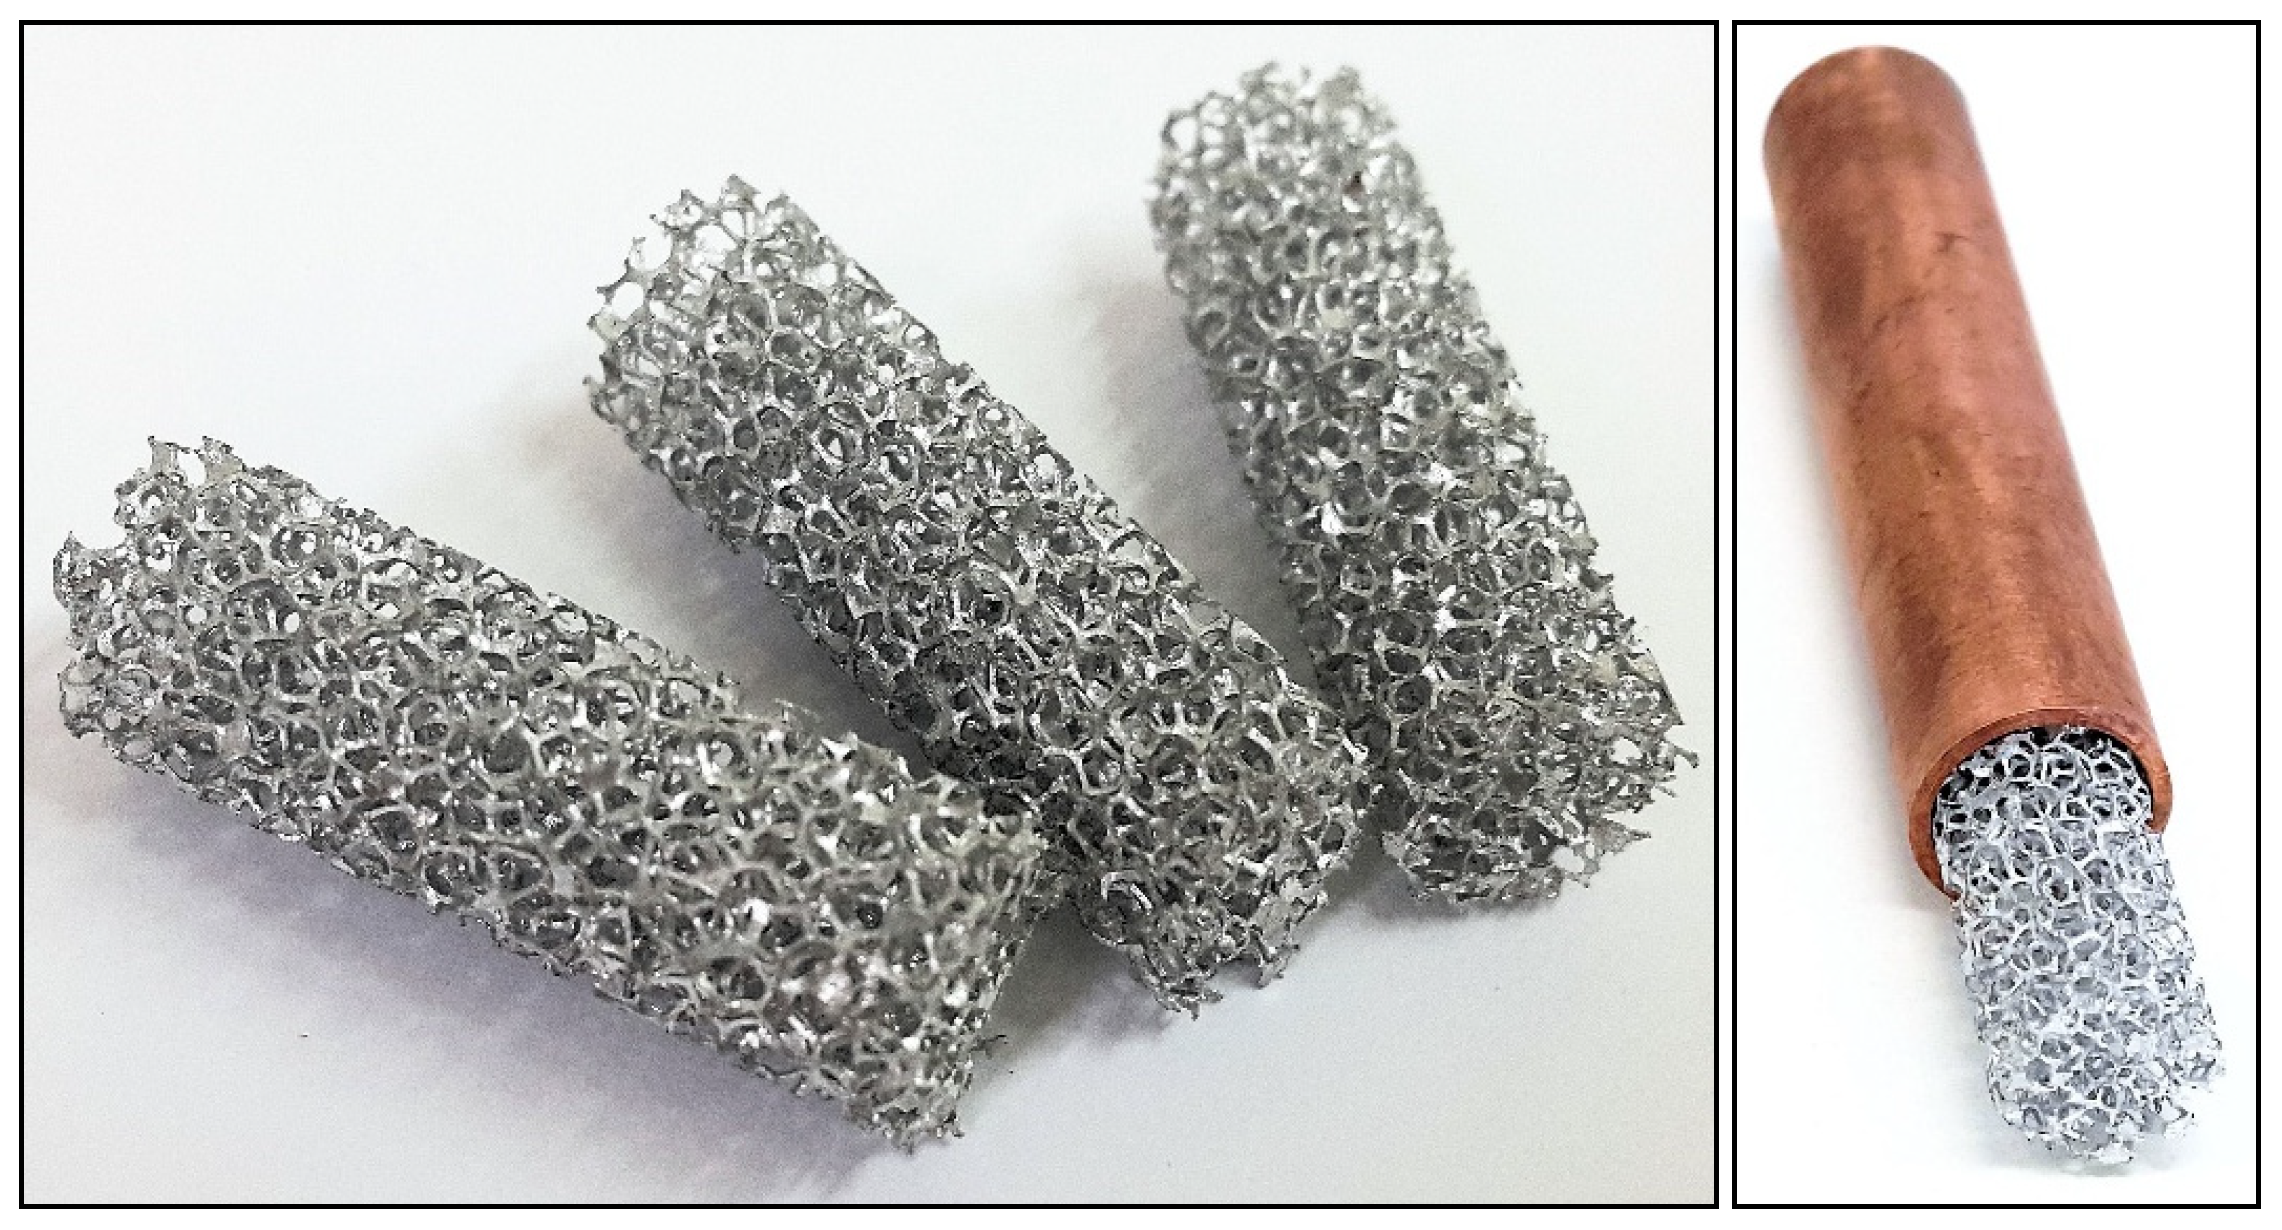
Figure 1. Cylinder-shaped metal foam elements applied in the experimental study.
Energies 15 09068 g001
Figure 2. 3D image of metal foam packing applied in the experiments.
Energies 15 09068 g002
Figure 3. Scheme of the measuring setup.
Energies 15 09068 g003
Figure 4. Section of Baker’s map with a marked measurement series projected in this study.
Energies 15 09068 g004
Figure 5. Locations of sections in the installation that play a role in determining pressure values. (description in text).
Energies 15 09068 g005
Figure 6. Polyhedral mesh with overlapped zone occupied by fluid flow.
Energies 15 09068 g006
Figure 7. Measurements of specific flow resistances of two-phase flow through foams and results for empty pipe.
Energies 15 09068 g007
Figure 8. Results of measurements of foam permeability applied in this research.
Energies 15 09068 g008
Figure 9. Section of a map with flow patterns identified in the study by [37] with marked measurement series representing the conditions of the current research.
Energies 15 09068 g009
Figure 10. Measured and calculated specific flow resistance of two-phase air-water flow in a pipe with PPI40 aluminum foam packing.
Energies 15 09068 g010
Figure 11. Comparison of the pressure drop values derived by application of various methods.
Energies 15 09068 g011
Figure 12. Distribution of liquid phase along the length of the channel containing foam layer.
Energies 15 09068 g012
Figure 13. Distribution of liquid phase along the cross-section of the pipe with foam packing.
Energies 15 09068 g013
Figure 14. Distribution of air velocity in the pipe with foam packing.
Energies 15 09068 g014
Table 1. Structural parameters of metal foam.
ParameterOwn ResearchAccording to [26]
type of metalAluminiumAluminium
PPI4040
ε, −0.9300.929
dp, mm1.200.82
dc, mm2.002.38
de = dp·ε/(1 − ε), mm15.910.7
Ka, m20.382 × 10−70.659 × 10⁻⁷
Kw, m20.363 × 10−70.765 × 10⁻⁷
Table 2. Results of experimental measurements; T = 298K.
Point No.ga,sρaηagw,sρwηwPin(∆P/∆L)2F
kg/(m2·s)kg/m3Pa·skg/(m2·s)kg/m3Pa·sPaPa/m
10.76481.20118.4 × 10−628.34996.99 × 10−4102,8222751
20.76751.20918.4 × 10−635.66996.99 × 10−4103,4913740
30.77401.23018.4 × 10−644.12996.99 × 10−4105,1974874
40.78241.25718.4 × 10−659.90996.99 × 10−4107,3437930
50.79131.28618.4 × 10−670.56996.99 × 10−4109,64711,115
60.79061.28318.4 × 10−676.75996.99 × 10−4109,43811,289
70.80211.32118.4 × 10−687.97996.99 × 10−4112,50914,348
80.80541.33218.4 × 10−697.64996.99 × 10−4113,36615,874
90.80861.34218.4 × 10−6108.09996.99 × 10−4114,20416,901
100.81651.36918.4 × 10−6115.38996.99 × 10−4116,37418,933
Table 3. Constants and exponents in Equations (18) and (19).
Flow PatternBb1b2Cc1c2D
stratified0.1250.25−0.250.00010.200.330.33
plug, slug, churn0.0700.50−0.250.00180.450.660.11
Publisher’s Note: MDPI stays neutral with regard to jurisdictional claims in published maps and institutional affiliations.