1. Introduction
The photovoltaic (PV) single-diode model applied to the measured current–voltage (
I–
U) curves of the PV module provides a valuable tool for monitoring and diagnosing the condition of a PV system. Every
I–
U curve is characterized by a set of single-diode model parameters. Changes in these parameters can reveal changes in the condition of the PV module. Among the parameters, series resistance is especially useful in the detection of PV module aging and degradation [
1,
2]. The single-diode model parameters are obtained from measured
I–
U curves using a mathematical fitting procedure. Parameter identification techniques can be divided into offline and online techniques. The conventional offline parameter identification techniques require the measurement of the entire
I–
U curve, including its open-circuit (OC) and short-circuit (SC) ends. Unfortunately, this requires the PV system to be shut down for the period of diagnostic measurements, accompanied with power losses and undesired interruptions in electricity production. In contrast, online identification techniques utilizing only partially measured
I–
U curves are designed to avoid such interruptions. Therefore, online condition monitoring and diagnosis methods are strongly preferred in practical PV systems, and their development needs to be vastly enhanced.
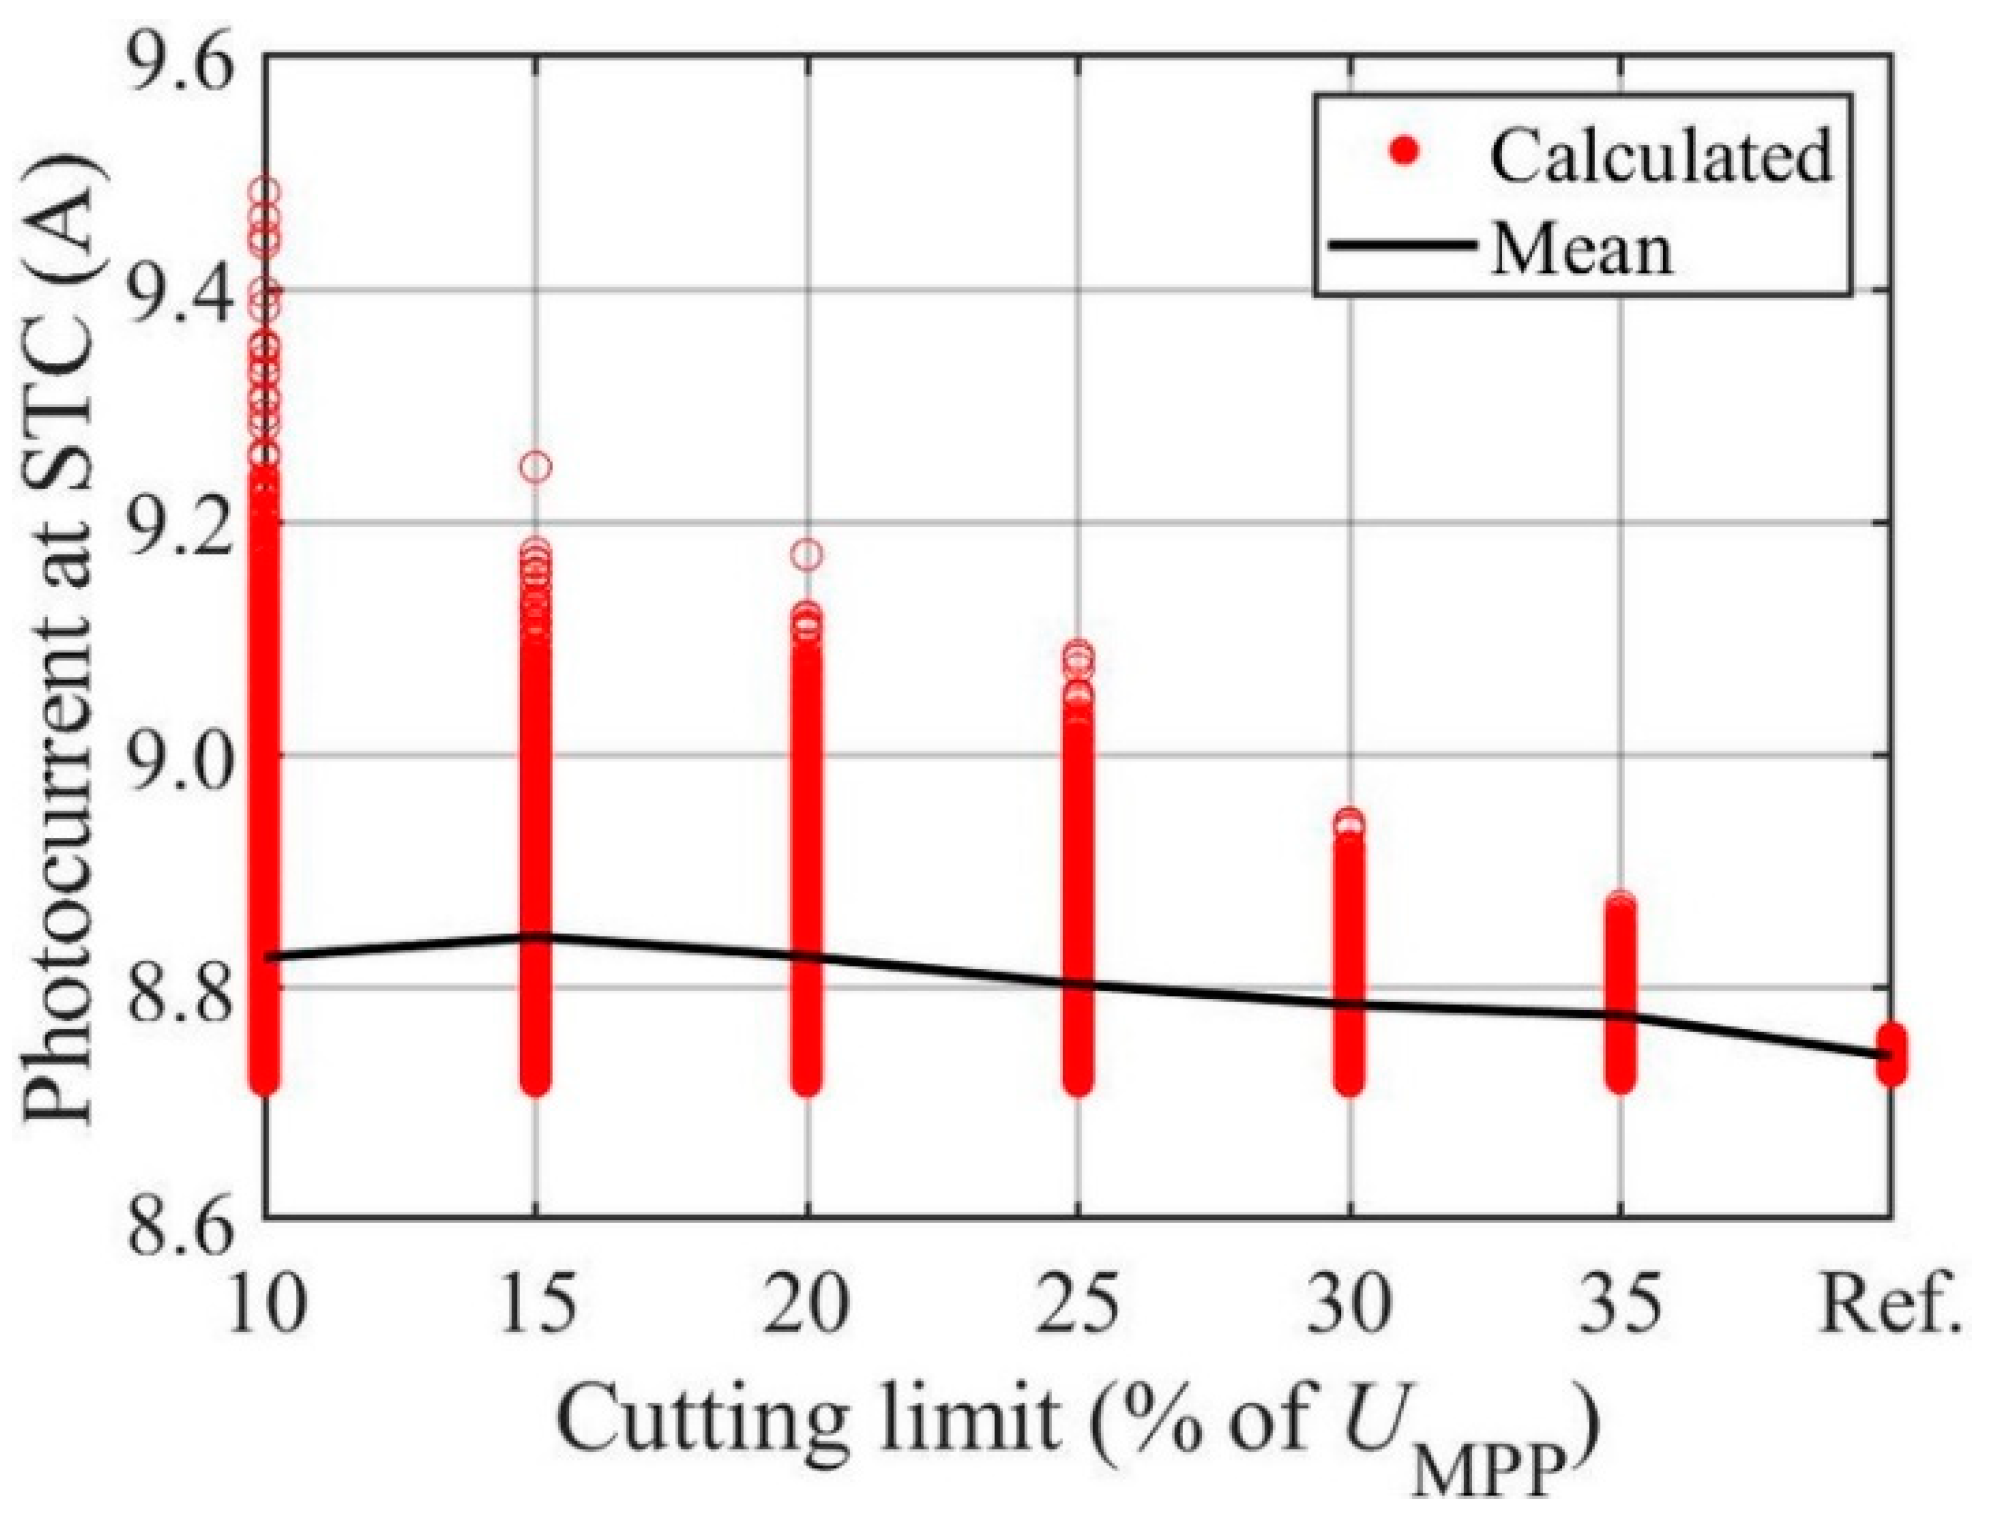
The practical requirement for single-diode model online parameter identification techniques is that the operating point does not need to move too far from the maximum power point (MPP). The reduction in measurement data available for curve fitting implies a compromise in the fit quality; single-diode model parameters obtained from a partial I–U curve measured in the vicinity of the MPP tend to suffer from lower accuracy. This holds especially for the series resistance parameter, which is extremely important in aging diagnostics. This issue raises the following yet unanswered questions: (1) how large should the proportion of the I–U curve measured for fitting be to maintain the sufficient accuracy of the identified parameters and (2) how should the MPP environment be selected for analysis so that all parameters, especially the series resistance, are identified with sufficient accuracy? For the first time, these questions are answered in a comparative and statistically plausible manner in the present study.
In the literature, some light has been shed on the described problematics. Several authors, having first applied their developed
I–
U curve fitting procedures to the entire curve, also tested the capability of the procedure using partial
I–
U curves. The choice of the used partial
I–
U curves varied from author to author. The authors of [
3] showed an example of fitting the model to a partial
I–
U curve obtained by moving 3 V to both sides from the MPP voltage (
UMPP) of a PV module. Consequently, the entire OC slope of the
I–
U curve became well repeated, while the SC slope of the fitted curve overshot clearly. Alternatively, the authors suggested choosing the neighbourhood symmetrically with respect to the MPP power (
PMPP) and presented an example where the
I–
U curve cutting limit was 90% of
PMPP. Such cutting made the fitted series resistance increase and the shunt resistance decrease compared with the values obtained using the entire curve. In [
4], partial
I–
U curves were formed by selecting 30% of the measurement points closest to the MPP for fitting. The fitting test performed under high-irradiance conditions (with high irradiance being the optimal operating region to guarantee the proper performance of the single-diode model and especially series resistance identification [
1]), revealed that the partial
I–
U curve produced smaller series resistance values than the entire curve. The normalized root mean square errors (nRMSEs) were approximately 2% and 5% for the entire and partial curves in [
4], respectively. The authors of [
5] also validated their curve fitting method to partial
I–
U curves using 50% of the measurement points, selecting those closest to the MPP. It was found that their curve fitting method performed well also in the case of such partial
I–
U curves. The author of [
6] investigated the usability of their model with partial
I–
U curves by choosing measurement points so that the ratio between the highest voltage values of the partially and the fully measured curves was around 90% and the ratio between highest current values of the partial and full curves was around 98%. The fitting was observed to perform acceptably in such cases. However, showing only one or a few examples of constructing partial
I–
U curves is not sufficient to find an optimal way to measure partial
I–
U curves in the vicinity of the MPP for fitting. In order to rectify this shortcoming, the present paper exploits an exactly determined systematic approach for that purpose. Indeed, partial
I–
U curves constructed step by step starting from the full
I–
U curve are used in this study. This approach enables a consistent analysis of the effect of the selection of the measurement region on the fit, which in turn guarantees the usability of the obtained results for further theoretical analyses as well as real practical applications in the condition monitoring of PV systems.
Some studies have compared the effect of the location of special points picked around the MPP for fitting. The authors of [
7] picked four points in the vicinity of the MPP for single-diode model fitting and investigated the effect of the location of the selected points on the fit quality. The authors found that the optimal trade-off was obtained by selecting two points from both sides of the MPP. Such a configuration allowed them to capture the exponential curvature around the MPP correctly, resulting in equally good fit qualities in the OC and SC ends of the
I–
U curve. In [
8], it was observed that eight measurement points with a spacing of 1 V were sufficient to capture the MPP curvature of a PV module. The authors justified this with two observations. Firstly, a 15% voltage reduction to the left of the MPP voltage was noticed to be usually sufficient to reach the almost linear high-current region of the
I–
U curve. Secondly, test points up to 60–75% of the MPP current (
IMPP) were selected on the right side of the MPP as suggested in [
2] to properly identify series resistance. The fitting test performed under high-irradiance conditions provided good results, although the power was only reduced by less than 11% of
PMPP. In [
9,
10], six points divided into two three-point blocks were chosen around the MPP. In [
10], it was observed that the voltage separation of the points in the same block should not exceed 5% of the first selected voltage point. In addition, the difference between the central points of the two blocks should be less than 20% of the voltage at the central point of the first block. When the voltage steps determining the density of the selected points were chosen as 2% of
UMPP [
9], the OC end of the fitted curve overshot clearly, and the SC end undershot slightly. However, setting the voltage steps as 2.5% of
UMPP significantly improved the fit quality, causing only a slight undershoot at the OC end of the fitted curve and an overshoot at the OC end. The authors of [
11] also adopted the principle of the point selection strategy of [
9,
10], but the location of the six points selected for fitting was sparser. The authors of [
12] used four arbitrary points on the
I–
U curve jointly with the slopes of the
I–
U curve at these points. The four points were selected differently for different tests. The presented method worked even when restricting the
I–
U curve in the vicinity of the MPP at voltage limits of about 2–3% of
UMPP. However, all the above studies only used some special points picked around the MPP for fitting, and a comprehensive picture and a systematic analysis of the effects of constructing a partial
I–
U curve on fitting accuracy were lacking. In contrast, point selection for fitting is performed in the present study in a manner that is computationally systematic and also comparable on a wider scale.
What all the above studies have in common is that they mainly examined the fitting of the single-diode model only in certain cases of partial
I–
U curves, i.e., by means of examples. To the best of our knowledge, there exists only one published research paper [
13] in which the measured
I–
U curve was piecewise cut into a smaller portion and the effects of cutting on the fitted single-diode model parameters were investigated. It was found that the identification of the single-diode model parameters and outdoor conditions performed well even in close vicinity of the MPP. Such an observation is crucial for the online identification of the model parameters. Unfortunately, in [
13], the identification of the single-diode model parameters was studied with only a small number of 20
I–
U curves based on
PMPP percentages, and there exists no similar study with a larger number of data that provides statistically plausible results. Moreover, no
I–
U curve cutting methods other than cutting based on
PMPP percentages have been investigated in a systematic manner. Both shortcomings are extremely important for the development of the online condition monitoring of photovoltaic systems and are concisely addressed in this work.
The present paper provides a systematic study on how limiting the measurement region to partial
I–
U curves in the vicinity of the MPP affects the accuracy of the fitted single-diode model parameters. The analysis is based on numerous data, with 2400 measured current–voltage curves, thus employing many more data than the analyses in earlier studies; therefore, this study is the only one providing statistically plausible results. The raw measurement data obtained with the
I–
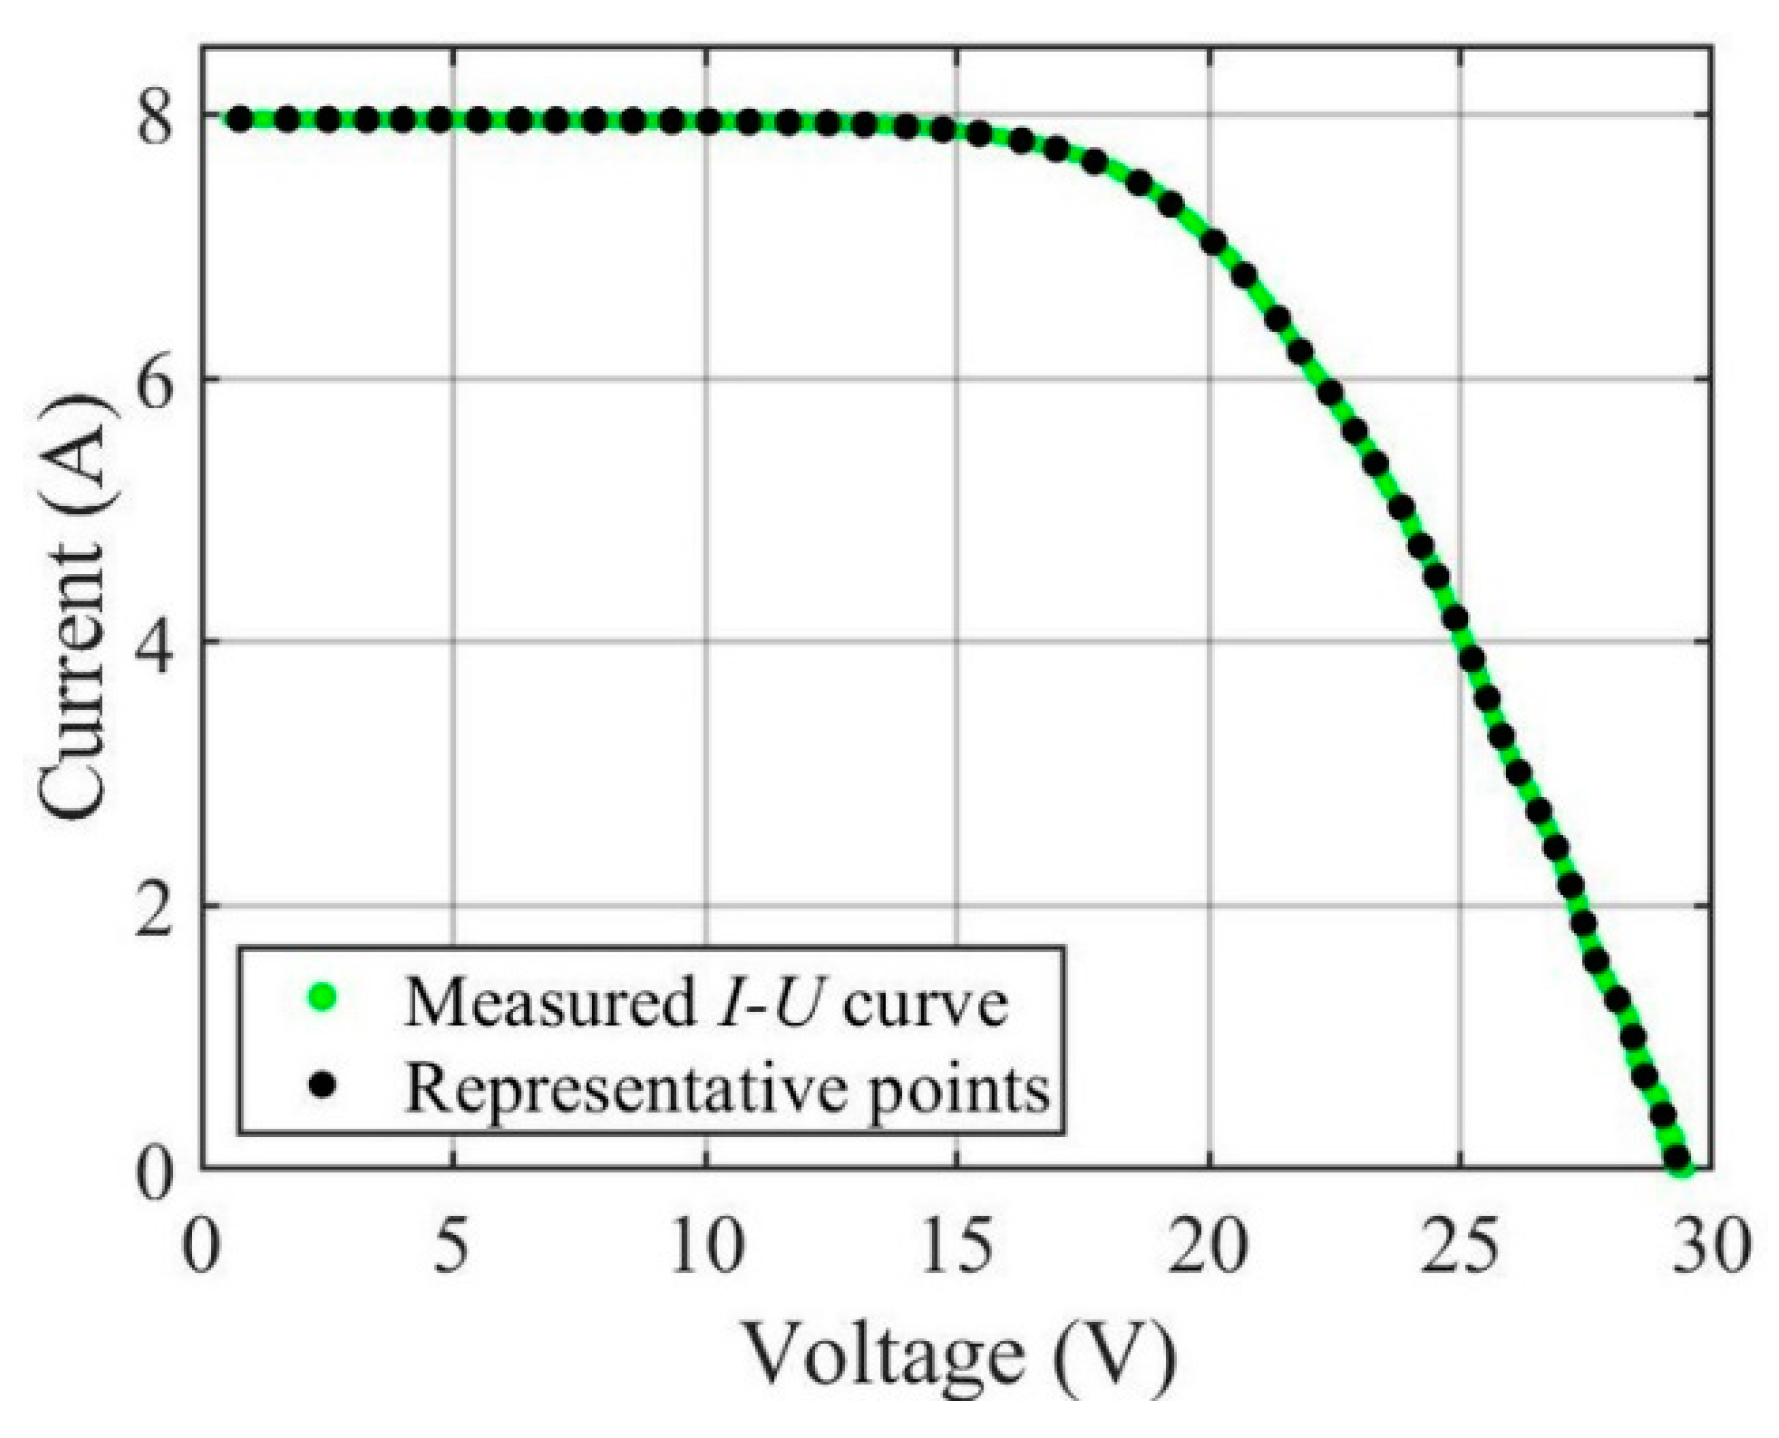
U curve tracer were processed using an advanced procedure: First, we removed abnormal measurement points; then, we distributed a fixed number of
I–
U points evenly along the
I–
U curve, as in [
14]. In this way, the correct weight of the different parts of the
I–
U curve was ensured, resulting in comparable results in each case studied. The selection of partial
I–
U curves was made using two alternative methods based on MPP power and MPP voltage. The latter method is systematically studied for the first time in this work. We also developed an advanced theoretical model and a procedure to fit the single-diode model directly to the measured
I–
U curves without the need to measure additional quantities, such as temperature or irradiance, or to use approximative fitting methods. Finally, the parameter values of the single-diode model obtained under certain irradiance and temperature conditions were converted to comparable values under standard test conditions (STCs).
The novelty of this work lies in both its theoretical and practical applicability to the condition monitoring of PV systems. Groundbreakingly, the results of the study provide clear guidance on how the choice of the partial I–U curve affects the accuracy of the parameters of the fitted single-diode model. Such relation is investigated in the present study for the first time. A very significant finding is that a correct selection of the vicinity of the maximum power point for fitting provides a promising opportunity to detect aging in real applications. Series resistance is a key quantity for aging detection, and we further investigated how the increase in the number of I–U curves used for fitting improves the accuracy of the identified average parameter value. Such information is of practical relevance when designing any I–U curve-based condition monitoring approach. As a final step, the suitability of the used single-diode model fitting procedure for PV module aging detection was demonstrated by utilizing full and partial I–U curves measured with additional series resistances. The findings clearly outline the correct selection of partial I–U curves used for aging detection.
The remainder of the paper is organized as follows:
Section 2 provides information about the mathematical single-diode model jointly with the used iterative fitting procedure; then, the used data and their pre-processing procedure are introduced. The presentation of the two different
I–
U curve cutting methods completes
Section 2. In
Section 3, the experimental results are presented and discussed. Finally,
Section 4 closes the paper.
4. Conclusions
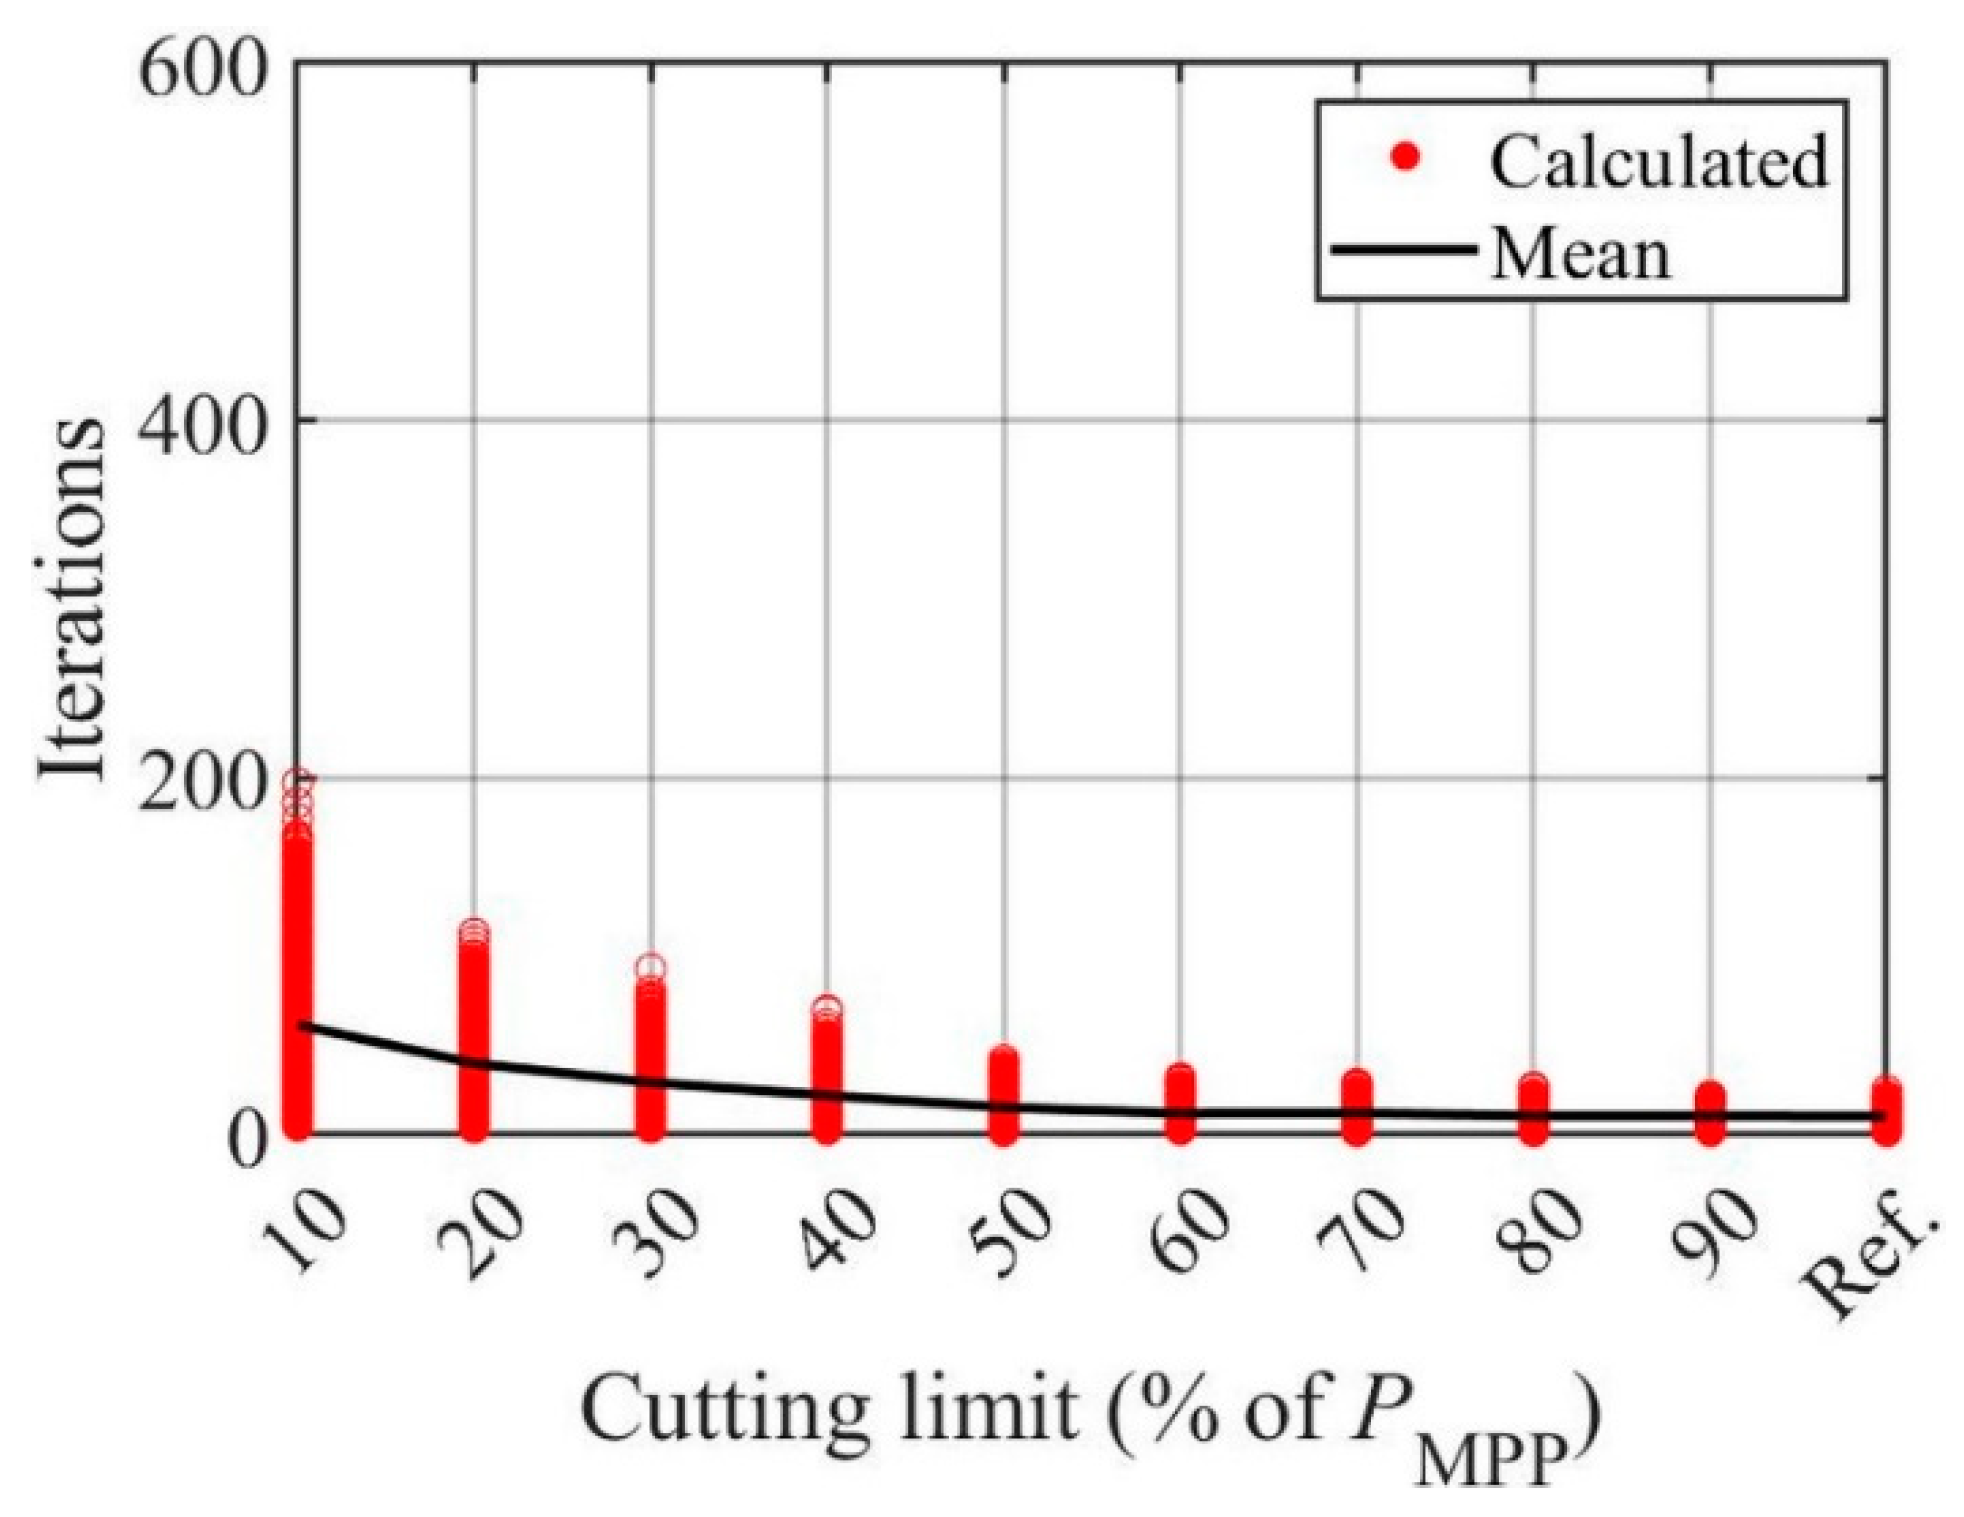
The present work provides a systematic analysis of how limiting the PV module I–U curves to the vicinity of the MPP affects the fitting accuracy of the single-diode model. Two I–U curve cutting approaches were examined, one of which has not been earlier systematically studied in the existing literature. In addition, the present paper is the first study to provide statistically reliable results; the experimental data of 2400 successive I–U curves were subjected to a detailed analysis. The used I–U curves were measured under high-irradiance conditions, where the single-diode model is known to work best.
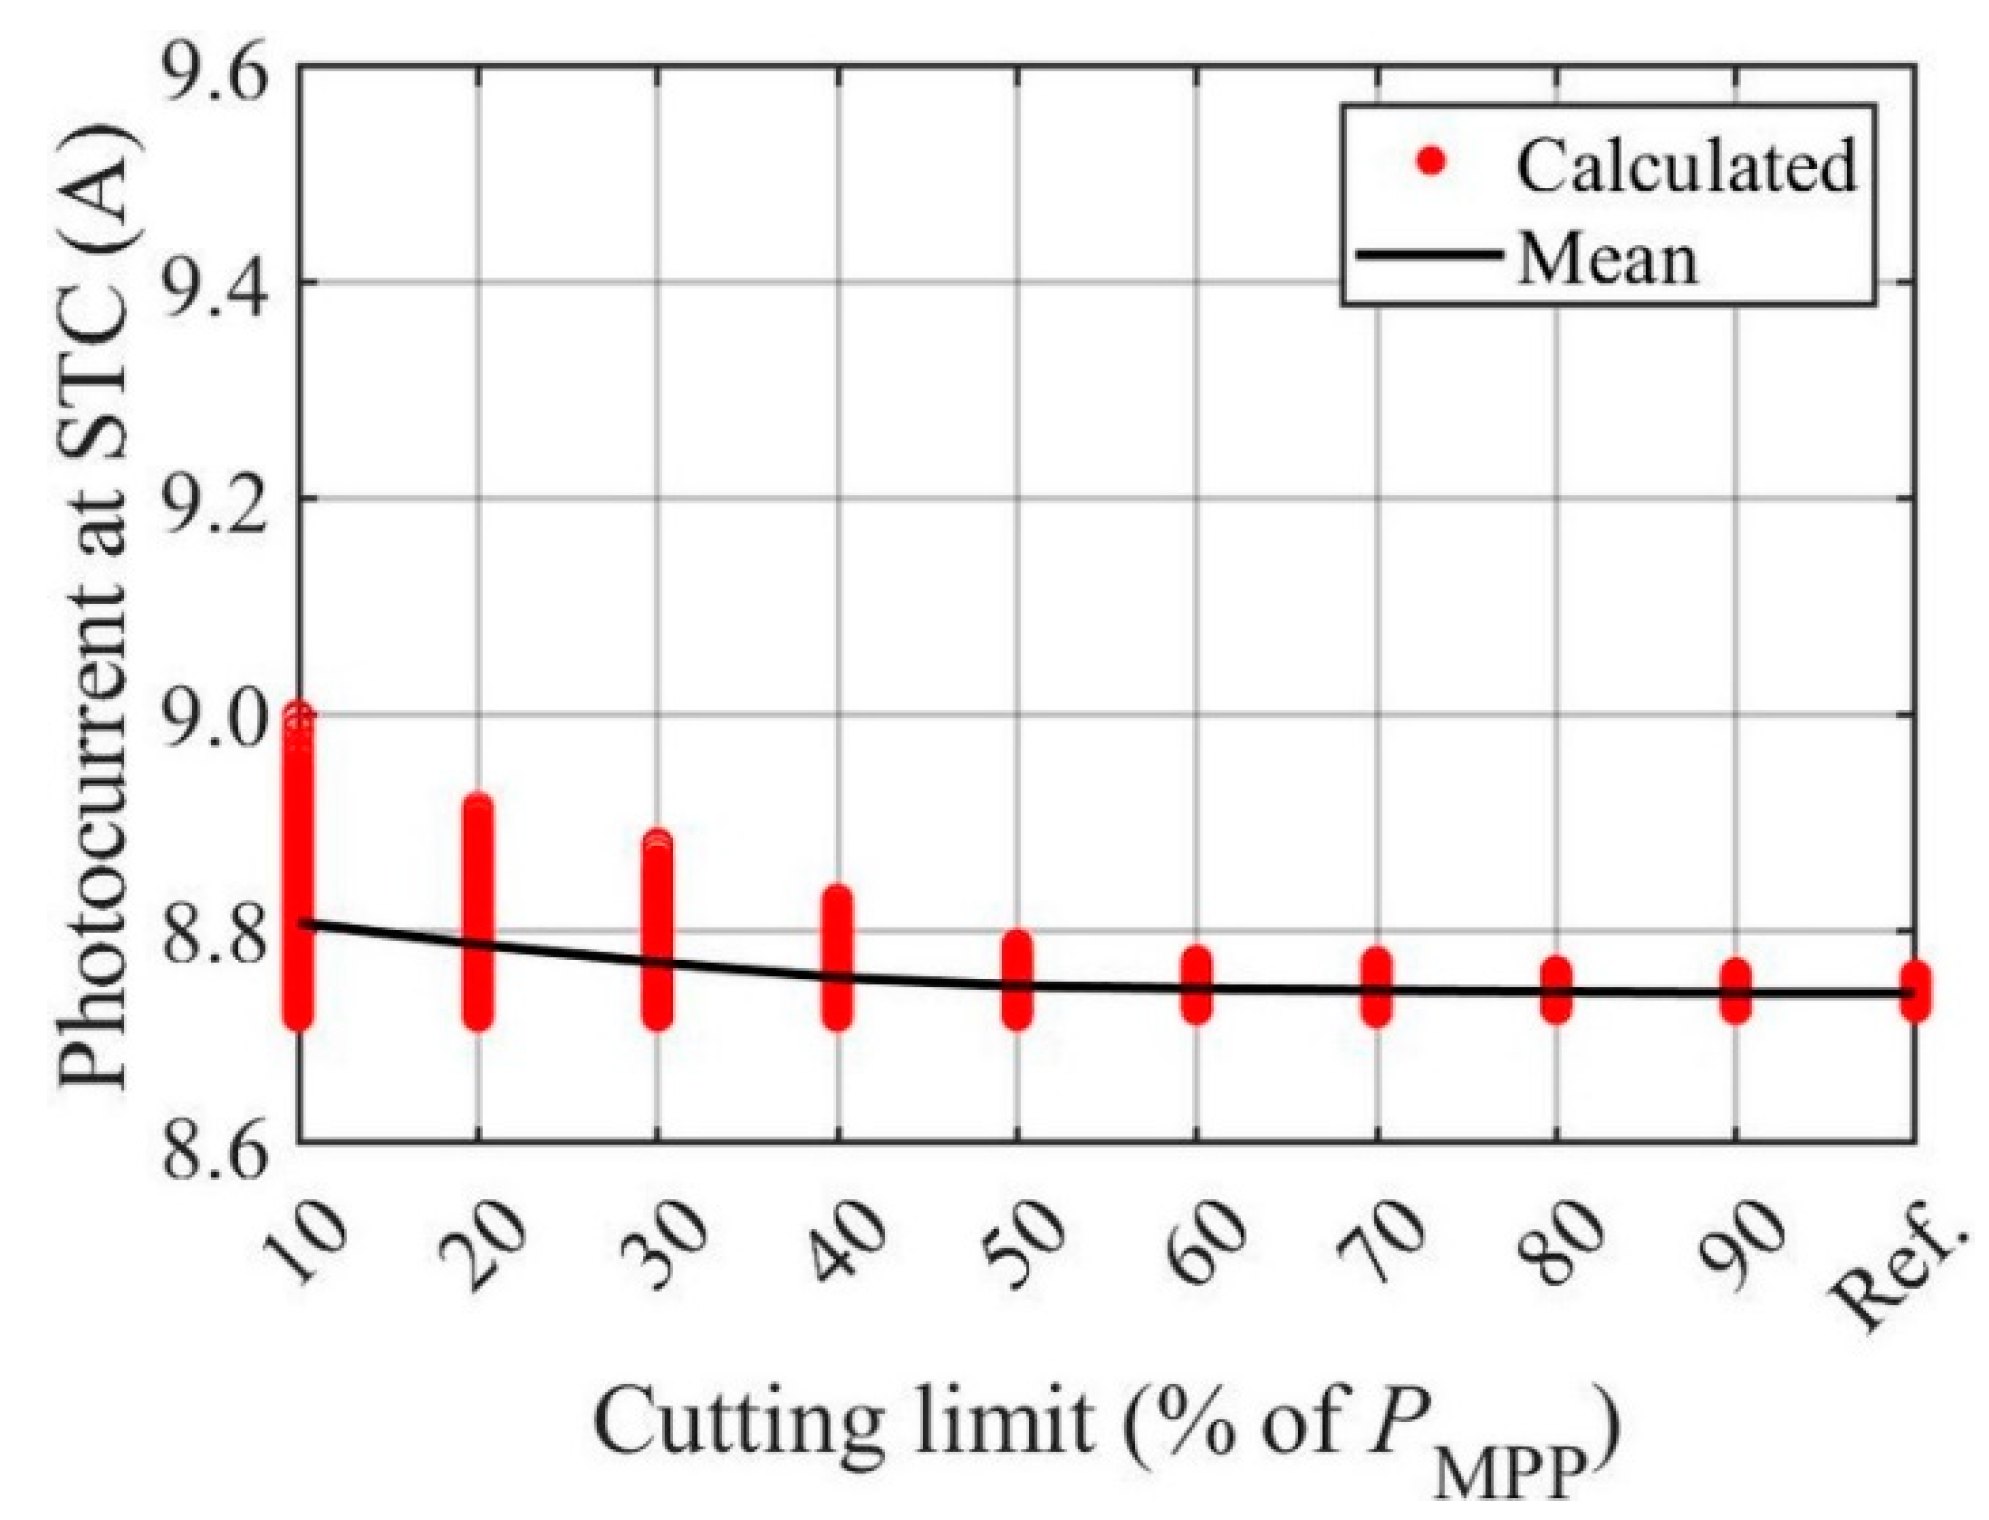
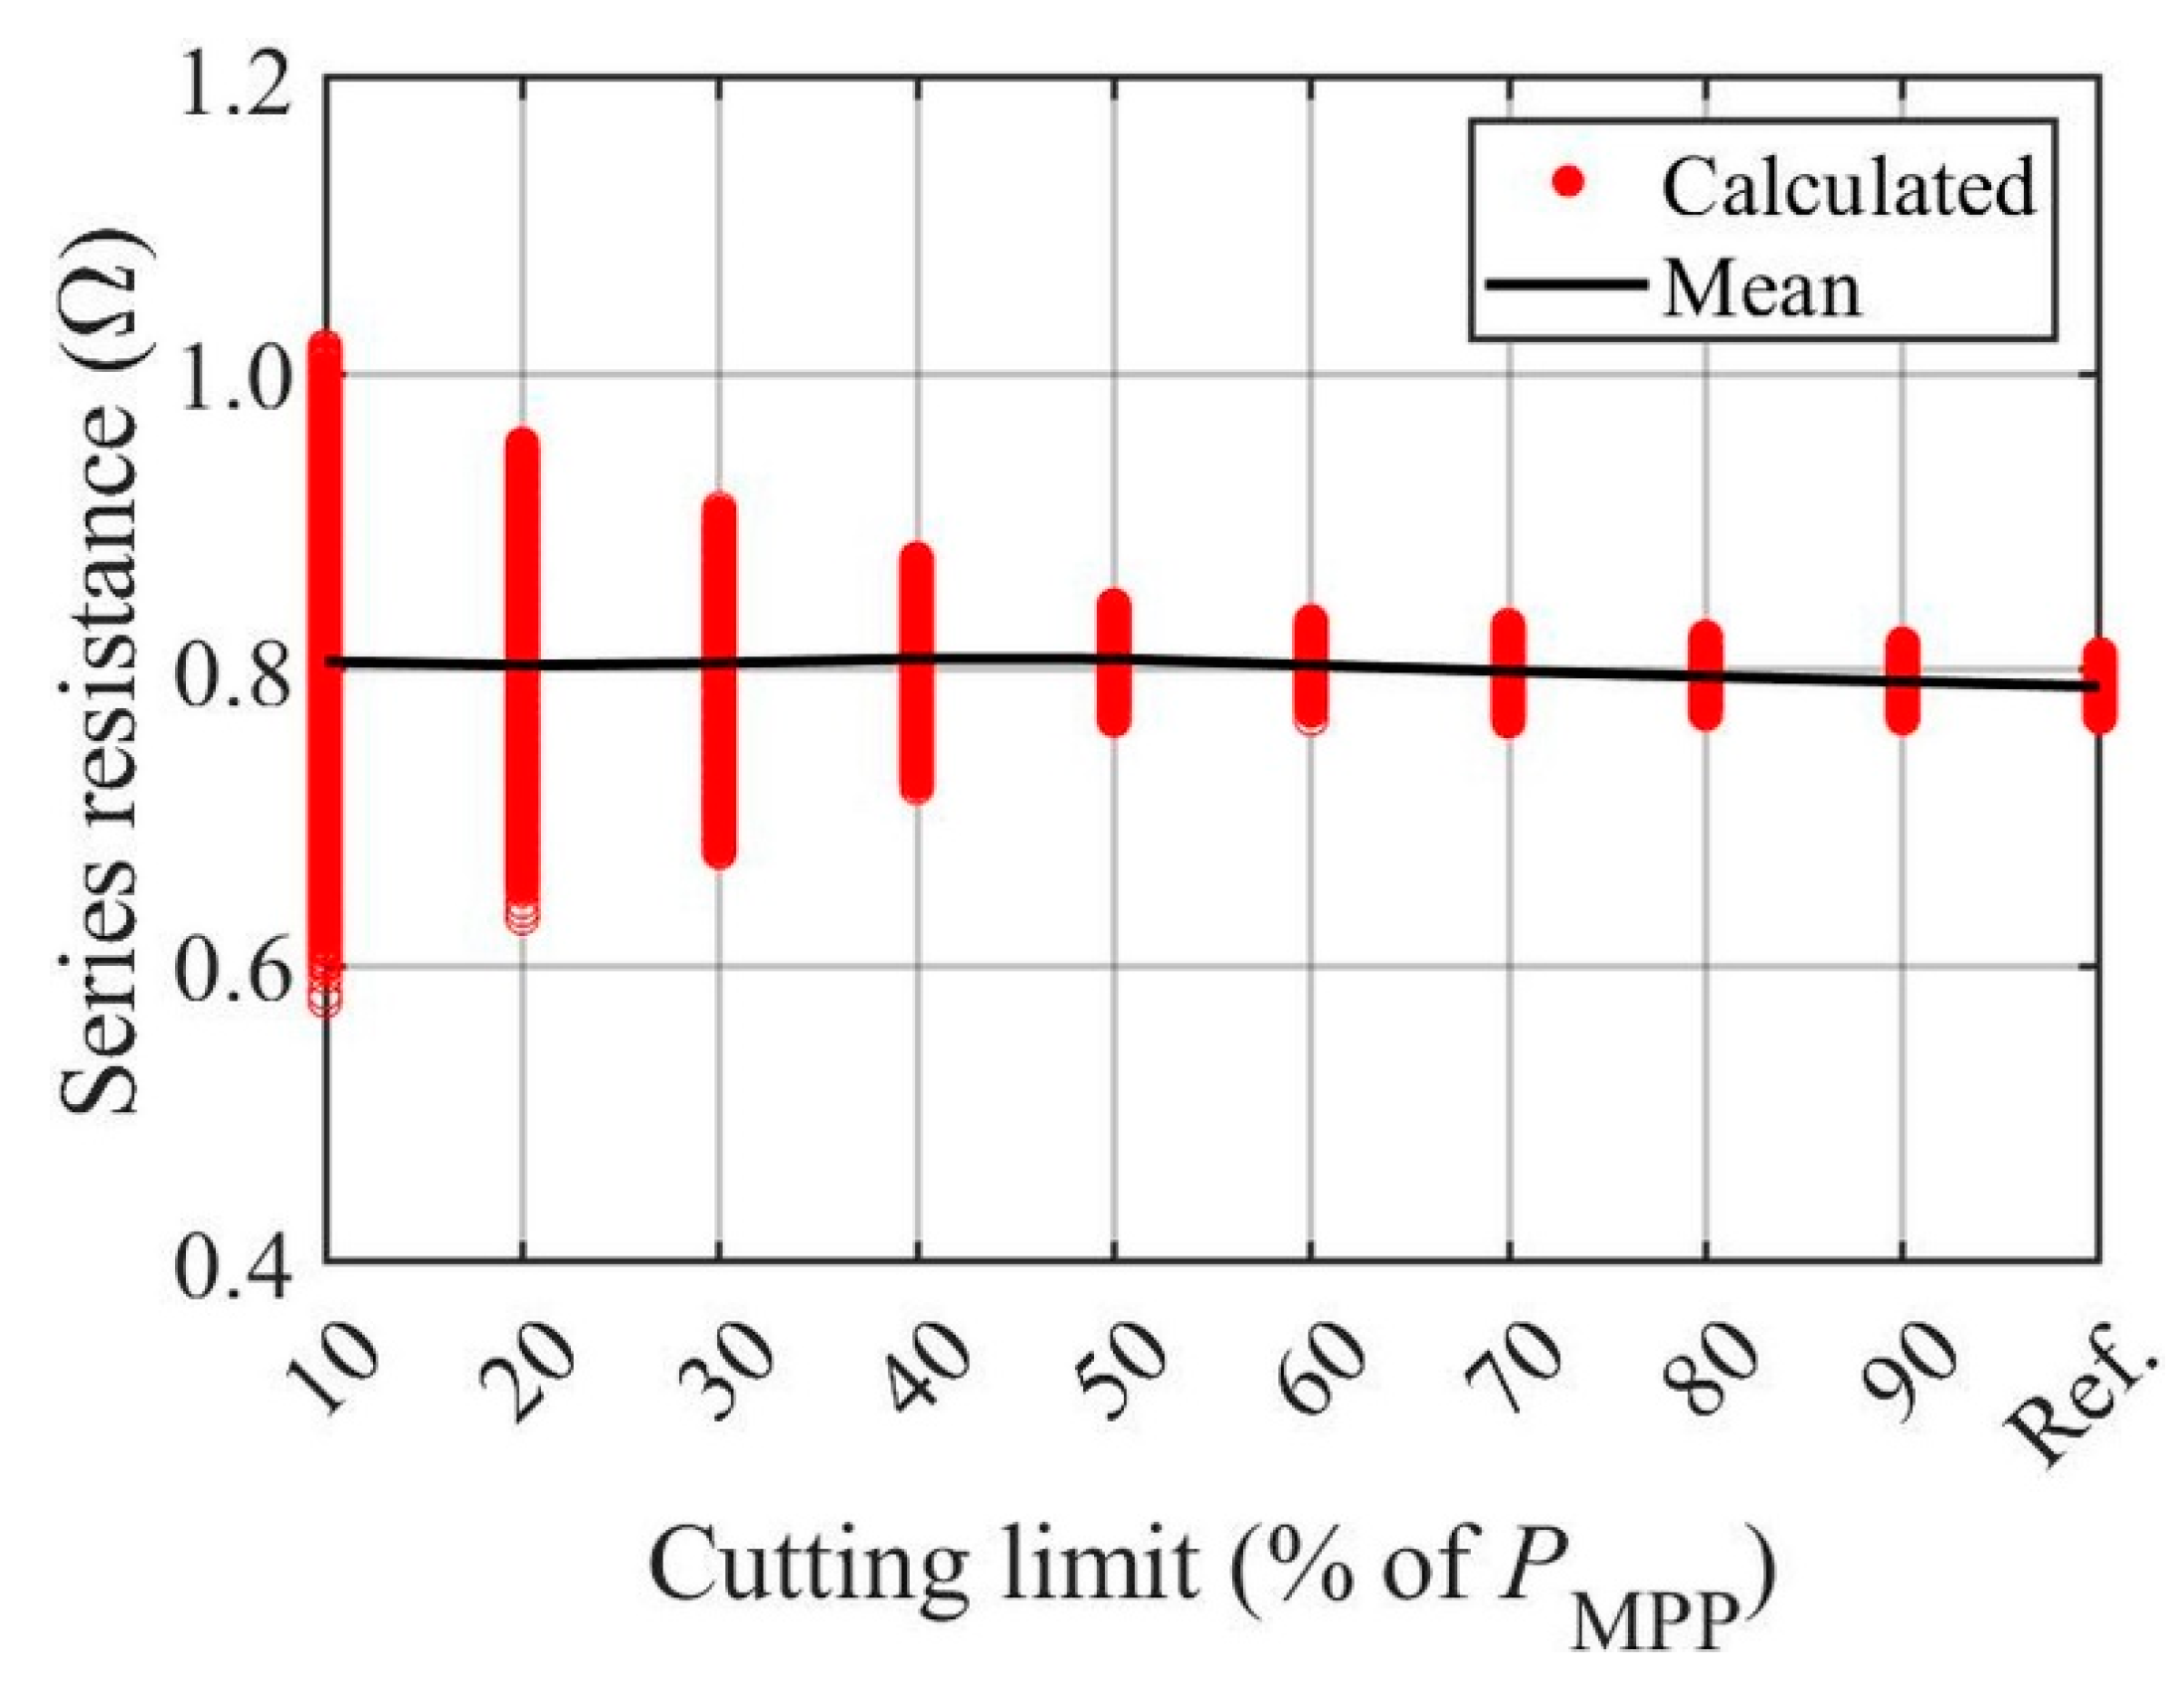
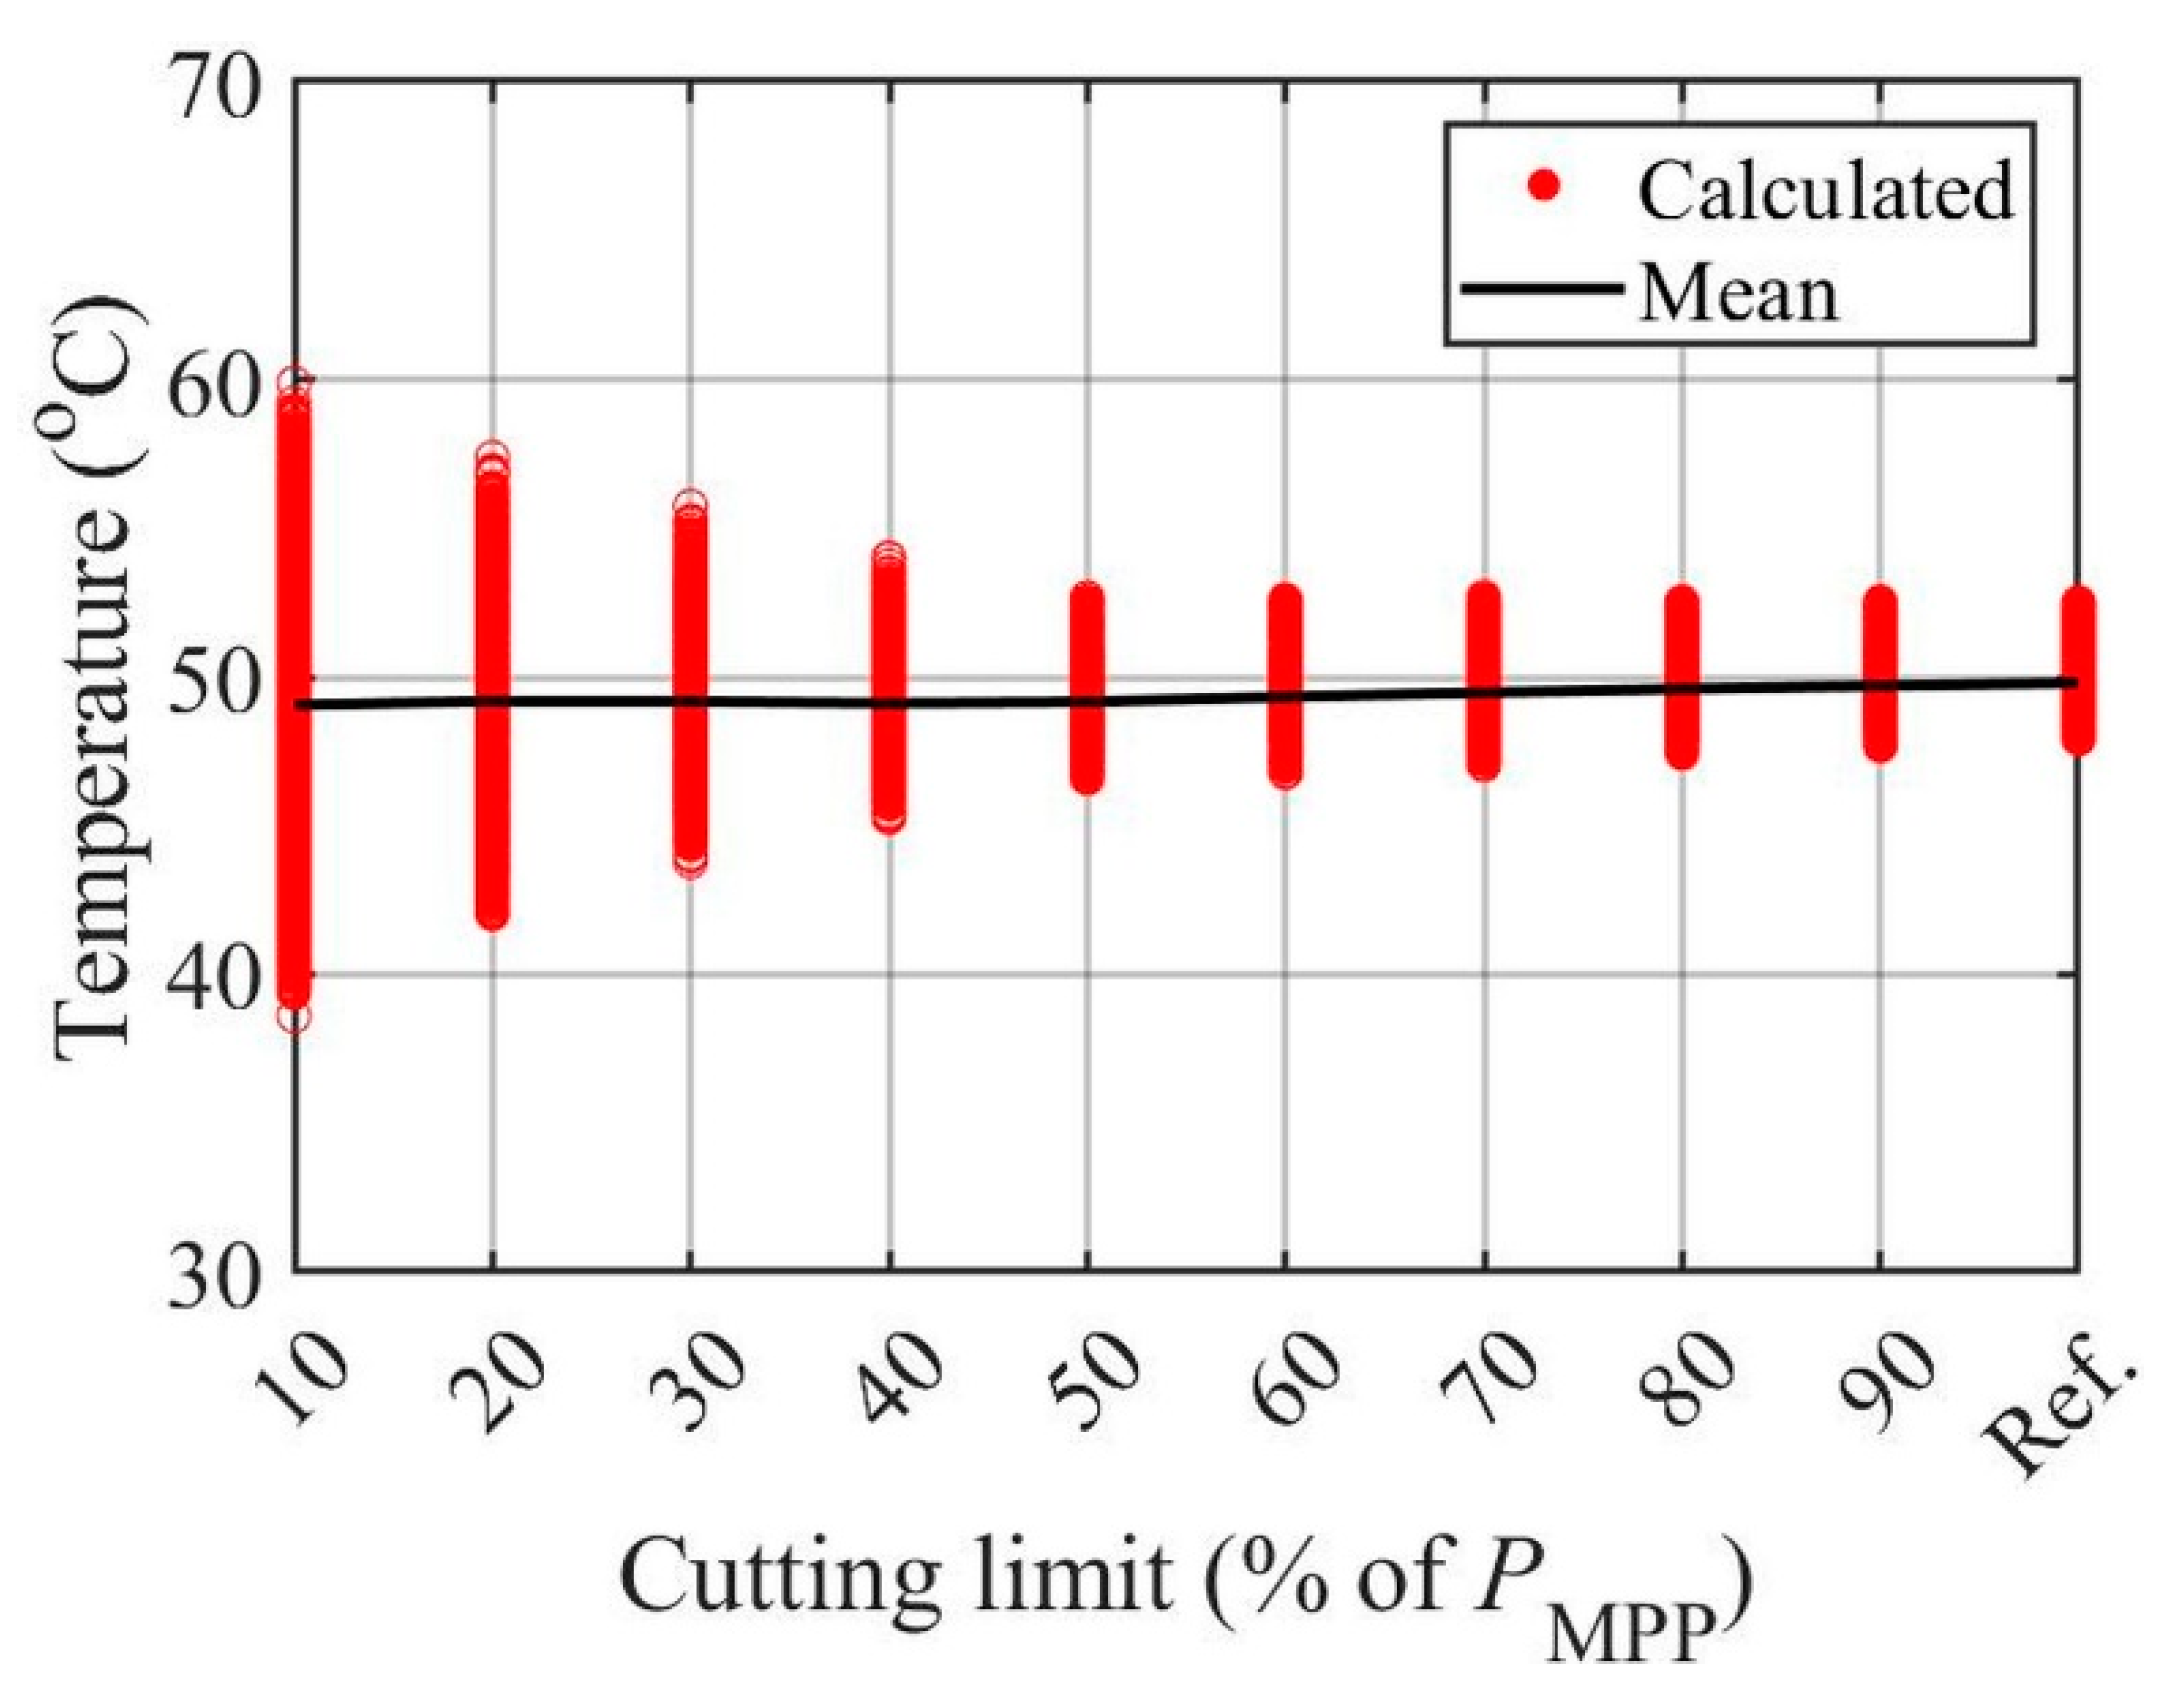
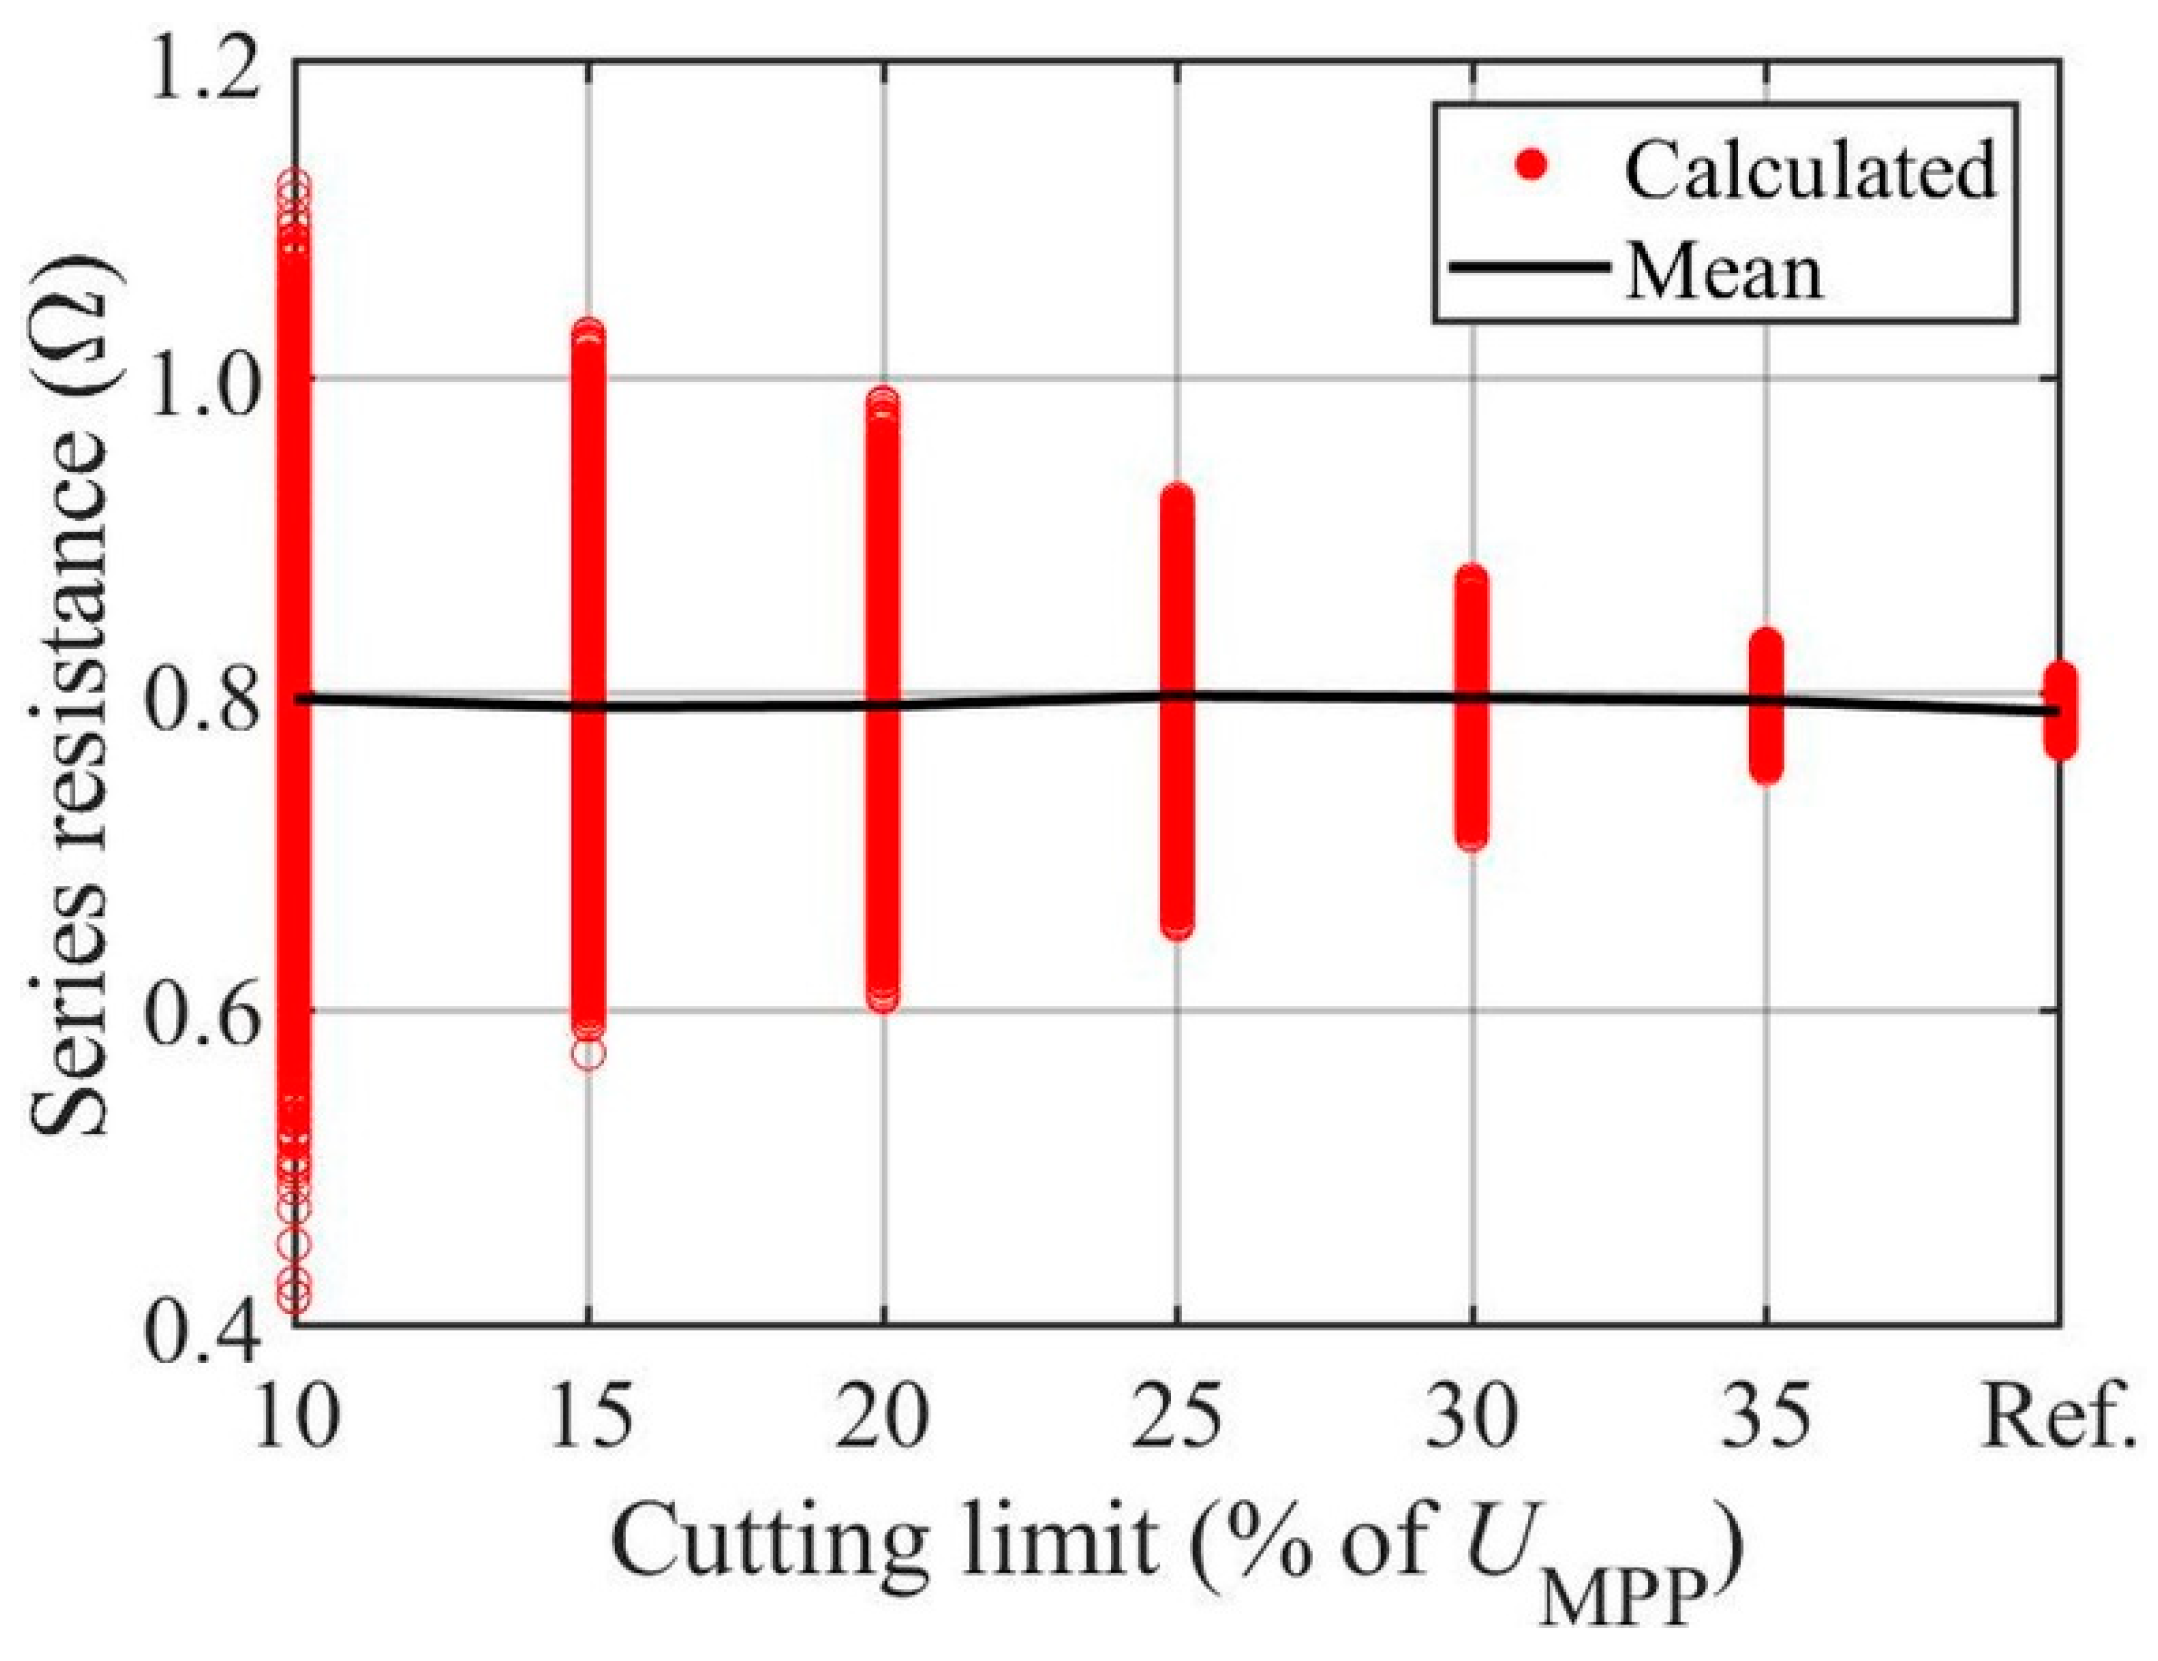
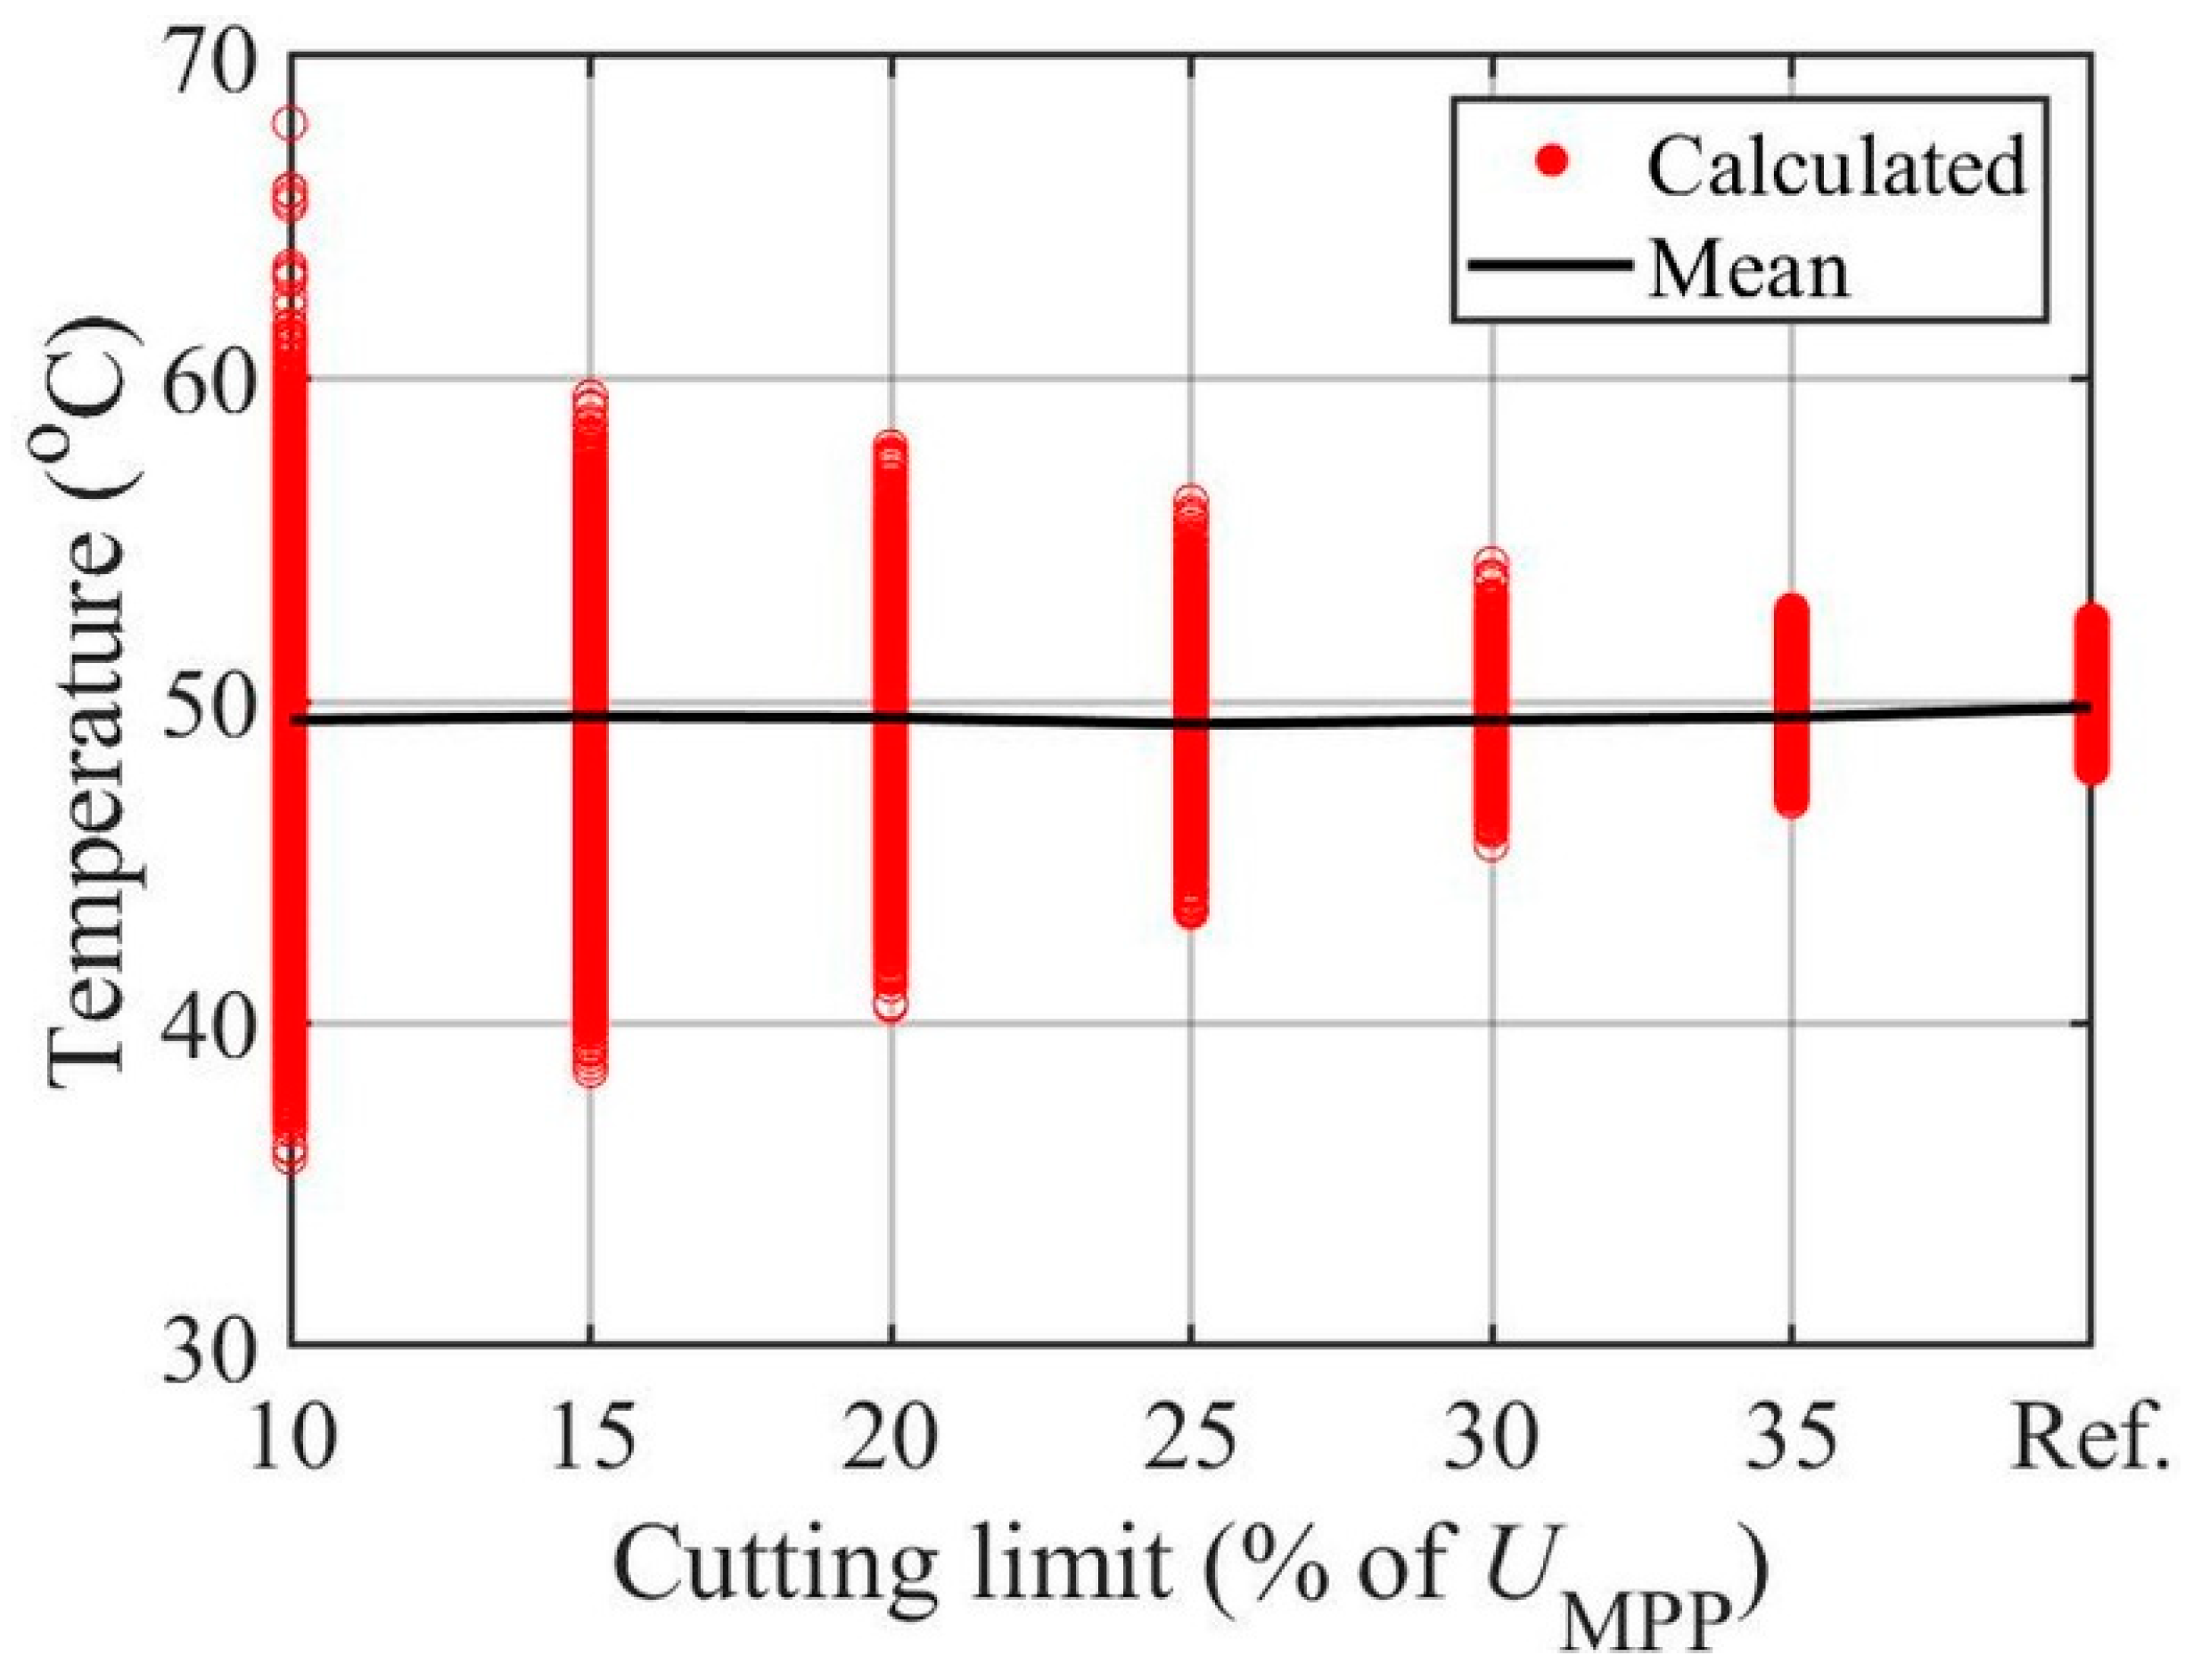
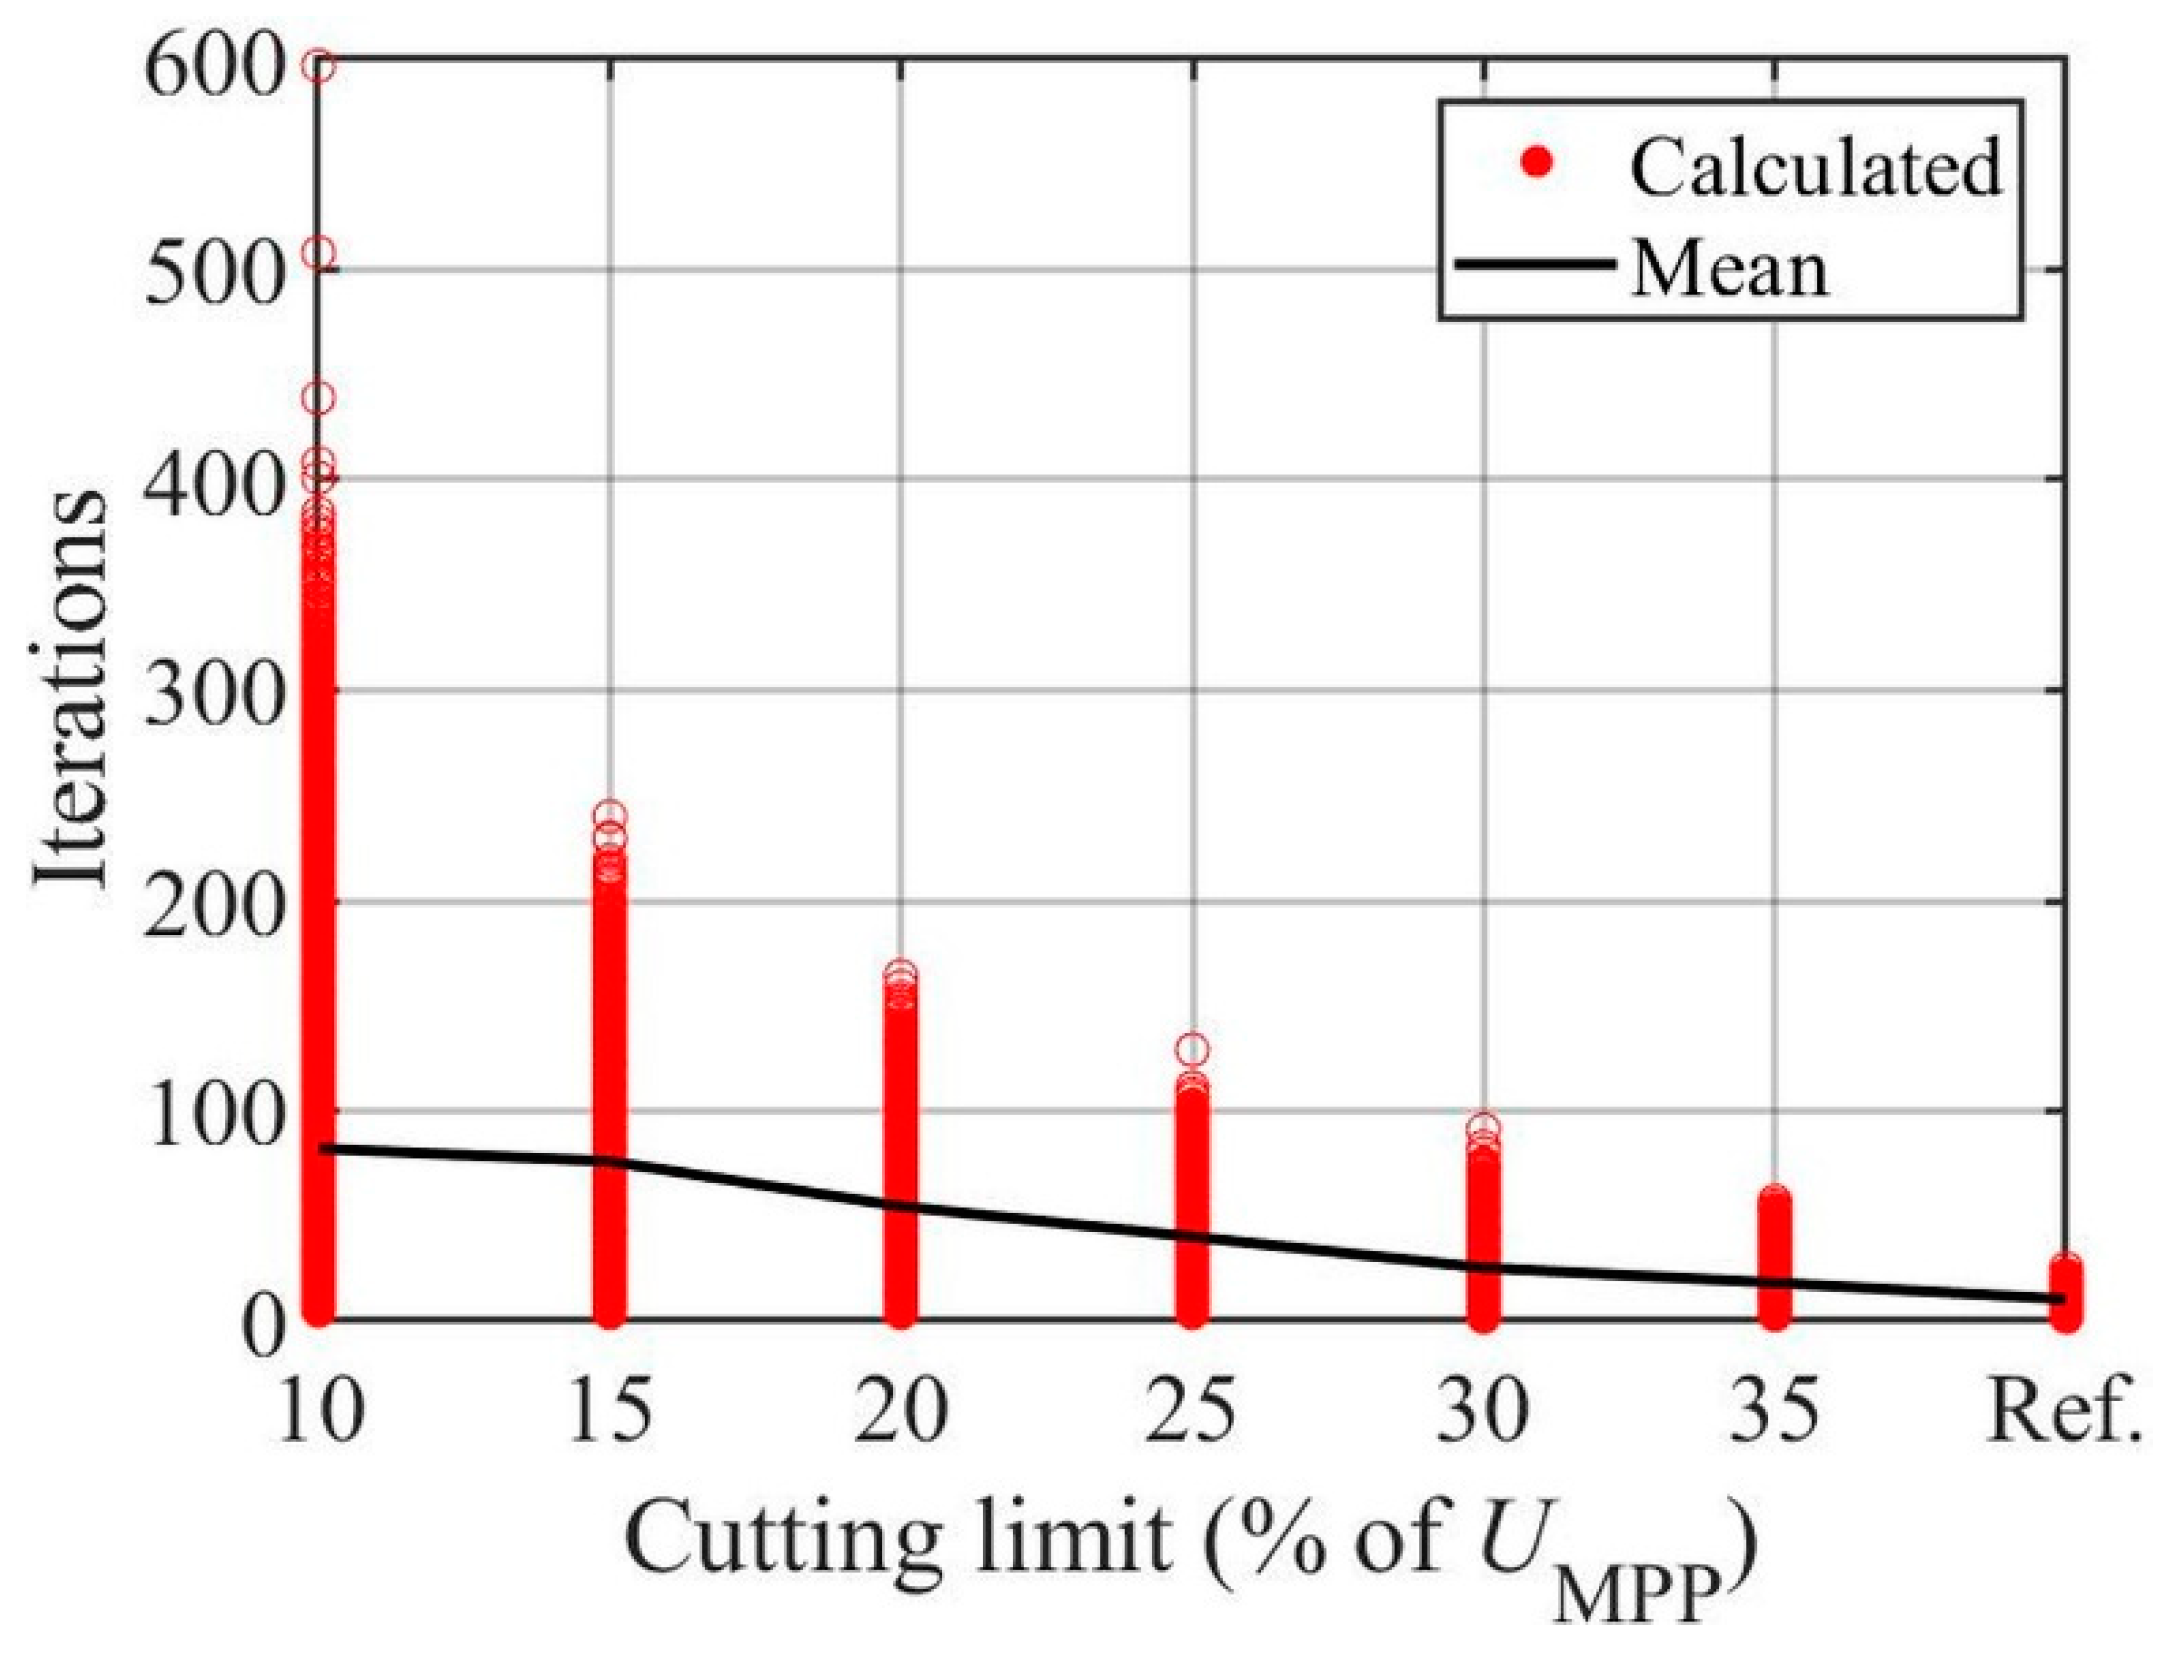
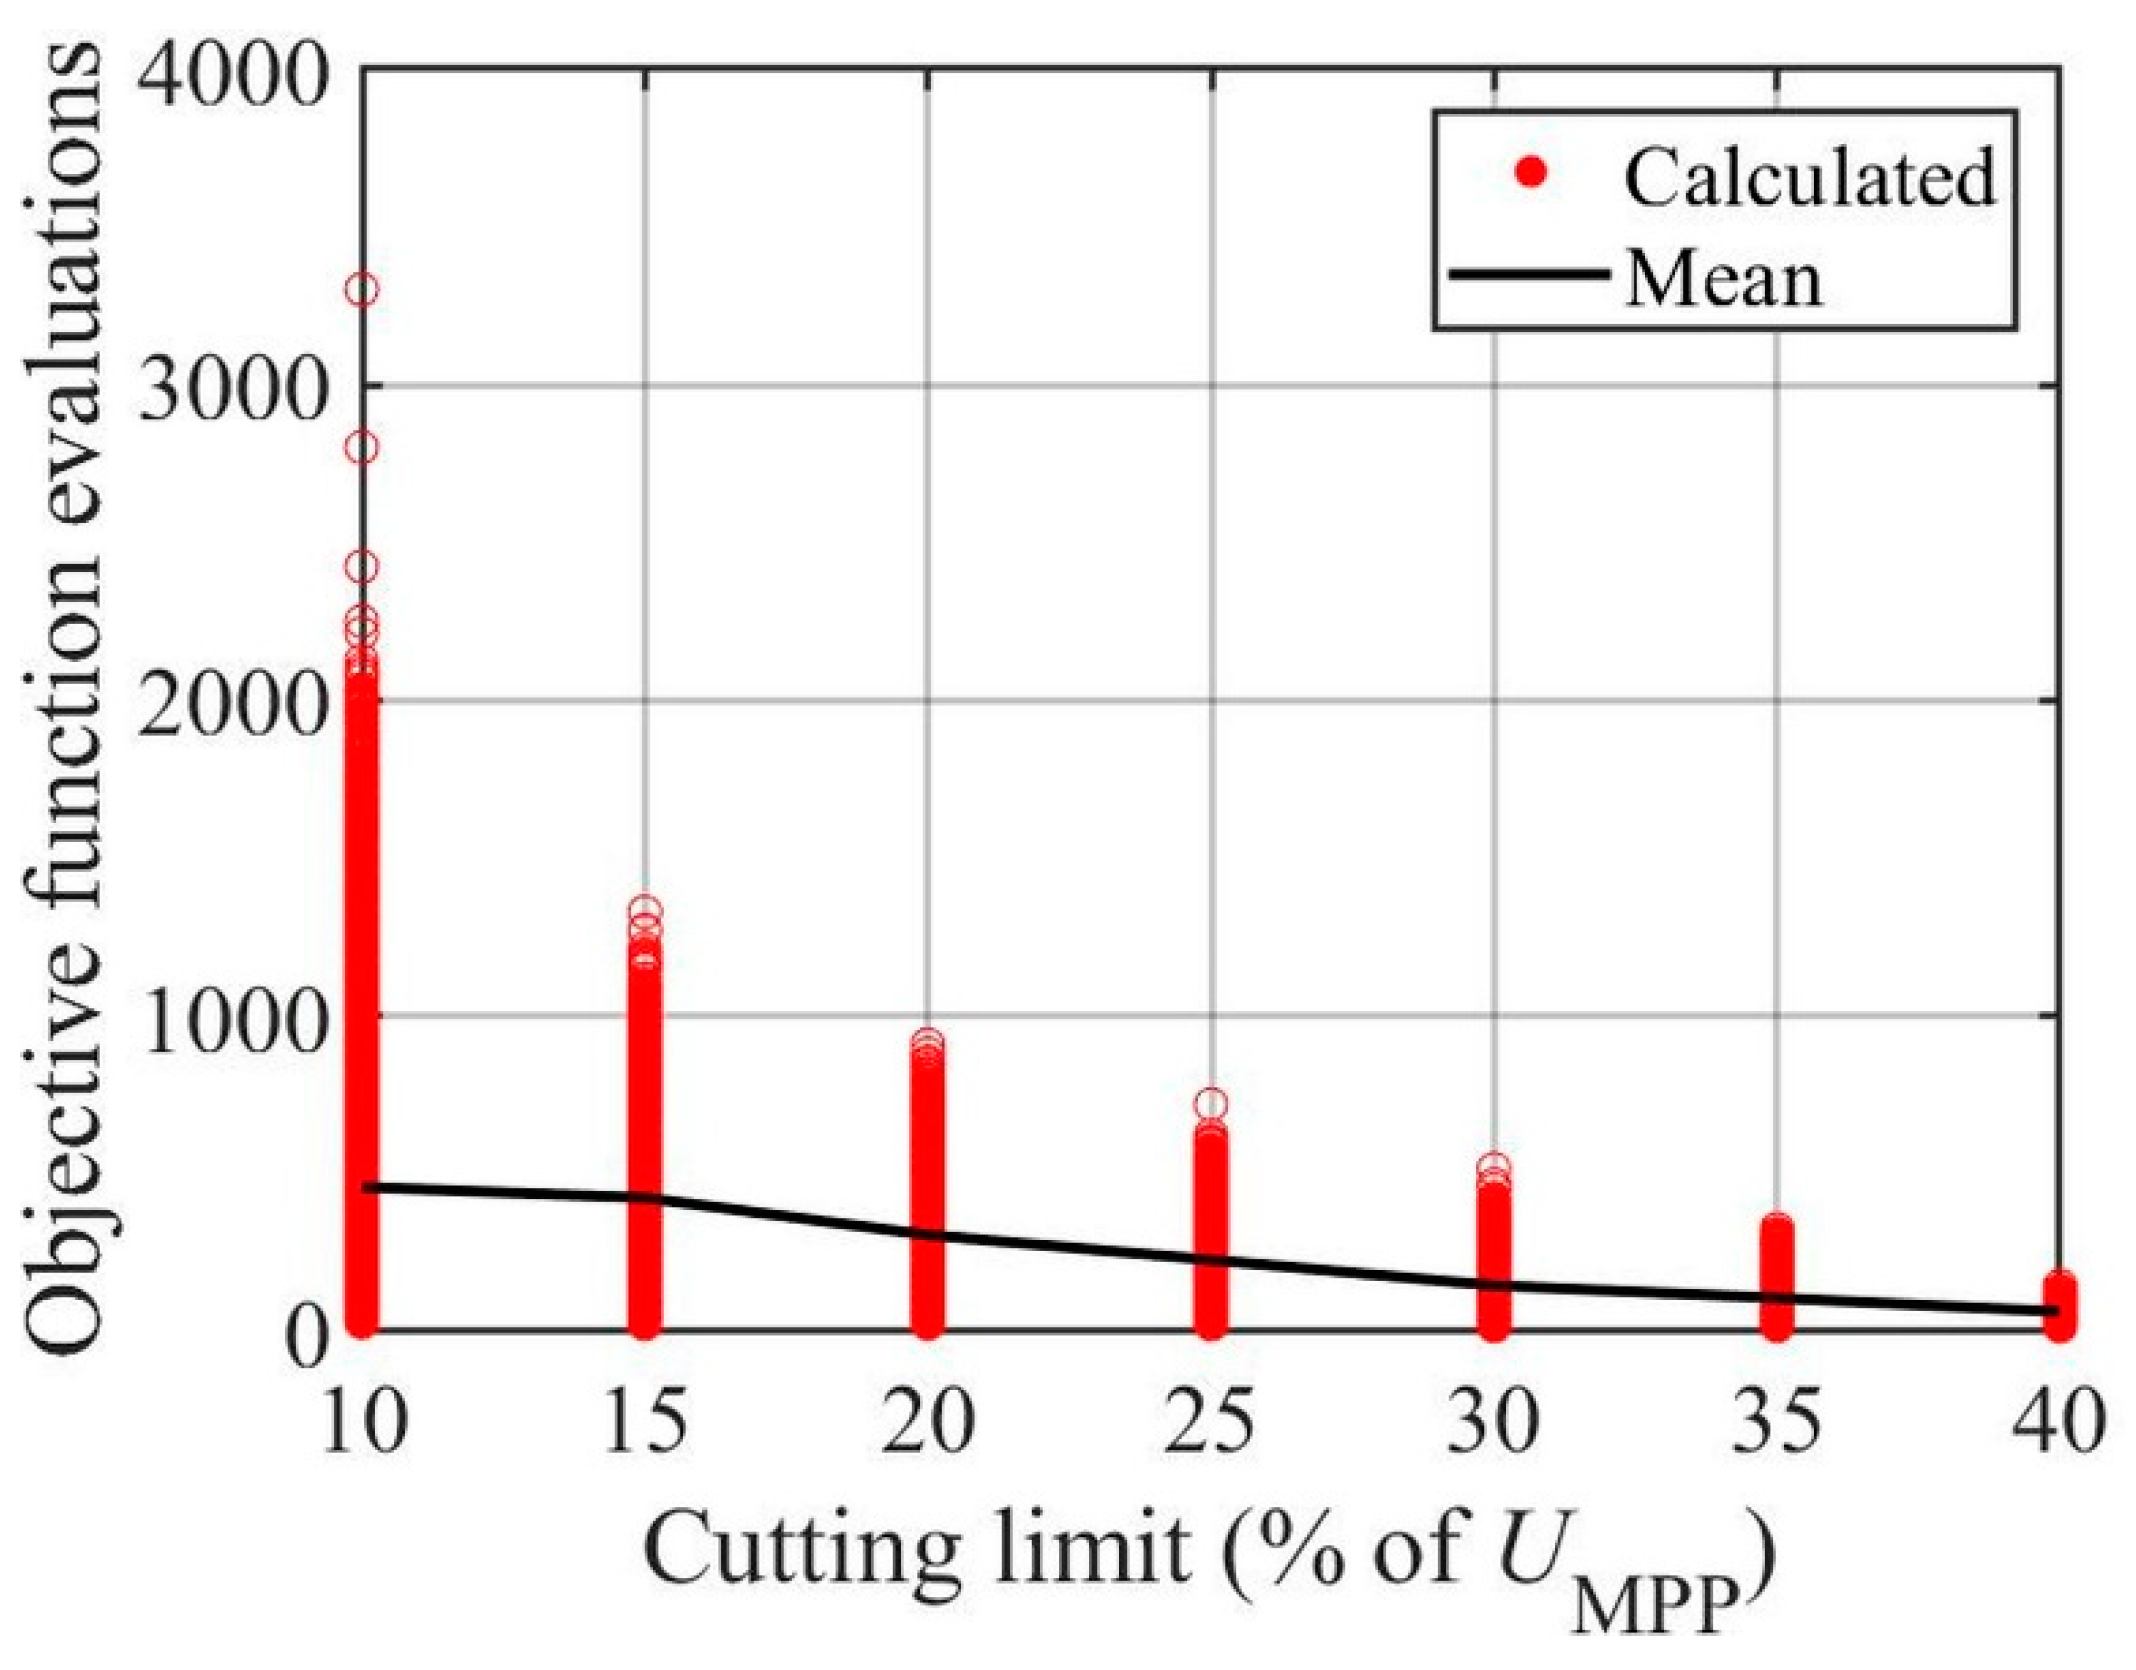
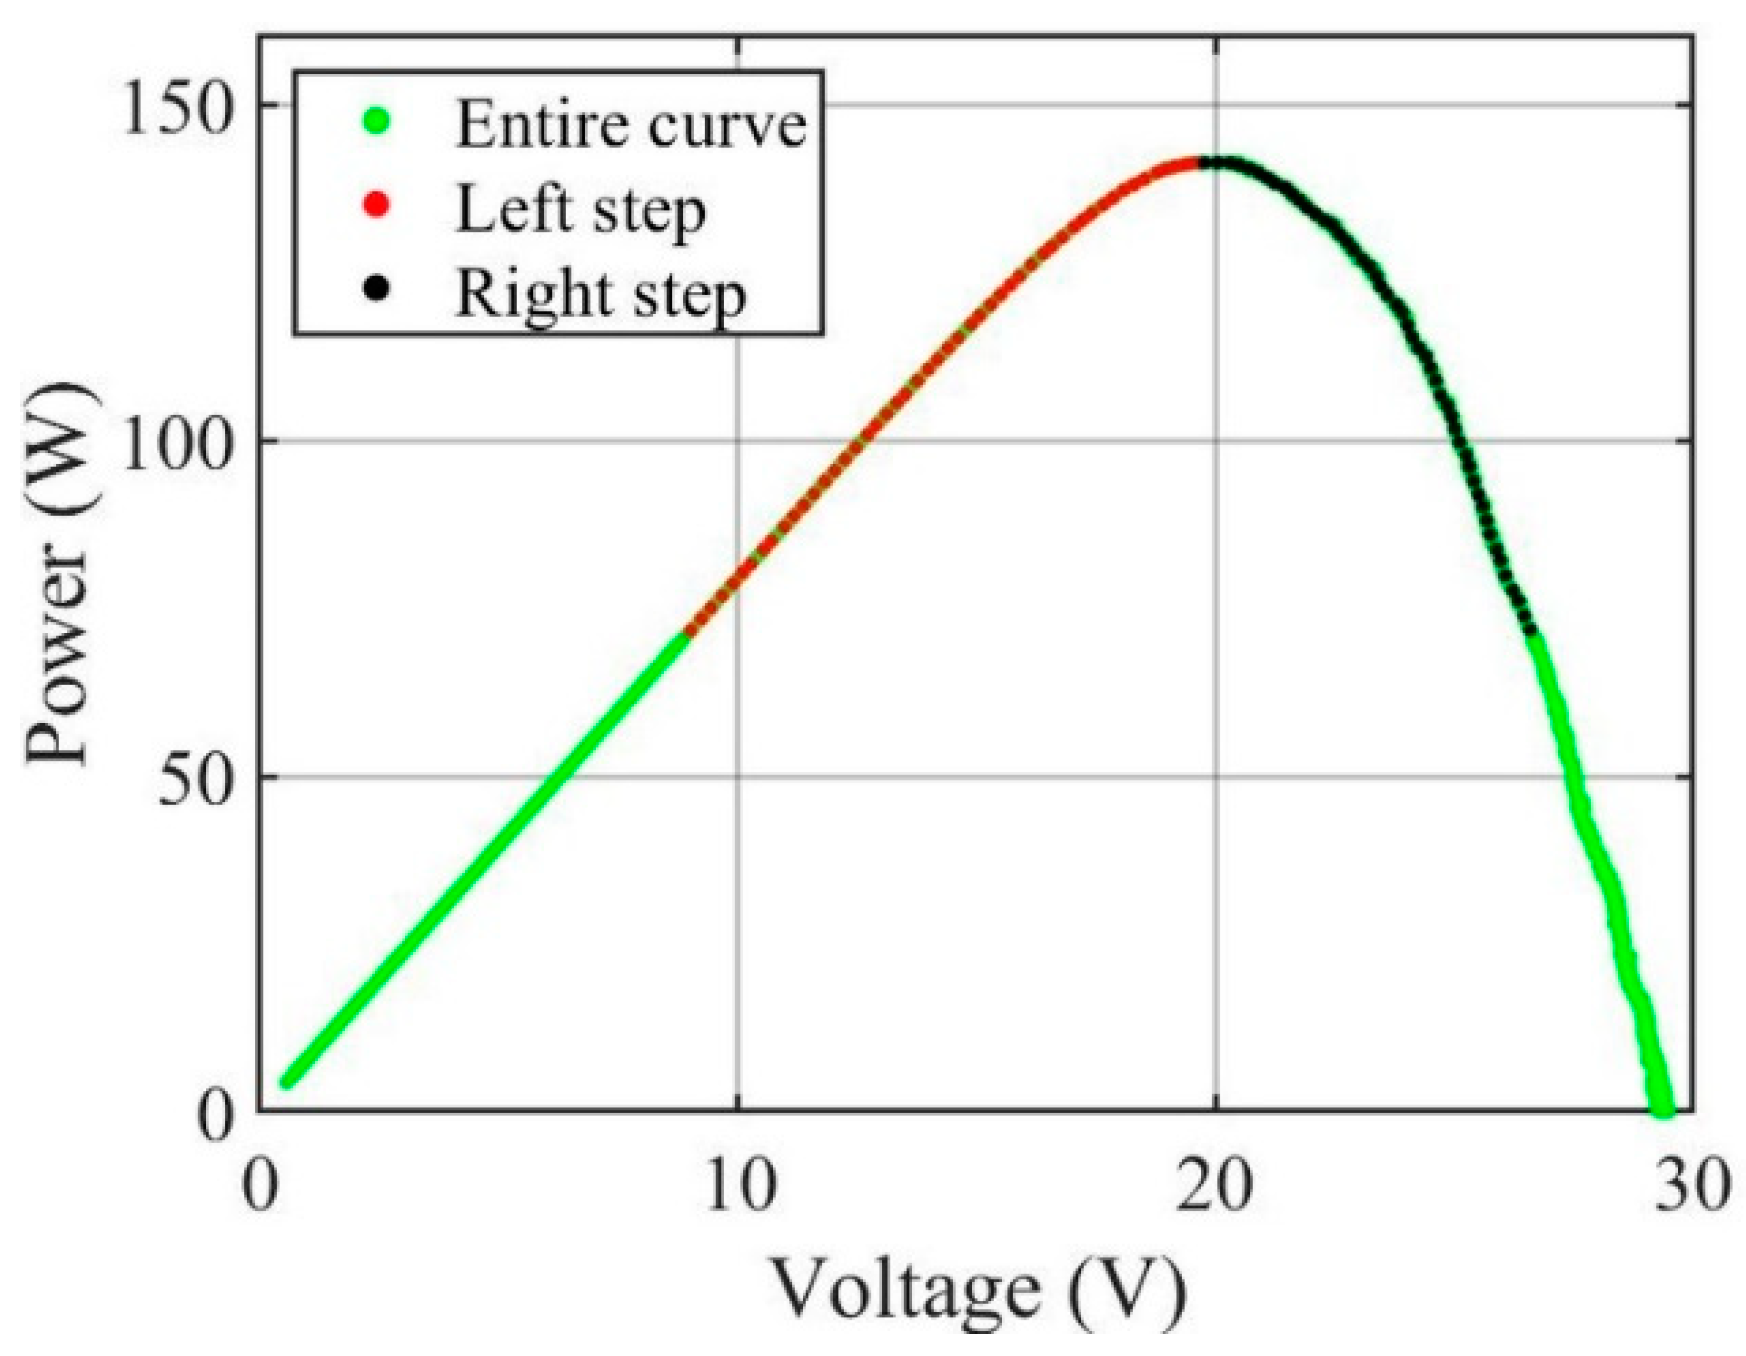
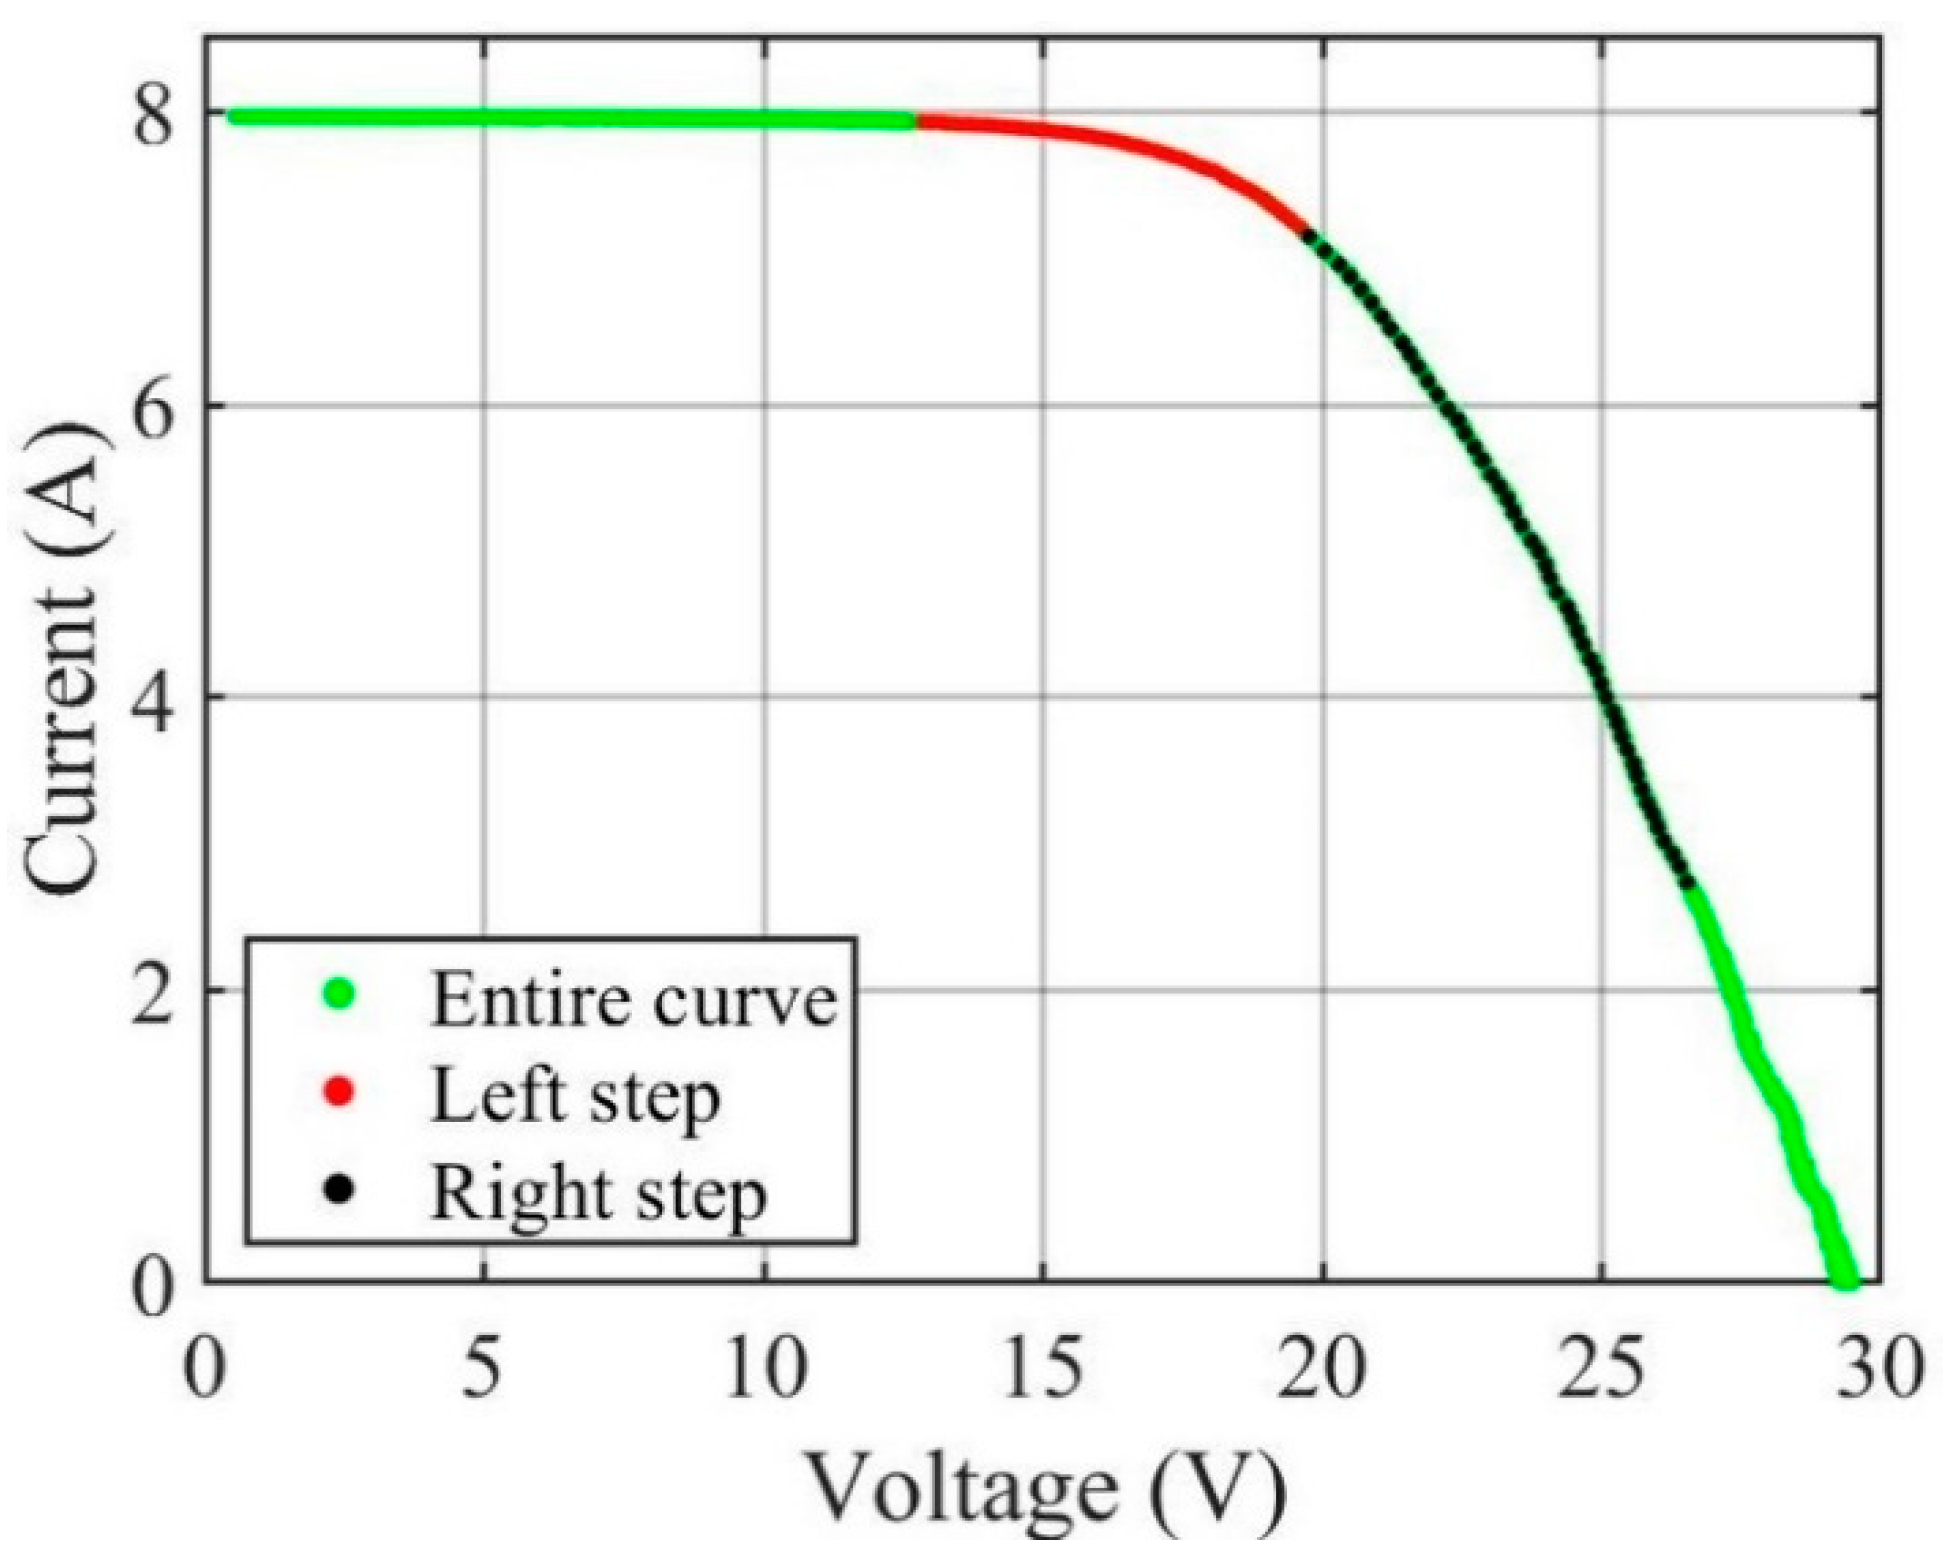
The partial I–U curves were constructed step by step from complete curves to curves in the close vicinity of the MPP by setting measurement limits based on either MPP power or MPP voltage symmetrically for both sides of the MPP. The latter method was analysed for the first time in the present paper. The effect of the choice of measurement limits around the MPP was investigated for the most practical output parameters of the used single-diode model fitting procedure—photocurrent, series resistance, and temperature—from a condition monitoring point of view. The other parameters, including saturation current and shunt resistance, were omitted from this paper due to their minor significance in the condition monitoring of PV systems. It was shown that the measurement limits based on the MPP power provided more stable fitting results than the limits based on the MPP voltage. Overall, a 50% limit based on the MPP power proved to be a viable alternative for measuring partial I–U curves to accurately fit a single-diode model. In contrast, the I–U curves measured in very close proximity to the MPP were not sufficient for reliable aging diagnosis.
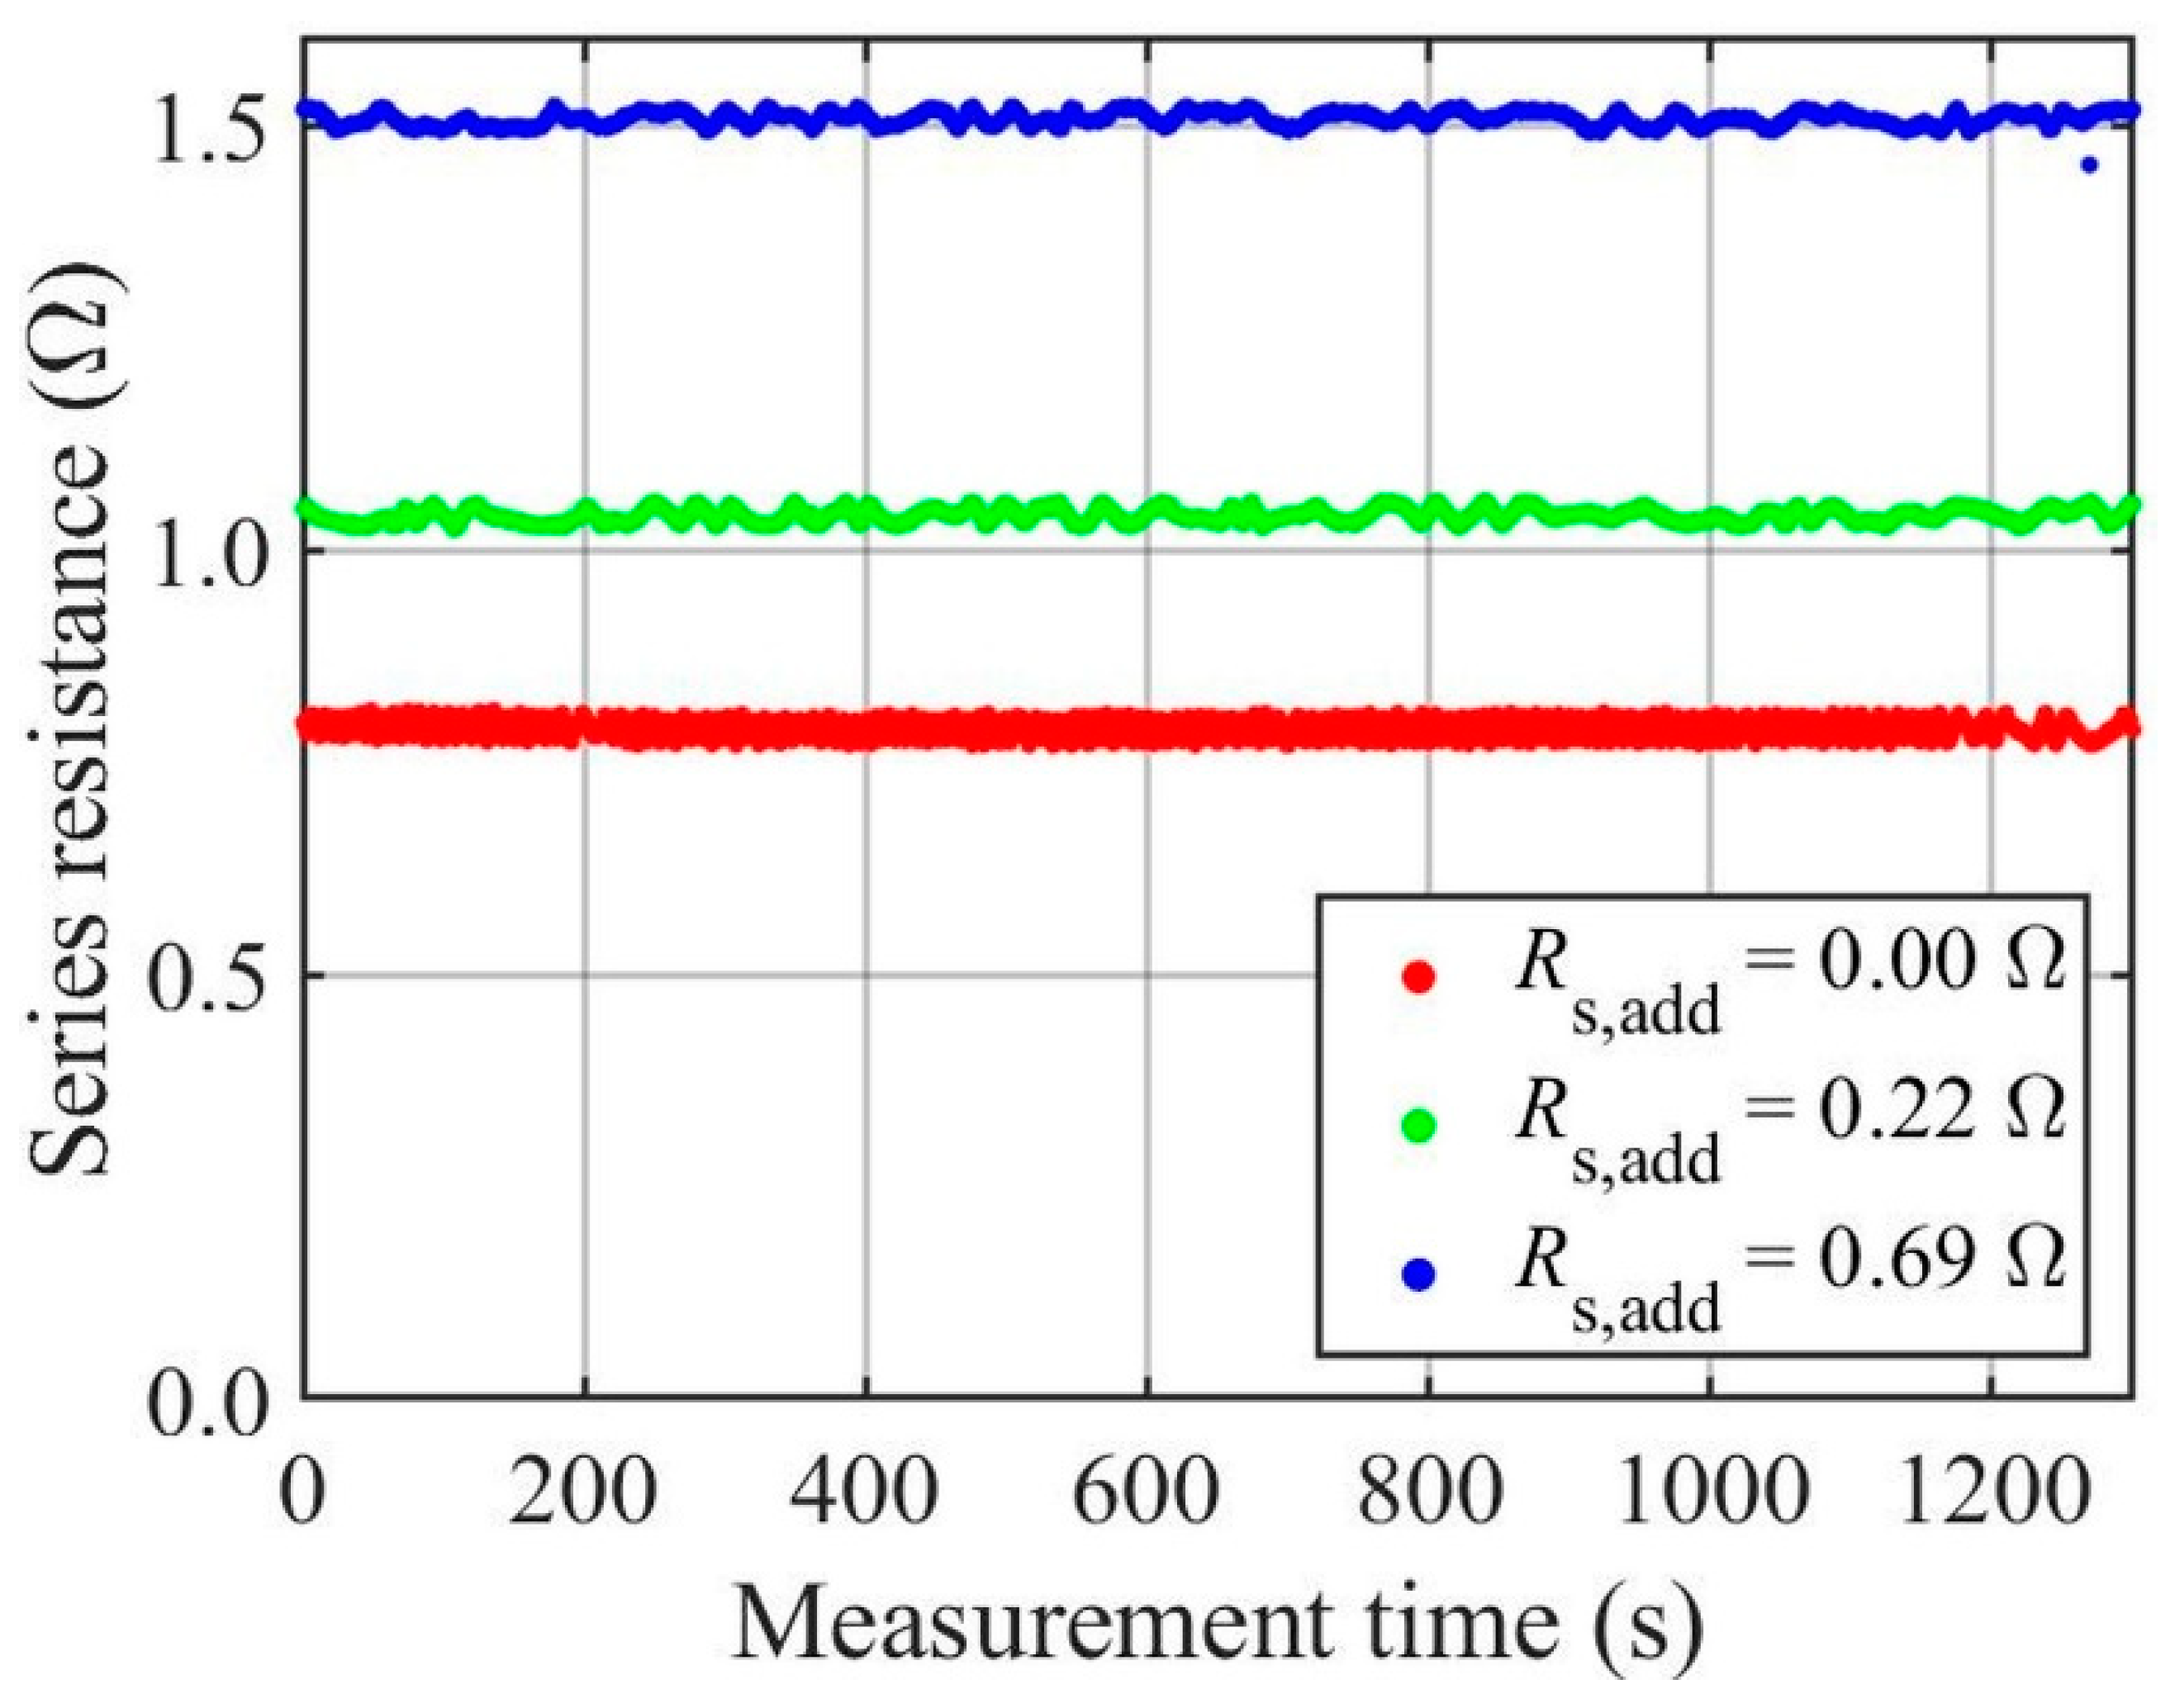
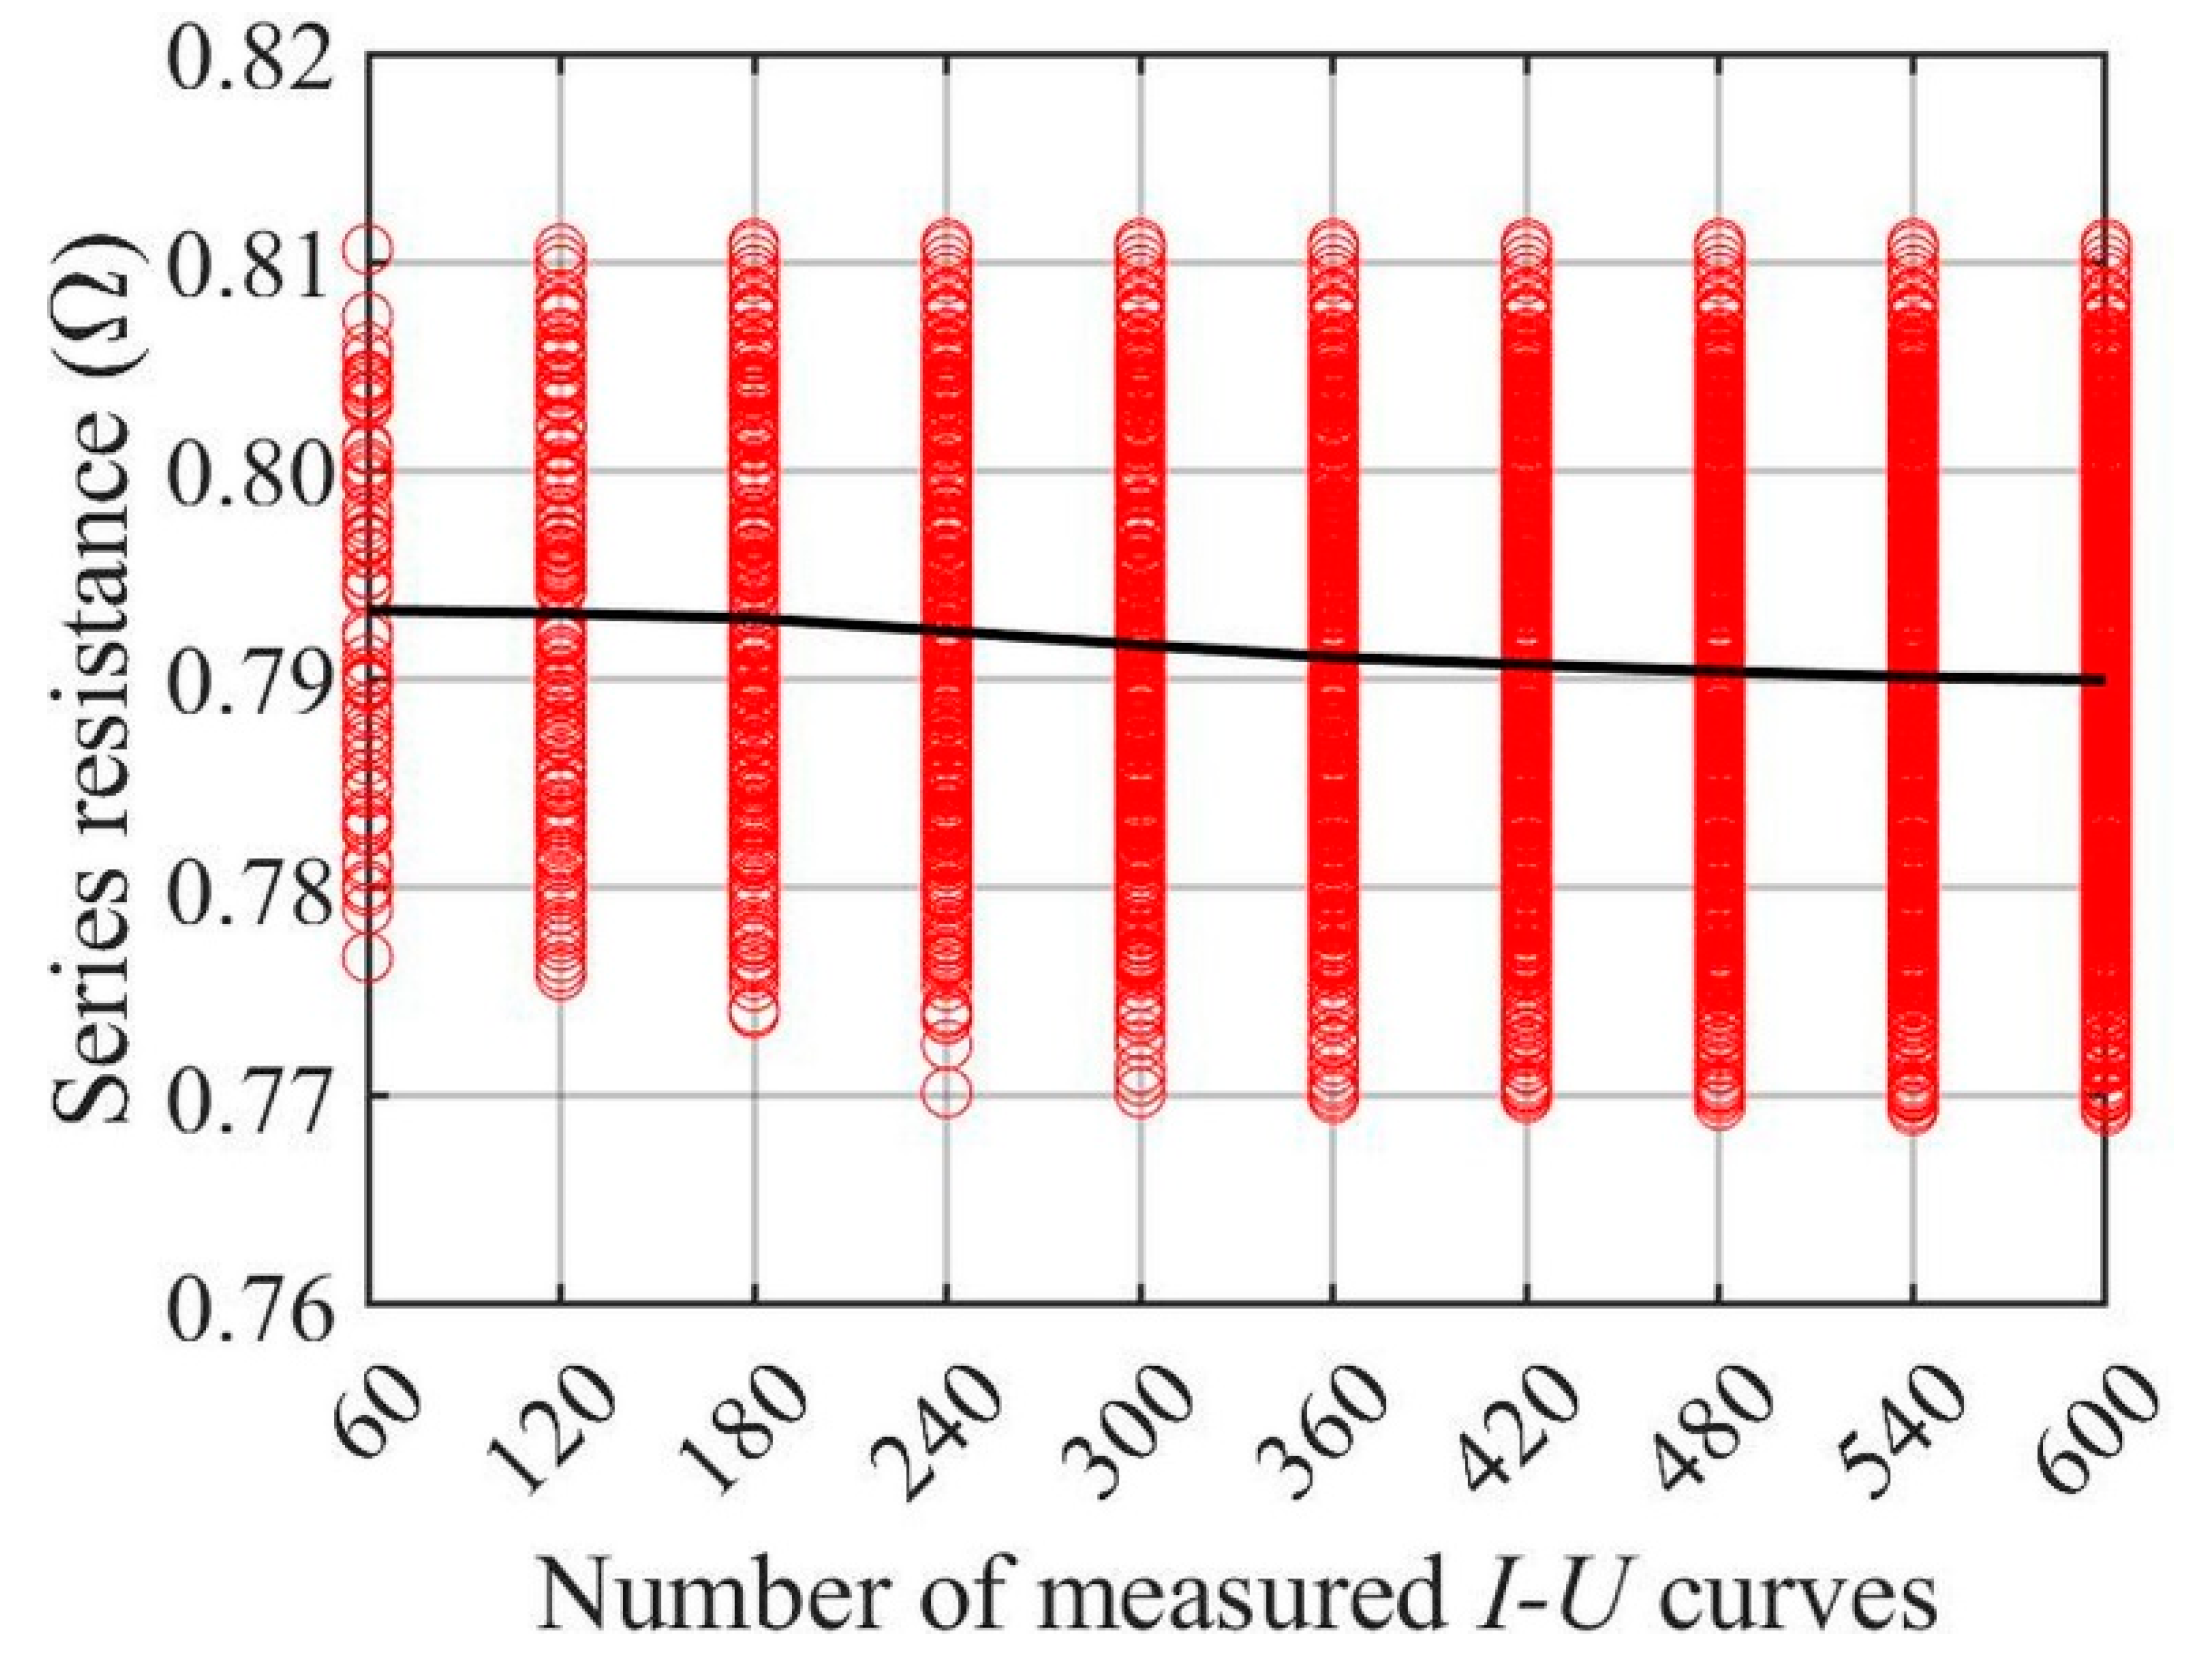
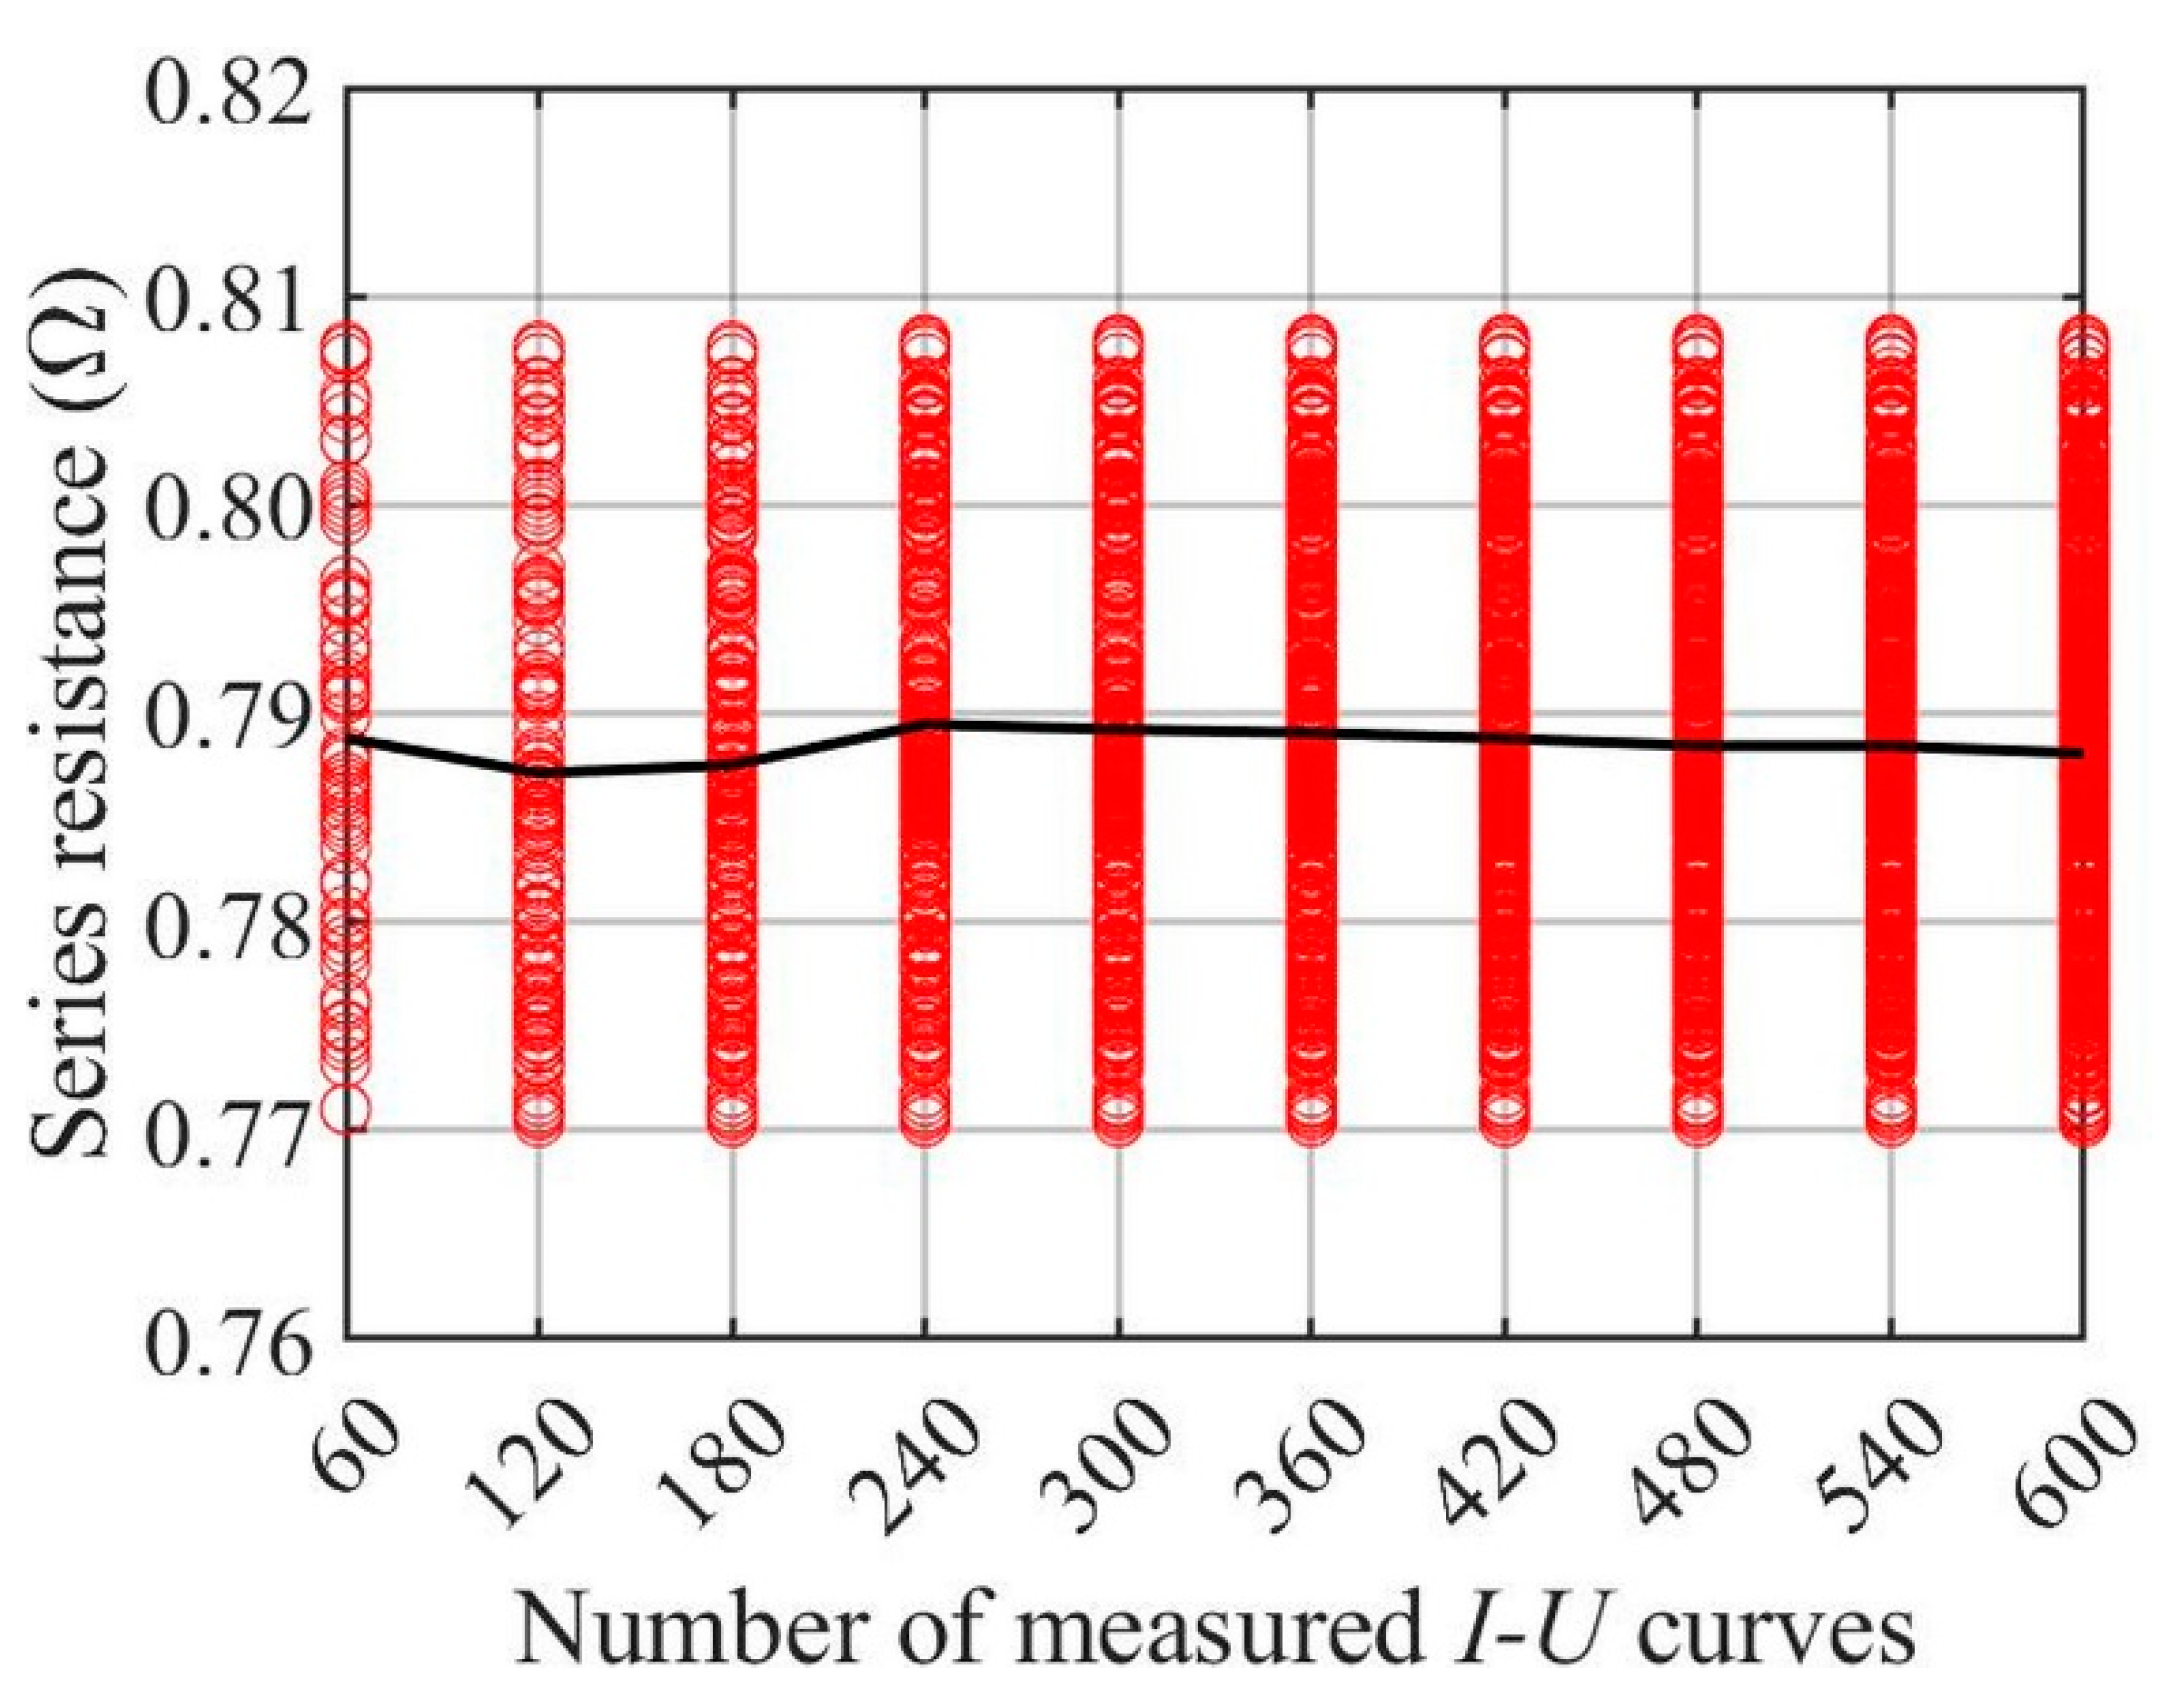
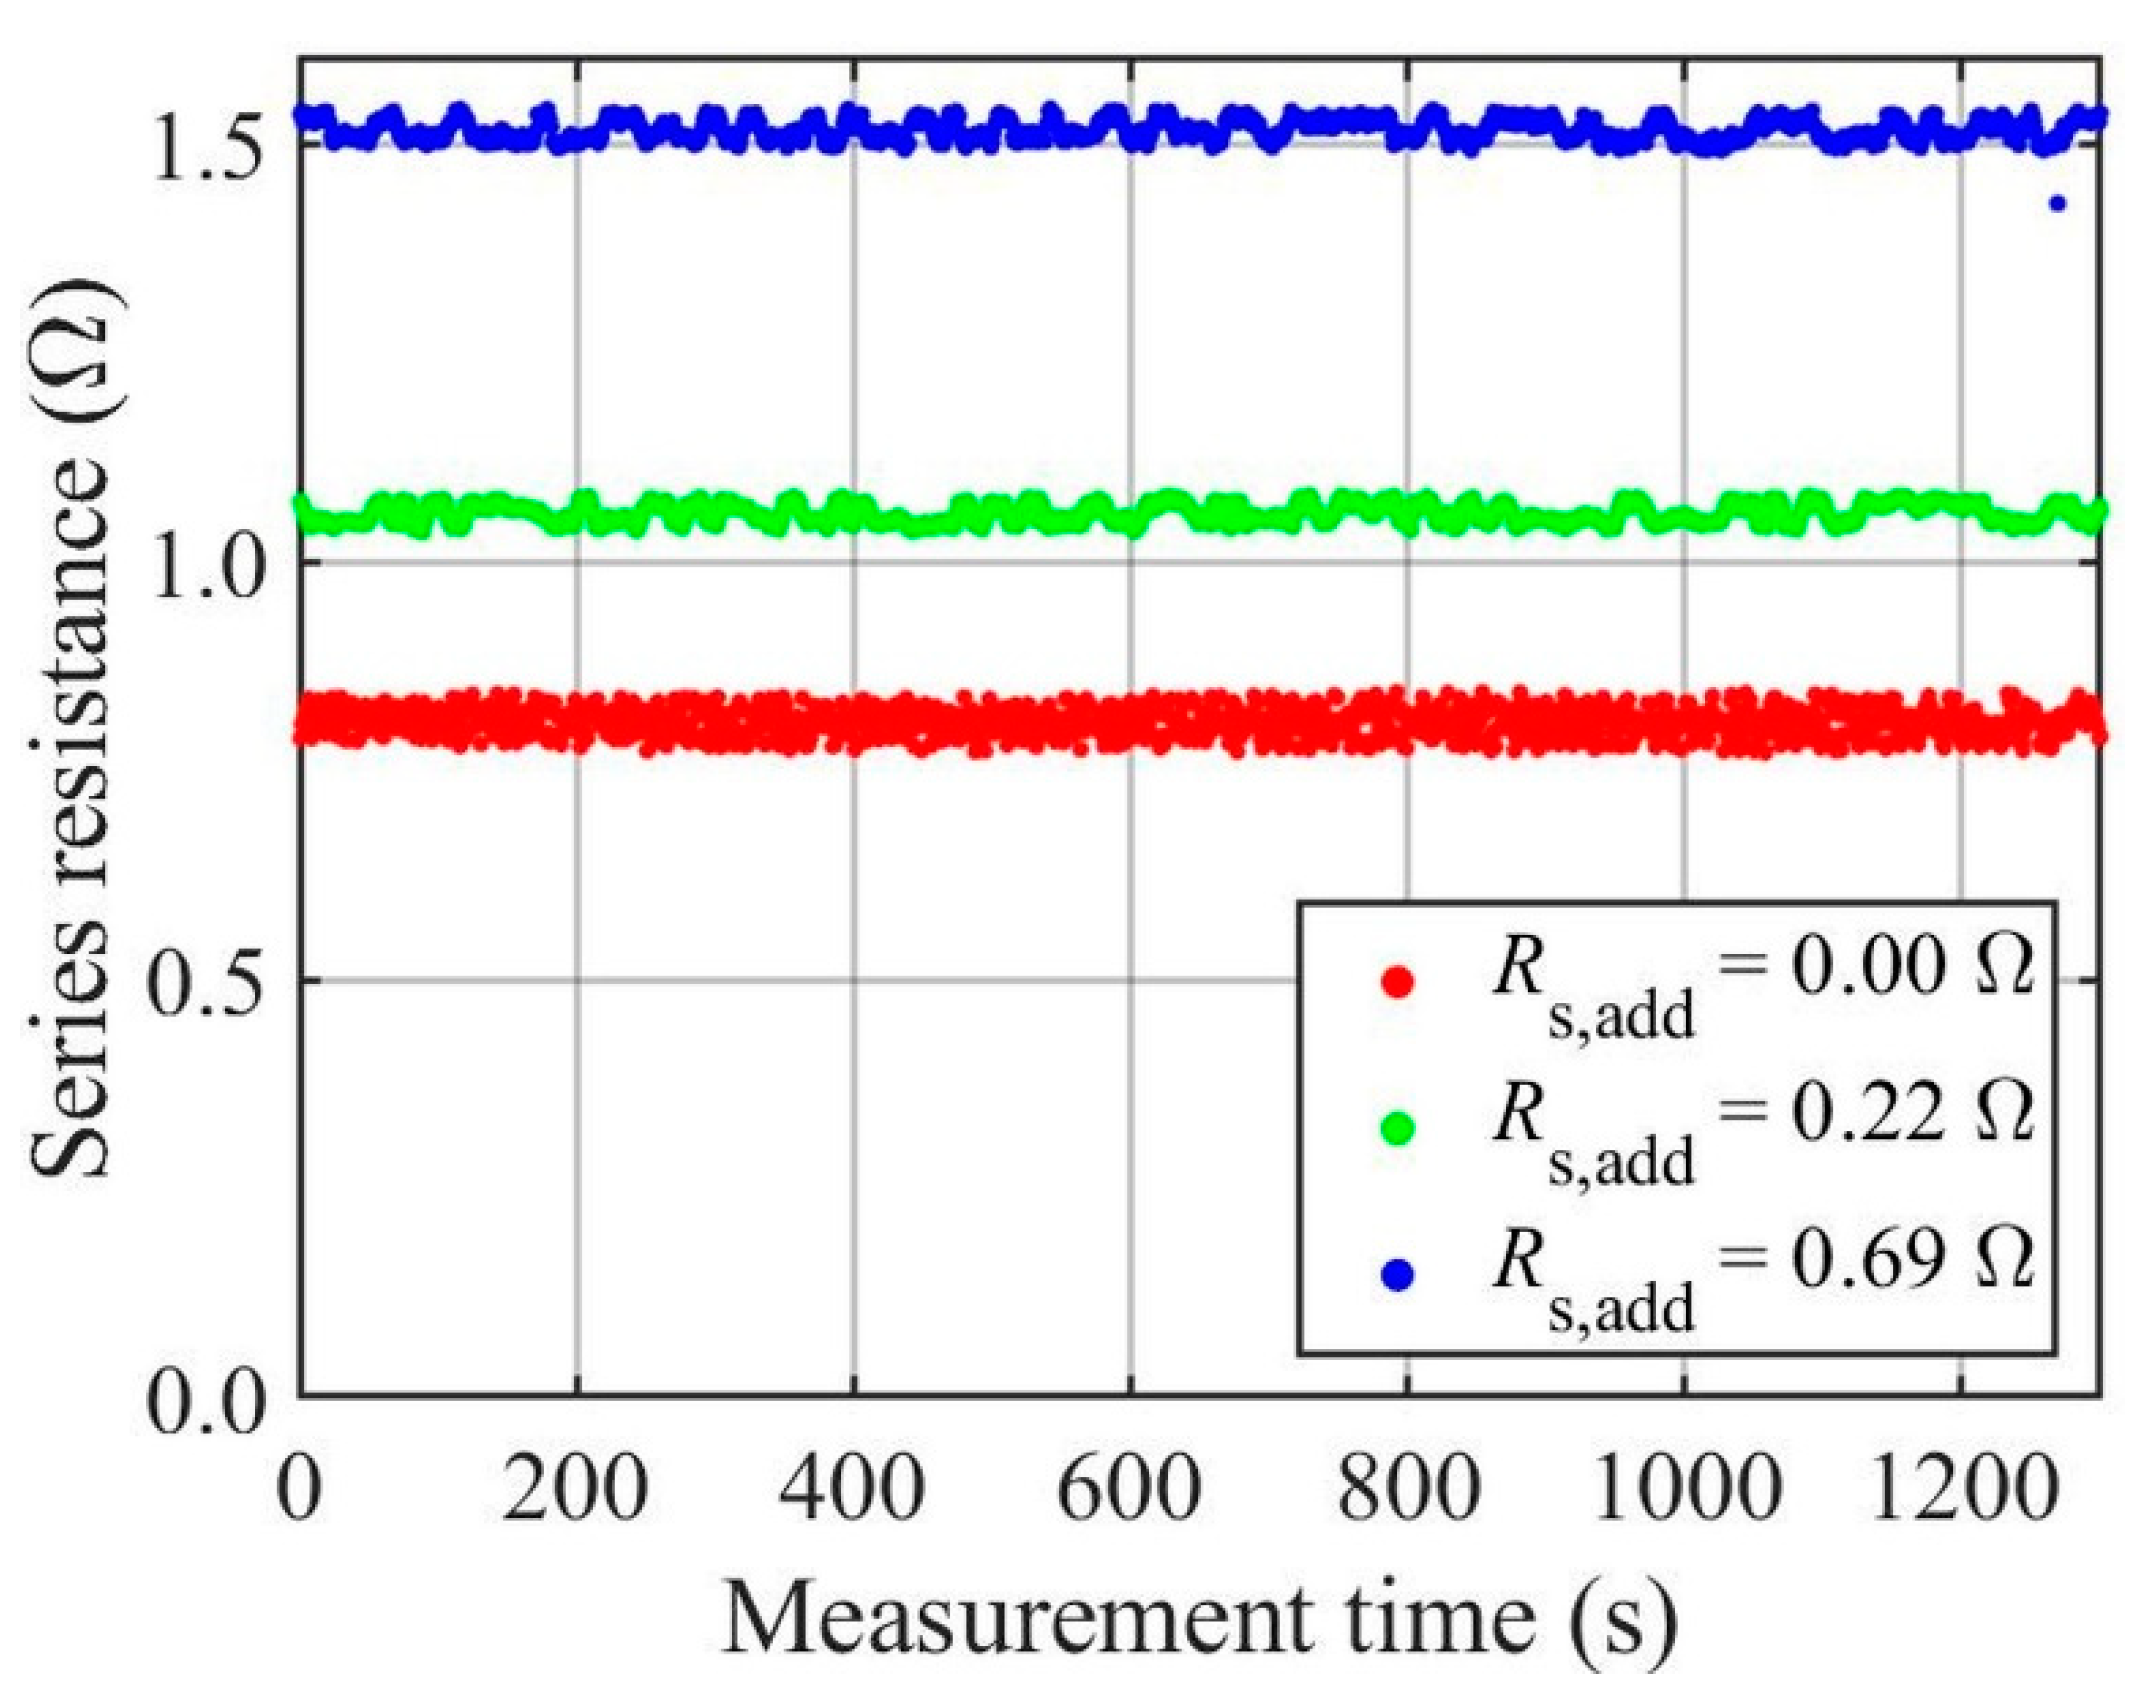
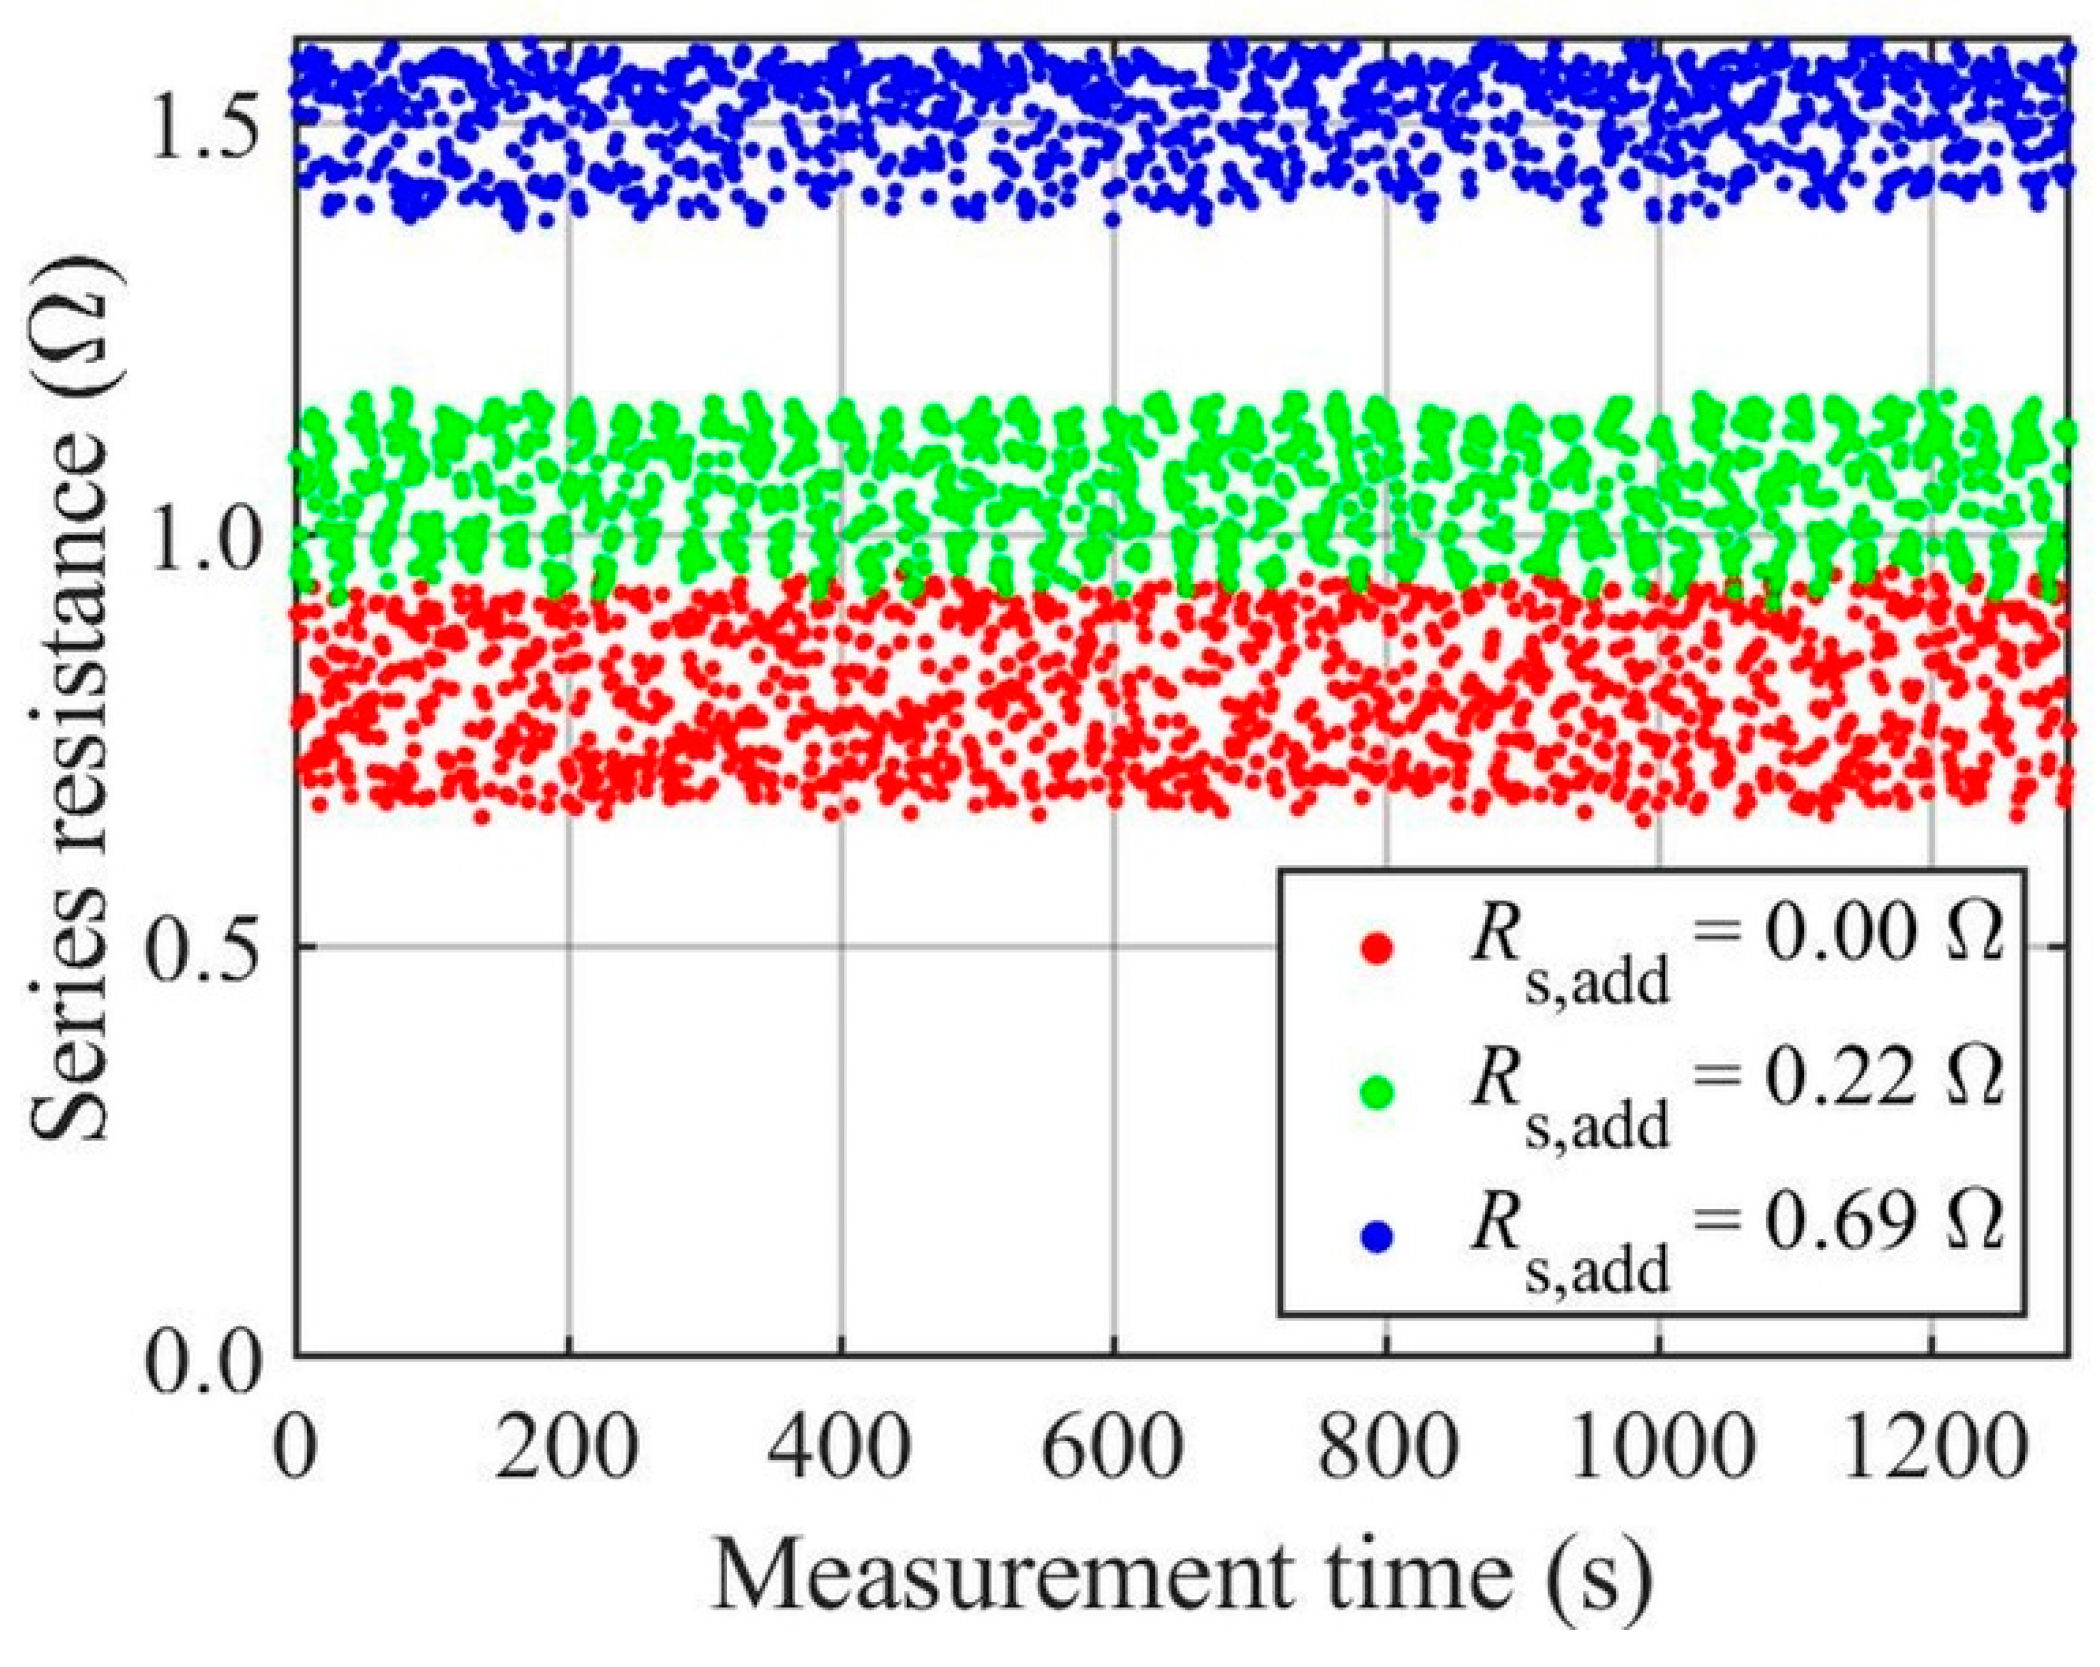
Among the single-diode model parameters, series resistance is the most important in aging detection, being also in the focus of the present paper. It was investigated how many complete I–U curves are needed for reliable series resistance analysis. According to the findings, few hundred successive I–U curves are sufficient. It was also found that the partial measurement of the I–U curve is sufficient for series resistance analyses, as long as the open-circuit slope of the I–U curve and the MPP curvature are reasonably covered. To emulate the aging of PV modules, two different-sized series resistors were still connected in series with the used PV module. The present work constitutes a strong theoretical foundation for further analyses and practical application development. In summary, the developed theoretical approach and fitting procedure, as well as the results obtained, can be used as a starting point for the development of online condition monitoring methods for PV systems.


