Abstract
Renewable energy supply is essential for carbon neutrality; however, technologies aiming to optimally utilize renewable energy sources remain insufficient. Seasonal variability in renewable energy is a key issue, which many studies have attempted to overcome through operating systems and energy storage. Currently, hydrogen is the only technology that can solve this seasonal storage problem. In this study, the amount of hydrogen required to circumvent the seasonal variability in renewable energy supply in Korea was quantified. Spatiotemporal analysis was conducted using renewable energy resource maps and power loads. It was predicted that 50% of the total power demand in the future will be met using solar and wind power, and a scenario was established based on the solar-to-wind ratio. It was found that the required hydrogen production differed by approximately four-times, depending on the scenarios, highlighting the importance of supplying renewable energy at an appropriate ratio. Spatially, wind power was observed to be unsuitable for the physical transport of hydrogen because it has a high potential at mountain peaks and islands. The results of this study are expected to aid future hydrogen research and solve renewable energy variability problems.
1. Introduction
Issues related to green and renewable energy and carbon neutrality have arisen because of climate change, including several technical limitations, such as the temporal variability in renewable energy [1]. Unlike conventional power-generation systems, additional technology is required for renewable energy, owing to its volatility, to maintain the electricity demand. In fact, demand and supply must be matched in real time and problems, such as frequency variations, should be eliminated. A low renewable energy supply ratio can be overcome by relying on other energy sources; however, a high renewable energy supply ratio cannot be solved by it. Therefore, storage technology to mitigate variability is essential and many studies have been conducted on this matter [2,3]. Consequently, research on systems used for operating such storage technologies and power-generation facilities is also being actively conducted [4,5].
Future energy systems must consider various energy sources, such as renewable energy, nuclear power, and conventional fossil energy, and demands, such as electricity, heat, and transportation, and continuously match the power supply and demand. Hence, multiple methods of storage must be utilized according to the period, and sector coupling [6,7] or power-to-X (P2X) [5,8] must be adopted. In addition, power systems pose additional issues with the quality of power, owing to frequency variations [9]. Accordingly, research is being conducted on analyzing time-series patterns and matching various energy sources and demands. Operating systems, such as multi-energy systems (MESs) [4] and others [10], have been studied for complex systems, including various energy sources and loads.
One of the biggest technical barriers to future energy operating systems is the lack of a technology for compensating long-term variability [11]. Many storage technologies are used to store energy, such as batteries, compressed air, pumped hydropower storage, and hydrogen storage. However, these technologies, except for hydrogen storage, cannot cover seasonal variability [5]. Pumped hydropower storage, which has the second-longest discharge duration, is not suitable for durations of more than several weeks [12]. Therefore, only hydrogen storage can be considered for handling future seasonal variability. However, there are limitations in the efficiency and economic feasibility of hydrogen storage, owing to insufficient technological development [13]. Nevertheless, studies suggest that innovative solutions can solve these problems [14].
In addition to storage technologies and operating systems, spatial analysis can help solve the variability issue. Existing energy systems pose various challenges, including those related to source location selection and distribution networks. For instance, the construction of power plants and power grids, as well as hydrogen storage, requires considerable time, resources and long-term planning. Spatial factors of supply and demand must be considered to transport the produced hydrogen. In other words, it is necessary to study the hydrogen-distribution network according to the expected supply and demand. As a result, a resource assessment was conducted for hydrogen [15]. However, the analysis had limitations, as both location and time should be considered together. Site selection for renewable energy power plants can help solve this problem.
In addition to the technical aspects, policy aspects should also be considered for long-term energy variability. Policy greatly affects the energy mix of a country. Economic feasibility is an important factor in the energy mix, which involves various other factors, such as supply policy, international situation, and national system construction. Changes in the energy mix can alter the level of skills and equipment required to manage variability. Generally, renewable energy is highly volatile; however, solar and wind energy, having different characteristics, can either complement each other or exacerbate the problem. Therefore, it is essential to consider the energy mix when analyzing variability.
Few studies have analyzed the spatiotemporal variability [16] and performed spatial analyses of hydrogen production [17]. However, spatiotemporal analyses, considering both variability and hydrogen with various energy mixes, have not yet been conducted. Therefore, this study conducted a quantitative spatiotemporal analysis to enhance future hydrogen storage in the land areas of South Korea. As the future situation is different from the current low-renewable-energy situation, the future situation was estimated based on a resource map rather than the currently installed power plants and power grid. Solar and wind energy resource maps were constructed to estimate the monthly energy supply, and the measured electricity demand data were used as energy demand. The expected hydrogen requirements and possible electricity supply were estimated. As future expectations require various assumptions and complex interactions, simple scenarios with different solar and wind supplies were considered. The hydrogen and spatial characteristics according to the scenarios were quantitatively analyzed. A flowchart of the study is shown in Figure 1.
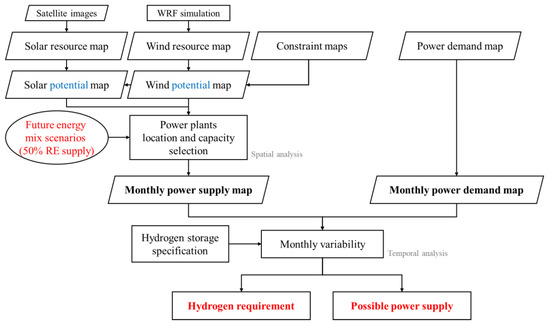
Figure 1.
Flowchart for the estimation of hydrogen requirement and power supply.
2. Data
2.1. Solar and Wind Power Supply Map
2.1.1. Solar and Wind Resource Maps
We use solar and wind resource maps generated by the New and Renewable Energy Resource Map Laboratory at the Korea Institute of Energy Research (KIER). All data, basic parameters, and methodologies were referenced from the government agency report, the 2020 New and Renewable Energy White Paper [18]. Annual changes that require consideration of comprehensive climate change in meteorology were not considered. The future power supply was calculated using one-year data, accounting for the consistency and availability of data. Consequently, solar and wind resource maps were generated using data from 2018 and 2010, respectively. All maps were interpolated to a 90 m resolution based on terrain data from the Korea National Geographic Information Institute. Power-generation facilities installed in reservoirs or seas were not considered because of insufficient regulatory conditions or technological maturity.
PVlib python [19] was used to estimate hourly photovoltaic (PV) power generation. A simple PVWatts module and default values were used because it is difficult to estimate the detailed specifications of future PV power. The PV panel orientation, which can remarkably influence monthly variability, was estimated according to the measured monthly PV power generation from thousands of sites. This power-generation data were acquired based on the electricity trading amount from the Korea Power Exchange. Solar irradiance and temperature maps were used to estimate PV power. The solar irradiance map was generated using data from a weather satellite, which facilitated the estimation of hourly spatial solar resources. A detailed description of the model can be found in previous studies [20,21]. The influence of the terrain was also quantified according to previous studies [22]. The temperature map was extracted from ERA5 reanalysis data.
Hourly wind-speed maps were generated from a numerical weather-prediction simulation. A detailed description of these data can be found in a previous study [23]. Because the wind maps had a resolution of 1 km, the influence of topography was considered. Wind-power generation was calculated based on the National Renewable Energy Laboratory (NREL) 5.5 MW reference onshore wind power curve [24]. A simple method, excluding complex factors, such as wind direction and wake effect, was used for the same reason as solar power. The calculated solar and wind power maps are shown in Figure 2. Wind power was the highest on the mountains in the east and the islands in the south. Although solar power is generally low on mountains due to shading, it is not as extreme as wind power.
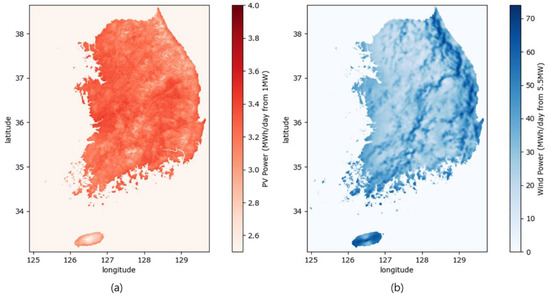
Figure 2.
(a) Solar and (b) wind power resource maps calculated from weather data.
2.1.2. Constraint Map
The potential of renewable energy in Korea can be evaluated under three aspects: theoretical, technical, and market [18]. As this study estimates future power potential, technical potential, which is the amount of energy used when reflecting technological and regulatory influences in theoretical potential, was used. These factors refer to areas where power-plant construction is impossible and a number of resources in the area must be removed when calculating technical potential. This study evaluated rivers, lakes, reservoirs, slopes greater than 20°, elevations greater than 1000 m, and landslide grade 1 areas as technological influences. Use areas, cultural property areas, nature-conservation areas, agricultural-protection areas, and other non-development areas were considered regulatory influences. All these areas were excluded from the power supply calculation.
However, all mountainous areas with large amounts of wind power were excluded under current regulatory conditions. The wind power potential was too small in this case; therefore, some regulations, including the natural conservation area, were excluded. After removing the area of the influence, the final amount of power generation for each location was calculated using capacity density, which indicates the installed capacity per unit area. A capacity density of 67.1 and 5.0 MW/km2 was used for solar and wind, respectively. Solar power was determined based on the assumption that one-third of the total area was used, and wind power was determined by synthesizing the values obtained from various institutions, including NREL. More detailed information can be found in Ref. [18]. The total power density maps after removing influences are shown in Figure 3. Most of the removed areas were urban and mountainous.
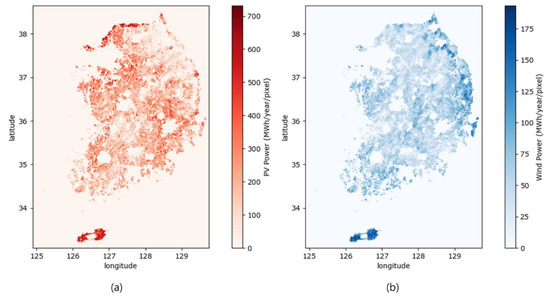
Figure 3.
(a) Solar and (b) wind power resource maps, excluding technological and regulatory influences.
2.2. Power Demand Map
Power demand data for Korea were acquired from the Korea Electric Power Corporation; however, only data based on the administrative units of the city, county, and district were available. Therefore, all spatial analysis using demand was conducted based on the administrative units. The power demand per unit and power demand per area are shown in Figure 4. Urban areas with large populations had high power demand. Thus, most of the demand was concentrated in the metropolitan area located in the northwest. Only the capital and metropolitan cities displayed high demand per area. To obtain absolute values, the total area was visualized rather than dividing the quantified value by area. National annual power demand data for 2020 were used, which totaled up to 509 TWh.
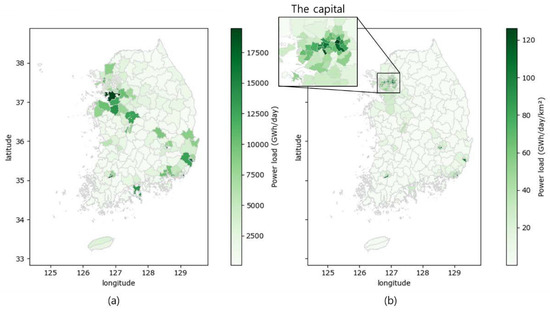
Figure 4.
Spatial distribution of power demand for (a) total amount and (b) values divided by the area of each administrative district.
3. Materials and Methods
3.1. Power Supply with Technical Potential
Selection of the location and capacity of the power plant is required to estimate the future power supply. Several assumptions were made in the calculations. First, it was assumed that a certain percentage of total power demand was supplied with renewable energy and then the required renewable energy power capacity was calculated. Currently, the Korean government is envisioning the energy mix for 2030 as a combination of fossil fuels, nuclear power, and renewable energy. The energy mix for 2050, which is expected to be carbon neutral in Korea, has not been determined, but it is expected that the composition will be almost free of fossil fuels. Therefore, it is assumed that solar and wind energy will provide half of the total power demand. However, to simplify the assumptions, the latest available 2020 demand data were considered as future demand, and the increase in annual demand or sector coupling with other sources was not considered. In addition, demand other than the half supplied by solar and wind energy was assumed not to be variable.
Subsequently, the location and capacity to match the corresponding power capacity for solar and wind power were calculated. Figure 5 shows the locational distribution of power potential, which is the relative area according to the power per unit area. Density in the figure refers to kernel density estimation, which can be seen as smoothed counts in the histogram. As seen in the figure, most regions have a value of 600 to 700 for PV power. However, wind power has a large deviation from 25 to 200, and it can be seen that most regions have low energy per unit area. This means that PV power yields can be expected to be similar in most regions, but the wind is not. Thus, it is assumed that the PV is distributed evenly in many regions and the wind is distributed mainly in the high-potential areas.
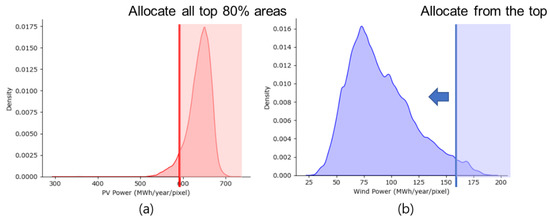
Figure 5.
The locational distribution of (a) PV and (b) wind power potential, which is the relative area according to the power per unit area. Density refers to kernel density estimation, which can be seen as smoothed counts in histograms. It is assumed that PV power is supplied to the top 80% of the region and wind power is supplied only to points with high potential.
Specifically, the power plant supply location and capacity were calculated by the following procedure. (1) A region with high wind power was allocated first. As high wind potential was limited to only some regions, wind power was installed there before PV. Installed wind power capacity was set to be the maximum for the region, and if supply is still insufficient, additional capacity is allocated for the lower-potential areas. (2) PV power was supplied to all areas except for areas with a potential of 20% or less. The installed PV capacity was applied equally to all regions and was calculated according to the final generation target. As the capacity density for solar energy was calculated assuming that 1/3 of the area is used, it is calculated that a smaller area is used in each area.
3.2. Seasonal Variability and Hydrogen Storage
Using the maps for energy supply and monthly generation, the variability can be calculated through the difference in demand. Hydrogen storage can be used to overcome this variability and match supply and demand. However, the actual amount of power that can be supplied decreases according to the conversion efficiency, and a facility to store hydrogen is also required. Calculations were performed assuming that the charging and discharging efficiencies of hydrogen storage were 71% and 50%, respectively [25]. Accordingly, the total round-trip efficiency was 36%. Hydrogen production was calculated according to the power required to generate 1 Nm3 of hydrogen. We used 5.4 kWh, which can be converted to 16.7 tons/GWh for hydrogen production, according to a previous study [26]. Other factors, such as energy storage and short-term variability, were not addressed.
The actual power supply ratio and hydrogen production were calculated numerically based on monthly patterns. The power supply ratio means the ratio of solar and wind power supply to the total power generation. This is equal to the ratio of solar and wind energy to demand because the amounts of power generation and demand are equal. This value was set to 50%, but its value decreased following conversion efficiency. Therefore, calculating the amount of charge and discharge according to the variability and loss rate was essential to determine the actual supply ratio (which differed from the theoretical 50%). However, volatility changed with decreasing supply ratio. To solve this issue, a numerical method was used to calculate the value at which the amount of change in energy stored for 10 years would be less than 100 GWh. It was assumed that the monthly demand pattern remains unchanged even if the supply ratio decreases. The required hydrogen production was calculated as the difference between the maximum and minimum hydrogen amounts required for 10 years.
3.3. Scenarios with an Energy Mix
This study assumed that half of the total future power demand would be produced by solar and wind energy and the rest would be produced by other sources. Among these, the supply ratio of solar and wind power can significantly affect both time series and spatial aspects. Figure 6 shows the monthly normalized power generation from solar, wind, and load patterns. The annual patterns of solar and wind power were reversed, consistent with a previous study [7]. The two energy sources can complement each other to mitigate variability at an appropriate supply ratio. Thus, the ratio of solar and wind power to the corresponding total power generation was increased by 1% and the results were compared. The power supply maps, actual supply ratio, and hydrogen production for each scenario were calculated using the above method.
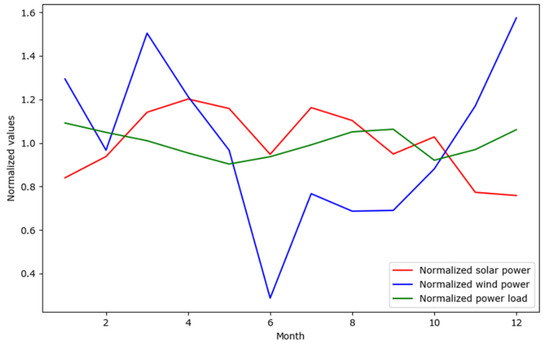
Figure 6.
Monthly normalized power-generation patterns of solar, wind, and load.
4. Results
4.1. Power Supply and Demand Maps
Figure 7 shows the distribution of power supply based on the supply ratio in administrative units. Solar power was generated in the entire area because equal capacity was installed in the top 80% of the region, regardless of the amount of supply. However, more power was produced in the southeast region than in other regions because of differences in spatial influences and potential. In addition, power generation was low on the southern island and eastern mountain ranges where wind turbines were preferentially installed. In the case of wind power, the supply was the highest on the southern island and then the eastern mountain range; the rest of the region had negligible supply, except for some areas in the southwest.
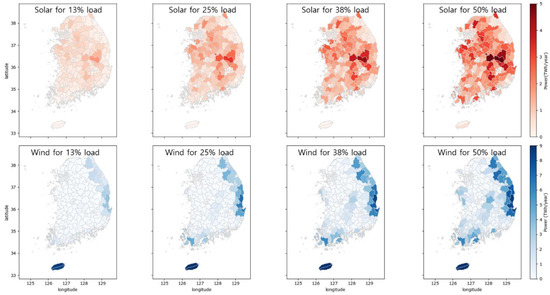
Figure 7.
Distribution of solar and wind power supply according to the supply ratio in administrative units.
4.2. Hydrogen Requirement Based on Scenarios
Changes in monthly variability were calculated according to the solar and wind power supply ratios (Figure 8). A pattern similar to that shown in Figure 6 was confirmed in the case of independent power generation. When the proportion of solar energy was high, power was generated in large amounts in spring and summer (March to August). When the proportion of wind energy was high, power was generated in small amounts in summer (June to August). This extreme variability was alleviated when the two supply ratios were combined. April and October had almost the same amount of wind and solar power and showed consistent results, regardless of the scenario. June and December displayed the highest fluctuations.
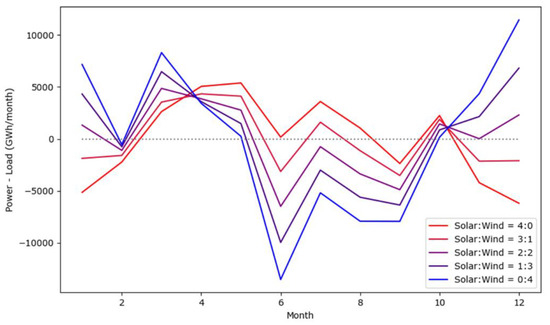
Figure 8.
Monthly variability according to solar and wind power supply ratios.
The monthly variability was the lowest when solar and wind power were supplied at a ratio of 7:3 (Figure 9). Hydrogen production was approximately 1800 kilotons, which is 50% and 75% less than when only solar or wind power was used. In other words, approximately four-times more hydrogen can be required, depending on the solar-to-wind ratio. The actual power supply ratio was also the highest at 47% at the optimal ratio and dropped to at least 42%. Both the hydrogen production and supply ratio showed a linear decreasing and increasing pattern centered on the extreme.
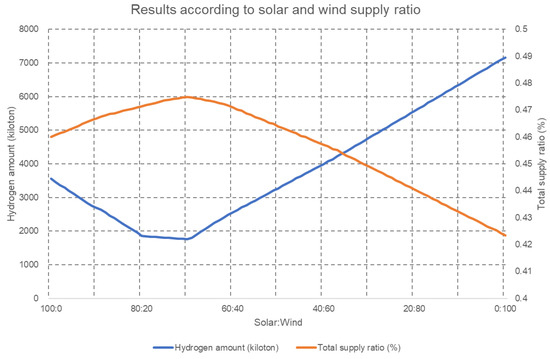
Figure 9.
Hydrogen production and actual power supply using the ratios of solar and wind energy. The actual power supply ratio refers to the ratio that can be supplied when 50% of the demand is generated.
4.3. Spatial Analysis on Seasonal Variability
As mentioned in the Introduction, spatial analysis was performed using the location of the supply and demand for hydrogen, which requires physical movement. The difference between supply and demand was calculated similarly to that in Figure 8, but a value according to location and not time was calculated (Figure 10). As the proportion of wind power increased, the physical distance from demand and supply to the eastern and southern islands also increased. Demand was high from the northwest metropolitan area to the southeast and wind power was unsuitable for supply in these areas. These wind power effects were relatively small for optimal proportions, similar to what is shown in Figure 10b with high solar proportions. However, even in this case, the high supply on the southern island can result in a physical transport problem.
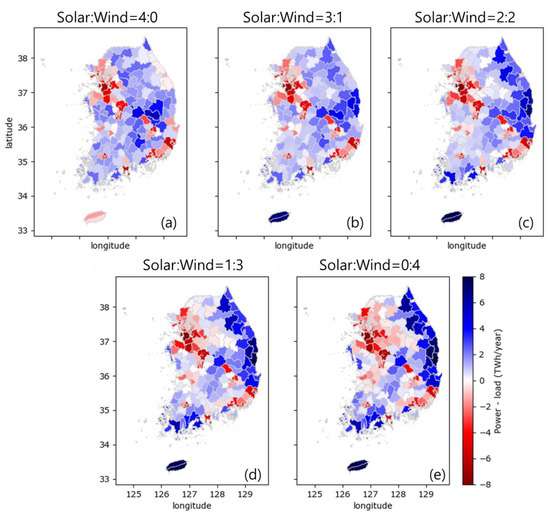
Figure 10.
Differences between supply and demand according to the ratios of solar and wind energy. Solar and wind ratio is (a) 4:0; (b) 3:1; (c) 2:2; (d) 1:3; (e) 0:4.
5. Discussions
5.1. Limitations
Although this study dealt with the spatiotemporal characteristics of future seasonal hydrogen storage, the problem was summarized as simply as possible, based on many assumptions. Only two energy sources and power demands were analyzed, and variabilities other than seasonal variabilities, such as short-term variability, were not considered. Changes in weather or demand over time owing to climate change and development were also not considered. In the case of demand, if sector-coupling technology to control variability is applied, it can change significantly. However, many prior studies and assumptions are required to consider all these factors, so they are omitted here. Consideration of these factors may alter the results and implications of this study. Recently developed technologies, such as floating PV and offshore wind, can also influence the total supply. Nevertheless, this study remarkably demonstrated the importance of the energy mix in long-term variability and storage problems. As it was an initial study based on a simple model, future studies can be conducted by revising the assumptions presented here.
The economy is an important factor that cannot be overlooked while addressing the issue of variability and energy. In particular, it is necessary to compare the economic feasibility when selecting the appropriate storage system. Many studies have been conducted based on economic feasibility; however, this study did not consider these factors because it is difficult to provide accurate future economic feasibility based on the present economic feasibility. The supply and control of high levels of renewable energy are impossible with current technology and economic feasibility. This problem is more pronounced in the case of green hydrogen, which produces hydrogen from renewable energy sources and is not yet economical. A complex study should be conducted along with economic predictions to deal with economic factors.
5.2. Long-Term Energy Planning
Although this study was conducted academically, it provides important insights into long-term energy planning. In particular, it contributes to establishing policies related to the supply of renewable energy or a future hydrogen network. In the current situation, where many countries do not have concrete plans for future carbon neutrality, these results can serve as quantitative backup data. Rather than simply comparing the cost of supply, grid connections and storage system costs should be considered for the efficient dissemination of renewable energy. This study provides insights and opinions on the effective energy mix to reduce variability. When the energy supply sites and solar-to-wind ratio are adjusted to optimal conditions, the required hydrogen production and facility costs can be effectively reduced. In addition, it is necessary to consider the transportation of hydrogen based on the location where demand exists and the bias of the resource area. In Korea, the transportation cost of hydrogen inevitably increases when high wind power is supplied to mountainous areas and southern islands. Policies should be established based on quantitative spatial analysis. More practical results can be obtained by performing a spatial analysis considering the installed power grid networks. However, an expanded future power grid is needed for large renewable energies, as in this study.
6. Conclusions
In this study, the future hydrogen demands to overcome the seasonal variability of power generation were estimated using renewable resource maps and power loads. A significant difference in hydrogen requirements was observed according to solar and wind power supply scenarios. The difference was approximately four-times the amount of hydrogen required, depending on the scenario, which is industrially and socially important when considering production facilities, storage, and transportation. In addition, the spatial analysis revealed that wind power could not transport the hydrogen produced efficiently. In particular, considering transport systems for the southern island with abundant wind resources is necessary. Establishing national policies and long-term energy plans based on this scientific evidence will facilitate the establishment of carbon neutrality. Additional research is expected to be conducted based on this study. In particular, technological development for future energy operations, such as sector coupling, is expected.
Author Contributions
Conceptualization, M.O. and B.K.; methodology, M.O.; software, M.O.; validation, M.O.; investigation, C.K.K. and C.Y.; resources, C.Y., J.-Y.K., and S.-J.H.; data curation, J.-Y.K. and S.-J.H.; writing—original draft preparation, M.O.; writing—review and editing, B.K, C.Y., C.K.K., and H.-G.K.; visualization, B.K.; supervision, Y.-H.K. and H.-G.K.; project administration, Y.-H.K.; funding acquisition, H.-G.K. All authors have read and agreed to the published version of the manuscript.
Funding
This work was supported by the Korea Institute of Energy Technology Evaluation and Planning (KETEP), grant funded by the Korean Government (MOTIE) (No. 20223030010090/KIER C2-4334, “Development of 100 m × 100 m grid photovoltaic market potential analysis model in Korea and data platform”).
Data Availability Statement
The data presented in this study are available on request from the corresponding author.
Conflicts of Interest
The authors declare no conflict of interest.
References
- Jones, L.E. Renewable Energy Integration: Practical Management of Variability, Uncertainty, and Flexibility in Power Grids; Academic press: Cambridge, MA, USA, 2017. [Google Scholar]
- Zhao, H.; Wu, Q.; Hu, S.; Xu, H.; Rasmussen, C.N. Review of energy storage system for wind power integration support. Appl. Energy 2015, 137, 545–553. [Google Scholar] [CrossRef]
- Beaudin, M.; Zareipour, H.; Schellenberglabe, A.; Rosehart, W. Energy storage for mitigating the variability of renewable electricity sources: An updated review. Energy Sustain. Dev. 2010, 14, 302–314. [Google Scholar] [CrossRef]
- Mancarella, P. MES (multi-energy systems): An overview of concepts and evaluation models. Energy 2014, 65, 1–17. [Google Scholar] [CrossRef]
- Chehade, Z.; Mansilla, C.; Lucchese, P.; Hilliard, S.; Proost, J. Review and analysis of demonstration projects on power-to-X pathways in the world. Int. J. Hydrog. Energy 2019, 44, 27637–27655. [Google Scholar] [CrossRef]
- Ramsebner, J.; Haas, R.; Ajanovic, A.; Wietschel, M. The sector coupling concept: A critical review. Wiley Interdiscip. Rev. Energy Environ. 2021, 10, e396. [Google Scholar] [CrossRef]
- Fridgen, G.; Keller, R.; Körner, M.F.; Schöpf, M. A holistic view on sector coupling. Energy Policy 2020, 147, 111913. [Google Scholar] [CrossRef]
- Daiyan, R.; Macgill, I.; Amal, R. Opportunities and Challenges for Renewable Power-to-X. ACS Energy Lett. 2020, 5, 3843–3847. [Google Scholar] [CrossRef]
- Delille, G.; François, B.; Malarange, G. Dynamic frequency control support by energy storage to reduce the impact of wind and solar generation on isolated power system’s inertia. IEEE Trans. Sustain. Energy 2012, 3, 931–939. [Google Scholar] [CrossRef]
- Klyapovskiy, S.; Zheng, Y.; You, S.; Bindner, H.W. Optimal operation of the hydrogen-based energy management system with P2X demand response and ammonia plant. Appl. Energy 2021, 304, 117559. [Google Scholar] [CrossRef]
- Guerra, O.J.; Zhang, J.; Eichman, J.; Denholm, P.; Kurtz, J.; Hodge, B.M. The value of seasonal energy storage technologies for the integration of wind and solar power. Energy Environ. Sci. 2020, 13, 1909–1922. [Google Scholar] [CrossRef]
- Ruth, M.F.; Jadun, P.; Gilroy, N.; Conelly, E.; Boardman, R.; Simon, A.J.; Elgowainy, A.; Zuboy, J. The Technical and Economic Potential of the H2@Scale Hydrogen Concept Within the United States; Technical Report NREL/TP-6A20-77610; National Renewable Energy Laboratory: Golden, CO, USA, October 2020. [Google Scholar]
- International Energy Agency. The Future of Hydrogen: Seizing today’s Opportunities; IEA Publication: Paris, France, 2019; p. 203. [Google Scholar]
- Kovač, A.; Paranos, M.; Marciuš, D. Hydrogen in energy transition: A review. Int. J. Hydrogen Energy 2021, 46, 10016–10035. [Google Scholar] [CrossRef]
- Connelly, E.; Melaina, M.; Penev, M.; Milbrandt, A.; Roberts, B.; Gilroy, N. Resource Assessment for Hydrogen Production; Technical Report NREL/TP-5400-77198; National Renewable Energy Lab (NREL): Golden, CO, USA, July 2020. [Google Scholar]
- Schindler, D.; Behr, H.D.; Jung, C. On the spatiotemporal variability and potential of complementarity of wind and solar resources. Energy Convers. Manag. 2020, 218, 113016. [Google Scholar] [CrossRef]
- Nematollahi, O.; Alamdari, P.; Jahangiri, M.; Sedaghat, A.; Alemrajabi, A.A. A techno-economical assessment of solar/wind resources and hydrogen production: A case study with GIS maps. Energy 2019, 175, 914–930. [Google Scholar] [CrossRef]
- Ministry of Trade Industry and Energy. Korea Energy Agency. 2020 New and Renewable Energy White Paper. Available online: http://www.nref.or.kr/bbs/board.php?bo_table=hongbo&wr_id=11 (accessed on 27 November 2022).
- Stein, J.S.; Holmgren, W.F.; Forbess, J.; Hansen, C.W. PVLIB: Open source photovoltaic performance modeling functions for Matlab and Python. In Proceedings of the Conference Record of the IEEE Photovoltaic Specialists Conference, Portland, OR, USA, 5–10 2016. [Google Scholar]
- Kim, C.K.; Kim, H.G.; Kang, Y.H.; Yun, C.Y. Toward Improved Solar Irradiance Forecasts: Comparison of the Global Horizontal Irradiances Derived from the COMS Satellite Imagery Over the Korean Peninsula. Pure Appl. Geophys. 2017, 174, 2773–2792. [Google Scholar] [CrossRef]
- Kim, C.K.; Kim, H.G.; Kang, Y.H.; Yun, C.Y.; Lee, Y.G. Intercomparison of satellite-derived solar irradiance from the GEO-KOMSAT-2A and HIMAWARI-8/9 satellites by the evaluation with ground observations. Remote Sens. 2020, 12, 2149. [Google Scholar] [CrossRef]
- Ruiz-Arias, J.A.; Pozo-Vázquez, D.; Lara-Fanego, V.; Santos-Alamillos, F.J.; Tovar-Pescador, J. A high-resolution topographic correction method for clear-sky solar irradiance derived with a numerical weather prediction model. J. Appl. Meteorol. Climatol. 2011, 50, 2460–2472. [Google Scholar] [CrossRef]
- Lee, J.T.; Kim, H.G.; Kang, Y.H.; Kim, J.Y. Determining the optimized hub height of wind turbine using the wind resource map of South Korea. Energies 2019, 12, 2949. [Google Scholar] [CrossRef]
- Vimmerstedt, L.; Akar, S.; Beiter, P.; Cole, W.; Feldman, D.; Kurup, P.; Ramdas, A.; Rhodes, G.; Stehly, T.; Stright, D.; et al. 2020 Annual Technology Baseline: Land-Based Wind; Technical Report NREL/PR-6A20-76814; National Renewable Energy Laboratory (NREL): Golden, CO, USA, July 2020. [Google Scholar]
- Petkov, I.; Gabrielli, P. Power-to-hydrogen as seasonal energy storage: An uncertainty analysis for optimal design of low-carbon multi-energy systems. Appl. Energy 2020, 274, 115197. [Google Scholar] [CrossRef]
- Luo, Y.; Shi, Y.; Cai, N. Bridging a bi-Directional Connection Between Electricity and Fuels in Hybrid Multienergy Systems; Elsevier Inc.: Amsterdam, The Netherlands, 2021; ISBN 9780128191842. [Google Scholar]
Publisher’s Note: MDPI stays neutral with regard to jurisdictional claims in published maps and institutional affiliations. |
© 2022 by the authors. Licensee MDPI, Basel, Switzerland. This article is an open access article distributed under the terms and conditions of the Creative Commons Attribution (CC BY) license (https://creativecommons.org/licenses/by/4.0/).