Article

Measurement of Rock Electrical Parameters and Analysis of Influencing Factors of Quaternary Mudstone Biogas Reservoirs in Qaidam Basin

1
Research Institute of Exploration & Development of QingHai Oilfield, PetroChina, Dunhuang 736202, China
2
State Key Laboratory of Oil and Gas Reservoir Geology and Exploitation, Chengdu University of Technology, Chengdu 610059, China
*
Author to whom correspondence should be addressed.
Energies 2022, 15(23), 9100; https://doi.org/10.3390/en15239100
Submission received: 18 July 2022 / Revised: 9 October 2022 / Accepted: 21 November 2022 / Published: 1 December 2022
(This article belongs to the Section H1: Petroleum Engineering)

Abstract

:
As a new and unconventional reservoir, Quaternary mudstone biogas reservoirs in the Qaidam Basin are widely distributed and thick. They have great potential for biogas exploration. However, the mudstone biogas reservoirs in this area characterized by weak cementation, high clay content, and easy hydrolysis. Using existing methods, it is difficult to obtain the rock electrical parameters and evaluate the saturation. This greatly affects the evaluation of oil and gas reserves. This study selected core samples from the Quaternary mudstone biogas reservoir in Qaidam Basin, prepared the samples through core conformation pretreatment, and conducted rock electrical experiments using the self-absorption water augmentation method to obtain the rock electrical parameters of the mudstone biogas reservoirs for the first time. Then, the factors influencing the rock electrical parameters of the mudstone biogas reservoir were analyzed. The results showed that: (1) the porosity of the mudstone core samples was generally greater than 20%, and the permeability was in the range of 0.05–5 mD. The rock mineral composition was dominated by clay minerals, followed by carbonate minerals, quartz, and feldspar. The clay mineral composition was mainly illite, followed by montmorillonite and chlorite, with a small amount of kaolinite. (2) The use of wire-electrode cutting and high-temperature, heat-shrinkable tube to wrap the core sample played a supporting and protecting role in the core. Using the self-absorption water augmentation method, information was obtained showing that the distribution of cementation index m of the reservoir core samples ranged between 1.89–2.08, with an average value of 1.99, and the distribution of saturation index n ranged between 1.872–2.270, with an average value of 2.09. (3) Organic matter content had no obvious effect on rock electrical parameters. With the decrease of clay mineral content, the quartz content increased, the permeability increased, and the cementation index increased gradually. The saturation index increased with the increase in clay mineral content and the decrease of quartz content and permeability. The above results laid a petrophysical basis for the evaluation of the saturation of mudstone biogas reservoirs and could provide technical support for the comprehensive evaluation of the reservoir and the calculation of reserves.

1. Introduction

Biogas, also known as biogenic natural gas, is the natural gas formed by the fermentation and synthesis of microbial communities (mainly methanogens and anaerobes) during the early stages of rock formation or organic matter evolution [1,2]. Its total resources account for about 20% of the world’s natural gas resources [3,4]. Due to the wide distribution, large resource reserves, shallow burial depth, and high methane purity, biogas has gradually become an important reserve energy alongside conventional natural gas [5,6]. Qaidam Basin is the largest biogas-producing area in China, and most of its biogas reservoirs are distributed in the Quaternary [7,8]. Since 1958, several biogas fields, such as Sebei, Tainan, Salt Lake, and Tuofengshan, have been discovered [9,10]. However, these gas fields were all found in conventional sandstone biogas reservoirs. In recent years, natural gas exploration and development in mudstone biogas reservoirs have achieved initial results. Taking the Sanhu area in Qaidam Basin as an example, the Quaternary mudstone in this area has an area of about 6 km2 and a thickness of more than 3400 m [11]. Multiple wells obtain industrial gas flow in the Quaternary mudstone reservoirs [12]. Therefore, the Quaternary mudstone biogas has great resource potential and exploration and development value—and is expected to become a new replacement for oil and gas resources.
The Quaternary formation water in Qaidam Basin has high salinity and a limited ability to dissolve biogas. As such, the biogas mainly exists in the free state [13]. Therefore, the free gas content is crucial for the evaluation of biogas reservoirs [14]. The key to calculating the free gas content is to determine the free gas saturation. Due to great differences in the electrical conductivity levels of free gas, formation water, and rock skeleton, the free gas saturation can be measured using resistivity logging and calculation models, such as the Archie model [15], W-S model, dual water model [16,17], and Simandoux equation [18]. Under the premise that the adaptability of the above models to the free gas saturation calculation has not been taken into account, obtaining reliable petrophysical parameters becomes an important petrophysical basis for free gas saturation calculations. According to the current oil and gas industry standards, the common methods to measure the resistivity of rocks in different states and obtain petrophysical parameters mainly include the centrifugal method [19], oil driving water method [20], air-blowing method, and semipermeable membrane method [21]. However, all of the above methods require the core sample to be evacuated, then submerged in formation water, and finally pressurized to fully saturate with formation water. Then, rock resistivity can be measured during the water reduction process of the core sample to obtain rock electrical parameters. The core samples of the Quaternary mudstone biogas reservoir are characterized by high clay and weak cementation, which can be rapidly hydrated and fractured by water, making it difficult to obtain a completed core to complete the subsequent process of resistivity measurement. Therefore, the above methods are not applicable to the resistivity measurement of the mudstone core samples. Liu et al. (2011) and Bai et al. (2017) obtained the rock electrical parameters of carbonate rock and organic-rich core using the self-absorption water augmentation method [22,23]. You et al. (2015) believed that the rock electrical parameter of tight sandstone gas reservoirs could be measured by the self-absorption water augmentation method [24]; Xiong et al. (2019) also used this method to determine the rock electrical parameters of shale [25]. The self-absorption water augmentation method of the core can prevent the formation water from passing through the core, reduce the direct contact between water and core, and help maintain the integrity of the core. Shale and tight sandstone have strong cementation and dense cores, and are thus not easily fractured in water during the self-absorption water augmentation process. However, for mudstone biogas reservoirs, the cores (without protection) could be softened and fractured during the self-absorption water augmentation process.
In this paper, in order to solve the problem (i.e., that the Quaternary mudstone core samples cannot be measured by conventional methods due to their weak cementation, high clay, and easy hydrolysis), core samples of the Quaternary mudstone biogas reservoir in Qaidam Basin were selected for experimentation. By means of the targeted sample preparation and protection, as well as the self-absorption water augmentation method, the rock electrical parameters of the mudstone biogas reservoir were obtained, and the influences of lithology, physical properties, and organic matter content on the rock electrical parameters were also discussed. The research results could provide technical support for the establishment of saturation evaluation methods on mudstone biogas reservoirs.

2. Sample Preparation and Experimental Methods

2.1. Experimental Samples

Eight core samples of mudstone biogas reservoirs in Qaidam Basin were selected and prepared as Φ25–80 mm plunger samples for pore permeability and rock resistivity measurements. In addition, the end faces of the plunger samples and debris samples at the same depth were cut for rock slices, XRD whole rock analysis, and clay and organic matter measurements. The physical properties of plunger core samples showed that the porosity was generally greater than 20%, and the permeability was in the range of 0.075–1.22 mD (Table 1). The identification of rock slices showed that the degree of rock cementation was weak, and that pelitic constituted the matrix. Clay pelitic texture, silty pelitic texture, and fine silt pelitic texture could also be seen. The pelitic components were composed of clay minerals such as illite and montmorillonite, and the silt components included quartz, feldspar, debris, etc. The XRD whole-rock test results showed that the mineral composition was dominated by clay minerals, followed by carbonate minerals (mainly dolomite and calcite), quartz, and feldspar, with a small amount of gypsum salts. Among these, the average content of brittle minerals (quartz and carbonate rocks) was 34.7%. The clay mineral composition was mainly illite, followed by montmorillonite and chlorite, with a small amount of kaolinite.

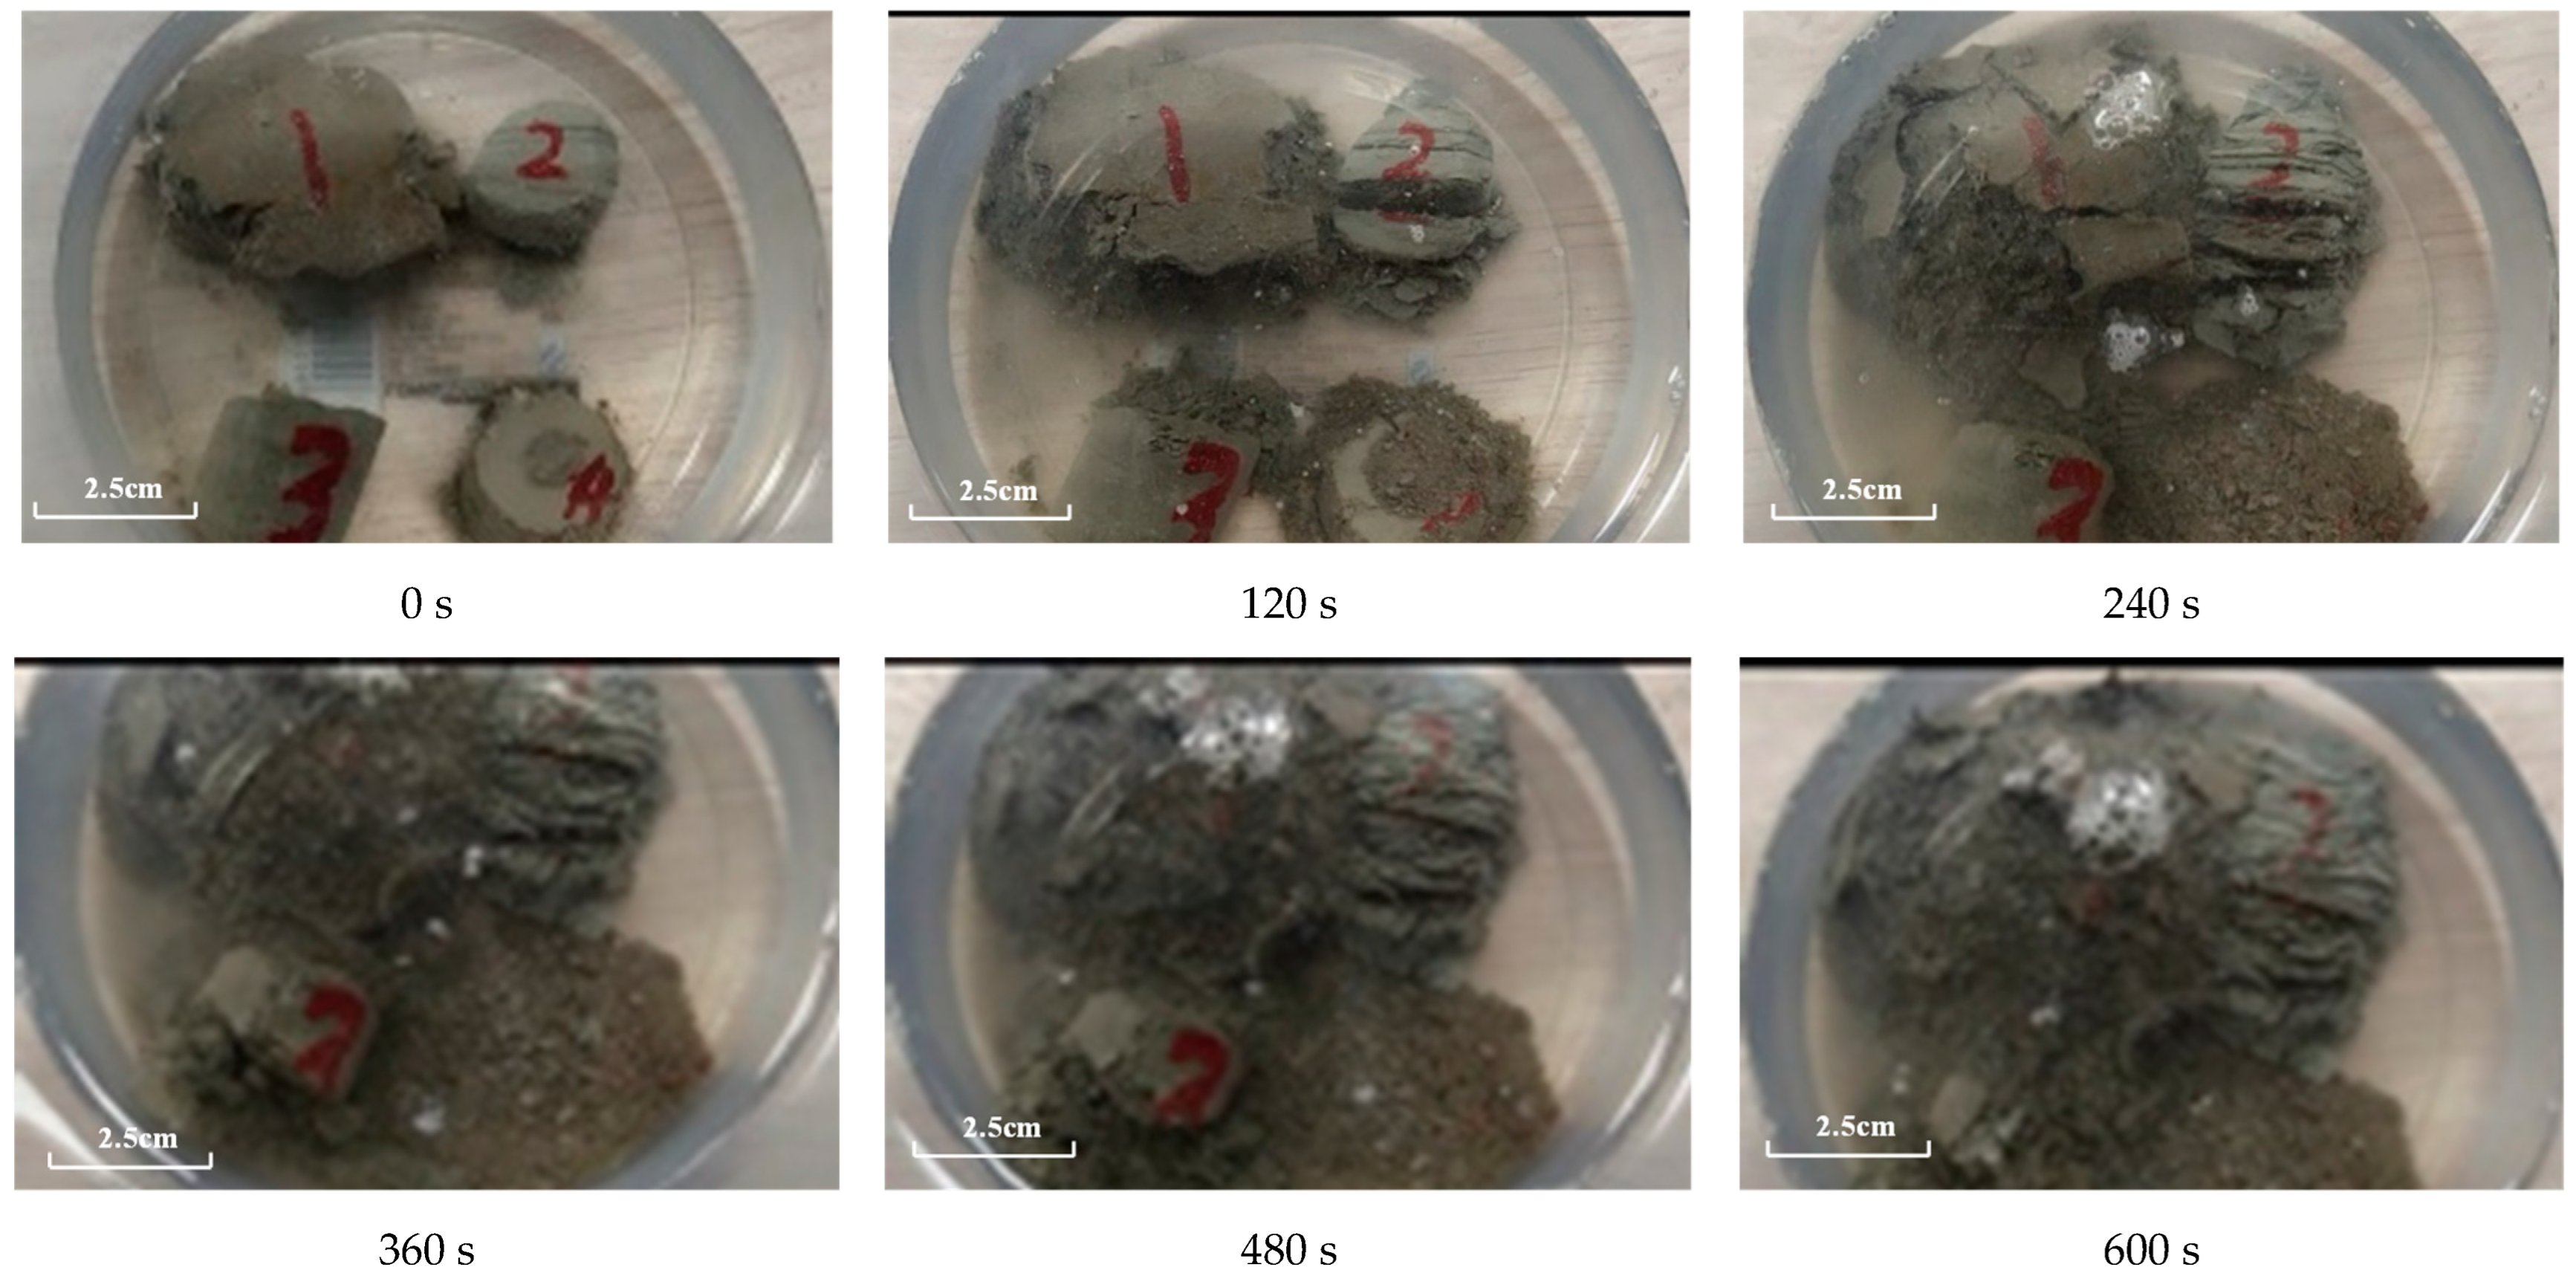
2.2. Preliminary Experiments for Rock Electrical Parameter Measurement of Biogas Reservoirs

According to the oil and gas industry standards of the People’s Republic of China “Laboratory Measurement and Calculation Method of Rock Resistivity Parameters” (SY/T 5385-2007), the rock electrical parameter measurements require the evacuated core samples to be submerged into the formation water under pressure in order to obtain water-saturated samples. Considering the weak rock formation, poor cementation, and high clay content of the mudstone biogas reservoir, rock resistivity measurements could not be completed because samples were easily disintegrated by water. In this study, four fragmented samples containing different clay minerals were selected and put into the formation water solution for saturation pre-experiment. The formation water in this area was of the calcium chloride type (CaCl2), with an average mineralization of 118,484 mg/L. Figure 1 shows the disintegration process of the core samples during the saturation pre-experiment. When the core samples were placed into the formation water, a large number of air bubbles were generated on the surface of core samples due to the rapid water absorption. At the same time, the surface of core samples began to drop debris, and the core samples were obviously peeled off after 2 min. After 4 min, only one core sample remained in a relatively complete shape. After 6 min, all the core samples began to disintegrate, and after 10 min, the core samples completely disintegrated into fine debris.
In the early stage of soaking, the aqueous solution penetrated the core sample along the pores and fissures, and the clay minerals rapidly absorbed water and expanded. The surface of the core sample expanded locally while the interior remained dry. At this time, local tensile stress occurred on the surface of the core sample. When the tensile stress at a certain position of the core sample was greater than its tensile strength, microcracks appeared on the surface of the core sample. At the same time, the dissolution action of water on mineral particles resulted in a large number of pores in the core sample. The existing fissures further expanded to the inside of the core sample to form larger fissures, and the core sample fractured when the fissures penetrated. With the increase in soaking time, the core sample gradually disintegrated into small fragments. The conventional method of vacuuming and pressurizing saturation is to place the core sample in a vacuum-saturated cylinder filled with saturated solution, bring the saturated cylinder to a certain atmospheric pressure using a vacuum pump, and press the saturated solution into the core sample [26]. This method is suitable for rocks that are not easily disintegrated in contact with water [27]. The core samples of mudstone biogas reservoirs are very easy to disintegrate when exposed to water, making it difficult to prepare complete water-saturated core samples. Therefore, it was impossible to measure the rock electrical parameters of core samples from the mudstone biogas reservoir using the existing oil and gas industry standards.

2.3. “Self-Absorption Water Augmentation Method” for Rock Electrical Parameter Measurement

The self-absorption water augmentation method forces the core sample to absorb formation water under capillary force by immersing one end in water [24]. Different water saturation levels of core samples can be achieved by controlling the immersion time. This method can prevent the formation water from passing through the core, reduce the direct contact between water and core, and help maintain the integrity of the core [28]. At the same time, in order to prevent the core from softening and breaking in the self-absorption water augmentation process, the core needs to be protected. Therefore, we designed the following core preparation method based on the self-absorption water augmentation method for rock resistivity measurement.
(1)
Core conformation pretreatment: The experimental core sample was cut to the design size by wire-electrode cutting to ensure the end face was flat (Figure 2a). At the same time, in order to prevent the core sample from softening and cracking, a highly temperature-resistant, heat-shrinkable sleeve was used to wrap it (the surrounding surface of the core sample was wrapped, and the two ends were exposed) in order to support and protect the core sample and ensure the integrity of the core sample in the subsequent experiment process (Figure 2b).
(2)
Measurement of rock electrical parameters: The water saturation of the core sample was controlled using the capillary self-absorption method, and the resistivity measurement of the core sample was conducted under different water saturation states.
The preliminary experimental results showed that the conventional method of vacuuming and pressurizing saturated water could lead to dissolution and disintegration of the biogas core sample. In this study, based on the principle of the capillary self-absorption method, the water saturation of the core samples was increased until it reached a fully saturated state. The specific steps were as follows:
① According to the porosity and permeability of the sample under normal temperature and pressure, the pore volume of the mudstone core sample was obtained. Then, we calculated the mass of water for self-absorption of the core sample to reach different water saturation states according to the pore volume and formation water density.
② The mudstone core sample was placed in a dry balance and a needle was used to drip formation water at both ends of the core sample at a constant rate until both ends were fully self-absorbed. At the same time, we observed changes in the mass of the balance. According to the mass requirements of self-absorption under each saturation state in Step ①, we continued to drip formation water to the specified mass until the core sample reached the corresponding saturation.
③ The core sample that reached the corresponding saturation was quickly placed in a vacuum vessel and a small amount of saturated aqueous solution was added to the bottom of the real vessel to keep the environment moist. First, we vacuumed the sample for 30 m and then let it stand for 3 h, after which its mass was measured and recorded. Then, it was allowed to stand for 3 h, after which the two masses were compared to ensure the mass change was within the range of ±0.05 g. After meeting the mass change conditions, the sample was allowed to stand for another 12 h to ensure that the formation water was evenly distributed inside the core sample.
④ The core sample was weighed and then loaded into the holder with the specified confining pressure, axial pressure, pore pressure, and temperature. After the parameters were stable, the resistance value changes were recorded. When the resistance value was stable, the resistance value was recorded and denoted as Rt.
⑤ According to the 10% increase of water saturation of the core sample, steps ①–④ were repeated for the core sample until the water saturation reached 100%. The criterion for determining the saturation state was as follows: the core sample was weighed within 48 h of standing until its mass did not change (the number of weighing repetitions should be no less than 3 times in a strict standing environment, and the mass difference should be guaranteed to be ±0.05 g), at which point the sample was considered to have reached the saturated state.
⑥ The core sample (which was 100% saturated with water) was then weighed and recorded. After the parameters stabilized, we recorded the stable resistance value of the core sample in the fully saturated water state, denoted as R0.

3. Experimental Results

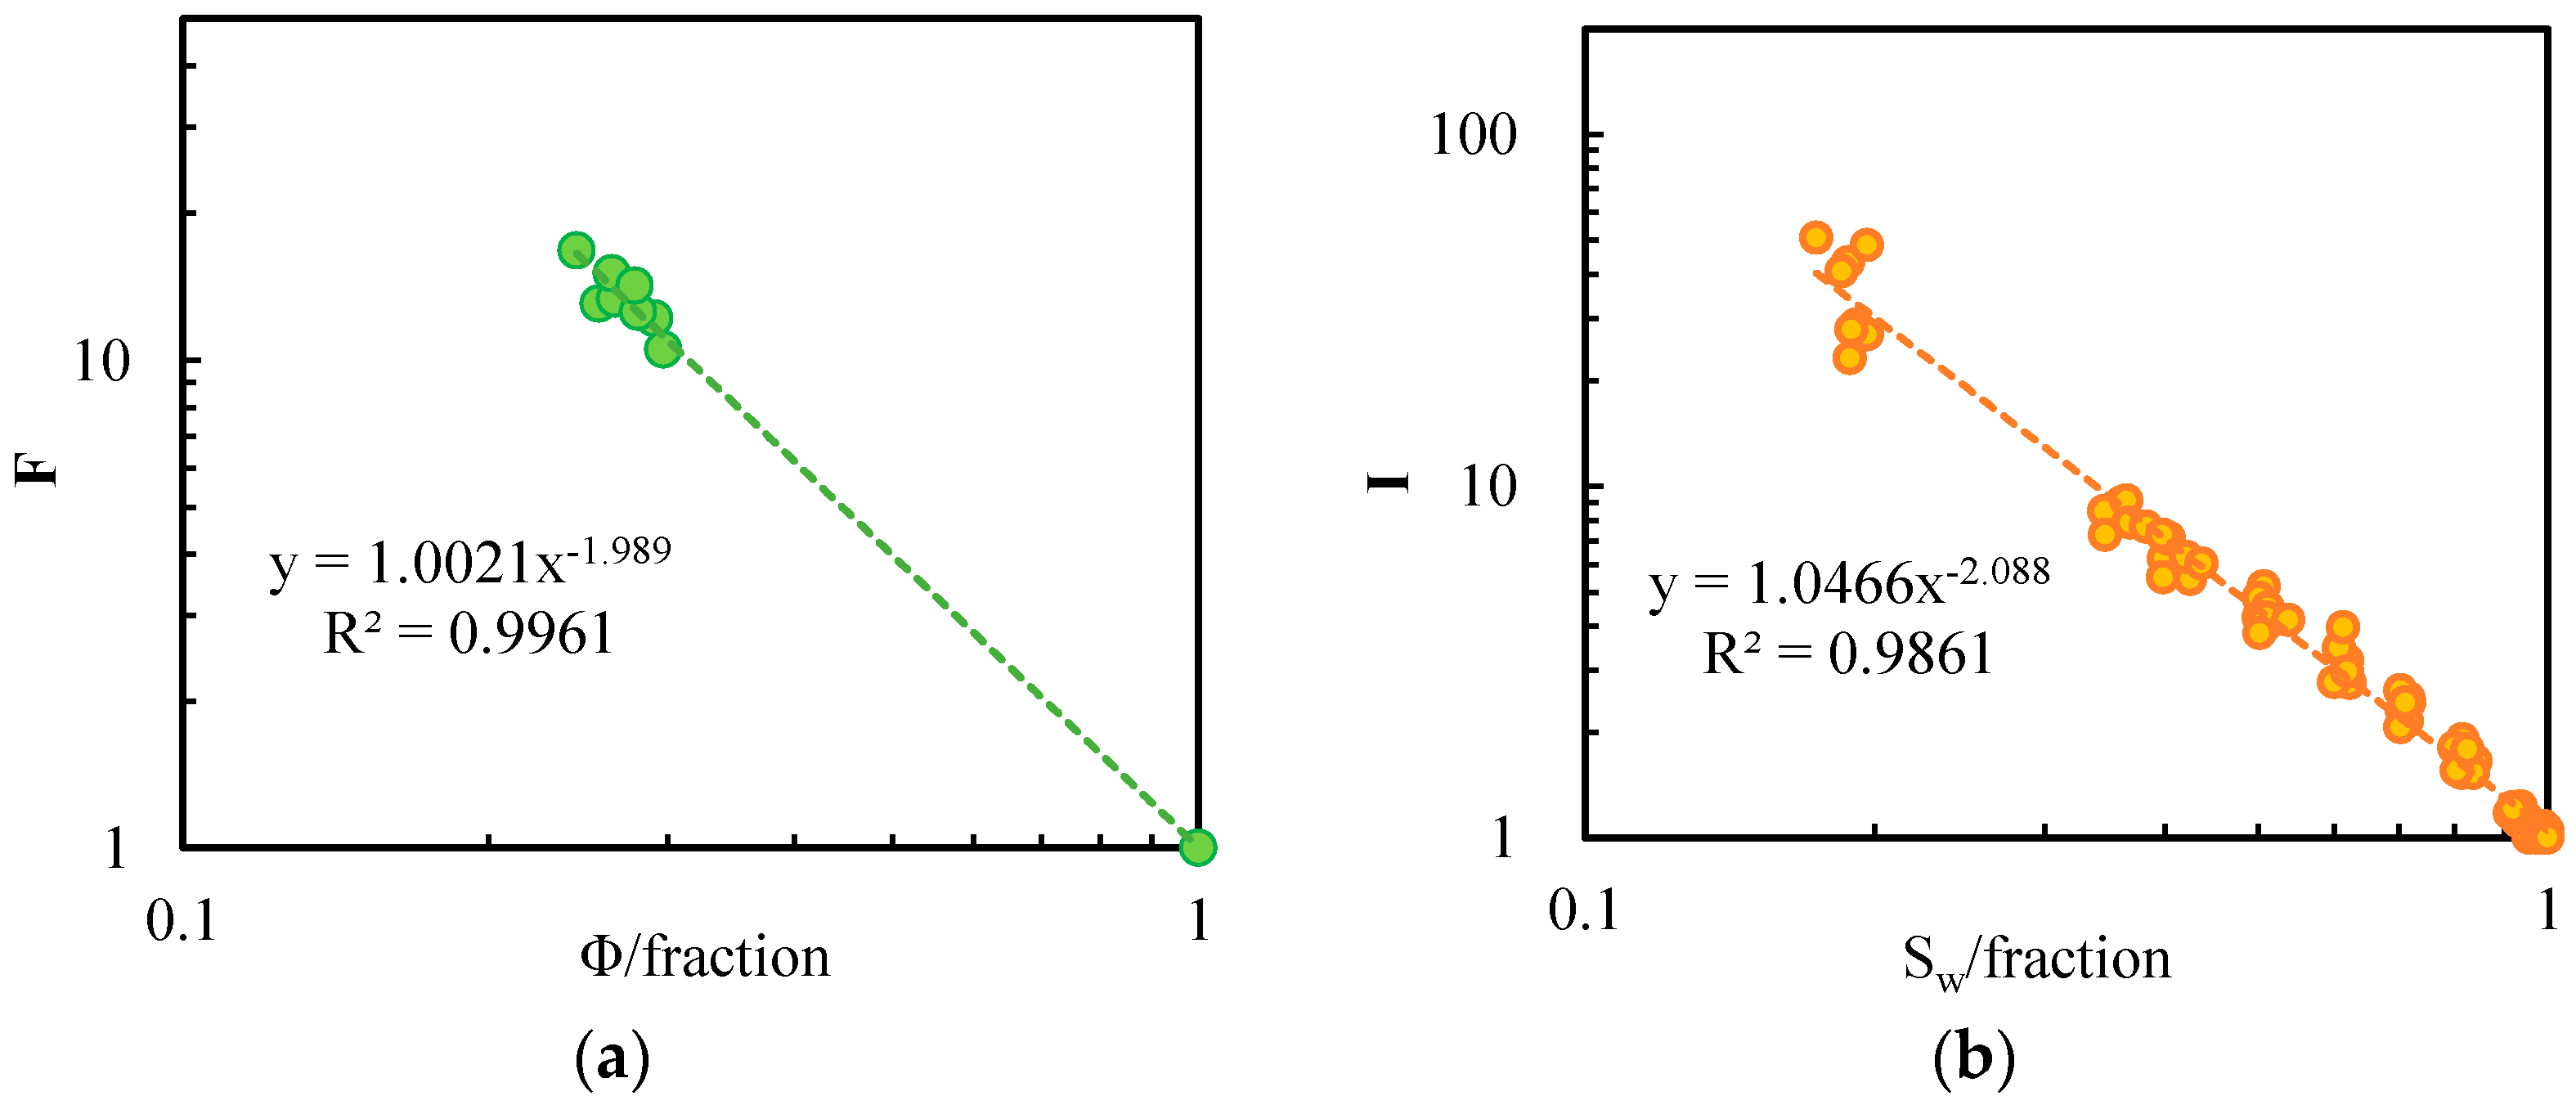
3.1. Relationship between Formation Factors and Porosity

Figure 3a shows the correlation fitting curve of formation factor F and the porosity of the 8 core samples. In the double logarithmic coordinate system, the correlation between formation factors and porosity was good, and the distribution was power exponential. The cementation index was m = 1.989, the lithology coefficient was a = 1.0021, and the correlation coefficient was R2 = 0.9961. The core porosity could reflect the connectivity of the pore structure to a certain extent. Generally, the larger the porosity, the better the connectivity of the core sample pores. Likewise, the simpler the pore structure, the better the rock conductivity. Therefore, according to Archie’s formula, shown in Equation (1), the smaller the rock resistivity, the smaller the factor F [15,29].
F = R 0 R w = a φ m
where F is formation factor, dimensionless; R0 is the rock resistivity of 100% water saturation, Ω·m; Rw is formation water resistivity, Ω·m; φ is rock porosity, f; a is a lithology-related coefficient, dimensionless; and m is the cementation index, dimensionless.

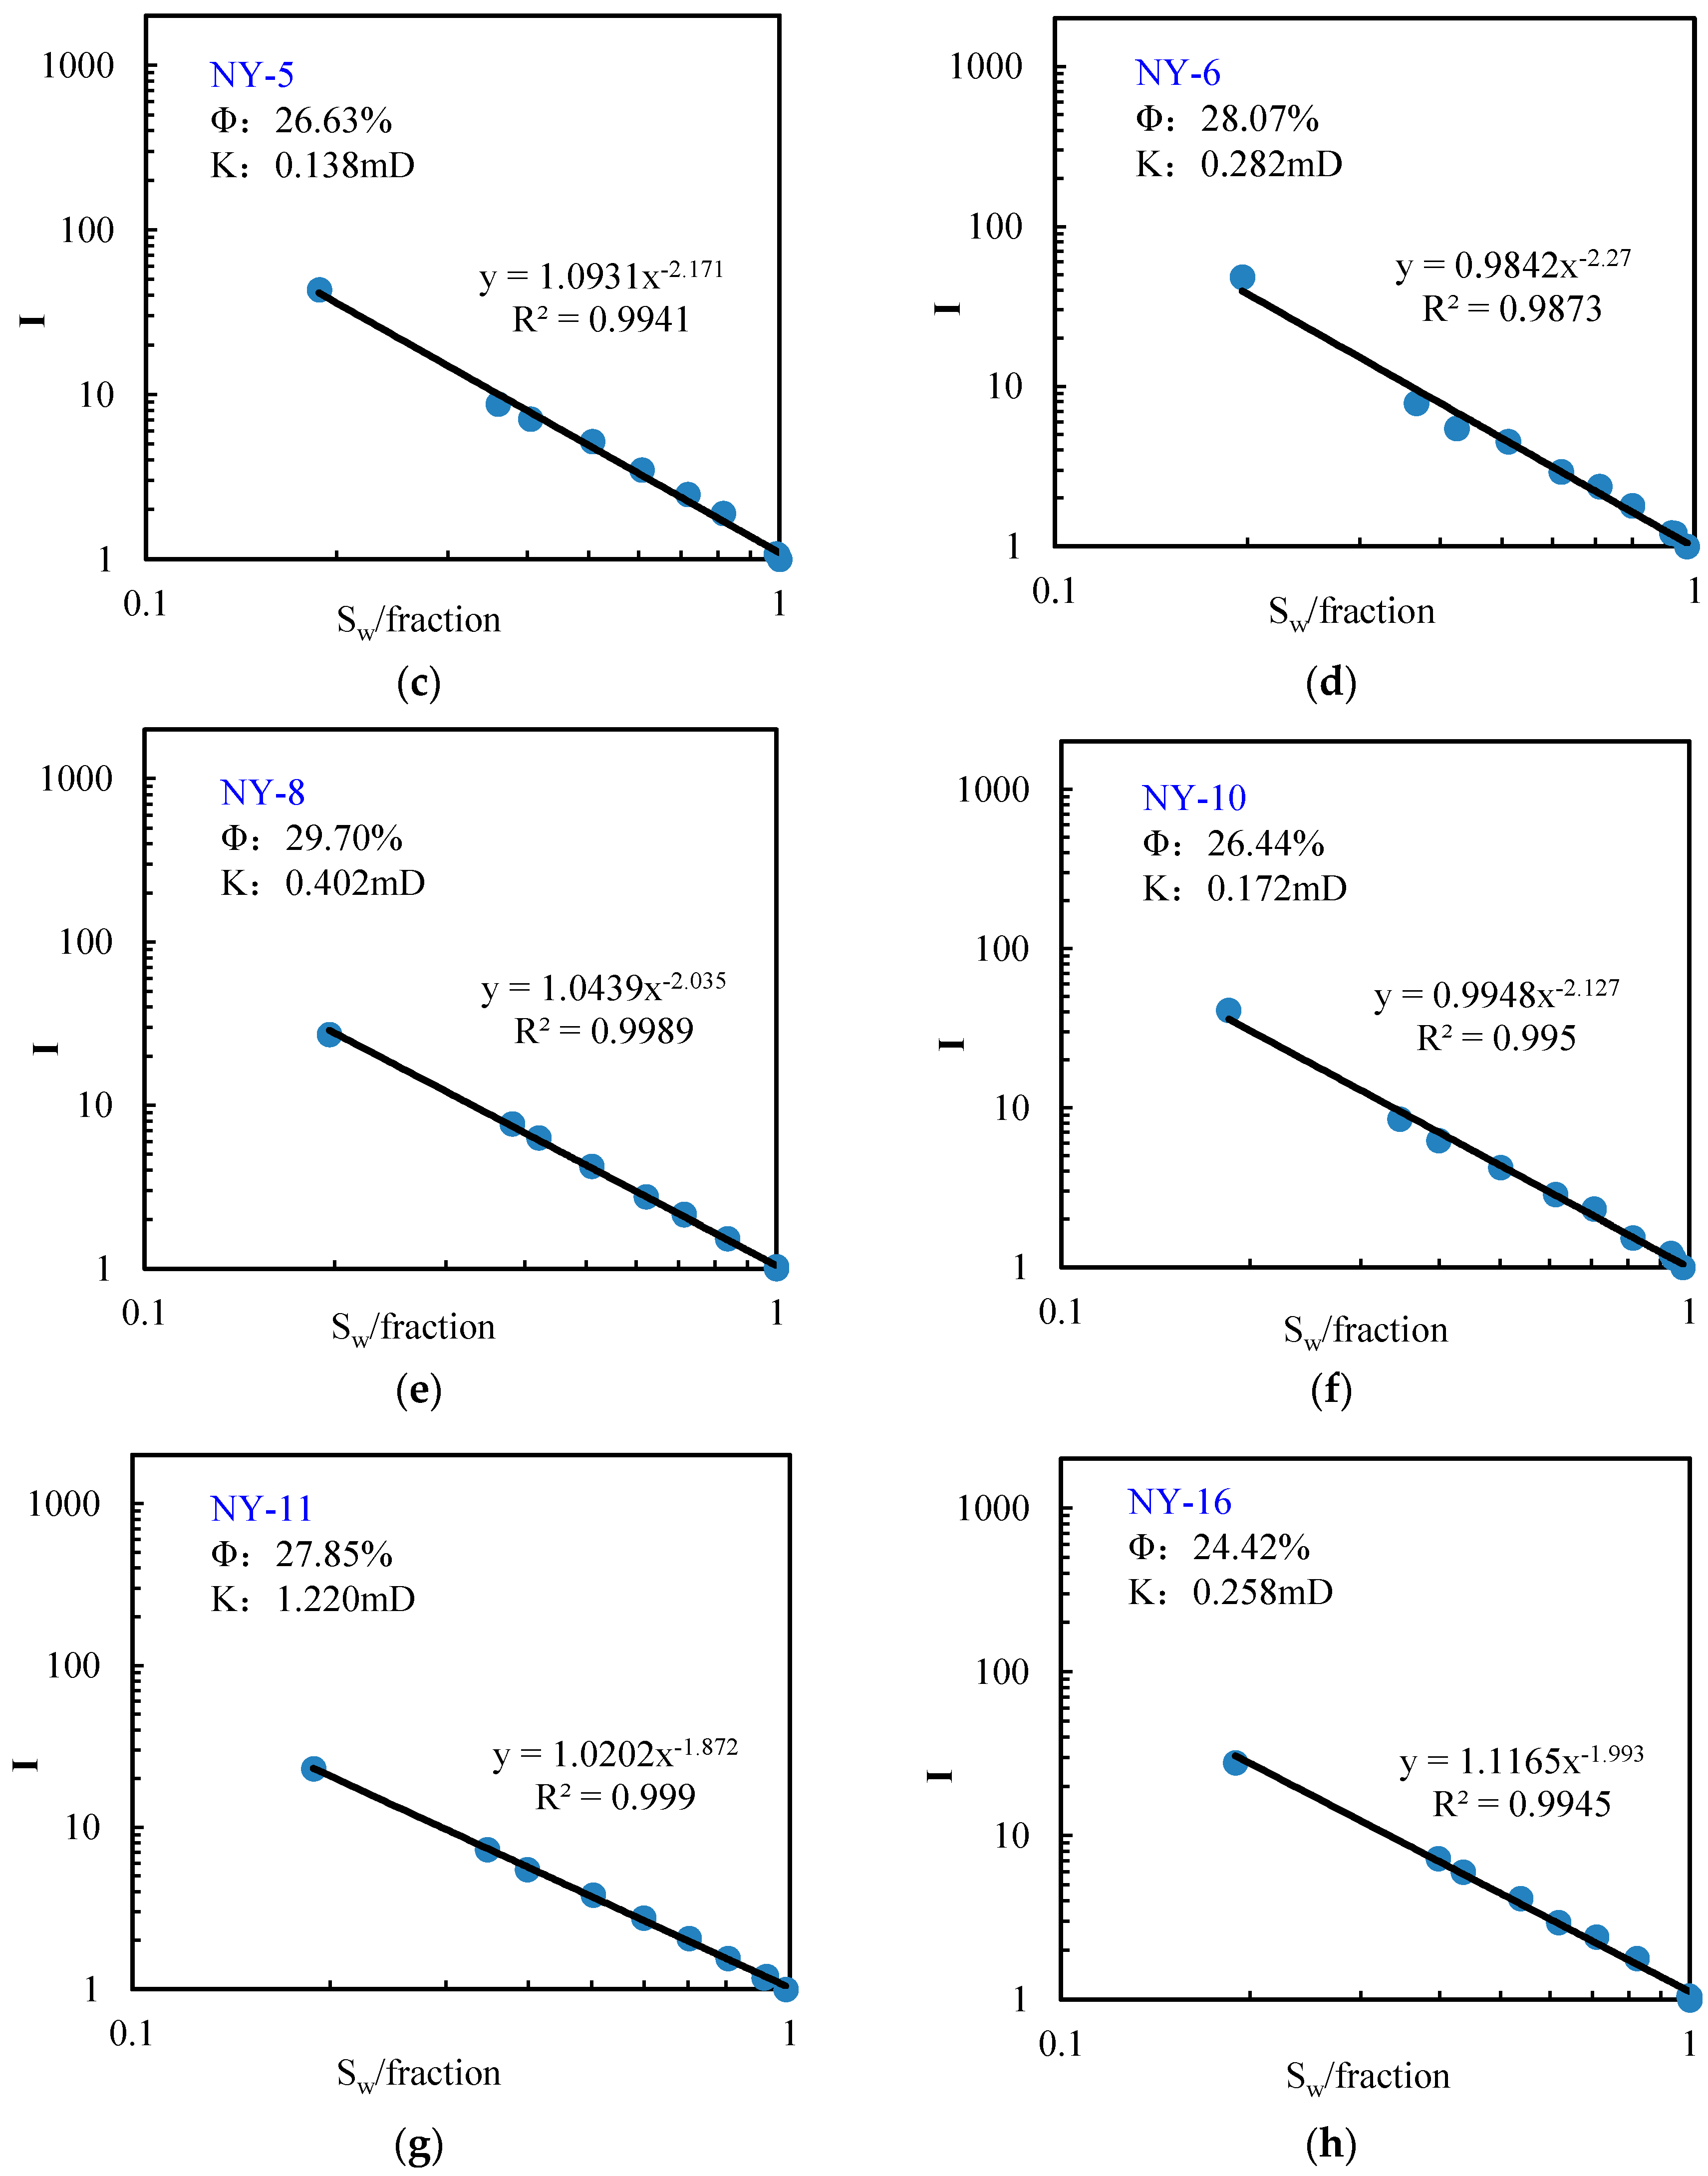
3.2. Relationship between Resistivity Index and Water Saturation

By fitting the relativity of the experimental data of rock electrical parameters of the 8 core samples based on the Archie formula (Equation (2)) (Figure 3b), it was determined that the resistivity index of the core samples was in a power exponential relationship with water saturation. The saturation index n and lithology coefficient b of the core samples was determined by the fitting formula. The saturation index of 8 core samples was n = 2.088, the lithology coefficient was a = 1.0466, and the correlation coefficient was R2 = 0.9861.
I = R t R 0 = b S w n
where I is the resistivity index, dimensionless; R0 is the rock resistivity of 100% water saturation, Ω·m; Rt is the formation water resistivity, Ω·m; Sw is the water saturation of the rock, decimal; b is a lithology-related coefficient, dimensionless; and n is the saturation index, dimensionless.

3.3. Cementation Index m and Saturation Index n

The experimental data of a single mudstone core sample were analyzed. We let a = 1, and performed regression processing according to Equation (1) to obtain the cementation index m of each core sample. As shown in Table 2, the cementation index m of the core samples fell in the range of 1.89–2.08, with an average value of 1.99.
According to Equation (2), the saturation index n and coefficient b of each core sample can be obtained by regression processing, as shown in Table 2 and Figure 4. As shown in Figure 4, the saturation index was in the range of 1.872–2.270. The experimental data of No.8 and No.11 core samples were mostly in line with Archie’s characteristics, indicating that the two core samples had good lithology and high porosity and permeability. The No.2, No.3, No.5, and No.6 core samples were in a low water saturation range, and the I-SW curve showed an upwardly-curved Archie nonlinear phenomenon. The No.3 and No.6 core samples were in a high water saturation range, and the I-SW curve showed a downwardly-curved Archie nonlinear phenomenon. The reason for this was that the micro pore throat parameters such as pore structure, connectivity, pore size, and water film thickness could affect the nonlinear seepage of the core samples.

4. Discussion and Analysis

The cementation index m and saturation index n of the reservoir rock were affected by lithology, physical properties, wettability, organic matter, and other factors. Since the Quaternary mudstone biogas reservoirs ere all hydrophilic [30], the effects of lithology, physical properties, and organic matter content on rock electrical parameters were discussed.

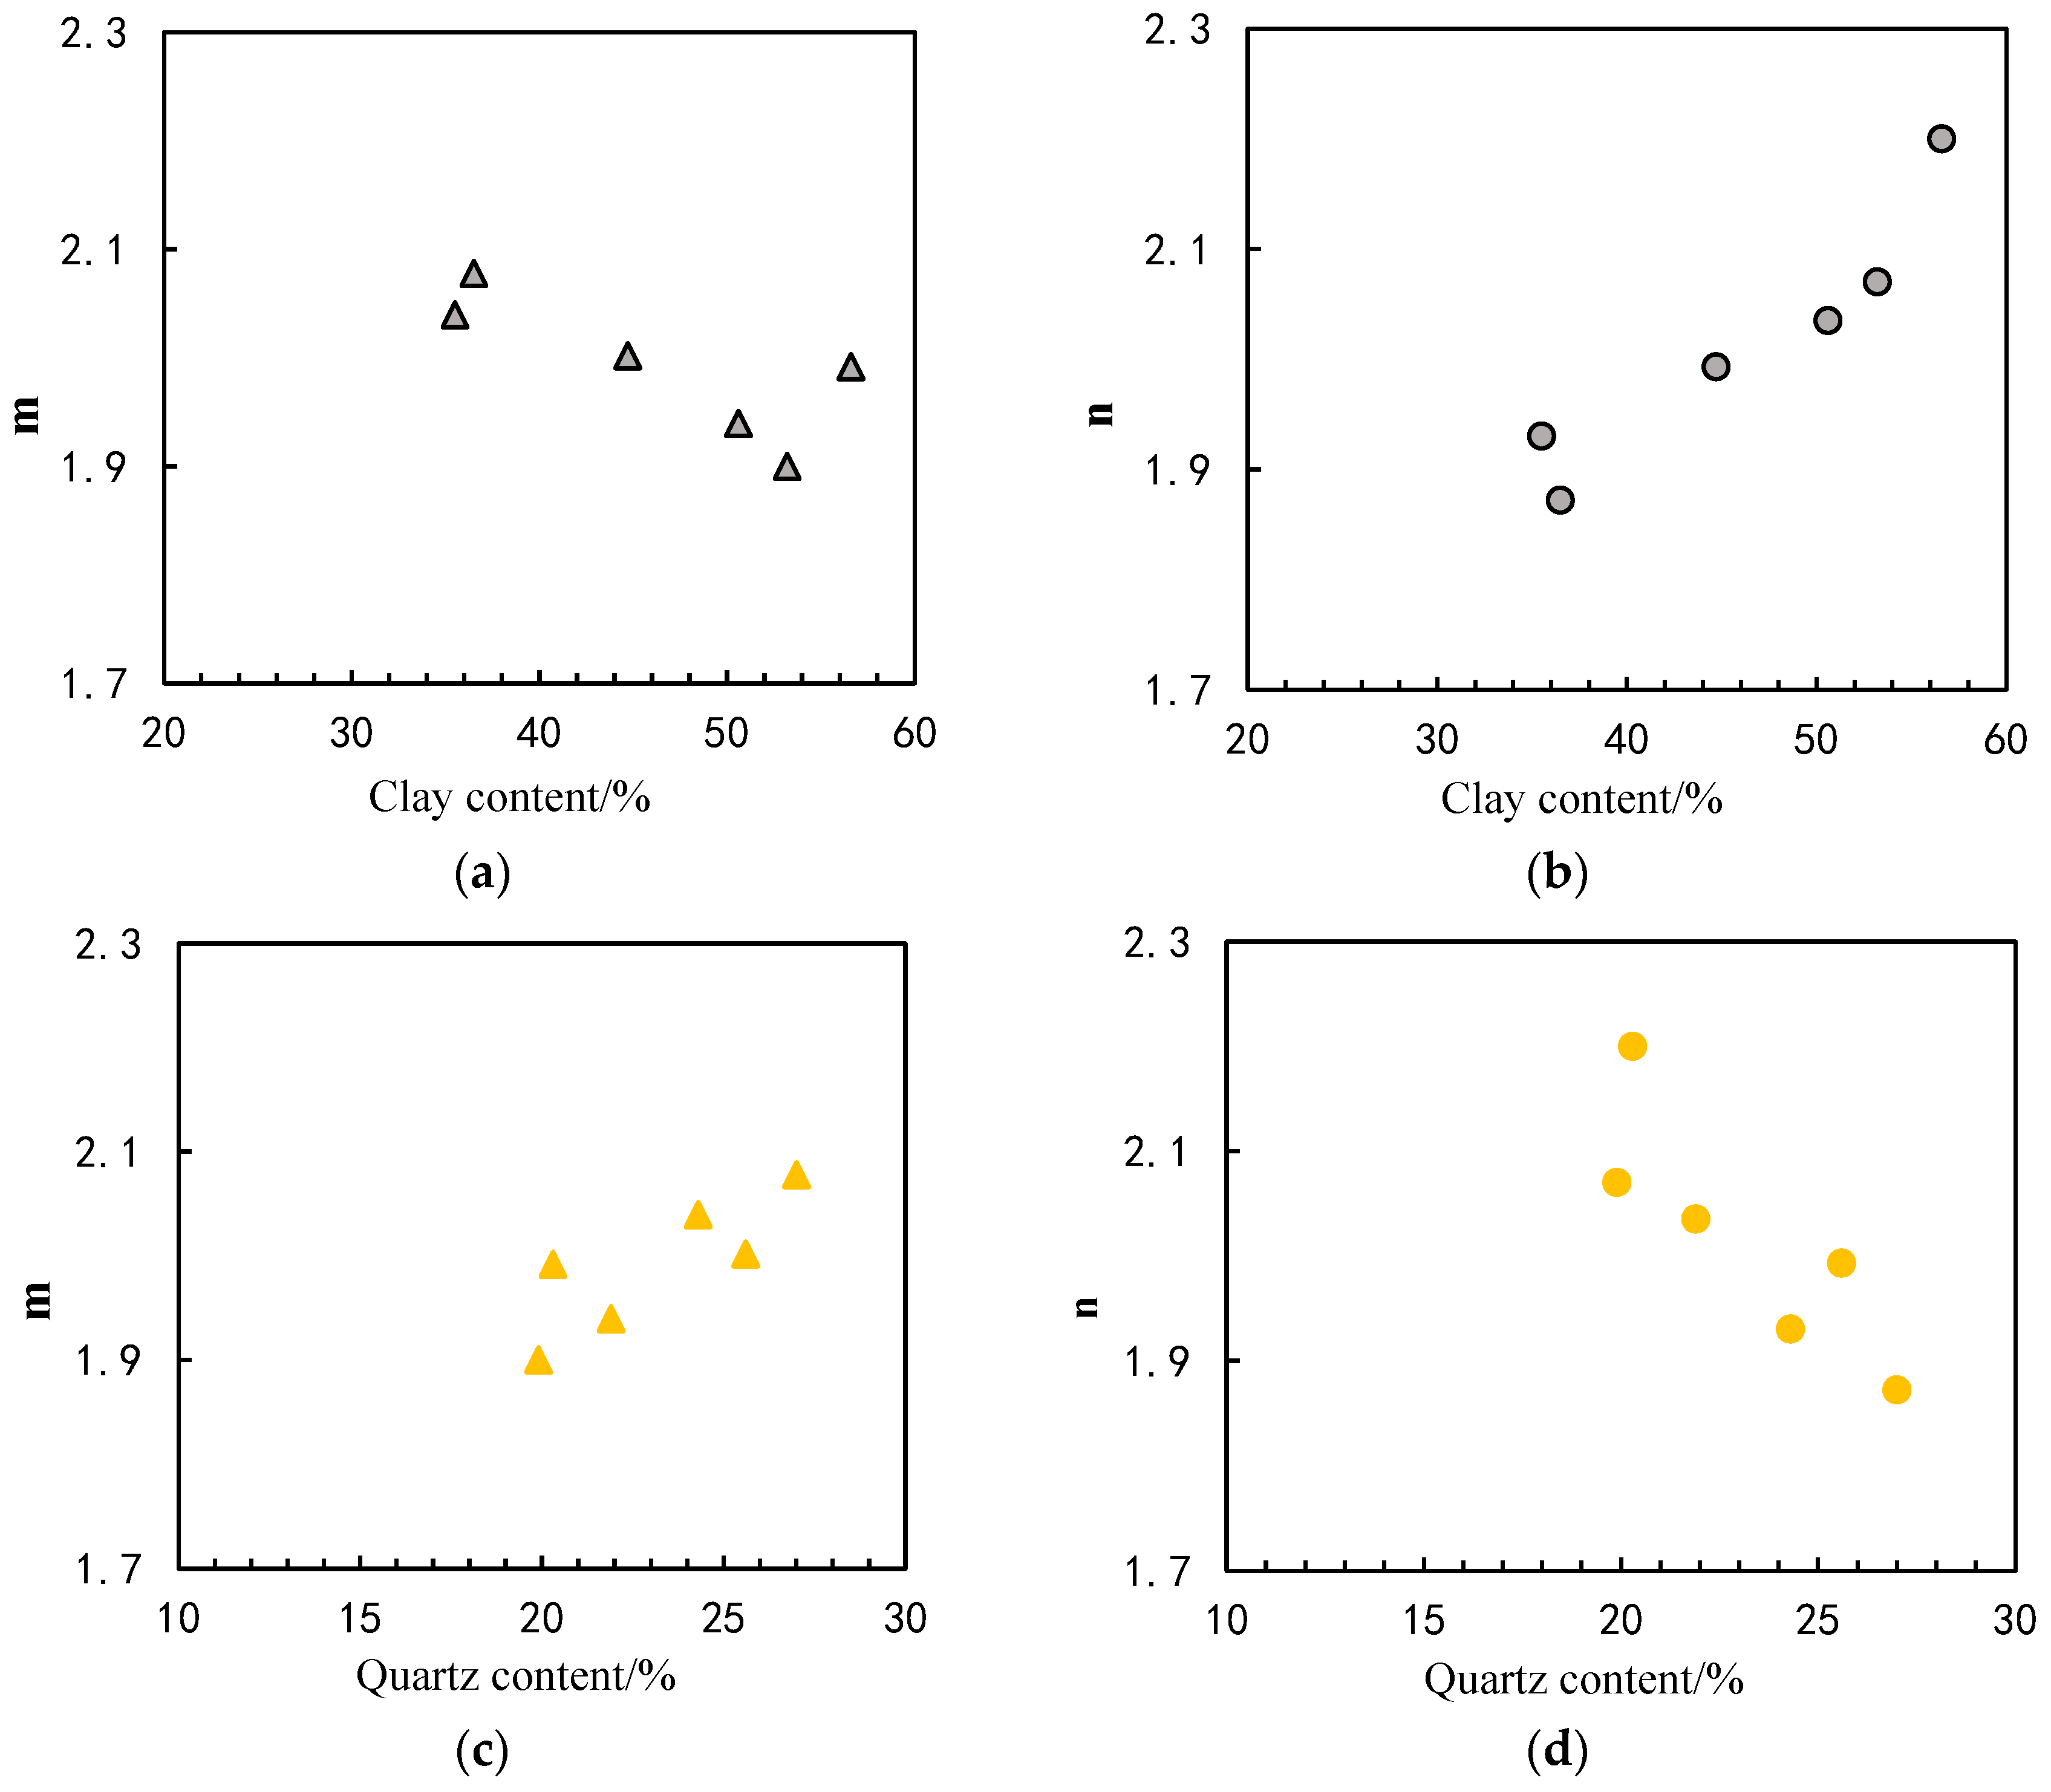
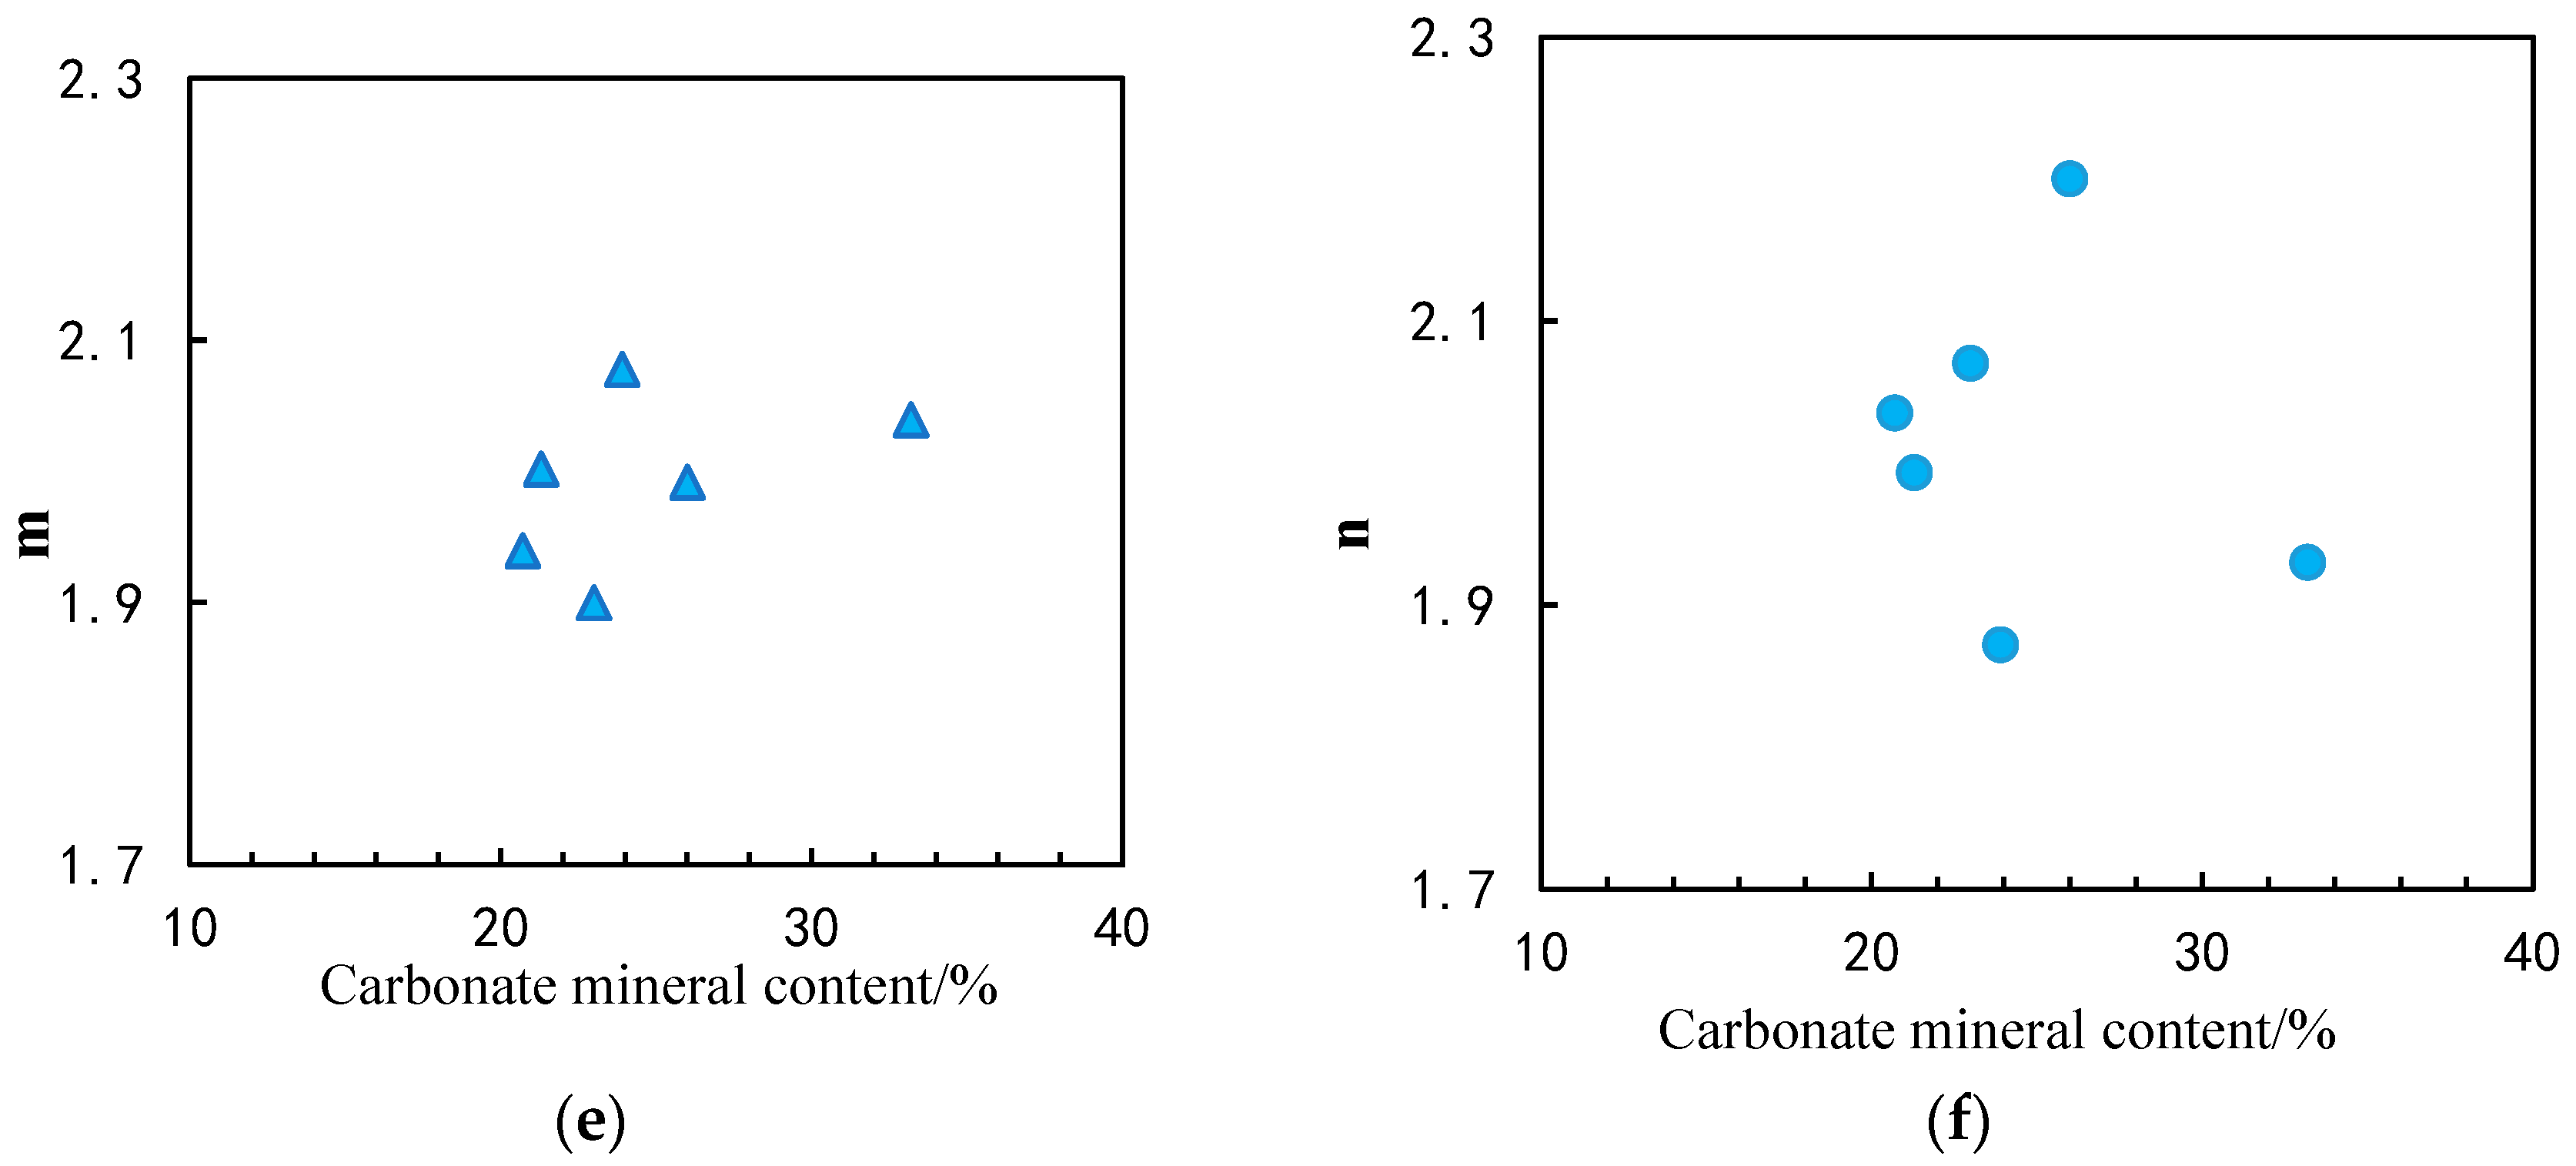
4.1. Influence of Lithology on Rock Electrical Parameters

The relationship between the clay mineral content and the cementation index and saturation index of mudstone core samples (Figure 5a,b) showed that, with the increase of clay mineral content, the cementation index decreased and the saturation index increased. This indicated that the increase in the clay mineral content led to poor connectivity of pores in the mudstone, which in turn led to the decrease of m value and the increase of n value. Figure 5c,d showed that the cementation index increased and the saturation index decreased with the increase of quartz content, indicating that the increase of quartz content enhanced the internal pore connectivity of the mudstone core sample, leading to the increase of m value and the decrease of n value. As shown in Figure 5e,f, there was no significant correlation between the cementation index and saturation index and the carbonate rock mineral content. The above analysis showed that the clay and quartz contents in the mineral composition of the mudstone biogas reservoir had obvious effects on the rock electrical parameters. To be specific, the cementation index m increased with increasing quartz content and decreased with increasing clay content, while the saturation index n decreased with increasing quartz content and increased with increasing clay content.

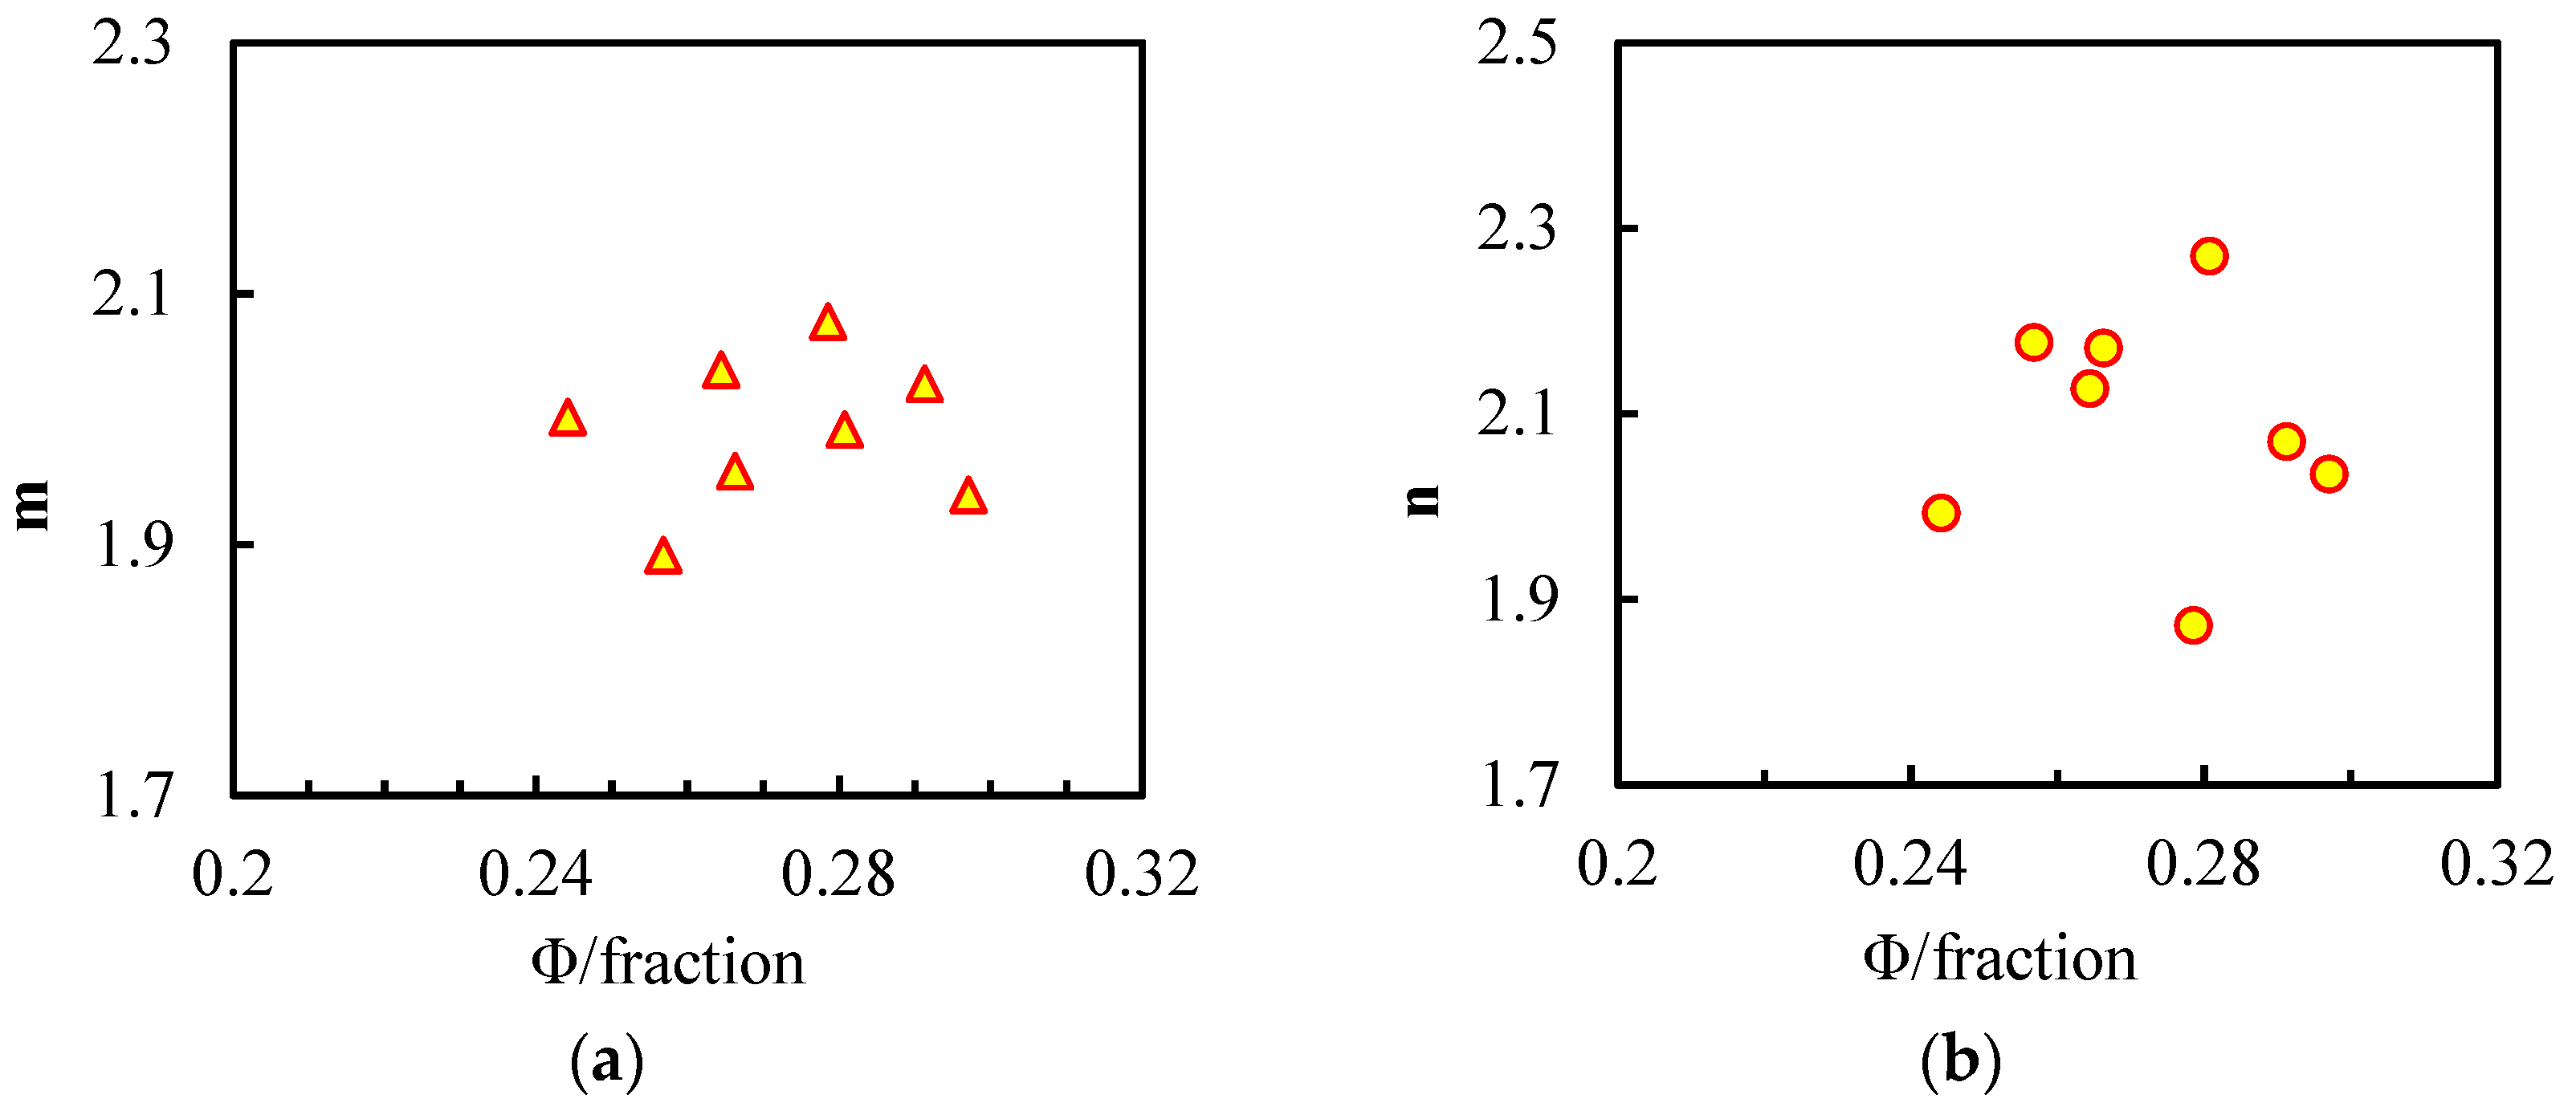
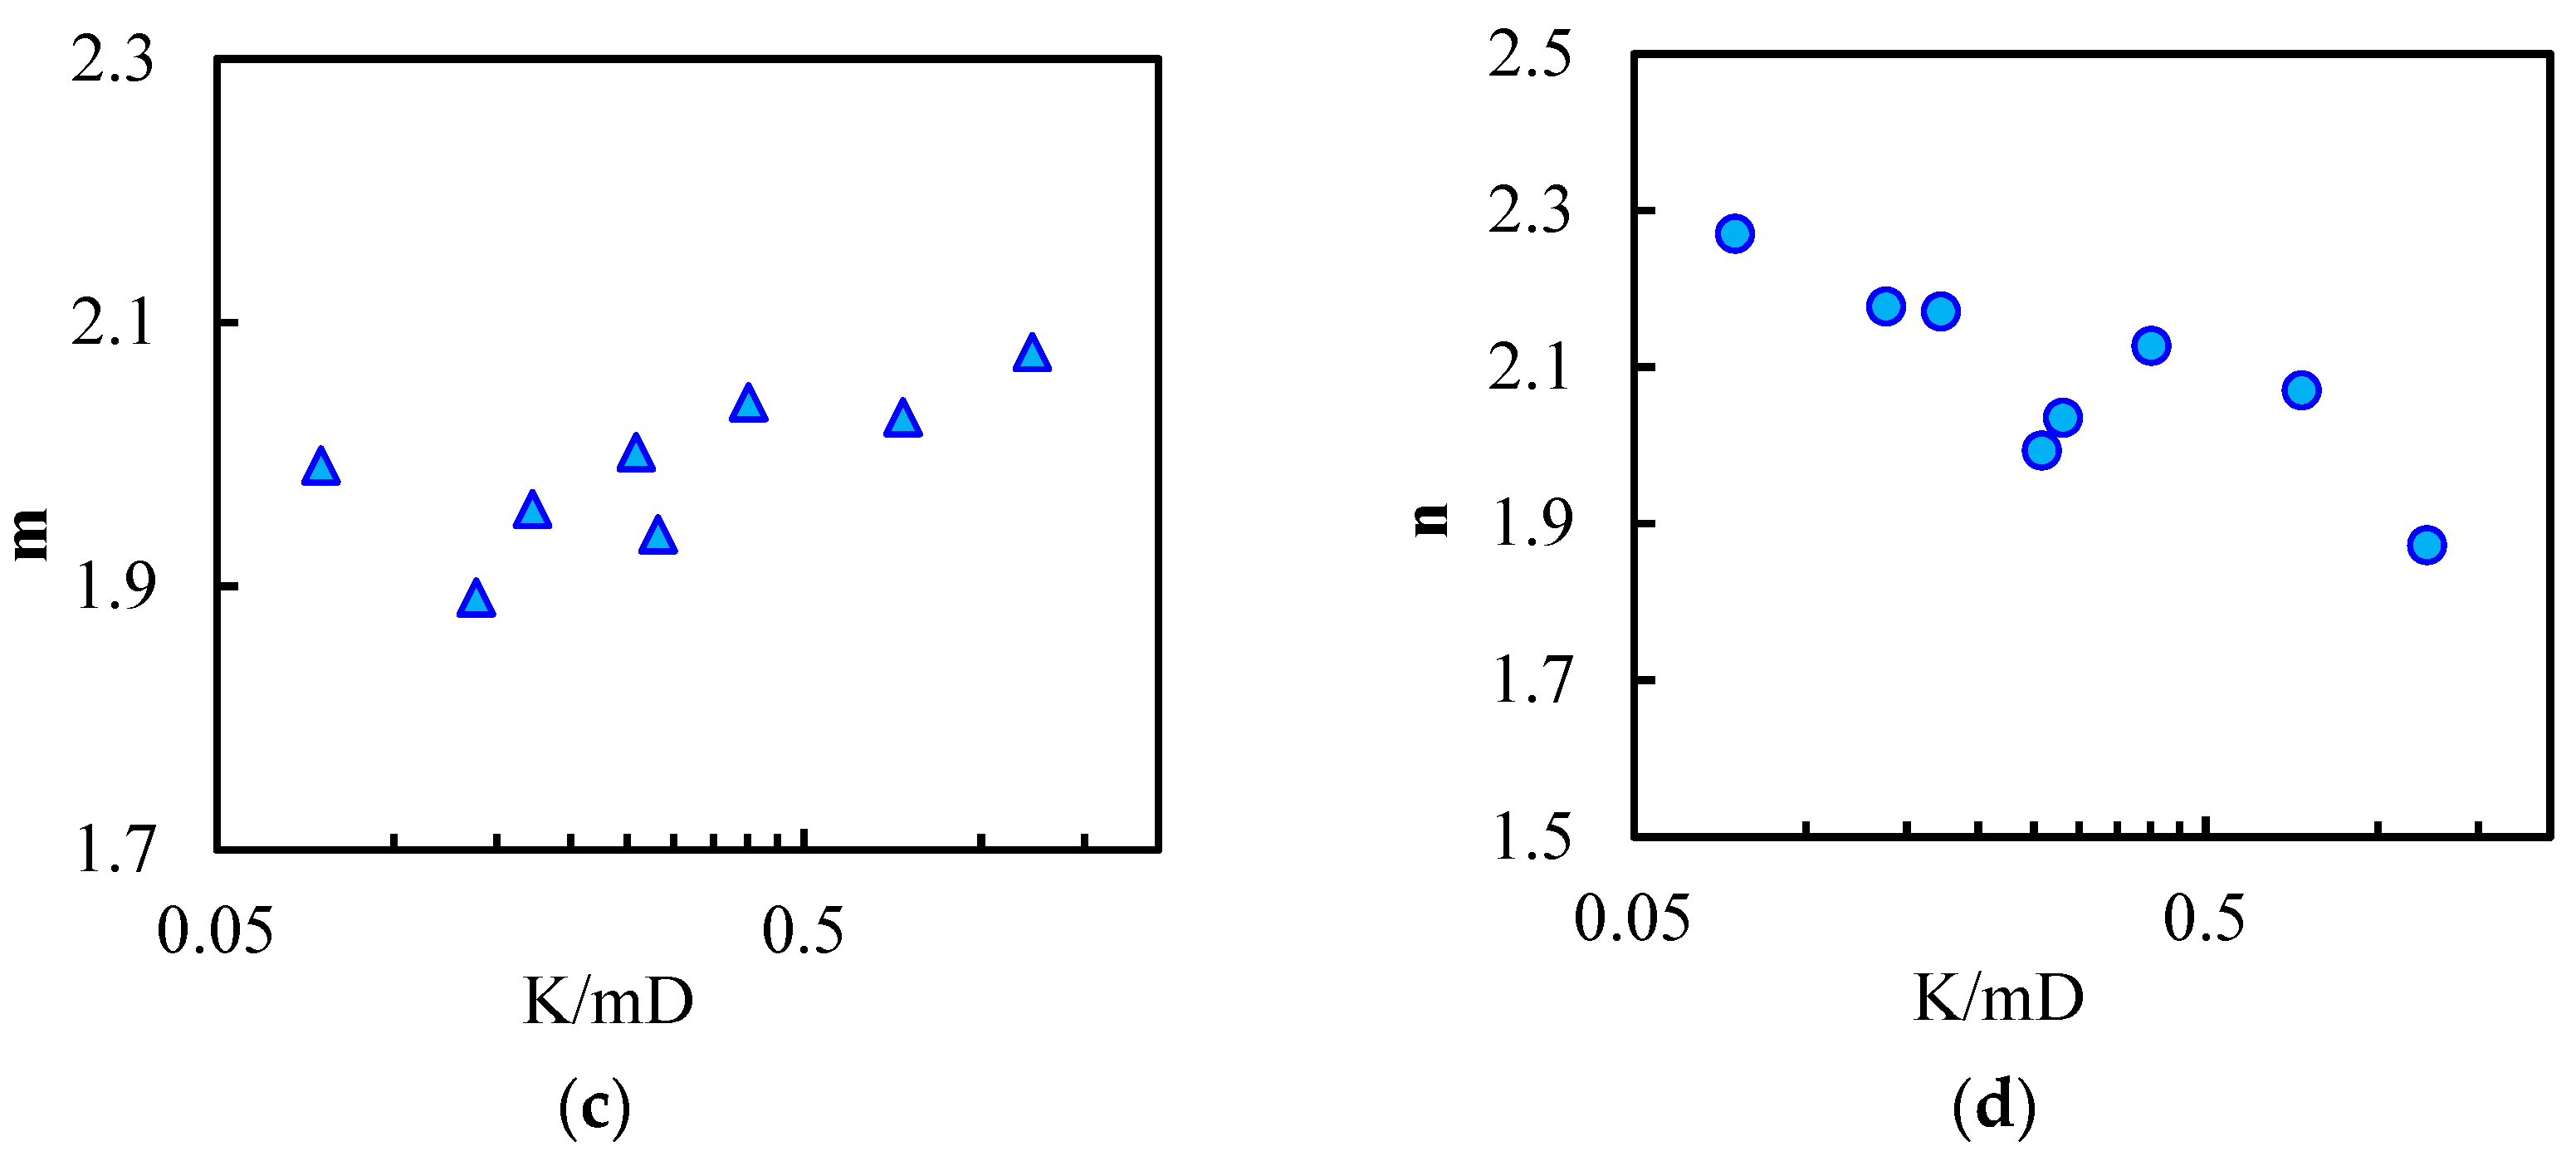
4.2. Influence of Physical Properties on Rock Electrical Parameters

The relationship between the cementation index and saturation index and the porosity of mudstone core samples (Figure 6a,b) showed no obvious correlation between cementation index, saturation index, and porosity. In general, the m value increased with the increase of porosity, and the n value decreased with the increase of porosity. The reason for this rule was that, as the rock porosity increased, the pore structure improved. The porosity of the Quaternary mudstone biogas reservoir core samples was generally greater than 20% and the variation range is small. The pore size distribution was primarily unimodal, mainly in the range of 2 nm–50 μm. The variation degree of porosity could not characterize the pore structure of rocks.
The relationship between the cementation index and saturation index and the permeability (Figure 6c,d) showed that the cementation index increased with the increase of permeability, and the saturation index decreased with the increase of permeability. Since permeability is a parameter that macroscopically characterizes the pore structure of rocks, the better the pore structure of the sample, the larger the m value and the smaller the n value.

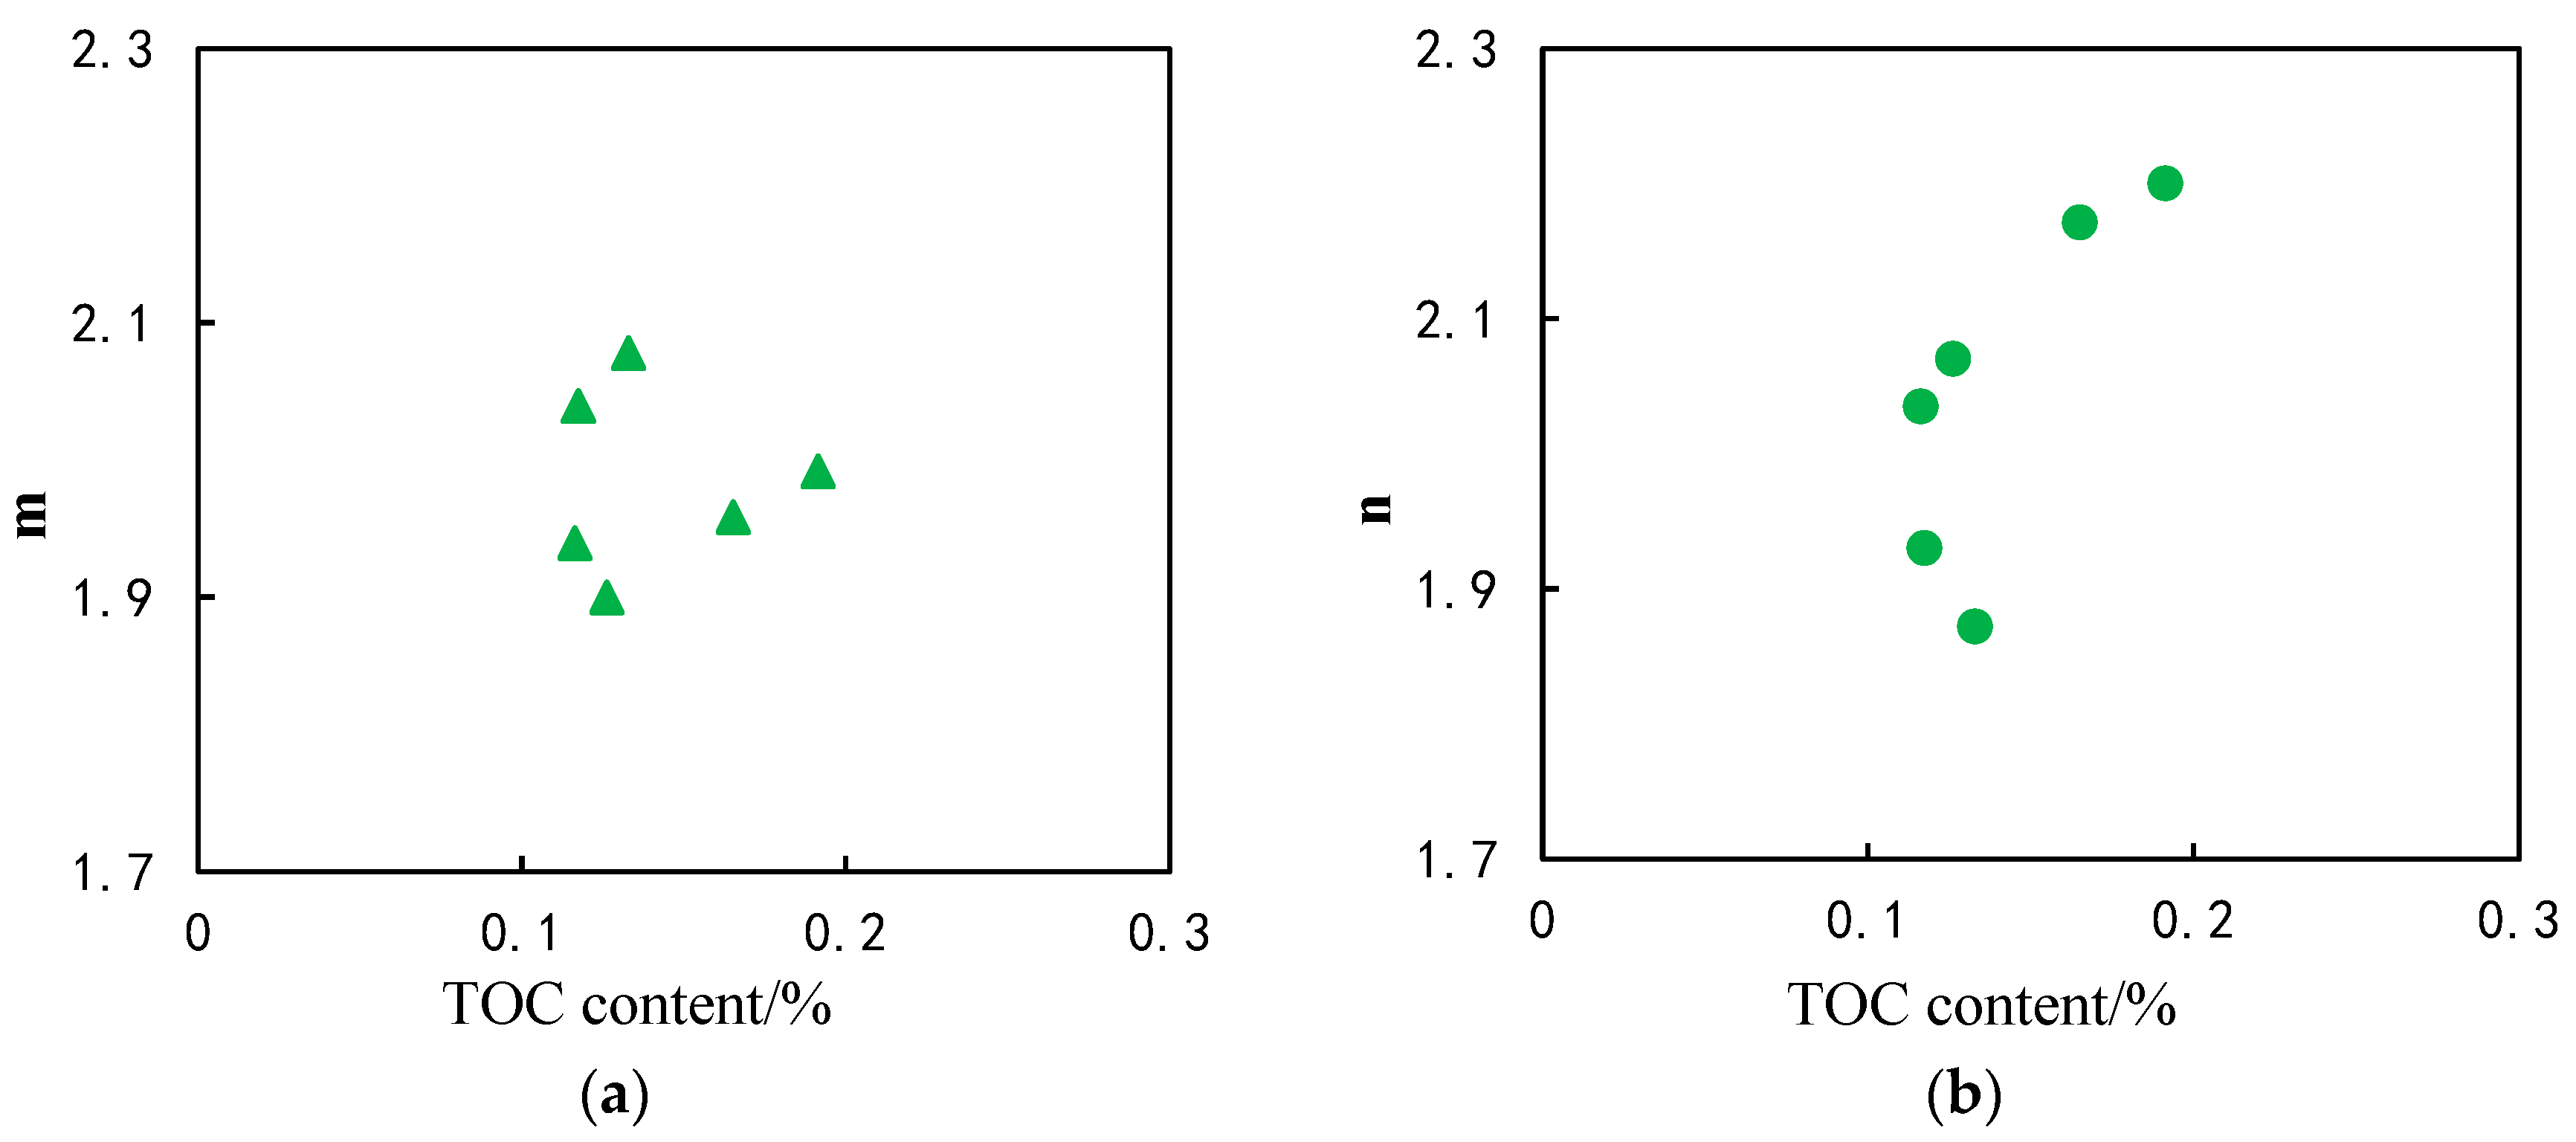
4.3. Influence of Organic Matter Content on Rock Electrical Parameters

The organic matter content of shale gas reservoirs is generally greater than 2%. In contrast, the organic matter content of mudstone biogas reservoirs was relatively low, mainly in the range of 0.0618–0.194. There was no obvious correlation between the cementation index and saturation index and the organic matter content (Figure 7a,b). The organic matter content had no obvious effect on rock electrical parameters.

5. Conclusions

(1)
The core samples of the Quaternary mudstone biogas reservoir in Qaidam Basin generally had a porosity greater than 20% and a permeability between 0.05–5 mD. The rock mineral composition was dominated by clay minerals, followed by carbonate minerals, quartz, and feldspar. The clay mineral composition was mainly illite, followed by montmorillonite and chlorite, with a small amount of kaolinite. The rock was weakly cemented, high in clay, and easy to hydrolyze. It would have been impossible to complete the rock electrical experiment and obtain the rock electrical parameters based on existing industry standard methods.
(2)
The use of wire-electrode cutting and high-temperature heat-shrinkable tube to wrap the core sample supported and protected the core sample. The rock resistivity was measured by the self-absorption water augmentation method to obtain the rock electrical parameters of the core samples. The cementation index m of the core samples was in the range of 1.89–2.08, with an average value of 1.99, while the saturation index n was in the range of 1.872–2.270, with an average value of 2.09.
(3)
The rock electrical parameters of the reservoir core samples were affected by lithology and physical properties, but not significantly influenced by organic matter content. The cementation index increased with the decreasing clay mineral content, increasing quartz content, and increasing permeability, while the saturation index increased with the decreasing clay mineral content, increasing quartz content, and increasing permeability.

Author Contributions

Conceptualization, L.W.; data curation, H.Y.; formal analysis, J.L. and H.Y.; investigation, X.C.; methodology, X.C. and L.W.; project administration, J.L.; software, D.G.; visualization, D.G.; writing—original draft, J.L.; writing—review & editing, L.W. All authors have read and agreed to the published version of the manuscript.

Funding

This research was funded by the National Natural Science Foundation of China, grant number U2003102.

Data Availability Statement

Data available on request from the authors.

Conflicts of Interest

The authors declare no conflict of interest.

References

  1. Shurr, G.W.; Ridgley, J.L. Unconventional shallow biogenic gas systems. AAPG Bull. 2002, 86, 1939–1969. [Google Scholar]
  2. Zhang, Y.G.; Chen, H.J. Concepts on the generation and accumulation of biogenic gas. Oil Gas Geol. 1983, 2, 160–170. (In Chinese) [Google Scholar]
  3. Garcia-Gil, S.; Vilas, F.; Garcia-Garcia, A. Shallow gas feature in incised-valley fills (Ria de Vigo NW Spain): A case study. Cont. Shelf Res. 2002, 22, 2303–2315. [Google Scholar] [CrossRef]
  4. Rice, D.D.; Claypool, G.E. Generation, accumulation, and resource potential of biogenic gas. AAPG Bull. 1981, 65, 5–25. [Google Scholar]
  5. Xin, B.-X.; Chen, Y. Formation Mechanism and Exploration Potential of Biogenic Gases. Contemp. Chem. Ind. 2018, 47, 1928–1931. (In Chinese) [Google Scholar]
  6. Norville, G.A.; Dawe, R.A. Carbon and hydrogen isotopic variations of natural gases in the southeast Columbus basin offshore southeastern Trinidad, West Indies–clues to origin and maturity. Appl. Geochem. 2007, 22, 2086–2094. [Google Scholar] [CrossRef]
  7. Petro China Qinghai Oilfield Company. Petroleum Resource Evaluation in Qaidam Basin; Petro China Qinghai Oilfield Company: Dunhuang, China, 2002. (In Chinese) [Google Scholar]
  8. Wei, G.; Liu, D. Formation mechanism, distribution feature and exploration prospect of the Quaternary biogenic gas in Qaidam Basin, NW China. Pet. Explor. Dev. 2005, 32, 84–89. (In Chinese) [Google Scholar]
  9. Dang, Y.; Zhang, D.; Xu, Z.; Hou, Z. Sedimentary facies and biogenicgas pool of the Quaternary of Sanhu area in Qaidam Basin. J. Palaeogeogr. 2004, 6, 110–118. (In Chinese) [Google Scholar]
  10. Xu, Z. Practice and Reflection on Biogas Exploration in Eastern Qaidam Basin. China Pet. Explor. 2006, 11, 33–37. (In Chinese) [Google Scholar]
  11. Song, N. Biogenic gas generation model and source rock evaluation in Sanhu area of Qaidam Basin. Master’s Thesis, Yangtze University, Jingzhou, China, 2012. (In Chinese). [Google Scholar]
  12. Li, B.; Wang, M.; Wei, G.; Zhang, D.; Wang, J. Lateral Migration and Accumulation of Biogenic Gas in the Sanhu Area, Qaidam Basin. Geol. Rev. 2003, 49, 93–100. (In Chinese) [Google Scholar]
  13. Tang, X.; Jiang, Z.; Shao, Z.; Long, G.; He, S.; Liu, X.; Wang, Y. Reservoir Characteristics and Dynamic Accumulation Process of the Quaternary Mudstone Biogas. Geoscience 2022, 36, 682–694. [Google Scholar]
  14. Guan, Z.; Xu, Z. The Essential Conditions and Controlling Factors of Formation of Quaternary Biogenic Gas Reservoirs. Nat. Gas Ind. 2001, 21, 1–5. (In Chinese) [Google Scholar]
  15. Archie, G.E. The electrical resistivity log as an aid in determining some reservoir characteristics. Trans. Aime 1942, 146, 54–62. [Google Scholar] [CrossRef]
  16. Rickman, R.; Mullen, M.; Petre, E.; Grieser, B.; Kundert, D. A Practical Use of Shale Petrophysics for Stimulation Design Optimization: All Shale Plays Are Not Clones of the Barnett Shale. In Proceedings of the SPE Annual Technical Conference & Exhibition, Denver, CO, USA, 21 September 2008; Society of Petroleum Engineers: Houston, TX, USA. [Google Scholar]
  17. Xiao, Z.; Zhu, S.; Ma, J.; Wang, D.; Wang, Z.; Min, Z.; Sang, J. Influence of dispersion character of rock electric parameter on Archie′s formulas and Waxman-Smits model. Oil Geophys. Prospect. 2009, 44, 248–251. (In Chinese) [Google Scholar]
  18. Simandoux, P. Measures dielectrique en milieu poreux, application a mesure de saturation en eau, etude des massifs argileaux. Rev. De L’Institut Fr. Du Pet. 1963, Supplementary Issue, 193–215. [Google Scholar]
  19. Li, G.; Zhang, J.; Hu, Y.; Yu-lin, C. Relationship between porosity-resistivity and the methods of formation factor calculation in tight sandstone. Prog. Geophys. 2016, 31, 695–700. (In Chinese) [Google Scholar]
  20. Li, L.; Hongxin, Z.; Lingyuan, M. Technique of laboratory measurement of rock resistivity parameters in low permeability sandstone reservoir. Pet. Geol. Recovery Effic. 2018, 25, 106–111. (In Chinese) [Google Scholar] [CrossRef]
  21. Zhou, G.Y.; Liu, X.J. Experimental Research of Rock Electrical Parameters for Tight Sandstone. Sci. Technol. Rev. 2011, 29, 38–41. (In Chinese) [Google Scholar]
  22. Liu, X.; Hong, L.; Chao, Y. Experimental study on rock-electricity parameters of carbonate gas reservoirs. Acta Pet. Sin. 2011, 32, 131–134. (In Chinese) [Google Scholar]
  23. Bai, J. Experimental Investigation of Ultrasonic and Electrical Properties of Organic-Rich Shale. Ph.D. Thesis, Southwest Petroleum University, Chengdu, China, 2017. (In Chinese). [Google Scholar]
  24. You, L.; Kang, Y.; Che, Y.; Shi, Y.; Zhang, H.; Wu, X. Discussion on tight rock electrical experiment method. In Proceedings of the 2015 China Natural Gas Academic Annual Meeting, Wuhan, China, 28 September 2015. [Google Scholar]
  25. Xiong, X.; Liu, X.; Liang, L.; Gao, K. Influence of confining pressure on electrical parameters of shale rock. In Proceedings of the International Conference on Oil and Gas Field Exploration and Development, Xi’an, China, 16–18 October 2019; pp. 694–700. [Google Scholar]
  26. Guo, H.; Yang, W.; Zhou, B.; Liu, C.; Liu, S.; Zhou, H.; Zhu, Y. Study on experimental method of rock electricity for conglomerate reservoir in Mahu sag, Junggar basin. Prog. Geophys. 2022, 37, 600–606. (In Chinese) [Google Scholar]
  27. Zhang, B.; Liu, C.; Liu, X.; Li, Y.; Ma, L.; Liu, Z.; Li, Y.; Wang, D.; Yang, J.; Chen, J. Comparative study on experimental methods of rock-electricalparameters of tight sandstone. Chin. Offshore Oil Gas 2022, 34, 175–183. [Google Scholar]
  28. Zhang, M.; Shi, Y. Archie’s electrical parameters of complex pore texture in sandstone reservoir. Geophys. Prospect. Pet. 2005, 44, 21–23. [Google Scholar]
  29. Archie, G.E. Electircal resistivity, an aid in core-analysis interpretation. AAPG Bull. 1947, 31, 350–366. [Google Scholar]
  30. Zhang, S.; Li, M.; Shuai, Y.; Huang, L.; Su, A.; Li, Z. Biogeochemical identification of the Quaternary biogenic gas source rock in the Sanhu Depression, Qaidam Basin. Org. Geochem. 2014, 73, 101–108. [Google Scholar] [CrossRef]
Figure 1. Disintegration process of core samples immersed in the saturated solution of formation water.
Energies 15 09100 g001
Figure 2. Preparation of plunger core samples of the mudstone biogas reservoir. (a) Samples obtained by wire-electrode cutting. (b) Core samples wrapped with a heat-shrinkable sleeve.
Energies 15 09100 g002
Figure 3. Relationship between formation factor (F) and porosity (Φ) and between resistivity index (I) and water saturation (Sw) of core samples of the mudstone biogas reservoir. (a) F-Φ. (b) I-Sw.
Energies 15 09100 g003
Figure 4. Relationship between resistivity index and water saturation of core samples. (a) No. NY-2. (b) No. NY-3. (c) No. NY-5. (d) No. NY-6. (e) No. NY-8. (f) No. NY-10. (g) No. NY-11. (h) No. NY-16.
Energies 15 09100 g004aEnergies 15 09100 g004b
Figure 5. Relationship between lithology and rock electrical parameters of core samples of the Quaternary mudstone biogas reservoir. (a) Relationship between m and clay content. (b) Relationship between n and clay content. (c) Relationship between m and quartz content. (d) Relationship between n and quartz content. (e) Relationship between m and carbonate mineral content. (f) Relationship between n and carbonate mineral content.
Energies 15 09100 g005aEnergies 15 09100 g005b
Figure 6. Relationship between physical properties and rock electrical parameters of core samples of the Quaternary mudstone biogas reservoir. (a) Relationship between m and Φ. (b) Relationship between n and Φ. (c) Relationship between m and K. (d) Relationship between n and K.
Energies 15 09100 g006aEnergies 15 09100 g006b
Figure 7. Relationship between TOC content and rock electrical parameters of core samples of the Quaternary mudstone biogas reservoir. (a) Relationship between m and TOC content. (b) Relationship between n and TOC content.
Energies 15 09100 g007
Table 1. XRD whole-rock test results.
Sample No.Physical PropertyVTOC/FractionMineral CompositionNotes
Φ/%K/mDClay Content/%Quartz Content/%Carbonate Mineral Content/%Others
NY-229.1270.7360.126253.219.923.03.9
NY-325.6780.138/////No XRD analysis
NY-526.6250.1720.1652////No XRD analysis
NY-628.0710.0750.191453.620.324.12.0
NY-829.7040.282/50.621.920.76.8
NY-1026.4390.4020.117435.524.333.27.0
NY-1127.8541.2200.132936.527.023.912.6
NY-1624.4170.2580.061844.725.621.38.4
Table 2. Rock electrical parameters of core samples of the Quaternary mudstone biogas reservoir.
Sample No.Rock Electrical Parameters
Fmn
NY-212.2072.032.07
NY-313.0851.892.18
NY-513.3551.962.17
NY-612.5591.992.27
NY-810.3521.942.04
NY-1015.0792.042.13
NY-1114.2382.081.87
NY-1616.8162.001.99
Publisher’s Note: MDPI stays neutral with regard to jurisdictional claims in published maps and institutional affiliations.

