Abstract
The development of renewable energy in China has made remarkable achievements, but the problem of renewable energy consumption has become increasingly prominent. This paper establishes a power market trading system for renewable energy, with the aim of promoting large-scale renewable energy consumption and increasing the enthusiasm of renewable energy producers and users to participate in market transactions. First, according to the power generation cost, the backup cost of renewable energy power plants and the possible quotation strategies of other renewable energy producers, a quotation model of renewable energy producers is established. In the clearing of the spot market by renewable energy producers, the independent market operator conducts the first-stage clearing of the electricity market with the goal of maximizing social welfare. After the announcement of the clearing results, the renewable energy producers that did not win the bid will revise their quotations and carry out the second stage clearing to realize the consumption of renewable energy. In this paper, the particle swarm algorithm combined with the CPLEX solver is used to solve the problem, and finally, different scenarios are analyzed through example analysis. The results show that, compared with the conventional power market trading mechanism, the energy abandonment rate of the power market trading mechanism for renewable energy proposed in this paper drops from 8.2% to 2.1%, and the profit margin of renewable energy producers increase by 6.6%. It is demonstrated that the proposed electricity market mechanism can effectively promote the consumption of renewable energy and increase the income of renewable energy producers.
1. Introduction
In recent years, China has begun to develop and utilize renewable energy represented by wind energy and solar energy on a large scale. By the end of 2021, China will install 1 billion kWh of renewable energy, generating 2.48 trillion kWh of electricity, accounting for 29.8% of the country’s total electricity consumption. The installed capacity of wind power and photovoltaics in China is more than 300 million kilowatts, ranking first in the world [1,2,3]. Vigorously developing renewable energy and promoting clean and low-carbon transformation of energy have become the trend of China’s energy development [4,5]. In the future, the proportion of renewable energy transactions will continue to grow and become the main form of energy supply. Renewable energy is traded in the same way as conventional power to participate in market competition [6,7].
Renewable energy generation is an important player in the electricity market. The electricity spot market is a market based on variable costs, and the variable costs of renewable energy are extremely low. It is conducive to participating in market competition and promoting consumption [8,9]. However, the market quotations are random and irrational, and there may be game quotations with excessively high renewable energy quotations, resulting in the failure of renewable energy producers to win the bid. Therefore, in a highly competitive electricity market, renewable energy producers take into account market players reacting to their competitors’ strategies to maximize their earnings [10,11]. Rampriya et al., studied the problem of how producers coordinate offers in the energy and spinning reserve markets. Taking the maximum total profit as the objective function, a stochastic optimization model is established and solved by a genetic algorithm [12]. Nogales et al., studied the method of predicting the market electricity price. In the clearing environment of the electricity market, the power producers only need to use the price quotation that is higher than the marginal cost and lower than the predicted electricity price [13]. However, for renewable energy producers, the declaration strategy must consider changes in power generation costs and market mechanisms, so that renewable energy producers can develop healthily.
By the end of 2021, the Chinese curtailment of wind and photovoltaic power totaled beyond 20 billion kWh and the curtailment rate is still high [14,15]. Under the contradiction between the rapid development of renewable energy and the difficulty of renewable energy consumption in China [16,17], the electricity market mechanism and policies to promote the consumption of renewable energy should be improved [18,19,20]. Wang discussed several current ways for renewable energy to participate in the market, and proposes a mechanism to promote renewable energy consumption at this stage [21]. However, there is a lack of macro guidance for overall market transactions. Zeng discussed the consumption patterns of renewable energy and the design of the spot market mechanism. However, the research on the problems of my country’s renewable energy consumption and the coordination of the dual goals of the spot market is not in-depth enough, and there is no feasible solution [22]. References [23,24,25] summarized the mechanisms for the participation of renewable energy in the electricity market of various countries. However, it does not take into account that the power system has renewable energy curtailment. Wang et al., based on the changes in the characteristics of the power system and the development of marketization under the new situation, put forward the principles for the construction of a social power market with Chinese characteristics under the background of energy transition. The current research on the design of the electricity market mechanism and the trading system to promote renewable energy consumption lacks the comparison of experience in a foreign mature electricity spot market consumption renewable energy mechanism [26]. How to realize the consumption of renewable energy under the premise of maintaining the optimal allocation of market resources through the scientific design of the electricity spot market mechanism is a new challenge for the construction of China’s electricity market mechanism [27].
Based on the above research, this paper establishes a renewable energy power market trading mechanism. Considering the difficulty of renewable energy consumption, and then establishing a reasonable structure for renewable energy producers to participate in the electricity market. Based on the operating characteristics of the electricity market, a two-stage renewable energy electricity market clearing model is proposed. In the first clearing, the independent market operator made clearing with the goal of maximizing social welfare. Renewable energy producers that did not win the bid revise their quotations and carry out the second stage of clearing in order to realize the consumption of renewable energy. Finally, an example is used to verify the effectiveness of the proposed model.
The rest of this paper is organized as follows. Section 2 describes the design mechanism of the renewable energy electricity market. Section 3 establishes the renewable energy supplier quotation model. Section 4 establishes a two-stage renewable energy electricity market clearing model. Section 5 sets different scenarios to analyze the clearing model proposed in this paper. Finally, conclusions are drawn in Section 6.
2. Design of Electricity Market Mechanism for Renewable Energy
At present, the main ways for China’s renewable energy to participate in the market are: non-participation in market bidding and participating in market bidding. The method of not participating in market bidding ensures the priority consumption of renewable energy, but it is not conducive to cultivating the market awareness of renewable energy producers. In the way of participating in market bidding, renewable energy producers and conventional energy producers make quotations to participate in the electricity market. This way is not convenient for renewable energy to reflect market value and competition among renewable energy producers, and it is difficult to promote the consumption of renewable energy.
This paper establishes the renewable energy market. In the day-ahead electricity market, it is traded separately from conventional energy electricity, and a market where renewable energy is traded directly with users is designed. Users can participate in the renewable energy market or the conventional energy market according to their own needs, and users can clearly know the amount of renewable energy consumed. Maximize social welfare by consuming renewable energy in a market-based way. The specific transaction methods are as follows:
A new power system with solar energy, wind energy and other renewable energy sources as the main body of power generation, renewable energy producers (including centralized wind farms and photovoltaic power plants) combine their forecast output. They report to the independent market operator the predicted output curve for the next 24 h as shown in Figure 1, and submit the corresponding bidding price to participate in the market clearing [28]. Users who choose to participate in renewable energy electricity market transactions also declare electricity demand and prices.
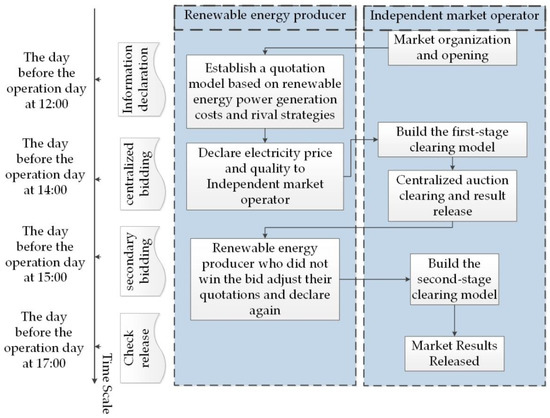
Figure 1.
Day-ahead electricity market transaction framework.
According to the declared data, the independent market operator aims to maximize social welfare under the premise of satisfying various loads of the system, operating constraints of generator sets, and power grid security constraints. Through calculation, the power generation output curve of the unit and the clearing electricity price are obtained, and the clearing result of the first stage is issued. The renewable energy producers that did not win the bid in the first clearing stage resubmit their quotations in the second clearing stage, and the renewable energy producers that did not win the bid revise their quotations and replace them with lower price quotations. Electricity purchasers who still have remaining capacity can continue to report their demand for electricity at this stage. The independent market operator conducts the second-stage clearing with the objective function of maximizing social welfare, obtains the cleared electricity quantity and cleared electricity price and issues the cleared results.
3. Renewable Energy Power Generation Negotiation Volume and Price Declaration Strategy
3.1. A Quotation Model Considering Renewable Energy Generation Costs and Rival Strategies
In order to establish a reasonable quotation model for renewable energy producers, this paper analyzes the cost structure of renewable energy producers’ power generation and market competition [29]. The cost of renewable energy power generation includes the power generation operation and maintenance cost of the unit and the backup cost to balance the fluctuation of renewable energy.
The power generation operation and maintenance cost of renewable energy units include marginal power generation cost and fixed power generation cost. The marginal power generation cost of renewable energy units is extremely low and can be approximately considered to be zero [30]. The fixed power generation cost of renewable energy units is the cost of station construction and operation and maintenance [31]. From this, it can be concluded that the fixed power generation cost corresponding to the unit electricity of renewable energy is:
In the above formula: is the operation and maintenance cost of renewable energy power generation corresponding to the unit of electricity; is the construction cost of the renewable energy unit corresponding to the unit of electricity; is the operation and maintenance cost of the renewable energy power plant corresponding to the unit of electricity; is the hours of utilization of renewable energy power generation; is the capital recovery coefficient of investment in renewable energy projects; is the investment discount rate of renewable energy projects; is the operating life of the renewable energy power plant.
The backup cost is the cost paid for the lower confidence capacity caused by random fluctuation of renewable energy generation. Assume that the renewable energy power plant with installed capacity has the same reliable capacity to the power system as the conventional generator set with installed capacity . Then, is the additional reserve capacity of the renewable energy power plant. Based on this, the mathematical model of the backup cost corresponding to the unit of electricity of renewable energy is established:
In the above formula: is the renewable energy capacity confidence coefficient; is the investment and construction cost of the thermal power unit corresponding to the unit of electricity; is the capital recovery coefficient of thermal power project investment; is the investment discount rate of thermal power projects; is the operating life of the thermal power plant.
Renewable energy power generation producers do not necessarily quote their power generation costs when quoting. This paper dynamically adjusts the quotation according to the historical quotation strategy of other renewable energy producers in the same period. It can be concluded that the quotation function of the renewable energy producer in the period is:
In the above formula: is the output corresponding to the quotation of the renewable energy producer in the period; , are the decision variables for renewable energy producers.
Renewable energy producers, in addition to considering the power generation cost of renewable energy units, also need to consider the quotations of other renewable energy producers to formulate their own quotation strategies. From the perspective of renewable energy producer , the quotation coefficient of renewable energy producers conforms to a two-dimensional normal distribution [32], and its probability density function is as follows:
In the above formula: the subscripts and represent the estimated value of renewable energy producer by renewable energy producer ; and are the estimated standard deviations of and , respectively; and are the mean estimates of and , respectively.
Renewable energy producer generates a set of quotation scenarios for renewable energy producer through the Monte Carlo simulation, so as to determine its own optimal quotation strategy. The steps for generating quotation coefficient scenarios are as follows:
- Step 1: Set to generate a lower triangular matrix such that .
- Step 2: Generate mutually independent two-dimensional standard normal distribution random vectors , , where , .
- Step 3:.
3.2. Expectation Model of Renewable Energy Producers
In the market mechanism of this paper, the profit of renewable energy producers can be expressed as the difference between revenue and power generation cost. The quotation of renewable energy manufacturers takes the maximum expected value of revenue in all scenarios as the objective function. It can be expressed as:
In the above formula: the superscript represents a possible quotation scenario of other renewable energy producers generated by the Monte Carlo simulation; the function means to obtain the expected profit value of renewable energy producers in each possible scenario; is the market clearing price at time ; is the clearing amount of renewable energy producers at time .
4. Renewable Energy Power Market Clearing Model Based on Two-Stage Centralized Bidding
4.1. The First Clearing Model of the Renewable Energy Power Market
Renewable energy producers declare volume and price curves to participate in the transaction. After collecting the bidding information of market members, the independent market operator determines the transaction volume and price of each subject in a unified clearing method. All participants settle at a unified clearing price, which is the price corresponding to the intersection of the supply and demand curves in Figure 2 [33]. After the market clearing price is determined, the benefit of each market member is the difference between the product of the user’s transaction volume and its quotation and the product of the renewable energy manufacturer’s transaction volume and its quotation.
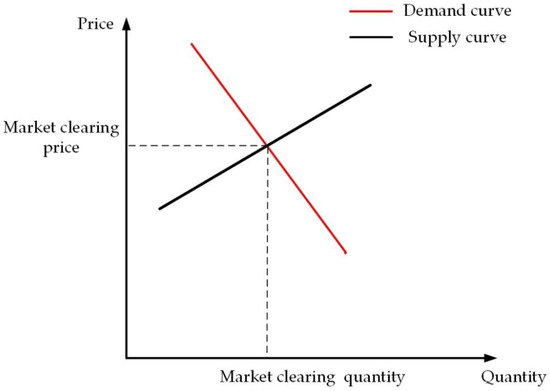
Figure 2.
Schematic of the market clearing.
Therefore, taking the maximum social welfare as the objective function can be expressed as:
In the above formula: is the quotation of user in time period . is the bid-winning power of user in time period is the energy quotation of renewable energy producer in time ; is the output power of renewable energy producer in time period .
- (1)
- System Power Balancing Constraints
At period , the sum of the outputs of all units in the system should be equal to the load during that period:
In the above formula: is the output of the renewable energy producer in the period ; D is the total system load in the period .
- (2)
- System Reserve Capacity Constraints with Renewable Energy Participation
Due to the increase in the installed capacity of renewable energy units, in order to ensure that the system meets the minimum reserve capacity, the renewable energy units that did not win the bid in the market a few days ago are included in the system reserve capacity according to a certain reliability factor of output:
In the above formula: is the 0–1 variable of the start-stop state of the unit in the period , is the power-on state, and is the shutdown state; is the power marked in the reserve capacity of the conventional unit in the period ; is the output upper limit of the renewable energy unit; is the output lower limit of the renewable energy unit; and are the upper and lower reserve requirements of the system, respectively; is the output reliability factor of the renewable energy unit.
- (3)
- Unit Operating Constraints
During the period, the output of the unit should be between the maximum and minimum values:
In the formula: and are the minimum and maximum output of the renewable energy unit , respectively.
- (4)
- Transmission Capacity Constraints of Each Line
During the time period , the active power flow flowing on each line should not be less than the upper limit value of the stability limit of the line, and not less than the lower limit value of the stability limit:
In the formula: is the power flow transmission limit of line ; is the transfer distribution factor of renewable energy units; is the transfer distribution factor of node to line ; is the bus load value of node in time period .
4.2. The Second Stage Clearing Model of the Renewable Energy Power Market
At the end of the first-stage clearing, the independent market operator will issue the first-stage clearing transaction results. The second-stage transaction is a secondary clearing process, which removes the electricity of the completed transactions in the first stage. Renewable energy producers who have not won the bid revise their quotations, and users can continue to report electricity demand and price at this stage. The independent market operator conducts the second clearing with the maximum social welfare. The clearing model is as follows:
In the formula: is the revised quotation of renewable energy producers in period , and the value is a certain percentage of the quotation of renewable energy producers; is the waste energy generated by renewable energy producers in time period .
4.3. Model Solving Process
The solution of the model in this paper mainly focuses on the determination of the quotation coefficient and the market clearing. The main body of the solution involves renewable energy producers and an independent market operator. The algorithm flow is shown in Figure 3.
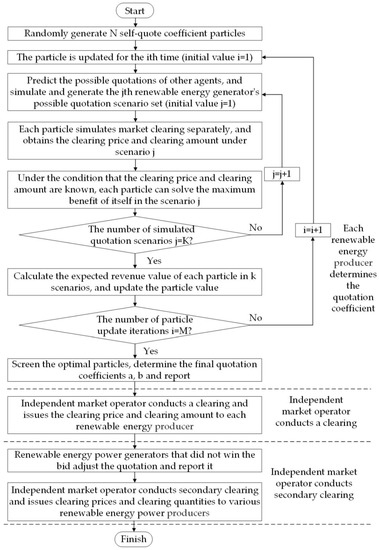
Figure 3.
Algorithm flowchart.
The particle swarm algorithm is used to determine the optimal quotation coefficient of each renewable energy producer. Each renewable energy producer simulates and generates a set of possible quotation scenarios for competitors based on the historical quotation data of other producers. Each particle simulates the market clearing, and obtains the clearing electricity price and electricity in different scenarios. Select particles with the goal of maximizing profit expectations, and determine the final quotation coefficient.
In the market clearing of the independent market operator, because of the inclusion of multiple renewable energy producers bidding. After the independent market operator collects market bidding information. Based on the maximum social welfare, the first clearing is carried out to determine the initial clearing amount of each renewable energy producer. After the initial clearing amount is determined, it is necessary to check whether the line flow exceeds the limit, and finally, determine the market clearing amount and market clearing electricity price of each renewable energy producer. If any renewable energy producers failed to win the bid, the independent market operator will organize the second clearing. Renewable energy producers who did not win the bid adjust their quotations and users continue to participate in the secondary clearing, and obtain the secondary clearing results.
5. Case Analysis
5.1. Parameter Settings
In this simulation, six renewable energy producers are set up to participate in the daily trading of the electricity market, and a total of three wind power producers and three photovoltaic power producers are set up. Among them, the installed capacity of wind power is 1300 MW; the installed capacity of photovoltaic power generation is 600 MW. The operating parameters of the units of each producer are shown in Table 1 [34]. The power generation forecast value of renewable energy producers is shown in Figure 4. This paper considers the bidding of renewable energy producers under symmetric information, that is, all renewable energy producers have the same bidding information [35]. See Appendix A, Table A1 for the parameters of the average estimated value of each renewable energy producer.

Table 1.
Unit operating parameters.
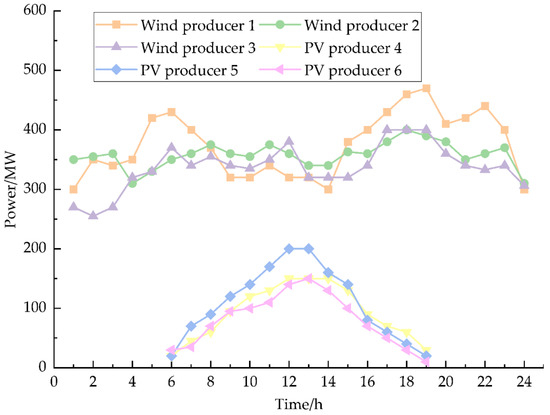
Figure 4.
Output forecast value of renewable energy producers.
In order to verify the effectiveness of the mechanism proposed in this paper, two comparison scenarios are set up, and simulations are carried out under these three scenarios. Scenario 1 is a way in which renewable energy does not participate in market bidding, ensuring priority consumption of renewable energy, and renewable energy is purchased at the lowest price [34]; Scenario 2 is renewable energy producers normally participate in quotation competition [36]; Scenario 3 is the market mechanism proposed in this paper.
5.2. Electricity Market Clearing Results
The model is solved using the process shown in Table 2, and the results list the renewable energy producer 1 quotation coefficients obtained from the solution. In the table, and are the quotation coefficients of renewable energy producer 1, respectively, and the quotation coefficients of other renewable energy producers are shown in Appendix A, Table A2, Table A3, Table A4, Table A5 and Table A6. According to the bidding information of renewable energy producers, the independent market operator will clear the electricity with the goal of maximizing social welfare, and issue clearing power and clearing electricity prices to each renewable energy producer. Renewable energy producers that do not win the bid will adjust their quotation and participate in the secondary clearing in the next period. As shown in Figure 5 and Figure 6, the winning bids of the primary clearing and secondary clearing of each renewable energy producer are obtained.
Table 2.
Quotation factor for wind producer 1.
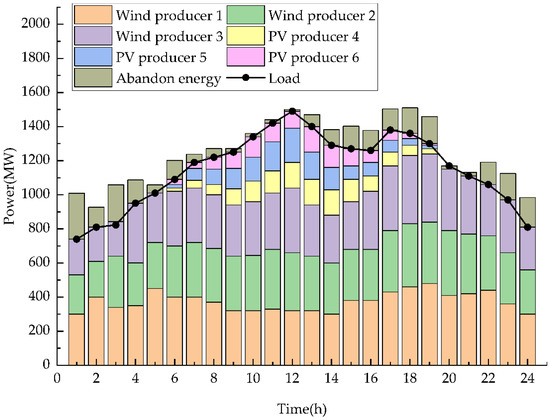
Figure 5.
Output of each producer after first clearing.
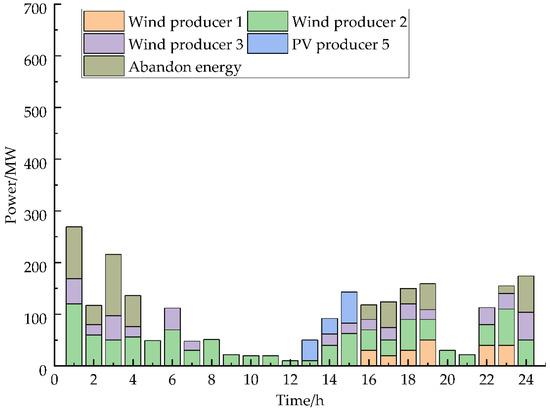
Figure 6.
Output of each producer after secondary clearing.
The consumption of the three scenarios is shown in Table 3. In Scenario 1, the renewable energy producer participates in the market clearing at a very low price as a price taker, and theoretically achieves the maximum consumption of renewable energy, with a total of 459 MW·h of curtailment. Renewable energy producers participate in the market as price takers, which has seriously lowered the clearing price of electricity, which is not conducive to the market’s discovery of the real price. In Scenario 2, the renewable energy producer participates in the electricity market as a price setter, and the bid-winning power of the renewable energy is determined by the quotation, regardless of the secondary clearing of the renewable energy. During the period from 16:00 to 19:00, renewable energy consumption is difficult, and waste of renewable energy will be generated in the power system, up to 2418 MW·h. Under the renewable energy market mechanism proposed in this paper, when the renewable energy producers fail to win the bid, the secondary clearing mechanism is triggered. Corrected the original bid of the unsuccessful bidder to a lower value. It is in priority clearing at this stage, so its scalar increases. In the time of 6:00–9:00 and 13:00–16:00 when it is difficult to consume, to consume as much renewable energy as possible. In the secondary clearing, the total energy waste was reduced from 2418 MW·h to 559 MW·h. The total energy waste is reduced by 1859 MW·h. The energy waste rate dropped from 8.7% to 2.1%, which was close to the theoretical maximum consumption value in Scenario 1, and achieved a good consumption effect.
Table 3.
Comparison of renewable energy consumption in different scenarios.
5.3. Electricity Market Clears Electricity Price and Income
The clearing electricity prices of the three scenarios are shown in Figure 7. It can be seen that the overall trend of electricity prices is basically the same as that of the load curve. The price is higher during the peak load period and lower during the load trough period. This intuitively reflects that the supply and demand situation determines the market price trend. After the second clearing, the electricity price of Scenario 3 will decrease in some time periods. At 14:00, the price of the second clearing of Scenario 3 is 40.1 $/(MW·h), which is a decrease of 6.3 $/(MW·h) compared with the clearing price of the first clearing, and the decrease is 13.6%. This is because at the time of the second clearing, the revised quotations of the renewable energy producers that did not win the bid will be lower than the normal quotations, which changes the clearing electricity price.
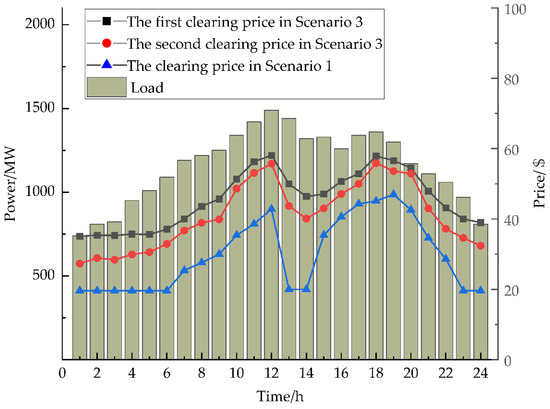
Figure 7.
Comparison of market clearing electricity prices in three scenarios.
The secondary clearing settlement results of renewable energy producers are shown in Table 4. The average settlement price of additional issuance obtained by PV producer 1 is 46.7 $/(MW·h), and the average settlement price of additional issuance obtained by wind power producer 3 is 36.6 $/(MW·h), which is lower than that of PV producer 1. The reason is that for wind power producer 3, most of the energy waste period is the low-load period at night. At this time, the price difference of the second round of clearing is larger, so the average settlement price obtained is lower. The additional income from renewable energy producers was 74,943 $, an increase of 6.7%. In the secondary clearing, it can be seen that the more energy waste is consumed, the lower the electricity price in the secondary clearing link.
Table 4.
Secondary clearing settlement results of renewable energy producers.
It can be seen from the above analysis, in Scenario 1, renewable energy is consumed to the greatest extent, but renewable energy is purchased at a very low price. This way has hit the enthusiasm of energy producers, which is not conducive to the development of the electricity market. In Scenario 2, there is a large amount of energy waste of renewable energy without considering the effective consumption mechanism. In Scenario 3, through the design of the renewable energy market, this paper can promote the consumption of renewable energy through a market-oriented mechanism to a certain extent, and at the same time increase the income of renewable energy producers and their enthusiasm for participating in the market.
6. Conclusions
Based on the basic principles of the electricity market, this paper establishes a price declaration model for renewable energy producers to participate in market competition. In order to improve the enthusiasm and consumption capacity of renewable energy producers to participate in the spot market, a two-stage centralized bidding power market clearing model is established. Through the example analysis, the results show that:
- (1)
- The quotation model of renewable energy producers proposed in this paper comprehensively considers the power generation cost, backup cost and the uncertainty of competitors’ quotations of renewable energy producers. To a certain extent, irrational quotations by producers are prevented, so that renewable energy producers can obtain maximum benefits.
- (2)
- The renewable energy power market transaction mechanism proposed in this paper increases the market participation of renewable energy producers and users. Make more renewable energy producers participate in transactions through the market. As a supplement to the first-stage clearing, the second-stage clearing price is reduced by 8.8% on average compared with the first-stage clearing price, which reduces the cost of electricity purchase to a certain extent and encourages users to purchase renewable energy electricity.
- (3)
- The two-stage centralized bidding power market clearing model proposed in this paper can reduce the total energy waste in the power system through a market-oriented mechanism to a certain extent. The rate of energy waste dropped from 8.7% to 2.1%, and the profit margin of renewable energy producers increased by 6.7%, promoting the consumption of renewable energy.
The text conducts a preliminary exploration and research on the construction of the renewable energy power market mechanism, and there is still room for improvement in the design of the specific market mechanism and the coordination of different types of renewable energy. In the future, this paper can further study the following aspects:
- (1)
- Regarding the design of the renewable energy power market mechanism, this paper does not consider the impact of relevant laws and regulations and the construction of the renewable energy power market mechanism. In future research, we can explore the impact of relevant laws and regulations on the construction of the power market mechanism.
- (2)
- Due to the large-scale integration of renewable energy into the grid, the volatility and uncertainty of the output on the power generation side increase. In future research, we will explore the establishment of a deviation power assessment mechanism that adapts to the characteristics of renewable energy power generation.
Author Contributions
Conceptualization and methodology, G.X. and X.W.; simulation and analysis, G.X.; investigation, X.W.; data curation, G.X.; writing—original draft preparation, G.X.; writing—review and editing, G.X. and X.W.; supervision, X.W.; literature research, G.X. All authors have read and agreed to the published version of the manuscript.
Funding
This research was supported by the Natural Science Foundation of Xinjiang Uygur Autonomous Region under Grant 2020D01C031.
Data Availability Statement
Not applicable.
Conflicts of Interest
The authors declare no conflict of interest.
Appendix A
Table A1.
Estimated parameters of the mean value of each renewable energy power producer.
Table A1.
Estimated parameters of the mean value of each renewable energy power producer.
| New Energy Producer | ||
|---|---|---|
| Wind producer 1 | 0.9 | 0.32 |
| Wind producer 2 | 1.3 | 0.36 |
| Wind producer 3 | 1.1 | 0.33 |
| PV producer 4 | 0.7 | 0.22 |
| PV producer 5 | 0.9 | 0.30 |
| PV producer 6 | 0.8 | 0.28 |
Table A2.
Quotation factor for wind producer 2.
Table A2.
Quotation factor for wind producer 2.
| Time | /($/(MW·h) | /($/(MW·h) | Time | /($/(MW·h) | /($/(MW·h) |
|---|---|---|---|---|---|
| 1 | 0.99 | 0.36 | 13 | 1.29 | 0.29 |
| 2 | 1.10 | 0.35 | 14 | 1.30 | 0.32 |
| 3 | 0.99 | 0.37 | 15 | 1.31 | 0.32 |
| 4 | 0.98 | 0.38 | 16 | 1.35 | 0.34 |
| 5 | 1.13 | 0.30 | 17 | 1.56 | 0.29 |
| 6 | 1.20 | 0.24 | 18 | 1.57 | 0.29 |
| 7 | 1.54 | 0.27 | 19 | 1.59 | 0.28 |
| 8 | 1.54 | 0.25 | 20 | 1.59 | 0.28 |
| 9 | 1.56 | 0.29 | 21 | 1.55 | 0.29 |
| 10 | 1.57 | 0.29 | 22 | 1.59 | 0.29 |
| 11 | 1.60 | 0.27 | 23 | 1.40 | 0.30 |
| 12 | 1.60 | 0.27 | 24 | 1.20 | 0.32 |
Table A3.
Quotation factor for wind producer 3.
Table A3.
Quotation factor for wind producer 3.
| Time | /($/(MW·h) | /($/(MW·h) | Time | /($/(MW·h) | /($/(MW·h) |
|---|---|---|---|---|---|
| 1 | 0.98 | 0.36 | 13 | 1.34 | 0.27 |
| 2 | 0.99 | 0.34 | 14 | 1.27 | 0.27 |
| 3 | 0.93 | 0.35 | 15 | 1.26 | 0.26 |
| 4 | 0.94 | 0.34 | 16 | 1.34 | 0.26 |
| 5 | 1.12 | 0.23 | 17 | 1.56 | 0.27 |
| 6 | 1.17 | 0.24 | 18 | 1.57 | 0.27 |
| 7 | 1.48 | 0.24 | 19 | 1.57 | 0.27 |
| 8 | 1.56 | 0.24 | 20 | 1.56 | 0.25 |
| 9 | 1.56 | 0.26 | 21 | 1.58 | 0.25 |
| 10 | 1.56 | 0.26 | 22 | 1.58 | 0.26 |
| 11 | 1.58 | 0.25 | 23 | 1.52 | 0.26 |
| 12 | 1.58 | 0.26 | 24 | 1.15 | 0.23 |
Table A4.
Quotation factor for PV producer 4.
Table A4.
Quotation factor for PV producer 4.
| Time | /($/(MW·h) | /($/(MW·h) | Time | /($/(MW·h) | /($/(MW·h) |
|---|---|---|---|---|---|
| 7 | 1.28 | 0.18 | 14 | 1.07 | 0.23 |
| 8 | 1.36 | 0.19 | 15 | 1.06 | 0.21 |
| 9 | 1.36 | 0.21 | 16 | 1.14 | 0.21 |
| 10 | 1.36 | 0.21 | 17 | 1.36 | 0.23 |
| 11 | 1.38 | 0.21 | 18 | 1.37 | 0.22 |
| 12 | 1.38 | 0.19 | 19 | 1.37 | 0.22 |
| 13 | 1.14 | 0.21 |
Table A5.
Quotation factor for PV producer 5.
Table A5.
Quotation factor for PV producer 5.
| Time | /($/(MW·h) | /($/(MW·h) | Time | /($/(MW·h) | /($/(MW·h) |
|---|---|---|---|---|---|
| 7 | 1.30 | 0.20 | 14 | 1.17 | 0.24 |
| 8 | 1.38 | 0.21 | 15 | 1.16 | 0.22 |
| 9 | 1.38 | 0.22 | 16 | 1.17 | 0.22 |
| 10 | 1.38 | 0.23 | 17 | 1.40 | 0.22 |
| 11 | 1.38 | 0.23 | 18 | 1.40 | 0.24 |
| 12 | 1.40 | 0.21 | 19 | 1.40 | 0.24 |
| 13 | 1.24 | 0.23 |
Table A6.
Quotation factor for PV producer 6.
Table A6.
Quotation factor for PV producer 6.
| Time | /($/(MW·h) | /($/(MW·h) | Time | /($/(MW·h) | /($/(MW·h) |
|---|---|---|---|---|---|
| 7 | 1.29 | 0.19 | 14 | 1.05 | 0.20 |
| 8 | 1.37 | 0.17 | 15 | 1.06 | 0.21 |
| 9 | 1.36 | 0.20 | 16 | 1.46 | 0.23 |
| 10 | 1.37 | 0.21 | 17 | 1.36 | 0.23 |
| 11 | 1.37 | 0.21 | 18 | 1.37 | 0.24 |
| 12 | 1.38 | 0.22 | 19 | 1.36 | 0.20 |
| 13 | 1.15 | 0.21 |
References
- Qiu, S.; Lei, T.; Wu, J.; Bi, S. Energy demand and supply planning of China through 2060. Energy 2021, 234, 121–193. [Google Scholar] [CrossRef]
- Li, B.; Chen, M.; Zhong, H.; Ma, Z.; Liu, D.; He, G. A Review of Long-Term Planning of New Power Systems with Large Share of Renewable Energy. Proc. CSEE 2022, 1, 1–27. [Google Scholar]
- Lbrahim, R.I.; Ozturk, I.; Bello, A.K.; Raimi, L. On the criticality of renewable energy to sustainable development: Do green financial development, technological innovation, and economic complexity matter for China? Renew. Energy 2022, 199, 262–277. [Google Scholar] [CrossRef]
- Hansen, K.; Breyer, C.; Lund, H. Status and perspectives on 100% renewable energy systems. Energy 2019, 175, 471–480. [Google Scholar] [CrossRef]
- Abhyankar, N.; Lin, J.; Kahrl, F.; Yin, S.; Paliwal, U.; Liu, X. Achieving an 80% carbon-free electricity system in China by 2035. iScience 2022, 25, 105–120. [Google Scholar] [CrossRef]
- Buchholz, W.; Dippl, L.; Eichenseer, M. Subsidizing renewables as part of taking leadership in international climate policy. Energy Policy 2019, 129, 765–773. [Google Scholar] [CrossRef]
- Wang, Y.; Shi, R.; Zhang, C.; He, Y.; Jiang, H.; Kubota, J. Structural changes and trends in China’s renewable electricity production in the policy evolution process. Renew. Energy 2022, 182, 879–886. [Google Scholar] [CrossRef]
- Xu, R.; Song, Z.; Tang, Q.; Yu, Z. The cost and marketability of renewable energy after power market reform in China: A review. Clean. Prod. 2018, 204, 409–424. [Google Scholar]
- Koolen, D.; Huisman, R.; Ketter, W. Decision strategies in sequential power markets with renewable energy. Energy Policy 2022, 167, 113025. [Google Scholar] [CrossRef]
- Gountis, V.; Bakirtzis, A. Bidding strategies for electricity producers in a competitive electricity marketplace. IEEE Trans. Power Syst. 2004, 19, 356–365. [Google Scholar] [CrossRef]
- Mehdipourpicha, H.; Wang, S.; Bo, R. Developing Robust Bidding Strategy for Virtual Bidders in Day-Ahead Electricity Markets. IEEE Open Access Power Energy 2021, 8, 329–340. [Google Scholar] [CrossRef]
- Rampriya, B. Optimal Bidding and Generation Scheduling of Utilities Participating in Single Side Auction Markets Including Ancillary Services. Adv. Appl. Sci. 2018, 7, 46–53. [Google Scholar] [CrossRef]
- Nogales, F.; Contreras, J.; Conejo, A.; Espinola, R. Forecasting Next-Day Electricity Prices by Time Series Models. IEEE Power Eng. Rev. 2002, 3, 22. [Google Scholar]
- Zhou, T.; Chi, D.; Ai, M. Challenges and countermeasures for renewable energy in the context of dual carbon. Macroecon. Manag. 2022, 7, 59–65. [Google Scholar]
- Wang, Q.; Du, Q.; Dai, X. Renewable Energy Development toward Carbon Neutrality: A Research Review. J. Nanjing Univ. Aeronaut. Astronaut. 2022, 4, 79–89. [Google Scholar]
- Zhang, Q.; Huang, X.; Xu, Y. New energy demonstration city pilot and green energy consumption: Evidences from China. Energy Rep. 2022, 8, 7735–7750. [Google Scholar] [CrossRef]
- Zhou, Q.; Wang, N.; He, S.; Shen, C. Summary and prospect of China’s new energy development under the background of high abandoned new energy power. Power Syst. Prot. Control 2017, 45, 146–154. [Google Scholar]
- Liu, P.; Hei, Z. Strategic analysis and framework design on international cooperation for energy transition: A perspective from China. Energy Rep. 2022, 8, 2601–2616. [Google Scholar] [CrossRef]
- Çiçek, A.; Güzel, S.; Erdinç, O.; Catalão, J. Comprehensive survey on support policies and optimal market participation of renewable energy. Electr. Power Syst. Res. 2021, 201, 107522. [Google Scholar] [CrossRef]
- Fan, Y.; Ding, T.; He, Y.; Wang, C.; Wang, Y.; Cheng, T.; Liu, J. Review and Cogitation for Worldwide Spot Market Development to Promote Renewable Energy Accommodation. Proc. CSEE 2021, 41, 1729–1752. [Google Scholar]
- Wang, C.; Lei, X.; Liu, L.; Li, Z. Design of Short-term Renewable Energy Integration Mechanism in the Electricity Market Transition Period. J. Glob. Energy Interconnect. 2018, 1, 565–573. [Google Scholar]
- Zeng, D.; Xie, K.; Pang, B.; Li, Z.; Yang, Z. Key Issues of National Unified Electricity Market with Chinese Characteristics (3): Transaction Clearing Models and Algorithms Adapting to the Coordinated Operation of Provincial Electricity Markets. Power Syst. Technol. 2020, 44, 2809–2819. [Google Scholar]
- Abate, A.G.; Riccardi, R.; Ruiz, C. Contract design in electricity markets with high penetration of renewables: A two-stage approach. Omega 2022, 111, 102666. [Google Scholar] [CrossRef]
- Simon, S.H.; Leach, A.; Shaffer, B.; Weis, T. Alberta’s Renewable Electricity Program: Design, results, and lessons learned. Energy Policy 2022, 171, 113266. [Google Scholar] [CrossRef]
- Newbery, D.; Pollitt, M.G.; Ritz, R.A.; Strielkowski, W. Market design for a high-renewables European electricity system. Renew. Sustain. Energy Rev. 2018, 91, 695–707. [Google Scholar] [CrossRef]
- Kang, C.; Du, E.; Zhang, N.; Chen, Q.; Huang, H.; Wu, S. Renewable Energy Trading in Electricity Market: Review and Prospect. South. Power Syst. Technol. 2016, 10, 16–23. [Google Scholar]
- Cheng, G.; Liang, Z.; Dong, Y. Analysis and Reflection on the Marketization Construction of Electric Power with Chinese Characteristics Based on Energy Transformation. Proc. CSEE 2020, 40, 369–379. [Google Scholar]
- Yang, J.; Liu, C.; Mi, Y.; Zhang, H.; Terzija, V. Optimization operation model of electricity market considering renewable energy accommodation and flexibility requirement. Glob. Energy Interconnect. 2021, 4, 227–238. [Google Scholar] [CrossRef]
- Cai, T.; Dong, M.; Chen, K.; Gong, T. Methods of participating power spot market bidding and settlement for renewable energy systems. Energy Rep. 2022, 8, 7764–7772. [Google Scholar] [CrossRef]
- Chen, H.; Gao, X.; Liu, J.; Zhang, Q.; Yu, S.; Kang, J.; Yan, R.; Wei, Y. The grid parity analysis of onshore wind power in China: A system cost perspective. Renew. Energy 2020, 148, 22–30. [Google Scholar] [CrossRef]
- Ouyang, X.; Lin, B. Levelized cost of electricity (LCOE) of renewable energies and required subsidies in China. Energy Policy 2014, 70, 64–73. [Google Scholar] [CrossRef]
- Namalomba, E.; Hu, F.; Shi, H. Agent based simulation of centralized electricity transaction market using bi-level and Q-learning algorithm approach. Electr. Power Energy Syst. 2022, 134, 32–41. [Google Scholar] [CrossRef]
- Mitridati, L.; Pinson, P. A Bayesian Inference Approach to Unveil Supply Curves in Electricity Markets. IEEE Trans. Power Syst. 2018, 33, 2610–2620. [Google Scholar] [CrossRef]
- Chen, Q.; Liu, X.; Fang, X.; Guo, H.; Lin, Q. Electricity Market Clearing Mechanism Considering Guaranteed Accommodation of Renewable Energy. Autom. Electr. Power Syst. 2021, 45, 26–33. [Google Scholar]
- Wen, F.; David, A. Optimal bidding strategies for competitive generators and large consumers. Electr. Power Energy Syst. 2001, 23, 37–43. [Google Scholar] [CrossRef]
- Wang, B.; Guo, C.; Zhang, W.; Wu, X. Participation Patterns of Renewable Energy in Spot Electricity Market and Its Impact on Market Clearing Price. Smart Power 2021, 49, 56–63. [Google Scholar] [CrossRef]


Publisher’s Note: MDPI stays neutral with regard to jurisdictional claims in published maps and institutional affiliations. |
© 2022 by the authors. Licensee MDPI, Basel, Switzerland. This article is an open access article distributed under the terms and conditions of the Creative Commons Attribution (CC BY) license (https://creativecommons.org/licenses/by/4.0/).