Article

Rapid Prediction of Retired Ni-MH Batteries Capacity Based on Reliable Multi-Parameter Driven Analysis

1
Wuhan Power Battery Recycling Technology Co., Ltd., Wuhan 431400, China
2
Hubei Key Laboratory of Advanced Technology for Automotive Components, Wuhan University of Technology, Wuhan 430070, China
3
Hubei Collaborative Innovation Center for Automotive Components Technology, Wuhan University of Technology, Wuhan 430070, China
4
GEM Co., Ltd., Shenzhen 518101, China
*
Authors to whom correspondence should be addressed.
Energies 2022, 15(23), 9156; https://doi.org/10.3390/en15239156
Submission received: 10 November 2022 / Revised: 27 November 2022 / Accepted: 30 November 2022 / Published: 2 December 2022

Abstract

:
In order to solve the problems of long-time consumption and high energy consumption in existing capacity detection methods of retired Ni-MH batteries, a fast and reliable capacity prediction method for retired Ni-MH batteries by multi-parameter driven analysis was proposed in this paper. This method mainly obtains several parameters through short-time measurement and pulse rapid nondestructive testing. Then, Pearson correlation coefficient and KS-test were used to analyze the correlation between the two parameters and verify the same distribution. Finally, SVR was used to predict the battery discharge capacity. The results show that the volume expansion thickness difference Δd, AC internal resistance R, terminal voltage U of the battery, charge and discharge polarization internal resistance Rf1 and Rf2 and pulse charging power P2 of the battery are strongly negatively correlated with the discharge capacity, and these characteristic parameters can effectively and reliably reflect the internal structural characteristics of the battery. Additionally, the mean relative error of the established capacity model is 5.87%, and the lowest error is 1.32%. The prediction effect is good, which provides a certain reference value for the subsequent consistent sorting method.

1. Introduction

Ni-MH batteries are one type of green batteries developed in the 1990s, having the characteristics of high energy, long life and no pollution [1,2,3]. Compared with lithium-ion batteries (LIBs), Ni-MH batteries have the advantages of large current, safety, environmental protection, recyclability, resistance to overcharge and over-discharge, good consistency, and excellent high and low temperature performance [4,5,6]. The development of Ni-MH batteries in China started late, but in recent years, the development speed has been relatively fast. In 2006, China became the world’s largest producer of Ni-MH batteries, with a market size of CNY 3.949 billion by 2020 [7]. However, due to the squeeze of the market space of LIBs, the future growth rate of Ni-MH batteries will decrease, and the industry market size is expected to be CNY 4.883 billion in 2025. Ni-MH batteries are widely used in hybrid vehicles, electric toys, backup power supplies, mobile communication base stations, and other fields [8,9,10,11]. The Ni-MH batteries retired from hybrid vehicles still maintain a certain usable capacity and have certain echelon utilization value. Therefore, these batteries can be used in the field of energy storage after screening and recombination [12]. Similar to LIBs, Ni-MH batteries need to be consistently sorted for capacity, internal resistance, and voltage before echelon utilization. However, conventional measurement of the capacity of the batteries is performed by a complete charge and discharge, which is time-consuming and has high energy consumption [13,14,15,16]. Therefore, in order to facilitate the rational sorting and cascade utilization of Ni-MH batteries, it is necessary to develop a method for obtaining the capacity with low energy consumption, high precision and fast speed.
At present, some scholars have performed a lot of research on the state prediction of Ni-MH batteries. For example, Wang et al. [17] used the ampere-hour integration method combined with the open-circuit voltage method to predict the SOC of the Ni-MH batteries pack, and verified the effectiveness of the model and algorithm using FPGA. Jiao et al. [18] used the combination of BP network and genetic algorithm to predict the state of charge. The experiment shows that the network not only converges quickly, but also easily achieves the optimal solution, and the prediction of the remaining power of MH-Ni batteries is effective. Fei et al. [19] proposed a framework based on feature extraction, feature selection and ML model selection (the elastic net, GPR, SVM, RF, GBRT and NN) to effectively predict the early life of batteries. Zhang et al. [20] obtained the characteristic variables of the batteries by pulse, and after the normalization algorithm and factor analysis optimization, the sorting of the batteries was completed by clustering. He et al. [21] equalized the batteries to be sorted in parallel. Then, according to the characteristics of different voltage curves of the battery with different aging degrees, a neural network model of the relationship between battery capacity and voltage is established combined with the radial basis neural network to estimate the battery capacity.
The above studies all attempted to predict the remaining capacity and state of charge (SOC) of Ni-MH batteries or LIBs, but the studies on rapid capacity prediction of Ni-MH batteries still remain unsolved. After review of the former literature, we thought that it is necessary to find a method for rapid prediction of the capacity of retired Ni-MH batteries based on nondestructive testing. In this study, the retired Ni-MH batteries are taken as the research object, and the multi-parameters of the internal state of the reaction batteries are obtained by short-time test and pulsed nondestructive test. These parameters were correlated by Pearson correlation coefficient screening, and the relationship between the characteristic parameters and discharge capacity was analyzed. Then, the KS-test method is used to verify the same mapping between the training set and the test set, and finally the discharge capacity of the batteries is predicted by SVR. A reliable fast capacity prediction method for retired Ni-MH batteries based on multi-parameter drive analysis is proposed.

2. Materials and Methods

The retired Ni-MH batteries are disassembled by the same decommissioned battery pack module. Figure 1a shows the distribution of Ni-MH battery modules, where it can be seen that the module contains 34 groups of Ni-MH battery cells. Figure 1b shows a schematic diagram of a Ni-MH battery cell, and it can be seen that each battery cell is composed of 6 cells in series, referred to as R-N6 batteries herein. During the test, the battery cells are numbered from left to right according to the distribution of battery pack modules. The R-N6 battery has a nominal capacity of 6.45 Ah, a rated voltage of 7.2 V, a charge cut-off voltage of 9 V and a discharge cut-off voltage of 6 V.

2.1. Capacity Testing

The 100 V 100 A RePower charge and discharge test cabinet was used as the test platform to measure the capacity of 34 groups of R-N6 batteries. After resting for 30 min, it is discharged at constant current at 1 C, and the cut-off voltage is set to 6 V and left to stand for 30 min. Then it is charged at 1 C constant current to 60 min, then transferred to 0.1 C for 60 min, the cut-off voltage is set to 9 V and rested for 30 min. Finally, the battery is discharged with 1 C constant current, switched to the lower limit cut-off voltage, and the charge and discharge capacity of the battery is measured.

2.2. Parameter Acquisition Test

Before the test, the 34 groups of R-N6 batteries were first adjusted to the same state. The constant current was 6 V at 1 C, then the battery was charged at 1 C for 30 min at constant current and the charging cut-off voltage was set to 9 V.

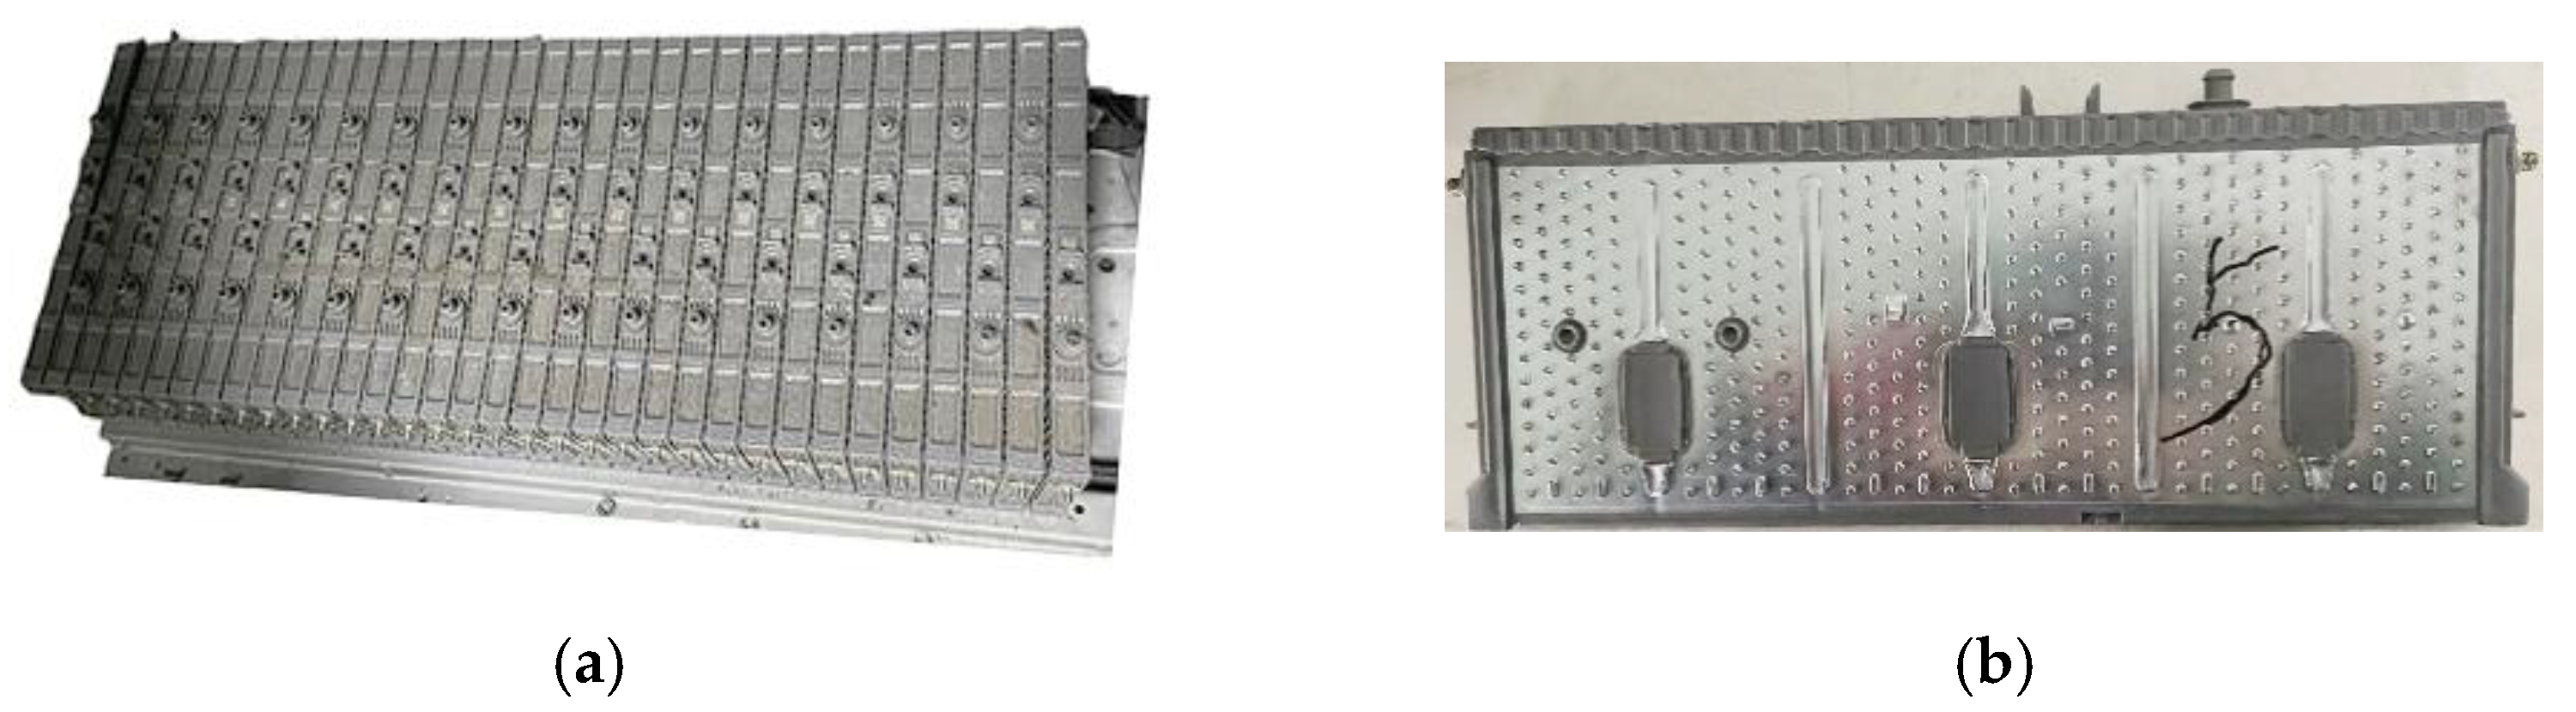
2.2.1. Difference in Volume Expansion Thickness

The active materials of the positive electrode of the Ni-MH batteries are NiOOH (when discharging) and Ni (OH)2 (when charging), the active materials of the negative electrode are H2 (when discharging) and H2O (when charging) and the electrolyte adopts a 30% potassium hydroxide solution [8]. Ni-MH batteries will inevitably produce an oxygen evolution reaction at the positive electrode and hydrogen evolution reaction at the negative electrode in the late stage of charging. O2 generated at the positive electrode diffuses to the negative electrode and H2 generated in the negative electrode is reduced to H2O or OH- into the electrolyte through a chemical recombination reaction. During the effective life of the battery, the internal pressure after each charge can be stabilized after a period of time. However, for retired Ni-MH batteries, some H2 and O2 cannot be completely eliminated during the test, and internal pressure is gradually accumulated inside the battery to produce a certain volume expansion [22]. Therefore, measurement of its volume expansion can reflect the health state of the battery.
The thickness of the battery before and after charging is measured by using Vernier calipers, and the difference between the volume expansion thickness Δd is obtained, and the calculation formula is as follows:
Δ d = d 2 d 1
where d1 represents the thickness of the battery before charging and d2 represents the thickness of the battery after adjusting to the same state.

2.2.2. AC Internal Resistance and Terminal Voltage
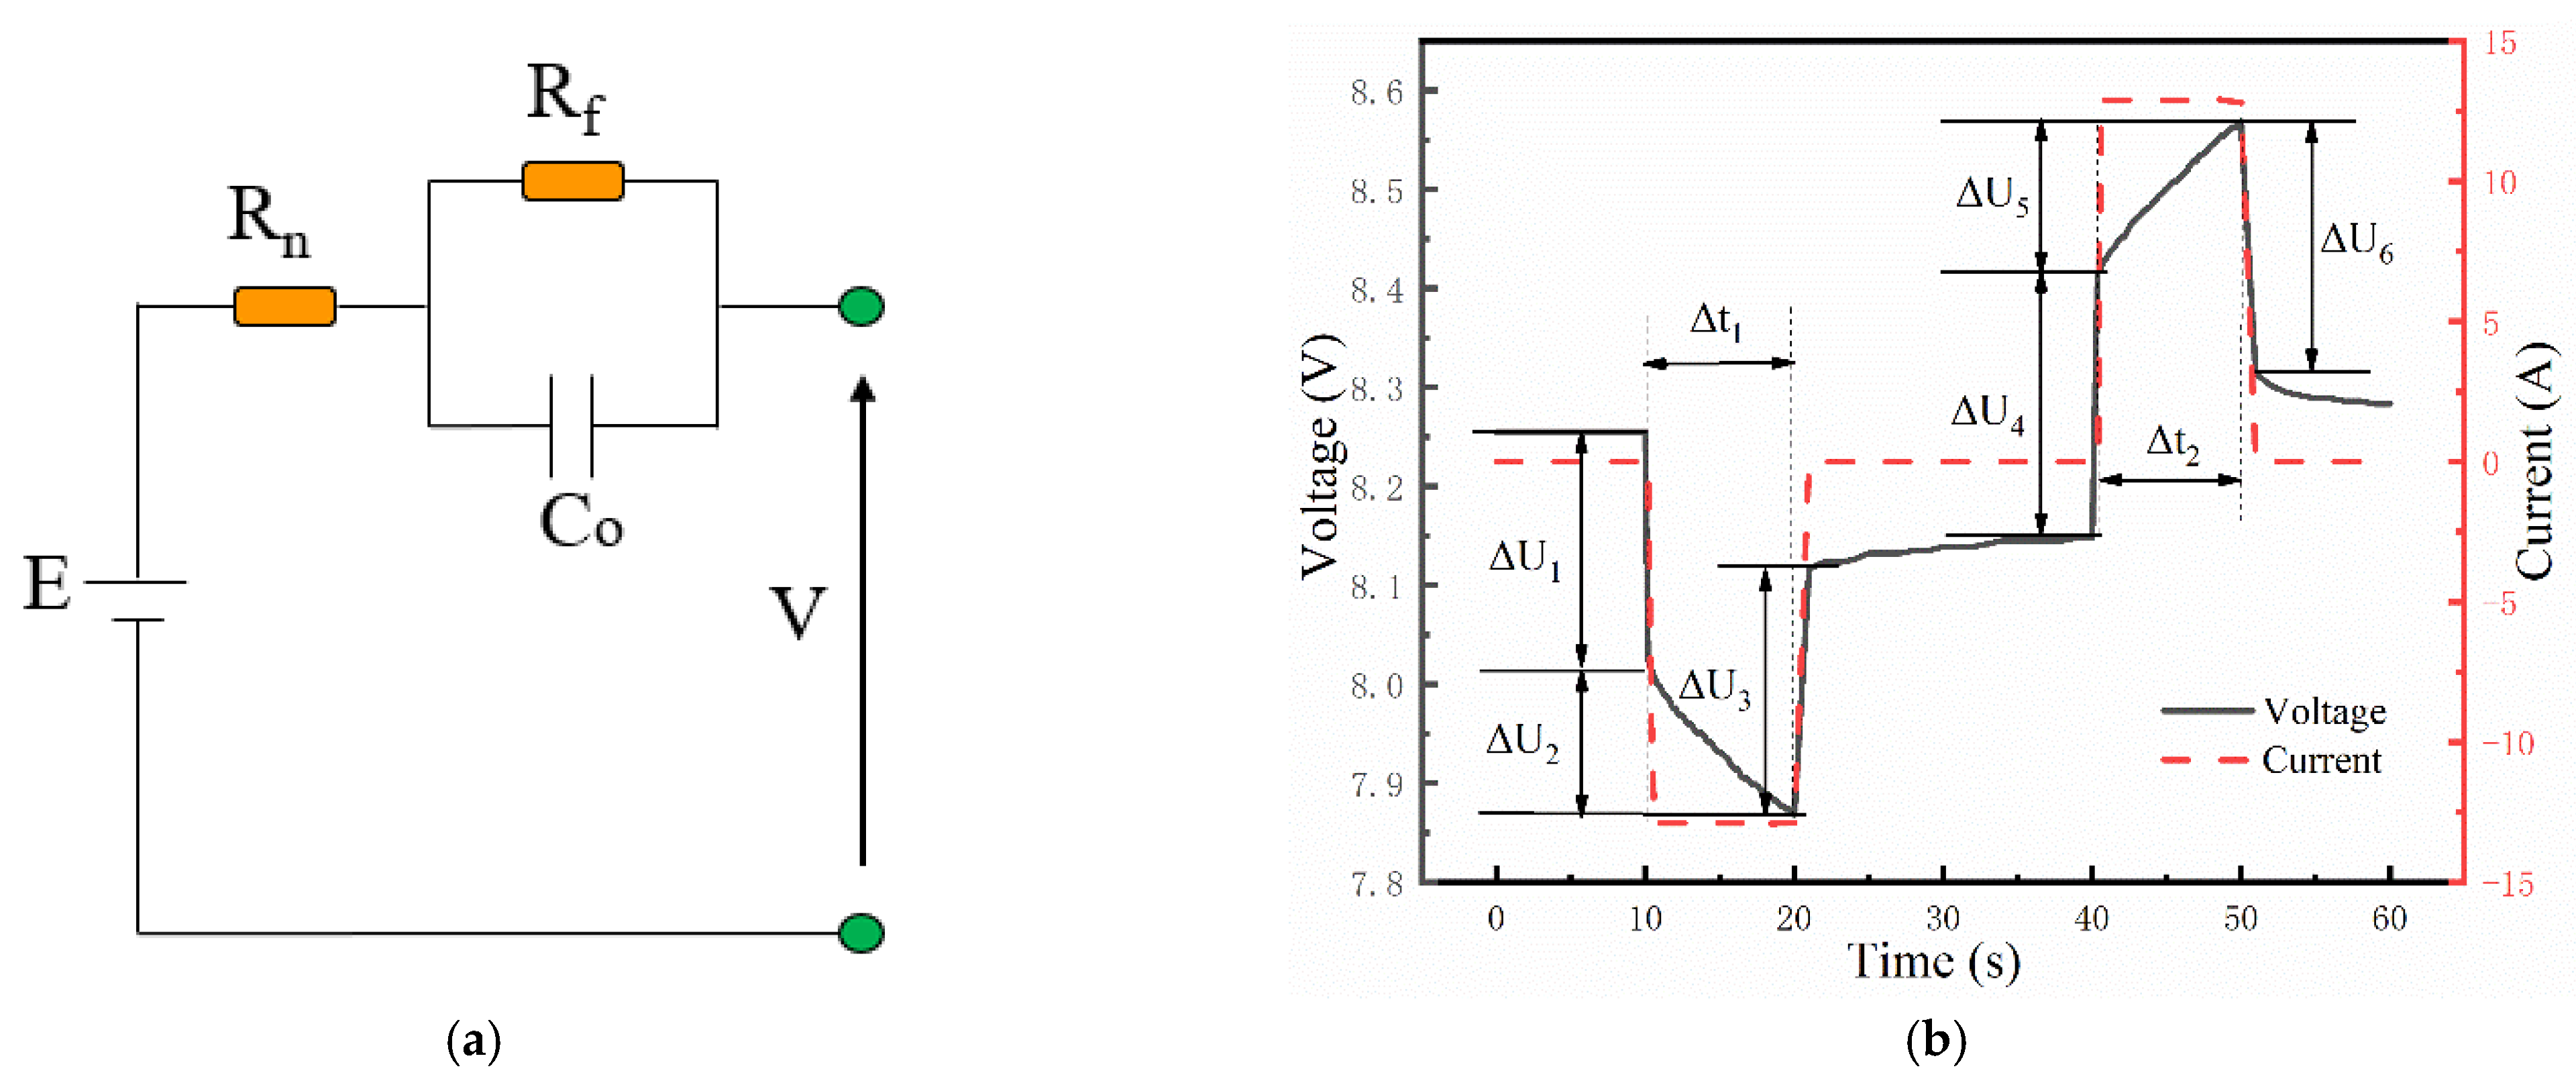
The BT3562 daily internal resistance tester was utilized as the test platform, applying an AC signal of 1 KHz to the battery, and obtaining the AC internal resistance of the battery by measuring the voltage drop generated under the AC signal (reaction time is within 100 ms). The internal resistance impedance of the battery reflects the degree of damage of the acidified film of the battery. In addition, the terminal voltage of the battery can be obtained through the test. In this study, the AC internal resistance and the terminal voltage of the R-N6 batteries in the same state are measured. The basic information of the internal characteristics of the reaction battery is obtained in a short time, and the AC internal resistance R1 and terminal voltage U1 of the battery are obtained.

2.2.3. Pulse Test

Figure 2a shows the Thévenin equivalent circuit model, which is a commonly used battery model. It can reflect the voltage and current volt-ampere characteristics of the battery working process well. Figure 2b shows the charge-discharge response of an R-N6 battery at 2 C with 10 s pulse at the same state. It can be seen that the step current generated by the pulse can cause the battery voltage to drop. At the same time, by combining the impulse response diagram with the Thévenin equivalent circuit model, the internal resistance of the battery can be quantified [13]. Among them, the instantaneous voltage drop can be generated as the pure ohmic internal resistance Rn of the battery, and the subsequent voltage drop can be generated as the polarized internal resistance Rf of the battery [23]. By calculating these two parts, you can visualize the complex electrochemical processes involved in the battery system. According to Figure 2b, the charge and discharge ohmic internal resistances Rn1 and Rn2 of the battery, the charge and discharge polarized internal resistances Rf1 and Rf2, and the charge and discharge pulse powers P1 and P2 are calculated, and the calculation formula is as follows:
R n 1 = Δ U 1 + Δ U 3 2 I 1
R n 2 = Δ U 4 + Δ U 6 2 I 2
R f 1 = Δ U 2 I 1
R f 2 = Δ U 5 I 2
P 1 = W 1 Δ t 1
P 2 = W 2 Δ t 2
Among them, Rn1 is the discharge ohmic internal resistance, Rn2 is the charging ohmic internal resistance, Rf1 is the polarized internal resistance of the discharge polarization, I1 is the pulse discharge current, I2 is the pulse charging current, W1 is the energy in the pulse discharge process, Δt1 is the pulse discharge time, W2 is the energy during pulse charging and Δt2 is the pulse charging time.

3. Results and Discussion

In this section, the correlation between each parameter and capacity is investigated based on the Pearson correlation coefficient. After KS-test for the parameters, a Ni-MH battery-capacity prediction model was developed and evaluated.

3.1. Analysis of Charging and Discharging Results

Figure 3a shows the charging and discharging curve of an R-N6 battery, from which it can be seen that there is no obvious voltage plateau in the charging or discharging of the R-N6 battery. By comparing the charging curve with the discharge curve, it can be found that the voltage of the discharge mirror curve rises sharply at the end of the curve, while the voltage of the charging curve tends to be stable and has a downward trend. It is explained that the degradation rate of the negative electrode is higher than that of the positive electrode, and the charging capacity of the battery is attenuated [4], which leads to the decrease of the effective hydrogen removal capacity on the hydrogen storage alloy electrode [22]. Hydrogen elimination includes the absorption of H2 and the formation of water by combining H2 and O2. Figure 3b shows the discharge capacity distribution of 34 groups of R-N6 batteries. It can be seen that the capacity of the R-N6 battery is seriously attenuated, and the discharge capacity is distributed below 4 Ah and declines to below 62% of the nominal capacity. Generally, due to their good performance and safety, retired Ni-MH batteries with a discharge capacity greater than 3 Ah can be remanufactured. In this group of battery packs, it can be found that more than 40% of R-N6 batteries can be remanufactured. In addition, according to the arrangement of the battery numbers from left to right in the module, it can be found that the capacity of the batteries distributed in the outer edge decay slower than that of the batteries distributed in the middle. It shows a trend of first decreasing and then increasing. This may be due to the fact that the batteries distributed in the middle of the module dissipate heat more slowly, and the battery life decays faster than the batteries on both sides after long-term workload, making the discharge capacity lower.

3.2. Multiparameter Correlation Extraction Results

By means of the parameter acquisition experiment, the volume expansion thickness difference Δd, AC internal resistance R and terminal voltage U of the battery, pulse discharge ohmic internal resistance Rn1, pulse charging ohmic internal resistance Rn2, pulse discharge polarization internal resistance Rf1, pulse charging polarization internal resistance Rf2, pulse discharge power P1 and pulse charging power P2 were obtained. Pearson correlation coefficient is used to calculate the correlation coefficient between the two various parameters, which is used to measure the linear relationship between distance variables and is displayed by heatmap. Its formula is shown in Equation (8). Its Pearson correlation coefficient varies from −1 to 1, and the closer its value is to −1 or 1, the higher the correlation between the two variables.
r = ( x i x ¯ ) ( y i y ¯ ) ( x i x ¯ ) 2 ( y i y ¯ ) 2
where r represents the correlation coefficient and xi and yi represent two random parameter variables.
Figure 4a shows the heatmap of correlation coefficients among parameters, and Figure 4b shows the scatter distribution map between parameters. In the heatmap, the closer the color is to deep red, the closer the r value is to 1, indicating the more positive correlation between the two parameters. The closer the color is to deep blue, the closer the r value is to −1, indicating a more negative correlation between the two parameters. In addition, the heatmap is a symmetric relation, and the first row or column in the graph represents the correlation between parameters. By combining the heatmap and scatter distribution map, it can be found that each parameter has a certain correlation with battery discharge capacity. Except that the discharge power P1 is positively correlated with the discharge capacity, the other parameters are negatively correlated with the discharge capacity. If the parameters are strongly correlated with the discharge capacity, their r is greater than 0.6 or less than −0.6. Thus, such parameters are selected as the characteristic parameters, reflecting the internal structure of the battery and having the ability of predicting the discharge capacity of the battery more accurately. Among them, the parameters with r values greater than 0.6 or less than −0.6 are Δd, R, U, Rf1, Rf2 and P2.
Figure 5 shows the distribution of characteristic parameters and discharge capacity, and the distribution map is linearly fitted. It can be seen that the larger the value of each characteristic parameter is, the lower the discharge capacity is. Among them, the highest correlation is the Rf2, and the lower the discharge capacity, the greater the Rf2. It is further shown that the polarization internal resistance of the battery obtained by pulse can reflect the signs of decline of the internal structure of the battery to a certain extent, thereby reflecting the degree of attenuation of the battery. By contrast, the correlation of ohmic resistance obtained by pulse is low. This may be related to the material of the battery itself and the contact resistance during the test, thus it has little influence on the capacity attenuation degree of the reaction battery to a certain extent.

3.3. Same Distribution Verification

KS-test (Kolmogorov–Smirnov test) is a nonparametric test that can test whether two data distributions are consistent without knowing the specific distribution of the data. It is based on the cumulative distribution function, and tests whether the sample follows a specified distribution by analysis of the difference between two distributions [24]. If the cumulative frequency distribution differs little from the specified distribution, it is inferred that the sample follows the command distribution. The null hypothesis H0 indicates that the two data distributions are consistent or the data conform to the theoretical distribution. In practical applications, p-value is generally used to determine whether to reject the H0 hypothesis. If the p-value of the test result is greater than 0.05, the H0 hypothesis is accepted; otherwise, the H0 hypothesis is not accepted.
Before the capacity prediction of R-N6 batteries, the sample data should be divided. In this study, the “train_test_split” function is used to randomly divide the training set and test set according to a 13:4 ratio. Then, the cumulative distribution map of the partitioned data was drawn and the same distribution verification of the training set was carried out by KS-test. Figure 6 shows the cumulative distribution curves of the training set and test set with different parameters. It can be found that the distribution of the test is divided randomly with the range of the training set. Moreover, KS-test was used to verify the divided data, as shown in Table 1. It can be seen that p-values are all greater than 0.05, which proves that the training set divided by data is identically distributed with the test set. In this way, the rationality of the division of training set and test set can be verified, and the result of predicting the discharge capacity of the R-N6 battery is more reliable.

4. Method Validation

A support vector machine (SVM) is a supervised learning model with related learning algorithms and can be used to analyze data for classification and regression analysis. In support vector regression (SVR), the lines required to fit the data are called hyperplanes [25]. The goal of SVM is to find a hyperplane in N-dimensional space that can categorize data points explicitly. The basic idea of SVR is to find the best fitting line in the n-dimensional feature space by mapping training data Xi, that is, the hyperplane with the most points. It can solve machine learning problems with small samples. The SVR function is shown in Equation (9).
f ( x ) = W T φ ( x ) + b
where f(x) denotes the forecasting values, W is the N-dimensional weight factor, b is the adjustable factor and φ(x) is the map function of mapping xi into the N-dimensional feature space [25].
In this study, the SVR model was used to predict the discharge capacity of R-N6 batteries, and the feasibility of predicting the capacity of Ni-MH batteries with multiple parameters obtained by various methods was verified. The model has 26 sets of training data and 8 sets of test data. The input of the support vector regression (SVR) model is the filtered feature parameters, and the output is the discharge capacity. The kernel function of this model is a linear function, and the penalty function “C” is 100, the error precision “tol” of stopping the training is 10−4 and the value of the maximum number of iterations “max_iter” is 107. The prediction is shown in Figure 7. The predicted maximum error value is 0.35 Ah, which may be due to factors such as battery thickness, internal resistance and terminal voltage measured by the tester during the experiment. In addition, the self-discharge of the battery during the long-standing process will also affect the test results. The mean relative error is calculated as shown in Equation (10). It can be seen that the mean relative error of the established capacity prediction model for R-N6 battery capacity prediction is 5.87% and the lowest error is 1.32%. Additionally, such accuracy is acceptable in real application. The results show that it is feasible to predict the capacity of Ni-MH batteries by using the short-time measurement and pulse rapid nondestructive testing.
M R E = 1 N i = 1 N | f i y i y i |
where fi is the predicted value, yi is the true value and N is the number of samples in the test set.

5. Conclusions

In this study, a fast capacity prediction method for decommissioned R-N6 batteries based on multi-parameter driven analysis is presented.
(1)
The R-N6 batteries have no obvious voltage plateau during charging and discharging. Their discharge capacity is distributed below 4 Ah, and battery attenuation is more serious.
(2)
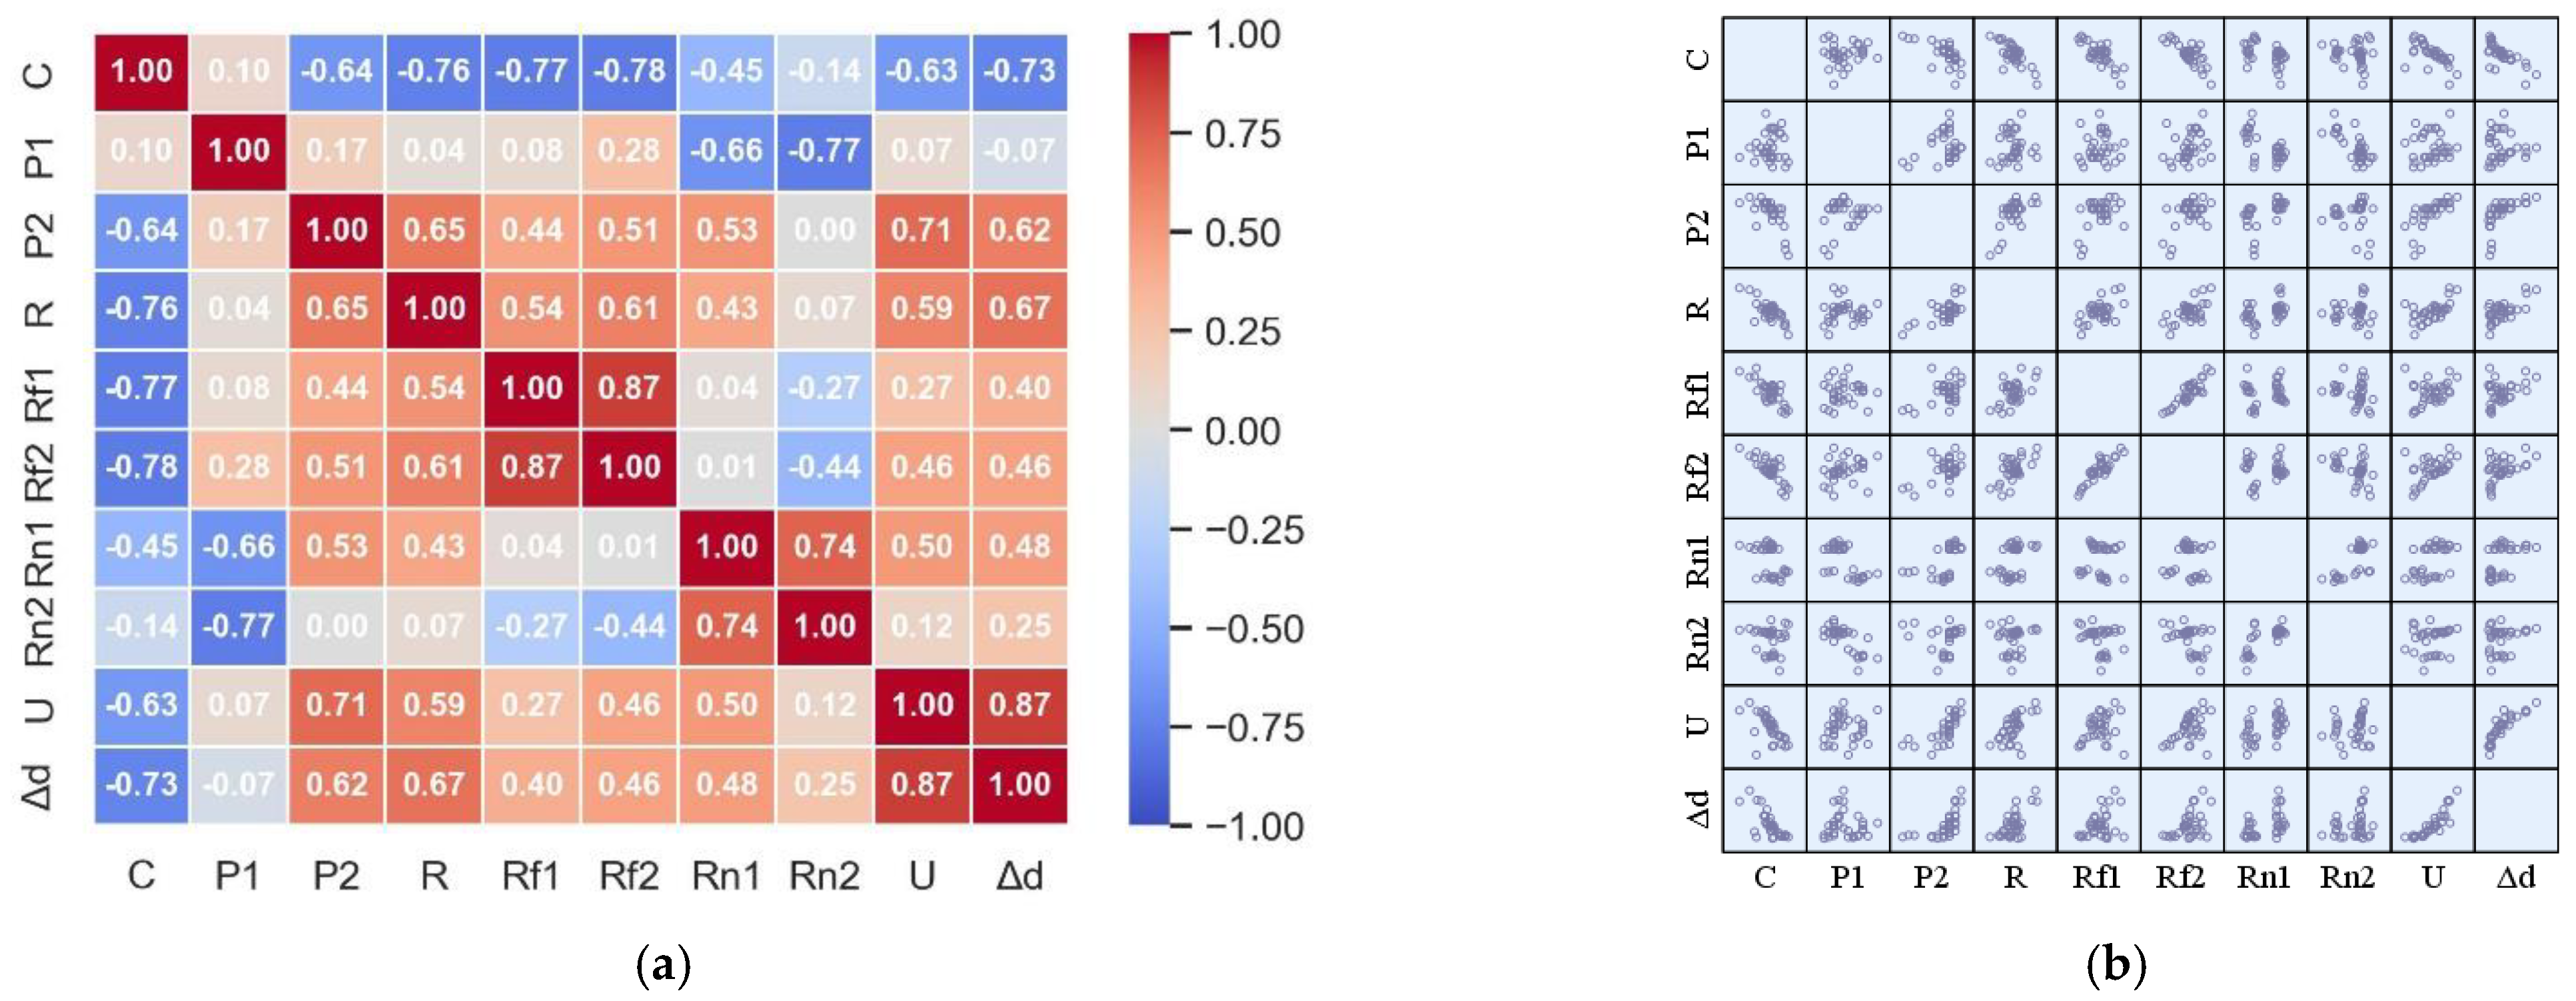
By using Pearson correlation coefficient on the parameters, it is found that the discharge power P1 is positively correlated with the discharge capacity. Other parameters are negatively correlated with the discharge capacity. Among them, Δd, R, U, Rf1, Rf2 and P2 show strong correlation with the discharge capacity of R-N6 batteries. These characteristic parameters obtained by rapid testing can effectively and reliably reflect the internal structure characteristics of the battery.
(3)
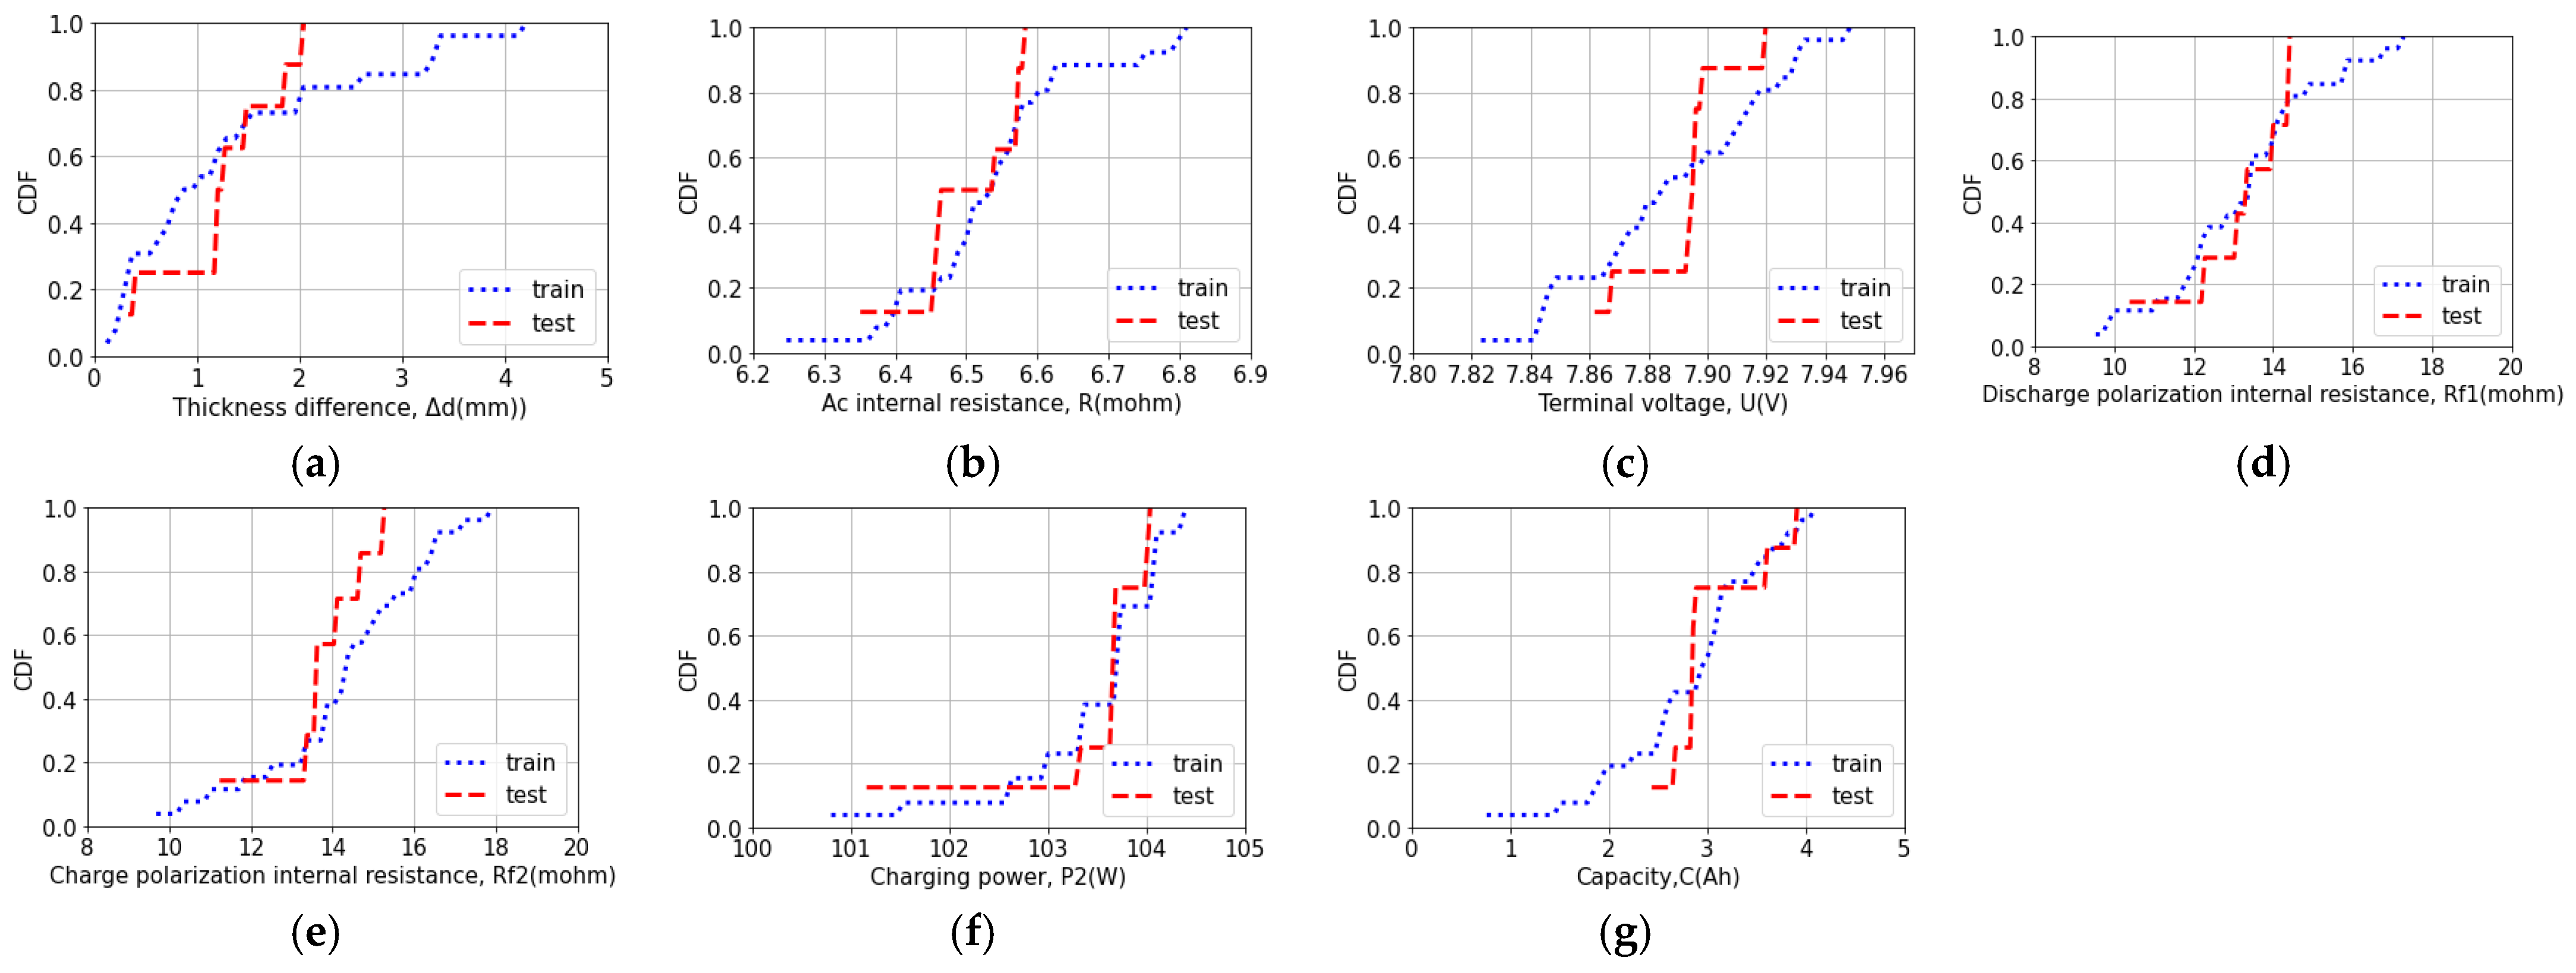
The KS-test was used to verify the same distribution of the multi-feature parameters, and then support vector regression (SVR) was used to establish the discharge capacity prediction model. The average relative error of capacity prediction is 5.87% and the lowest error is 1.32%. It shows that the prediction for Ni-MH batteries by the method presented in this paper is acceptable and reliable.

Author Contributions

Conceptualization, H.L. and C.B.; methodology, H.L. and C.B.; formal analysis, J.K. and F.L.; data curation, J.K. and F.L.; writing—original draft preparation, H.L. and Y.Z.; writing—review and editing, H.L. and Y.Z. All authors have read and agreed to the published version of the manuscript.

Funding

This research was funded by “2021 High Quality Development Project” grant number TC210H02C and the National Natural Science Foundation of China grant number 52277224.

Acknowledgments

The authors express their sincerest thanks to the Ministry of Industry and Information Technology of China for financing this research within the program “2021 High Quality Development Project (TC210H02C)” and the National Natural Science Foundation of China under grants No. 52277224.

Conflicts of Interest

The authors declare no conflict of interest.

References

  1. Ouyang, L.; Huang, J.; Wang, H.; Liu, J.; Zhu, M. Progress of hydrogen storage alloys for Ni-MH rechargeable power batteries in electric vehicles: A review. Mater. Chem. Phys. 2017, 200, 164–178. [Google Scholar] [CrossRef]
  2. Zhu, W.H.; Zhu, Y.; Davis, Z.; Tatarchuk, B.J. Energy efficiency and capacity retention of Ni–MH batteries for storage applications. Appl. Energy 2013, 106, 307–313. [Google Scholar] [CrossRef]
  3. Miao, Y.; Hynan, P.; von Jouanne, A.; Yokochi, A. Current Li-Ion Battery Technologies in Electric Vehicles and Opportunities for Advancements. Energies 2019, 12, 1074. [Google Scholar] [CrossRef] [Green Version]
  4. Chen, X.; Chu, A.; Li, D.; Yuan, Y.; Fan, X.; Deng, Y. Development of the cycling life model of Ni-MH power batteries for hybrid electric vehicles based on real-world operating conditions. J. Energy Storage 2021, 34, 101999. [Google Scholar] [CrossRef]
  5. Chu, H.L.; Qiu, S.J.; Sun, L.X.; Zhang, Y.; Xu, F.; Jiang, T.; Hu, W.Y. The improved electrochemical properties of novel La–Mg–Ni-based hydrogen storage composites. Electrochim. Acta 2007, 52, 6700–6706. [Google Scholar] [CrossRef]
  6. Kang, J.; Yan, F.; Zhang, P.; Du, C. Comparison of comprehensive properties of Ni-MH (nickel-metal hydride) and Li-ion (lithium-ion) batteries in terms of energy efficiency. Energy 2014, 70, 618–625. [Google Scholar] [CrossRef]
  7. Piao, C.-H.; Fu, W.-L.; Lei, G.-H.; Cho, C.-D. Online Parameter Estimation of the Ni-MH Batteries Based on Statistical Methods. Energies 2010, 3, 206–215. [Google Scholar] [CrossRef]
  8. Assefi, M.; Maroufi, S.; Yamauchi, Y.; Sahajwalla, V. Pyrometallurgical recycling of Li-ion, Ni–Cd and Ni–MH batteries: A minireview. Curr. Opin. Green Sustain. Chem. 2020, 24, 26–31. [Google Scholar] [CrossRef]
  9. Wu, J.B.; Tu, J.P.; Han, T.A.; Yang, Y.Z.; Zhang, W.K.; Zhao, X.B. High-rate discharge ability enhancement of Ni/MH rechargeable batteries by addition of nanoscale CoO to positive electrodes. J. Power Sources 2006, 156, 667–672. [Google Scholar] [CrossRef]
  10. He, H.; Xiong, R.; Fan, J. Evaluation of lithium-ion battery equivalent circuit models for state of charge estimation by an experimental approach. Energies 2011, 4, 582–598. [Google Scholar] [CrossRef]
  11. Barai, A.; Uddin, K.; Widanage, W.D.; McGordon, A.; Jennings, P.A. study of the influence of measurement timescale on internal resistance characterisation methodologies for lithium-ion cells. Sci. Rep. 2018, 8, 21. [Google Scholar] [CrossRef] [PubMed] [Green Version]
  12. Strange, C.; dos Reis, G. Prediction of future capacity and internal resistance of Li-ion cells from one cycle of input data. Energy AI 2021, 5, 100097. [Google Scholar] [CrossRef]
  13. Hoque, M.A.; Nurmi, P.; Kumar, A.; Varjonen, S.; Song, J.; Pecht, M.G.; Tarkoma, S. Data driven analysis of lithium-ion battery internal resistance towards reliable state of health prediction. J. Power Sources 2021, 513, 230519. [Google Scholar] [CrossRef]
  14. Mao, W.J.; Lou, Y.; Zhang, H. Internal gas pressure applied in charging control and SOC estimation of MH/Ni battery. Battery Bimon. 2011, 41, 254–257. [Google Scholar]
  15. Wang, Z.; Song, C.; Yuan, C.; Li, X. A flexible method for state-of-health estimation of lithium battery energy storage system. Energy Rep. 2021, 7, 6375–6383. [Google Scholar] [CrossRef]
  16. Ahmeid, M.; Muhammad, M.; Lambert, S.; Attidekou, P.S.; Milojevic, Z. A rapid capacity evaluation of retired electric vehicle battery modules using partial discharge test. J. Energy Storage 2022, 50, 104562. [Google Scholar] [CrossRef]
  17. Wang, L.J.; Li, M. Research on state of charge estimation method with Ni-MH battery for electric vehicle. Mod. Electron. Technol. 2015, 155, 149–151. [Google Scholar]
  18. Jiao, H.M.; Yu, Q.M. Research on capacity predication of battery based on BP network and genetic algorithm. Comput. Simul. 2006, 23, 218–220. [Google Scholar]
  19. Fei, Z.; Yang, F.; Tsui, K.-L.; Li, L.; Zhang, Z. Early prediction of battery lifetime via a machine learning based framework. Energy 2021, 225, 120205. [Google Scholar] [CrossRef]
  20. Zhang, C.L.; Zhao, S.; Zhang, B. A fast classification method based on factor analysis and K-means clustering for retired electric vehicle batteries. Power Syst. Prot. Control 2021, 49, 41. [Google Scholar]
  21. He, Z.L.; Zhou, P. Research on Sorting of Retired Lithium Battery Based on Radial Basis Function Neural Network. Electron. Sci. Technol. 2021, 34, 38. [Google Scholar]
  22. Cha, C.; Yu, J.; Zhang, J. Comparative experimental study of gas evolution and gas consumption reactions in sealed Ni–Cd and Ni–MH cells. J. Power Sources 2004, 129, 347–357. [Google Scholar] [CrossRef]
  23. Uddin, K.; Picarelli, A.; Lyness, C.; Taylor, N.; Marco, J. An Acausal Li-Ion Battery Pack Model for Automotive Applications. Energies 2014, 7, 5675–5700. [Google Scholar] [CrossRef]
  24. Su, Q.; Wang, Y.; Jiang, X.; Chen, F.; Lu, W.-C. A Cancer Gene Selection Algorithm Based on the K-S Test and CFS. BioMed Res. Int. 2017, 2017, 1645619. [Google Scholar] [CrossRef] [PubMed] [Green Version]
  25. Chen, Y.; Xu, P.; Chu, Y.; Li, W.; Wu, Y.; Ni, L.; Bao, Y.; Wang, K. Short-term electrical load forecasting using the Support Vector Regression (SVR) model to calculate the demand response baseline for office buildings. Appl. Energy 2017, 195, 659–670. [Google Scholar] [CrossRef]
Figure 1. (a) Distribution map of Ni-MH battery modules; (b) exterior diagram of a Ni-MH battery cell.
Energies 15 09156 g001
Figure 2. (a) Thévenin equivalent circuit model; (b) impulse charge and discharge response of Ni-MH batteries.
Energies 15 09156 g002
Figure 3. R-N6 battery distribution map. (a) Charge and discharge curve; (b) discharge capacity distribution map.
Energies 15 09156 g003
Figure 4. (a) Heatmap of correlation between parameters; (b) scatter distribution map between parameters.
Energies 15 09156 g004
Figure 5. The distribution of parameters with discharge capacity for r ≥ 0.6 or r ≤ −0.6. (a) Difference in volume expansion thickness; (b) AC internal resistance; (c) terminal voltage; (d) discharge polarization internal resistance; (e) charge polarization internal resistance; (f) charging power.
Energies 15 09156 g005
Figure 6. Cumulative distribution curves of training and test sets with different parameters. (a) Difference in volume expansion thickness; (b) AC internal resistance; (c) terminal voltage; (d) discharge polarization internal resistance; (e) charge polarization internal resistance; (f) charging power; (g) capacity.
Energies 15 09156 g006
Figure 7. Prediction of R-N6 battery discharge capacity. (a) The distribution of true and forecast values; (b) the distribution of residuals.
Energies 15 09156 g007
Table 1. KS-test results.
FeatureStatisticp-Value
Thickness difference0.3650.308
AC internal resistance0.2690.671
Terminal voltage0.3270.438
Discharge polarization internal resistance0.1920.943
Charge polarization internal resistance0.3560.330
Charging power0.1350.999
Capacity0.3270.438
Publisher’s Note: MDPI stays neutral with regard to jurisdictional claims in published maps and institutional affiliations.

