Article

Weighting Key Performance Indicators of Smart Local Energy Systems: A Discrete Choice Experiment

by
Christina Francis
1,†,
Paul Hansen
2,
Bjarnhéðinn Guðlaugsson
1,
David M. Ingram
1 and
R. Camilla Thomson
1,*
1
School of Engineering, The University of Edinburgh, Colin Maclaurin Road, Edinburgh EH9 3DW, UK
2
Department of Economics, University of Otago, Dunedin 9054, New Zealand
*
Author to whom correspondence should be addressed.
Current address: School of the Built Environment and Architecture, London South Bank University, 103 Borough Road, London SE1 0AA, UK.
Energies 2022, 15(24), 9305; https://doi.org/10.3390/en15249305
Submission received: 10 June 2022 / Revised: 1 November 2022 / Accepted: 19 November 2022 / Published: 8 December 2022

Abstract

:
The development of Smart Local Energy Systems (SLES) in the UK is part of the energy transition tackling the energy trilemma and contributing to achieving the Sustainable Development Goals (SDGs). Project developers and other stakeholders need to independently assess the performance of these systems: how well they meet their aims to successfully deliver multiple benefits and objectives. This article describes a step undertaken by the EnergyREV Research Consortium in developing a standardised Multi-Criteria Assessment (MCA) tool—specifically a discrete choice experiment (DCE) to determine the weighting of key performance indicators (KPIs). The MCA tool will use a technology-agnostic framework to assess SLES projects, track system performance and monitor benefit realisation. In order to understand the perceived relative importance of KPIs across different stakeholders, seven DCEs were conducted via online surveys (using 1000minds software). The main survey (with 234 responses) revealed that Environment was considered the most important criterion, with a mean weight of 21.6%. This was followed by People and Living (18.9%), Technical Performance (17.8%) and Data Management (14.7%), with Business and Economics and Governance ranked the least important (13.9% and 13.1%, respectively). These results are applied as weightings to calculate overall scores in the EnergyREV MCA-SLES tool.

1. Introduction

Smart Local Energy Systems (SLES) are being developed to connect various energy vectors (e.g., transport, heat, and power) through flexible energy supply, demand and storage options by exploiting digital technology and the Internet of Energy [1,2]. The deployment and development of SLES has the potential to resolve the energy trilemma (producing cleaner energy at an affordable price with acceptable energy security) [1,2]. Furthermore, SLES can provide many co-benefits that progress towards 11 out of the 17 United Nations (UN) Sustainable Development Goals (SDGs) [2,3]. SLES can provide cleaner, affordable energy, resilient infrastructure, job creation and improved living conditions, which correspond to SDG7 Affordable and Clean Energy, SDG9 Industry, Innovation and Infrastructure, SDG8 Decent Work and Economic Growth and SDG11 Sustainable Cities and Communities [4]. Enabling the delivery of these benefits is a key driver for ongoing financial investment in SLES. To ensure that this potential of SLES is realised, however, investors and other stakeholders need to be able to measure the success and performance of an SLES project to understand what works, for whom and in what context.
This article describes a set of discrete choice experiments (DCE) used in the development of a Multi-Criteria Assessment (MCA) tool to specifically focus on SLES, which is being developed by members of the Innovate-UK-funded EnergyREV project. MCA methods have been applied to carry out a wide range of analyses on complex energy planning and strategy issues. These have provided information to enable the energy transition thorough improvements in decision making, policy design, development strategies and frameworks [5,6,7,8,9,10,11]. The MCA carried out by Heo et al. [5] resulted in an increase in renewable generation capacity in Korea from 2.8% in 2007 to 11% by 2030, while another MCA has identified which technologies should be prioritised in future energy policies and strategies for Lithuania [6]. In Moldova, which is considered to be an energy-deficient country due to its limited energy resources, MCA has also been applied to inform the direction of future energy system development [7]. MCA has also been used to understand potential local societal acceptance of energy technologies and systems (of value to policy making) by ranking different energy system scenarios according to local stakeholder preferences in the Faroe Islands [8].
Despite these existing MCAs of energy systems, there is currently no standardised approach to assess SLES performance, and most existing tools are not completely suitable for the purpose; they may be focused on techno-economic metrics, or be complex and difficult to use for this application (this is described in greater detail in [12]). The authors are, therefore, developing a simplified, technology-agnostic MCA tool to examine SLES projects that will track both the system performance and the benefits that may be realised. This independent, standardised assessment tool will support SLES project developers in bench-marking progress against project aspirations, aid in gathering evidence to build investors’ confidence and, over time, be used as a route map and checklist for SLES replication and expansion. The tool is also expected to assist policymakers in identifying areas where policy change is required in order to enable progress.
The first step in developing this MCA tool for SLES was to identify the main criteria for success (or failure) of a project and the corresponding metrics to measure them. The details of this process (described in [12,13] and summarised in Section 1.2 of this article) drew on the existing literature and evaluation tools, alongside public stakeholder workshops. The process resulted in a comprehensive list of key performance indicators, which were grouped into six key themes: “technical performance, data management, governance, people & living, business & economics, and environment” [3]. The key performance indicators identified during this process included both primary benefits (or core outcomes) and support solutions (e.g., data management and governance) critical for delivering SLES objectives.
The next step in combining these key performance indicators into an MCA tool is to characterise their relative importance via a set of weights, and this is the focus of this article. These weights are identified by collecting public stakeholder views using a discrete choice experiment (DCE) refined by means of semi-structured interviews with subject experts. The DCE method is commonly used in research related to understanding consumer choice [14,15,16]. In recent years, DCE has been used more frequently in research concerning the energy transition to capture stakeholder preferences related to key components of this transition. These include different energy policies and energy technologies [17,18], the identification and selection of assessment indicators for energy systems [14,16], energy policies related to local energy communities and social acceptance [19] and green infrastructure [20]. The study by Azarova et al. [19], for example, applied a choice experiment approach to analyse the attitude of local communities towards different configurations of renewable energy technologies within the local energy system in four European countries. This found that energy system developments focusing on gas power plants and increased power transmission infrastructure had low social acceptance, while those with increased solar implementation and power-to-gas infrastructure development had high social acceptance.
There is limited application of the DCE method for identifying and determining the relative importance of energy assessment indicators; only two similar pieces of research have been identified to date. Both Naegler et al. [14] and Hottenroth et al. [16] applied the DCE method to capture and analyse stakeholder preferences towards sets of indicators with the purpose of determining which to include (or exclude) for different assessment scenarios and energy transition pathways, and the corresponding weighting.
This article aims to contribute to the ongoing discourse on applying DCE to determine the weights of criteria for MCA of energy systems from stakeholder preferences. The position of the DCE within the process of the MCA-SLES tool development is described alongside details of the previously defined assessment criteria and the resulting criteria weights. The DCE was conducted via an online survey to understand the dynamics of multiple components of SLES among various stakeholders. Participants were asked “what kind of energy system do you prefer?”; this simple question facilitated ranking the relative importance of various metrics within the six themes (Technical Performance, Data Management, Governance, People and Living, Business and Economics and Environment).
The remainder of the article is structured as follows: in the rest of Section 1, background information is provided on possible approaches for measuring the relative importance or weighting of key performance indicators for multiple objectives of a system, and the previous work conducted in specifying the criteria used to assess the success or failure of SLES is summarised; in Section 2, the design of the DCE survey to elicit the energy preferences of various stakeholders to determine the relative weightings is presented, with the results discussed in Section 3; and, finally, Section 4 comprises concluding remarks and recommendations for further work.

1.1. Multi-Criteria Decision Making

The MCA tool under development is based on MCDM methodology. Multi-criteria decision making (MCDM)—also known as multi-criteria decision analysis (MCDA) and increasingly performed using specialised software—is a methodology to support decision making when there are multiple criteria or objectives to consider in ranking or choosing between alternatives. Weighted-sum models are widely used for evaluating and aggregating these trade-offs between criteria. Other methods, that are not based on aggregative weight-based functions, include the “outranking” methods group (e.g., VIKOR, ELECTRE and PROMETHEE) and fuzzy methods, which are considered relatively more complex in comparison with the weighted-sum model [21,22].
The MCA-SLES tool employs a weighted-sum model. Consequently, understanding the relative importance of the assessment criteria for energy system transition, technology development and development in relation to energy policies and strategies is critical [6,7,8,9,11]. Capturing relevant stakeholder (i.e., energy providers, system and project developers and local and national government agencies) perspectives to determine this relative importance improves the reliability and relevancy of the MCA application, particularly when it comes to assessing location or sector-specific projects, benchmarking progress, highlighting the potential benefits and delivering information useful for gaining financial, political and public support [6,8,9,11,23].
Although there are several types of MCDM selection methods, no particular method has a distinct advantage or disadvantage over the other [24,25]. The ease of use and understanding, confidence in the results and reliability (consistency) are primary concerns that normally dictate the selected MCDM method [26].
No matter the approach, there are several generic steps involved in the MCDM process [21,27].The process, described in detail by Hansen and Devlin [22], is summarised here:
  • Structure the decision problem and identify output;
  • Specify the relevant criteria or indicators;
  • Measure the performance of alternatives;
  • Score the alternatives according to their impact on the criteria;
  • Weight the individual criteria;
  • Rank the alternatives based on scores and weights;
  • Apply the outputs to support decision making.
The research presented in this article is focused on the development of a standardised MCA or MCDM methodology, which will be tested and refined by application to real SLES in future work. In particular, this article describes how the scoring systems and criteria weights were identified and defined for application in steps 4 and 5 of the MCDM process. These steps are intrinsically linked and, in essence, determine the validity and reliability of the MCDM outputs. The definition of the problem and associated criteria for steps 1 and 2 of this research are described briefly in Section 1.2 and in greater detail in Francis et al. [12]. Step 3 is a practical step for which standardised methodologies will be further developed through application of the MCDM process to a real SLES in future work.

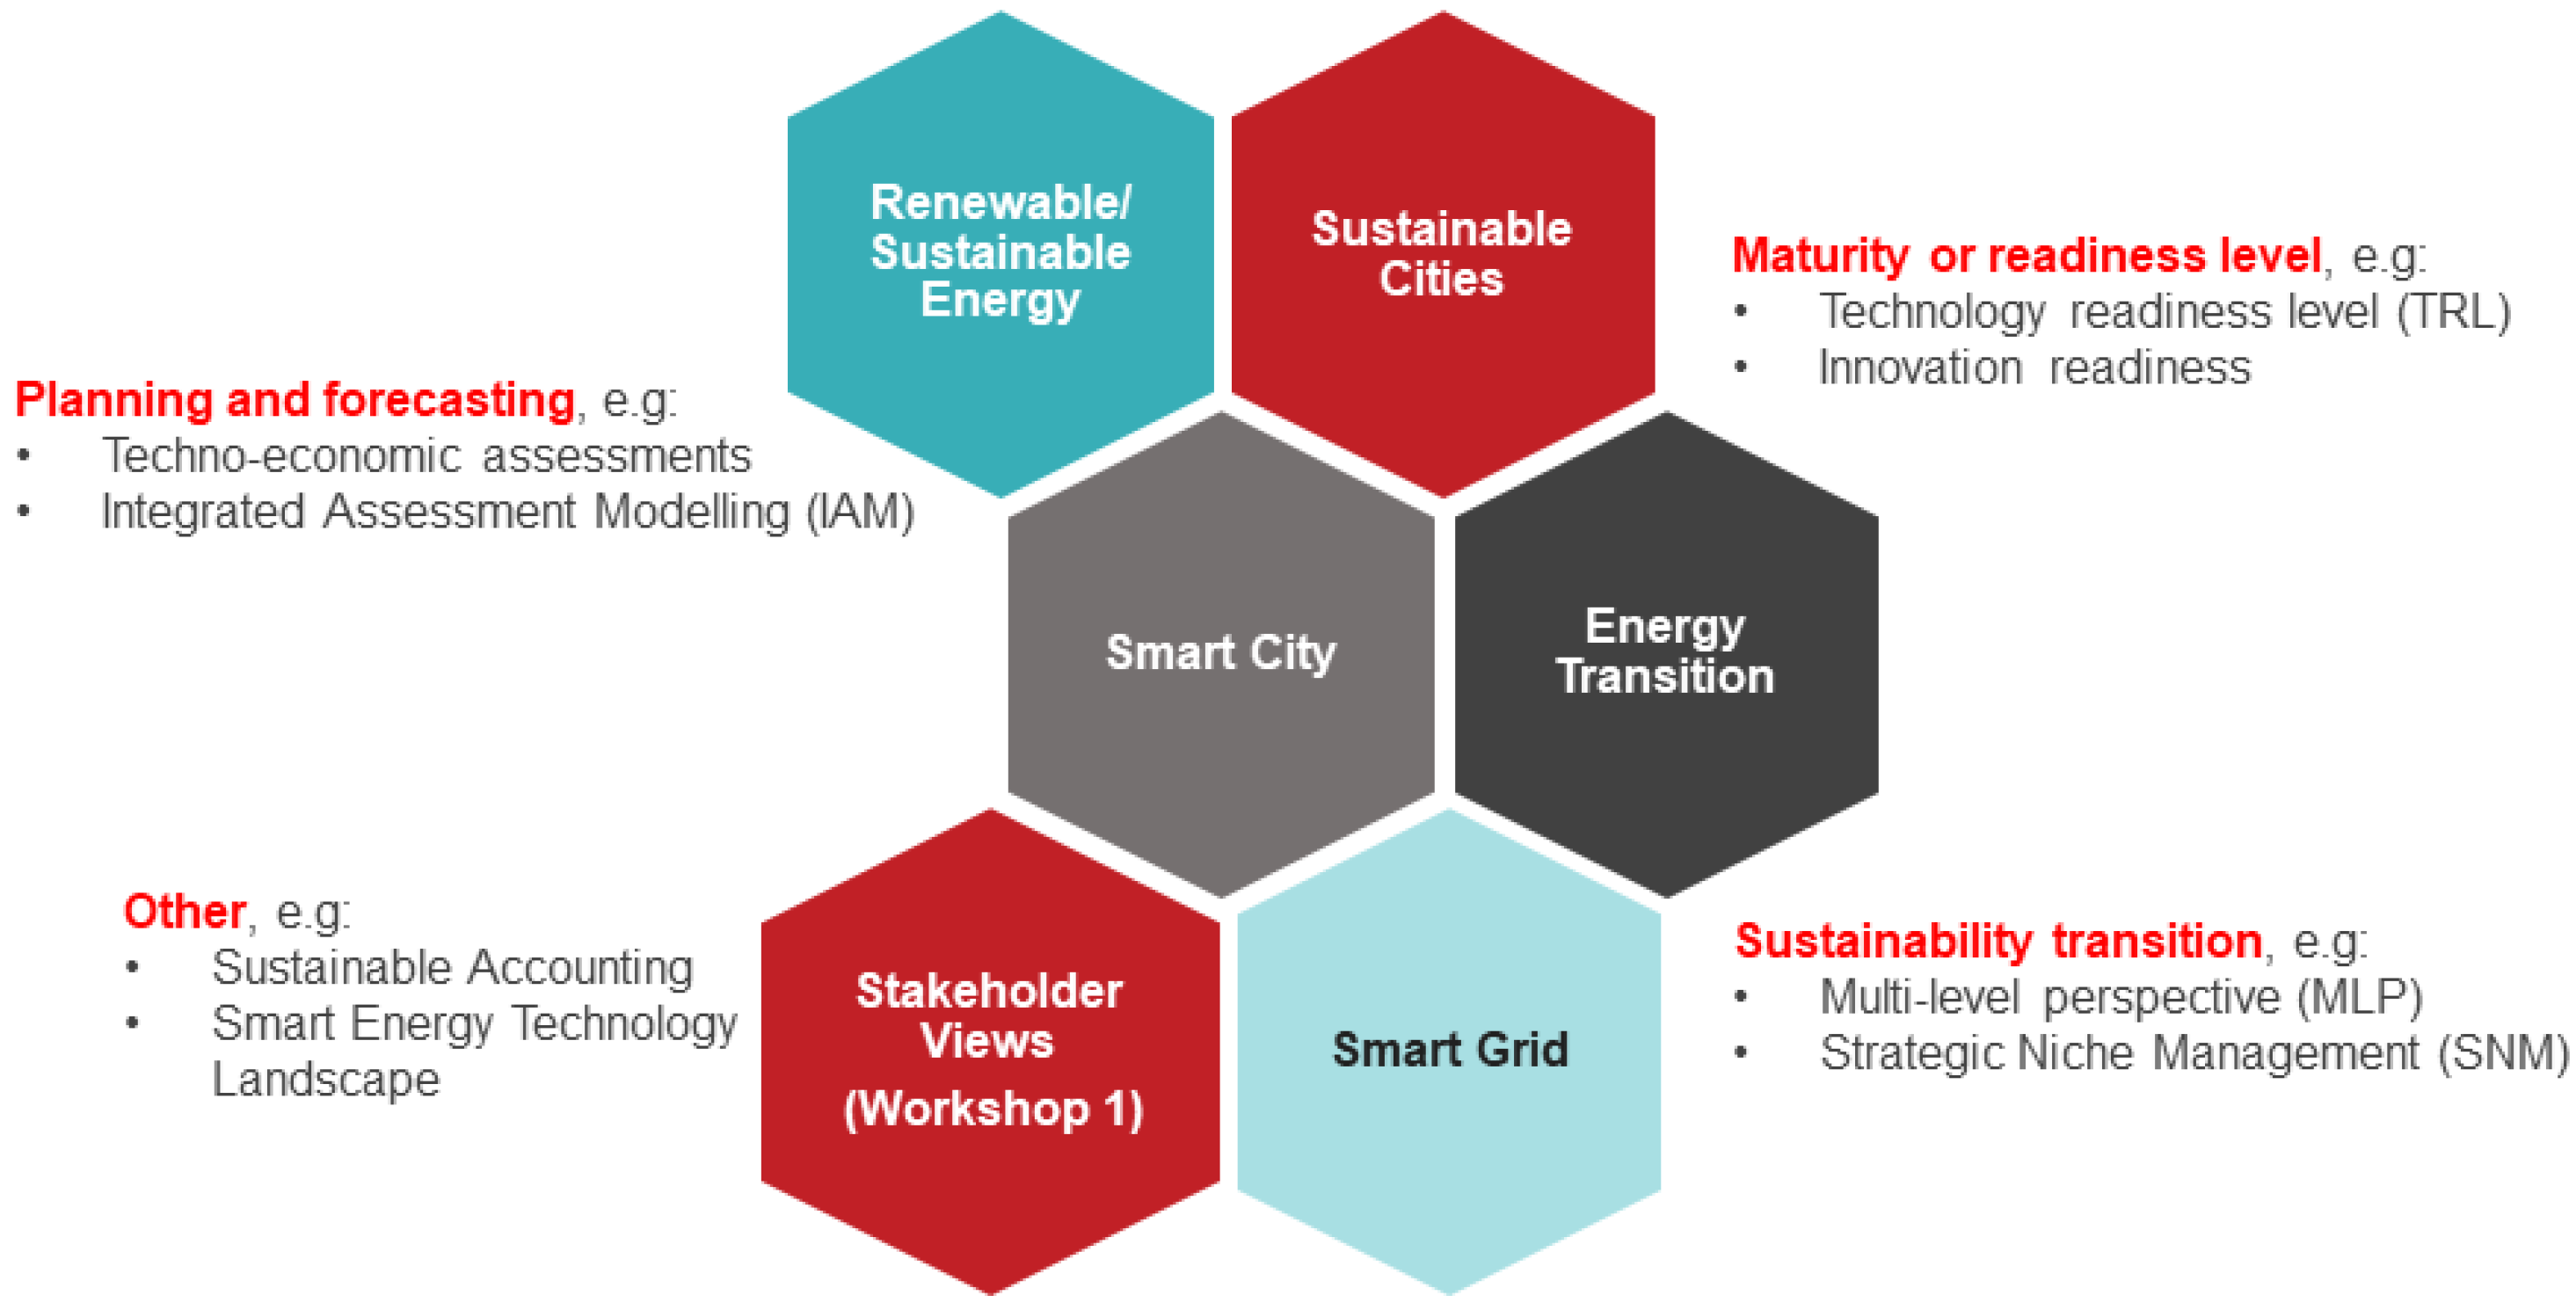
1.2. Criteria for a Smart Local Energy System

Smart Local Energy Systems can be considered a system of networked systems and are socio-technical by nature [28]. A complete assessment of the performance and benefits realised from SLES projects must, therefore, examine the socio-technical environment combined with an integrated assessment of the multiple factors driving the low-carbon transition.
As mentioned in Section 1, one of the preliminary steps in designing the MCA tool for SLES was to identify the main criteria for success (or failure) of a project and the corresponding metrics to measure them. This was achieved by a combination of exploring existing multi-criteria assessment protocols for related applications and gathering data via a series of stakeholder consultations. Even though there were overlapping evaluation methodologies, four main analytical themes were identified in the literature (summarised in Figure 1):
  • Maturity or Readiness Level—Considering the readiness or maturity of a product and/or service, including: Technology Readiness Level—a de facto standard assessment tool used in aerospace, defence and technology [29]; Technology Performance Level—used to assess wave energy converters; or the Energy Transition Index—used to assess and compare electricity flexibility markets and determine their preparedness for energy transformation [30].
  • Planning and Forecasting—Incorporating multiple criteria, such as the technical, economic, environmental and social influences of a product and/or service for planning or forecasting. For example, integrated assessment modelling—for evaluating sustainable energy systems MCDA, optimisation models and software tools) [31]—or the techno-ecological synergy (TES) framework—implemented to improve the sustainability of solar energy across four environments: land, food, water and built-up systems [32].
  • Sustainability Transition—Considering the sustainability transition of products, services, processes, people and overall networked systems in their environments across multiple objectives. These include socio-technical transition frameworks, namely a multi-level perspective—which considers the alignment of the incumbent regime, radical “niche innovations” and the “socio-technical landscape” [33]—and strategic niche management—which facilitates the creation of protected spaces for experimentation on: the co-evolution of technology, user practices and regulatory structures [34].
  • Other—Miscellaneous tools and indicators that have been used to measure the smartness and/or sustainability of homes, the electricity grid [35], cities [36,37,38,39] and integrated community energy systems (ICES) [40], as well as procedures involving sustainable accounting of six capitals—financial, manufactured, intellectual, social and relationship, human and natural—for assessing long-term viability of an organisation business model [41] and could be applied to the assessment of SLES.
From the analysis of the literature, augmented by data collected from stakeholders through two facilitated workshops, a number of common themes and indicators emerged which could be adapted to assess the performance of SLES. A total of 50 relevant performance indicators were identified and were clustered into 10 key themes (Appendix A). These themes and indicators have previously been applied in the assessment of sustainable energy, smart energy, smart grids, smart cities and renewable energy products, services or systems.
These themes and indicators were proposed as the basic structure of the taxonomy for the MCA (i.e., themes, sub-themes, success criteria and metrics). They were reviewed by participants in a third stakeholder workshop, and there was a consensus that they could be merged and simplified into six themes; for example, data security and data connectivity were merged into data management. These six themes, used to classify the performance, multiple benefits and consequences of SLES, are shown in Figure 2 and defined as follows:
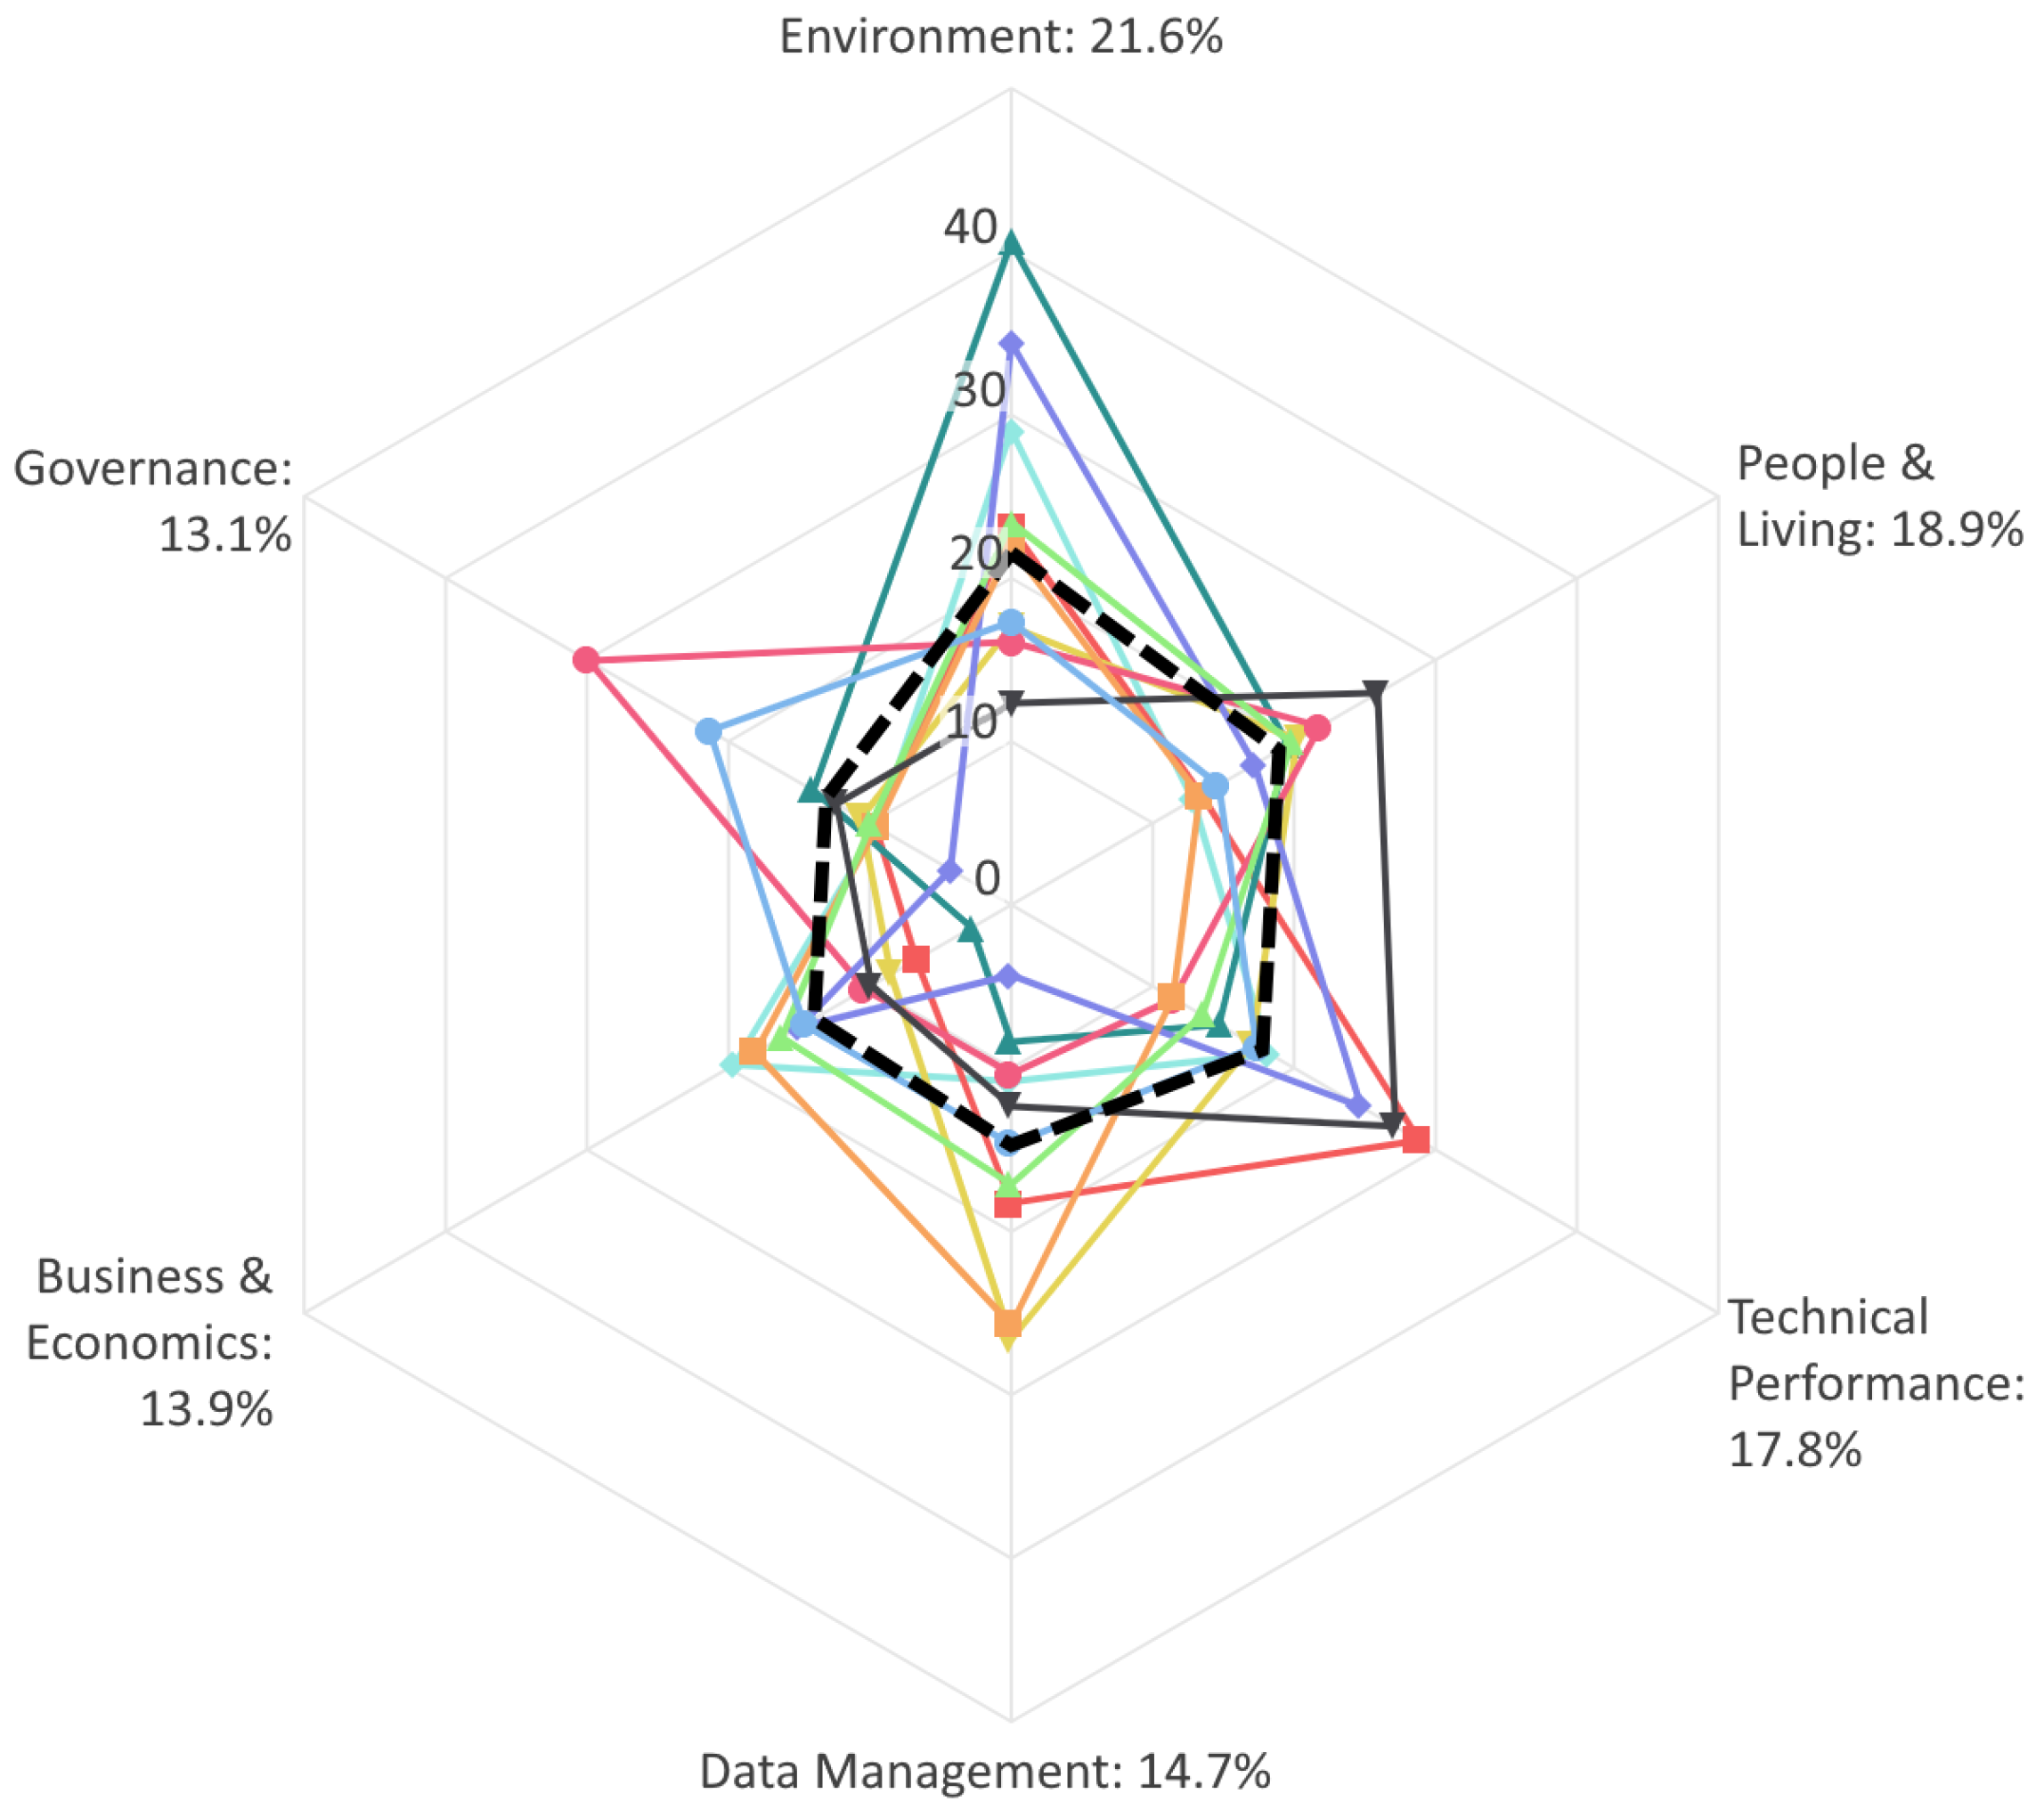
  • Data Management—Data gathering and security, provision of ICT and data infrastructure, including issues such as ICT accessibility and penetration
  • Technical Performance—Technical performance, including indicators such as resilience, efficiency and innovation. All vectors: heat, power and transport.
  • Business and Economics—Financial and economic performance, such as benefit-to-cost ratio, rate of return, financing, job creation and socio-economic impacts.
  • Governance—The political and regulatory environment, including alignment with existing regulations and their interface with policy.
  • People and Living—The impact on end users (education, ICT skills, engagement or acceptance) and their associated benefits on communities and social interactions (equity, housing conditions, culture or behaviour).
  • Environment—The environmental performance, namely the impacts on climate change, human health, resource availability and use of waste energy.
The list of key performance indicators within these themes identify both primary benefits (core outcomes) and support solutions critical to SLES delivery. The provision of functional support solutions such as Data Security and Governance should be monitored to identify whether key boundary conditions are met and ensure that unintended negative consequences or impacts are avoided.
The alignment of the key themes and indicators with the United Nations SDGs was also identified, so that the wider co-benefits can be tracked. Additional details of this work are outlined in [12].
The next section outlines the methodology used to score and weight the themes and indicators.

2. Methodology

A discrete choice experiment (DCE), conducted via online surveys, was designed to reveal the preferences of the various stakeholders in SLES with respect to the relative importance of the criteria (i.e., themes or indicators, as defined in Section 1.2). The resulting weights on the criteria (sometimes called “part-worth utilities” in the DCE literature [42]) can be used as a practical rating and scoring instrument for the MCA-SLES framework. An advantage of the DCE method used in this study is that it generates a set of weights for each individual participant, which enables cluster analysis—wherein any “clusters” (or segments) of participants with similar patterns of weights can be identified [42,43].

2.1. The PAPRIKA Method

The DCE was undertaken using 1000minds software (www.1000minds.com). This applies the PAPRIKA method—Potentially All Pairwise RanKings of all possible Alternatives [44]. The PAPRIKA method involves capturing preferences by asking stakeholders to repeatedly choose between two hypothetical alternatives defined on two criteria at a time (i.e., “partial profiles”). From these choices (or pairwise rankings), scores and weights are indirectly derived using quantitative methods [42,43]. In contrast, other types of DCE—also known as conjoint analysis—are regression-based [45].
In this analysis, the PAPRIKA pairwise-ranking questions involved a choice between two hypothetical SLESs, defined on two criteria at a time and involving a trade-off between them. These criteria describe a particular characteristic of the SLES, usually related to a success attribute or metric (indicator), e.g., quality of performance. For each criterion the performance is described by multiple levels on a defined scale; for example, the Governance of the SLES would be a criterion with possible performance levels ranging from poor to excellent. Details of the pairwise-ranking questions are given in Section 2.3, with comprehensive lists of the criteria and levels in the Supplementary Information.
The descriptions of the levels were carefully chosen to ensure that the surveys were not asking leading questions but were expressed in an open-ended way, such that participants provided answers based on their personal judgement. The 1000minds software includes features to check for the consistency and reliability of participants’ answers, enabling participants who answered the questions inconsistently or too quickly (so that they were deemed to be unreliable) to be identified and excluded.

2.2. Overview of Surveys

In this study, a total of seven surveys were prepared: a main survey (mandatory for all participants) to ascertain the relative weightings of the six themes (i.e., Technical Performance, Data Management, Governance, People and Living, Business and Economics and Environment) and a further six optional surveys to independently examine the relative weighting of the key performance indicators (KPIs) within these six themes in greater detail. Participants were invited to complete one or more of these latter theme-specific surveys according to their area of expertise. Including the mandatory main survey, participants were typically expected to complete two surveys out of the seven. It was anticipated that each survey would take around 8–10 min to complete; however, in some cases, it could take longer depending on the options selected by the participant and the extent of their deliberation and engagement.
Participants were asked to answer the questions with reference to their main role in the energy sector. They were also asked to declare what this stakeholder role was, selecting from: Government, Non-Governmental Organisation (NGO) or Non-Profit Organisation (NPO), Regulators, Community Energy, Large End User, Small End User, Product Manufacturer and Retailer, Finance Sector (banks and funding schemes), Network Operator and Advisors (cooperatives, consumer support), Research Organisation or University, Industry (generation, transmission, distribution and retail), Local Authority, Consultant and Other.
The surveys were opened for a month from 26 January to 8 March 2021 and distributed to approximately 1500 individuals via emails and mailshots to various member list groups in academia and industry. The surveys were also promoted through social media platforms such as Twitter, LinkedIn and Facebook. A small incentive of ten £50 Amazon vouchers randomly given away in a prize draw was offered to encourage individuals to participate in the surveys. The next section describes the main and additional surveys.

2.3. Main Survey

The main survey was designed to determine the relative importance of six KPI thematic areas that will be used to assess the performance and benefits of SLES. The participants were presented with a pair of hypothetical SLES alternatives that were the same, except for a trade-off in the different levels of two criteria, and asked to indicate which SLES they preferred (see Figure 3). The main survey had six criteria, which correspond to the six KPI themes:
  • Technical Performance;
  • Data Management;
  • Governance;
  • People and Living;
  • Business and Economics;
  • Environment.
Performance on each criterion is measured using five levels:
  • Poor;
  • Fair;
  • Good;
  • Very good;
  • Excellent.
The 1000minds software presents the survey as a series of flashcards contrasting pairs of hypothetical SLESs in a randomised order, and participants must indicate which one they prefer. For a survey such as this, with six criteria, each with five levels, participants would typically be presented with 27 choices. A large majority of the participants in this study (90%) completed this survey in 4–12 min, with the remainder taking 20–40+ min.
PAPRIKA exhibits “path dependency” because of its adaptive nature: the method chooses questions for the participant based on all preceding answers [42]. Thus, the PAPRIKA method is a type of adaptive DCE (or adaptive conjoint analysis) [44,45]. One example of this is in the application of the logical property of "transitivity" to minimise the number of questions each participant is asked [42,43]. Each time a person ranks a pair of SLES, the PAPRIKA method immediately identifies and eliminates all other pairs of hypothetical SLES for which the ranking can now be inferred; for example, if a person ranks System 1 ahead of System 2, and also 2 ahead of System 3, then, logically, transitivity shows that 1 must be ranked ahead of 3. This third pair of systems is thus eliminated from the questioning process. Through this process, a relatively small number of questions (e.g., 27) can be asked to rank all hypothetical systems differentiated on two criteria at a time, either explicitly or implicitly (through transitivity).
The participant’s choices from the pairwise-ranking process are used to calculate their assessment of the relative importance weights (or part-worth utilities) of the criteria. This is achieved through mathematical methods based on linear programming, as described in Hansen and Ombler [44]. The tool also uses interpolation between levels to estimate weights, thereby further reducing the number of pairwise comparisons required.
To test the consistency (reliability) of the answers provided by the participants, two questions were repeated at the end of the DCE to check their overall "quality". In addition, participants who answered any question more quickly than 2 s were excluded (because they were deemed to be unreliable).

2.4. Thematic Surveys

A survey for each thematic area was also presented using the 1000minds software, applying the same approach described in Section 2.3 but concentrating on detailed indicators, or metrics. Participants were asked to complete one or more of these additional surveys. As before, participants were presented with a series of simple pairwise comparisons showing hypothetical alternatives of SLES that were differentiated by a trade-off in their criteria.
The criteria for these thematic surveys mostly corresponded to the detailed key performance indicators (success criteria, sub-theme or metrics) developed from an in-depth literature review [12] and data collected at the London workshop held in February 2020 [3]; described in Section 1.1. Each survey had six criteria (except for the People and Living survey, which had seven) and five levels.
Participants were asked to think about the performance of the SLES in respect of a specific KPI theme, for instance the governance and organisation of an SLES. They were then encouraged to select the three or four criteria within this theme that they considered to be the most important, in order to focus their time on ranking the indicators they considered the most important. This choice was not restricted, so it was possible for the participants to select as many as they desired; however, this would make the survey longer to complete. Table 1 shows the available criteria for each thematic survey, and the corresponding sub-criteria and levels presented to participants are given in the Supplementary Material.
The final number of pairwise-ranking questions in the DCE depended on the total number of criteria selected by the participant. Details of the average number of questions asked for each themed survey are also shown in Table 1.
In the resulting pairwise comparisons, most of the criteria used a five-point scale of poor, fair, good, very good and excellent; however, this scale was not found to be appropriate for all criteria presented. The level descriptions were carefully selected to match the context of the questions asked, avoid leading questions and to ensure that the participants’ responses were based on their personal judgement. This resulted in some specific alternative scales being used, as follows:
  • Greenhouse Gas Emissions or Fuel Poverty:
    Increased;
    Remains the same;
    Decreased;
    Significantly decreased;
    Eliminated (for Greenhouse Gas Emissions, this was termed “Achieves net zero (eliminated)”).
  • Revenue from Decarbonisation Activities:
    None;
    £;
    ££;
    £££;
    ££££.
  • Local Renewable Energy Generation:
    None;
    A little;
    Moderate;
    Quite a lot;
    Extensive.
  • Competitive Energy Pricing (note the four-point scale):
    More expensive energy;
    Parity with today’s prices;
    Slightly cheaper energy;
    Significantly cheaper energy.
For a full list of the sub-criteria and scales used in all of the surveys, please see the Supplementary Material.

3. Results and Discussion

The DCE surveys were published and open for response from 26 January to 8 March 2021. All respondents were asked to complete the Main Survey plus at least one Thematic Survey.
Of the 387 people who responded to the survey request, 119 started to answer the main survey but did not complete it; 34 were excluded because they answered too quickly (less than 2 s per question); and the remaining 234 responses (60%) were used in the DCE analysis. Of these 234 respondents, approximately 47% were from research organisations and 16% represented small end users (e.g., householders and small business) and NGOs or NPOs. The energy industry and local authorities were each represented by 6–7% of the participants, as summarised in Table 2. Respondents were also asked about their relationship to the PFER programme and EnergyREV: 16% were affiliated to PFER demonstration and design projects, 29% were involved with other community energy projects and 15% were members of the EnergyREV Research Consortium.

3.1. Main Survey

The purpose of the main DCE survey was to identify the relative importance of the six KPI themes for SLES, and the resulting mean weights are summarised in Figure 4 alongside a sample of 10 results from individual participants. It can be seen that the individual results varied significantly in terms of the relative importance of different themes, but on average, Environment was considered the most important criterion, with a mean weight of 21.6%. This was followed by People and Living at 18.9%, Technical Performance at 17.8%, Data Management at 14.7%, Business and Economics at 13.9% and Governance at 13.1%. The standard deviation for each criterion ranged from 5% to 7%.
Overall, this DCE found that the benefits for people, their living conditions and environment were considered to be far more important by the stakeholders surveyed than the business and economic value. With regards to the environmental impacts, these findings compare well with the conclusions drawn by the MCA of renewable energy implementation in Lithuania [6], and the DCE carried out by Hottenroth et al. [16], which both concluded that environmental factors were key. They disagree, however, with Heo et al. [5], who found environmental factors to be one of the least important sets of criteria for the South Korean energy transition policy and development. With regards to the social factors (People and Living), the findings of this DCE contrast particularly with the MCA carried out by Štreimikienė et al. [6], where socio-ethics were found to be the least important criteria group. It is also surprising that business and economic factors were ranked so low by this DCE, as these were found to be of high importance in Heo et al. [5], Štreimikienė et al. [6], Hottenroth et al. [16]. Additional work is required to understand the importance of economics and market criteria in ensuring the economic feasibility of proposed energy system developments.
The variation in importance between the different KPI themes was found to be relatively small. This emphasises that it is vital for an assessment tool for energy system development to be holistic and encompass multiple factors across major themes in our modern society. In order to ensure a comprehensive and robust assessment, this should include people, their living conditions, the local-to-global market economy, technological and digital development and usability, governmental policies and strategy and the environmental impacts on local ecosystems.

3.2. Thematic Surveys

In addition to the main survey, participants were asked to complete at least one other DCE survey that focused on a specific KPI theme, in order to identify the relative importance and weights of each indicator within that theme. As these surveys were optional, fewer participants completed each of them than the main survey. The total number of completions (that were not excluded due to taking less than 2 s to answer a pairwise ranking question) is given alongside the results in Table 3. The full breakdown of participant completions and exclusions is given in the Supplementary Material.
It can be seen that the surveys on Environment and People and Living had the most responses, while Data Management had the fewest. It is also important to note that, as described in Section 2.4, at the beginning of each thematic DCE survey the participants were asked to select three or four criteria that they thought were most important (although they were were free to choose more). This was a means of reducing the time required to complete the survey, such that this ranged from 2 min to as much as 40+ min. The full details of the participant selections are included in the Supplementary Material.
In general, the criteria selected by the fewest participants were ranked lowest in the results. An interesting example of this is Noise Levels in the Environment theme—only 7% of participants selected Noise Levels as of key importance, which may have led to the low weighting score of 1.5%. This may be an anomaly, due to the concept that people are not used to thinking about noise in an energy project, or that there is a perception that existing noise control regulations are sufficient. Again, further work is recommended involving semi-structured interviews to test and confirm the most appropriate weightings for the Data Management themes, alongside investigation and consultation with appropriate experts to confirm whether the resulting weights for indicators with very low response rates are appropriate. This will provide additional evidence for stakeholder and expert opinions regarding which assessment themes and criteria are important to understand the benefits and barriers of SLES project development. Subsequently, case study analyses will be carried out using the EnergyREV MCA-SLES tool to confirm the effectiveness of these weights.
Table 4 shows that the six KPI themes selected in this study are broadly aligned with previous research in this area. Similarly, the number of criteria within these themes is broadly aligned to, or exceeds those in similar work. These themes and criteria represent key social prosperity, environmental, economic, and technological factors crucial for a successful SLES project.

4. Conclusions and Policy Implications

The work presented in this article provided insight into the priority weighting for criteria that will be used in a multi-criteria assessment tool being developed for Smart Local Energy Systems. This EnergyREV MCA-SLES tool is designed to examine the performance and benefits of SLES projects across a comprehensive set of KPIs (or criteria) grouped into six thematic areas (Technical Performance, Data Management, Governance, People and Living, Business and Economics and Environment). These KPIs and themes were identified through an extensive literature review and refined through stakeholder consultation in previous research. A discrete choice experiment was carried out to identify stakeholder views on the weightings for these KPIs and themes.
The DCE consisted of a main survey that focused on comparing the six KPI themes and an additional six optional surveys to independently assess the detailed indicators within each theme. These surveys asked each stakeholder to answer a series of simple pairwise questions comparing alternative hypothetical SLES in order to indirectly reveal their preferences. The results provide a set of weights for the six themes which will be used to develop an overall score in the EnergyREV MCA-SLES tool. It was revealed that the themes regarding environmental impact, people and living conditions were generally considered the most important. In contrast, data management was considered the least important.
There does, however, remain some uncertainty for the KPIs that received very few responses—either because the survey had too few participants or the KPI itself was not selected by the participant as a key criterion. This includes the Data Management theme, where only 24 respondents completed the survey, or Noise Levels within the Environment theme, which was only selected by four participants. Additional work involving semi-structured interviews with selected field experts is recommended to confirm and test the validity of the results retrieved from this DCE before final application in the EnergyREV MCA-SLES tool.
Finally, an independent standardised assessment tool such as the EnergyREV MCA-SLES tool will help SLES project developers by providing a route-map and checklist to support replication which may be utilised to enhance investors’ confidence. In the long term, the tool can also assist policy makers to identify areas where policy change is needed to enable progress towards a sustainable energy transition.

Supplementary Materials

The following supporting information can be downloaded at: https://www.mdpi.com/article/10.3390/en15249305/s1. Full details of the anonymised data and results from the Discrete Choice Experiments, including a full list of the sub-criteria and scales used in all of the surveys.

Author Contributions

Conceptualisation, C.F., R.C.T. and D.M.I.; formal analysis, C.F.; funding acquisition, D.M.I.; investigation, C.F.; methodology, C.F., R.C.T., D.M.I. and P.H.; software, C.F. and P.H.; supervision, D.M.I.; visualisation, R.C.T. and D.M.I.; writing—original draft, C.F.; writing—review and editing, R.C.T., B.G., D.M.I. and P.H. All authors have read and agreed to the published version of the manuscript.

Funding

This research forms part of the interdisciplinary work conducted by the EnergyREV Research Consortium and is funded by UK Research and Innovation through the Prospering from the Energy Revolution programme of the UK Industrial Strategy Challenge Fund (Grant number EP/S031863/1).

Institutional Review Board Statement

The study was conducted according to the guidelines of the UK Research Integrity Office’s Code of Practice for Research and approved by the Ethics Committee of the School of Engineering, University of Edinburgh (15 February 2022).

Informed Consent Statement

Informed consent was obtained from all subjects involved in the study.

Data Availability Statement

Detailed data generated during this study are provided in the Supplementary Material.

Conflicts of Interest

The authors declare no conflict of interest. The funders had no role in the design of the study; in the collection, analyses, or interpretation of data; in the writing of the manuscript, or in the decision to publish the results.

Appendix A. Taxonomy for Smart Local Energy System Assessment [12]

Table A1. Taxonomy for Smart Local Energy System Assessment.
No.ThemeSub-ThemePrevious Application
1Data SecuritySecuritySmart-grid [35], Smart city [39]
PrivacySmart-grid [35]
TrustSmart-grid [35], Stakeholder consultation (1) [47]
2Data ConnectivityTechnology EnablersEnergy Transition [30]
ICT InfrastructureSmart city [38,39], Smart-grid [35]
ICT ManagementSmart city [38,39]
ICT AccessibilitySmart city [38,39]
3TechnicalRenewable fractionRE [48], RE-Hybrid [49]
ReliabilityStakeholder consultation (1) [47], Solar-energy [32], Smart energy [50], Smart-grid [35], Sustainable energy [51], Wave & tidal energy [52]
ResilienceStakeholder consultation (1) [47], Solar-energy [32], Smart-grid [35], Sustainable micro-grid [31]
FlexibilityStakeholder consultation (1) [47], Smart-grid [35]
ScalabilitySmart-grid [35], Sustainable micro-grid [31]
EfficiencyEnergy [53], Stakeholder consultation (1) [47], Energy storage [54], Smart city [39], Smart energy [50], Smart-grid [35], Solar-energy [32]
MaturityEnergy storage [54], Sustainable micro-grid [31]
LifespanEnergy [53], Sustainable micro-grid [31]
Grid accessibilityEnergy Transition [30]
Innovation adaptationEnergy Transition [30], Smart city [39], Smart-grid [35], Sustainable energy [51]
4TransportManagementSmart city [38,39]
EV InfrastructureEnergy Transition [30], Smart city [38,39]
5EconomicsCBRRE-Hybrid [49]
CostEnergy [53], RE-Hybrid [49], Smart energy [50], Sustainable micro-grid [31], Waste management [55], Wave & tidal energy [52],
IRRRE [48], RE-Hybrid [49]
LCOERE [48], RE-Hybrid [49], Energy [53]
Payback periodRE-Hybrid [49]
6Business/FinanceRegulationEnergy Transition [30]
Compensation structuresEnergy Transition [30]
Competitive costStakeholder consultation (1) [47]
InvestableStakeholder consultation (1) [47], Waste management [55], Wave & tidal energy [52]
EmploymentRE-Hybrid [56], Smart city [39], Sustainable energy [51], Sustainable micro-grid [31]
7GovernanceTransparencyEnergy Transition [30], Smart-grid [35]
Socioeconomic impactEnergy Transition [30]
Integrated managementSmart city [38]
Regulatory alignmentEnergy Transition [30], Smart energy [50], Sustainable energy [51]
8PeopleEducation & GenderSmart city [38,39], Smart-grid [35], Sustainable micro-grid [31], Waste management [55]
ICT SkillsStakeholder consultation (1) [47], Smart energy [50]
ParticipationStakeholder consultation (1) [47], Smart city [38,39], Sustainable energy [51]
AcceptanceWave & tidal energy [52], Energy storage [54], Smart energy [50], Sustainable micro-grid [51]
User friendlinessStakeholder consultation (1) [47], Smart energy [50], Smart-grid [50]
InclusionSmart-grid [35], Waste management [55], Smart city [39], Sustainable energy [51]
Consumer protectionSmart energy [50], Smart-grid [35]
9LivingHousingSmart city [39]
EquityStakeholder consultation (1) [47], Solar-energy [32], Smart city [38], Smart-grid [35], Sustainable energy [51]
CultureSmart city [38,39], Smart-grid [35], Energy storage [54]
LivelihoodSmart-grid [35]
ConvenienceSmart city [39]
10EnvironmentDecarbonisation
Ecosystem
Human health
Resources
Other
Stakeholder consultation (1) [47], RE [48], RE-Hybrid [49], Smart city [38,39], Smart energy [50], Smart-grid [35], Solar-energy [32], Sustainable energy [51], Sustainable micro-grid [31], Waste management [55], Wave & tidal energy [52], LCIA RECiPe model.

References

  1. Rae, C.; Kerr, S.; Maroto-Valer, M.M. Upscaling smart local energy systems: A review of technical barriers. Renew. Sustain. Energy Rev. 2020, 131, 110020. [Google Scholar] [CrossRef]
  2. Ford, R.; Maidment, C.; Vigurs, C.; Fell, M.J.; Morris, M. Smart local energy systems (SLES): A framework for exploring transition, context, and impacts. Technol. Forecast. Soc. Chang. 2021, 166, 120612. [Google Scholar] [CrossRef]
  3. Francis, C.; Sierra Costa, A.; Thomson, R.C.; Ingram, D.M. EnergyREV Workshop Report SLES Benefits—Optimizing Performance Indicators; EnergyREV Internal Report: Unpublished; University of Edinburgh: Edinburgh, UK, 2020. [Google Scholar]
  4. Desa, U. Transforming Our World: The 2030 Agenda for Sustainable Development. 2016. Available online: https://documents-dds-ny.un.org/doc/UNDOC/GEN/N15/291/89/PDF/N1529189.pdf (accessed on 15 May 2022).
  5. Heo, E.; Kim, J.; Boo, K.J. Analysis of the assessment factors for renewable energy dissemination program evaluation using fuzzy AHP. Renew. Sustain. Energy Rev. 2010, 14, 2214–2220. [Google Scholar] [CrossRef]
  6. Štreimikienė, D.; Šliogerienė, J.; Turskis, Z. Multi-criteria analysis of electricity generation technologies in Lithuania. Renew. Energy 2016, 85, 148–156. [Google Scholar] [CrossRef]
  7. Resniova, E.; Ponomarenko, T. Sustainable Development of the Energy Sector in a Country Deficient in Mineral Resources: The Case of the Republic of Moldova. Sustainability 2021, 13, 3261. [Google Scholar] [CrossRef]
  8. Barney, A.; Petersen, U.R.; Polatidis, H. Energy scenarios for the Faroe Islands: A MCDA methodology including local social perspectives. Sustain. Future 2022, 4, 100092. [Google Scholar] [CrossRef]
  9. Vassoney, E.; Mammoliti Mochet, A.; Comoglio, C. Use of multicriteria analysis (MCA) for sustainable hydropower planning and management. J. Environ. Manag. 2017, 196, 48–55. [Google Scholar] [CrossRef]
  10. Bączkiewicz, A.; Kizielewicz, B. Towards Sustainable Energy Consumption Evaluation in Europe for Industrial Sector Based on MCDA Methods. Procedia Comput. Sci. 2021, 192, 1334–1346. [Google Scholar] [CrossRef]
  11. Sahabuddin, M.; Khan, I. Multi-criteria decision analysis methods for energy sector’s sustainability assessment: Robustness analysis through criteria weight change. Sustain. Energy Technol. Assess. 2021, 47, 101380. [Google Scholar] [CrossRef]
  12. Francis, C.; Sierra Costa, A.; Thomson, R.C.; Ingram, D.M. Developing the framework for multi-criteria assessment of smart local energy systems. In Proceedings of the Energy Evaluation Europe 2021 Conference, London, UK, 29 June–1 July 2020; p. 13. [Google Scholar]
  13. Francis, C.; Sierra Costa, A.; Thomson, R.C.; Ingram, D.M. Developing a Multi-Criteria Assessment Framework for Smart Local Energy Systems; EnergyREV Outputs; University of Strathclyde Publishing: Glasgow, UK, 2020; ISBN 978-1-909522-63-3. [Google Scholar]
  14. Naegler, T.; Becker, L.; Buchgeister, J.; Hauser, W.; Hottenroth, H.; Junne, T.; Lehr, U.; Scheel, O.; Schmidt-Scheele, R.; Simon, S.; et al. Integrated Multidimensional Sustainability Assessment of Energy System Transformation Pathways. Sustainability 2021, 13, 5217. [Google Scholar] [CrossRef]
  15. Schmidt-Scheele, R.; Hauser, W.; Scheel, O.; Minn, F.; Becker, L.; Buchgeister, J.; Hottenroth, H.; Junne, T.; Lehr, U.; Naegler, T.; et al. Sustainability assessments of energy scenarios: Citizens’ preferences for and assessments of sustainability indicators. Energy Sustain. Soc. 2022, 12, 41. [Google Scholar] [CrossRef]
  16. Hottenroth, H.; Sutardhio, C.; Weidlich, A.; Tietze, I.; Simon, S.; Hauser, W.; Naegler, T.; Becker, L.; Buchgeister, J.; Junne, T.; et al. Beyond climate change. Multi-attribute decision making for a sustainability assessment of energy system transformation pathways. Renew. Sustain. Energy Rev. 2022, 156, 111996. [Google Scholar] [CrossRef]
  17. Schleich, J.; Tu, G.; Faure, C.; Guetlein, M.C. Would you prefer to rent rather than own your new heating system? Insights from a discrete choice experiment among owner-occupiers in the UK. Energy Policy 2021, 158, 112523. [Google Scholar] [CrossRef]
  18. Chen, Q. District or distributed space heating in rural residential sector? Empirical evidence from a discrete choice experiment in South China. Energy Policy 2021, 148, 111937. [Google Scholar] [CrossRef]
  19. Azarova, V.; Cohen, J.; Friedl, C.; Reichl, J. Designing local renewable energy communities to increase social acceptance: Evidence from a choice experiment in Austria, Germany, Italy, and Switzerland. Energy Policy 2019, 132, 1176–1183. [Google Scholar] [CrossRef] [Green Version]
  20. Van Oijstaeijen, W.; Van Passel, S.; Back, P.; Cools, J. The politics of green infrastructure: A discrete choice experiment with Flemish local decision-makers. Ecol. Econ. 2022, 199, 107493. [Google Scholar] [CrossRef]
  21. Ananda, J.; Herath, G. A critical review of multi-criteria decision making methods with special reference to forest management and planning. Ecol. Econ. 2009, 68, 2535–2548. [Google Scholar] [CrossRef]
  22. Hansen, P.; Devlin, N. Multi-criteria decision analysis (MCDA) in healthcare decision-making. In Oxford Research Encyclopedia of Economics and Finance; Oxford University Press: Oxford, UK, 2019; ISBN 9780190625979. [Google Scholar] [CrossRef]
  23. Daim, T.U.; Li, X.; Kim, J.; Simms, S. Evaluation of energy storage technologies for integration with renewable electricity: Quantifying expert opinions. Environ. Innov. Soc. Transit. 2012, 3, 29–49. [Google Scholar] [CrossRef]
  24. Hajkowicz, S.; Higgins, A. A comparison of multiple criteria analysis techniques for water resource management. Eur. J. Oper. Res. 2008, 184, 255–265. [Google Scholar] [CrossRef]
  25. Yang, W.; Zhang, J. Assessing the performance of gray and green strategies for sustainable urban drainage system development: A multi-criteria decision-making analysis. J. Clean. Prod. 2021, 293, 126191. [Google Scholar] [CrossRef]
  26. Zanakis, S.H.; Solomon, A.; Wishart, N.; Dublish, S. Multi-attribute decision making: A simulation comparison of select methods. Eur. J. Oper. Res. 1998, 107, 507–529. [Google Scholar] [CrossRef]
  27. Yi, L.; Li, T.; Zhang, T. Optimal investment selection of regional integrated energy system under multiple strategic objectives portfolio. Energy 2021, 218, 119409. [Google Scholar] [CrossRef]
  28. Ford, R.; Maidment, C.; Fell, M.; Vigurs, C.; Morris, M. A Framework for Understanding and Conceptualising Smart Local Energy Systems; EnergyREV; University of Strathclyde Publishing: Strathclyde, UK, 2019. [Google Scholar]
  29. Mankins, J.C. Technology Readiness Level—A White Paper; NASA, Advanced Concepts Office, Office of Space Access and Technology: Washington, DC, USA, 1995; Available online: https://www.researchgate.net/publication/247705707_Technology_Readiness_Level_-_A_White_Paper (accessed on 3 February 2022).
  30. Hull, R. Energy Transition Readiness Index; Technical Report; Association for Renewable Energy and Clean Technology (REA): London, UK, 2019. [Google Scholar]
  31. Kumar, A.; Singh, A.R.; Deng, Y.; He, X.; Kumar, P.; Bansal, R.C. Integrated assessment of a sustainable microgrid for a remote village in hilly region. Energy Convers. Manag. 2019, 180, 442–472. [Google Scholar] [CrossRef]
  32. Hernandez, R.R.; Armstrong, A.; Burney, J.; Ryan, G.; Moore-O’Leary, K.; Diédhiou, I.; Grodsky, S.M.; Saul-Gershenz, L.; Davis, R.; Macknick, J.; et al. Techno–ecological synergies of solar energy for global sustainability. Nat. Sustain. 2019, 2, 560–568. [Google Scholar] [CrossRef] [Green Version]
  33. Geels, F.W.; Sovacool, B.K.; Schwanen, T.; Sorrell, S. The Socio-technical dynamics of low-carbon transitions. Joule 2017, 1, 463–479. [Google Scholar] [CrossRef] [Green Version]
  34. Schot, J.; Geels, F.W. Strategic niche management and sustainable innovation journeys: Theory, findings, research agenda, and policy. Technol. Anal. Strategy Manag. 2008, 20, 537–554. [Google Scholar] [CrossRef]
  35. Hargreaves, N.; Chilvers, J.; Hargreaves, T. “What’s the Meaning of ’Smart’? A Study of Smart Grids”: Sociotechnical Report; School of Environmental Sciences, University of East Anglia: Norwich, UK, 2015. [Google Scholar]
  36. Huovila, A.; Bosch, P.; Airaksinen, M. Comparative analysis of standardized indicators for Smart sustainable cities: What indicators and standards to use and when? Cities 2019, 89, 141–153. [Google Scholar] [CrossRef]
  37. Marchetti, D.; Oliveira, R.; Figueira, A.R. Are global north smart city models capable to assess Latin American cities? A model and indicators for a new context. Cities 2019, 92, 197–207. [Google Scholar] [CrossRef]
  38. Sharifi, A. A critical review of selected smart city assessment tools and indicator sets. J. Clean. Prod. 2019, 233, 1269–1283. [Google Scholar] [CrossRef]
  39. Sharifi, A. A typology of smart city assessment tools and indicator sets. Sustain. Cities Soc. 2019, 53, 101936. [Google Scholar] [CrossRef]
  40. Koirala, B.P.; Koliou, E.; Friege, J.; Hakvoort, R.A.; Herder, P.M. Energetic communities for community energy: A review of key issues and trends shaping integrated community energy systems. Renew. Sustain. Energy Rev. 2016, 56, 722–744. [Google Scholar] [CrossRef] [Green Version]
  41. Adams, C.; Coulson, A.B.; Emmelkamp, T.; Greveling, R.; Klüth, G.; Nugent, M. CAPITALS Background Paper for <IR>; Technical Report; International Integrated Reporting Council: London, UK, 2013. [Google Scholar]
  42. Whiting, R.H.; Hansen, P.; Sen, A. A tool for measuring SMEs’ reputation, engagement and goodwill: A New Zealand exploratory study. J. Intellect. Cap. 2017, 18, 170–188. [Google Scholar] [CrossRef]
  43. Deyshappriya, N.P.R.; Feeny, S. Weighting the Dimensions of the Multidimensional Poverty Index: Findings from Sri Lanka. Soc. Indic. Res. 2021, 156, 1–19. [Google Scholar] [CrossRef]
  44. Hansen, P.; Ombler, F. A new method for scoring additive multi-attribute value models using pairwise rankings of alternatives. J. Multi-Criteria Decis. Anal. 2008, 15, 87–107. [Google Scholar] [CrossRef]
  45. Green, P.E.; Krieger, A.M.; Wind, Y. Thirty years of conjoint analysis: Reflections and prospects. INFORMS J. Appl. Anal. 2001, 31, S56–S73. [Google Scholar] [CrossRef] [Green Version]
  46. Kaya, T.; Kahraman, C. Multicriteria renewable energy planning using an integrated fuzzy VIKOR & AHP methodology: The case of Istanbul. Energy 2010, 35, 2517–2527. [Google Scholar] [CrossRef]
  47. Francis, C.; Ingram, D.M.; Thomson, R.C. Defining Success of Smart Local Energy System (SLES); Energyrev stakeholder consultation workshop (1) technical report; University of Edinburgh: Edinburgh, UK, 2019. [Google Scholar]
  48. Liu, G.; Li, M.; Zhou, B.; Chen, Y.; Liao, S. General indicator for techno-economic assessment of renewable energy resources. Energy Convers. Manag. 2018, 156, 416–426. [Google Scholar] [CrossRef]
  49. Ma, W.; Xue, X.; Liu, G.; Zhou, R. Techno-economic evaluation of a community-based hybrid renewable energy system considering site-specific nature. Energy Convers. Manag. 2018, 171, 1737–1748. [Google Scholar] [CrossRef]
  50. Snodin, H. Smart Energy—Technology Landscaping, Scotland’s Energy Efficiency Programme; ClimateXChange: Edinburgh, UK, 2017; Available online: https://www.climatexchange.org.uk/media/5500/technology-landscaping-report-smart-energy.pdf (accessed on 15 May 2022).
  51. Gallego Carrera, D.; Mack, A. Sustainability assessment of energy technologies via social indicators: Results of a survey among European energy experts. Energy Policy 2010, 38, 1030–1039. [Google Scholar] [CrossRef]
  52. Bull, D.; Costello, R.; Babarit, A.; Nielsen, K.; Kennedy, B.; Bittencourt, C.; Roberts, J.; Weber, J. Scoring the Technology Performance Level (TPL) Assessment; Technical Report SAND2017-4560C; Sandia National Laboratories: Albuquerque, NM, USA, 2017. [Google Scholar]
  53. Krey, V.; Guo, F.; Kolp, P.; Zhou, W.; Schaeffer, R.; Awasthy, A.; Bertram, C.; de Boer, H.S.; Fragkos, P.; Fujimori, S.; et al. Looking under the hood: A comparison of techno-economic assumptions across national and global integrated assessment models. Energy 2019, 172, 1254–1267. [Google Scholar] [CrossRef]
  54. REEM Project. Methodology for Linking Technology to Energy System Models; Technical Report; Compiled by KIC InnoEnergy, The Netherlands, Universität Stuttgart, Germany, and KTH Royal Institute of Technology, Sweden on behalf of the European Commission: Brussels, Belgium, 2017. [Google Scholar]
  55. Rodrigues, A.P.; Fernandes, M.L.; Rodrigues, M.F.F.; Bortoluzzi, S.C.; Gouvea da Costa, S.E.; Pinheiro de Lima, E. Developing criteria for performance assessment in municipal solid waste management. J. Clean. Prod. 2018, 186, 748–757. [Google Scholar] [CrossRef]
  56. Ma, W.; Xue, X.; Liu, G. Techno-economic evaluation for hybrid renewable energy system: Application and merits. Energy 2018, 159, 385–409. [Google Scholar] [CrossRef]
Figure 1. Summary of analytical themes and pathways explored to identify important indicators for assessing Smart Local Energy Systems.
Energies 15 09305 g001
Figure 2. Six themes for classifying benefits and performance of SLES.
Energies 15 09305 g002
Figure 3. Example pairwise comparison question from the 1000minds software.
Energies 15 09305 g003
Figure 4. Radar chart showing KPI theme weightings calculated from the DCE. The black dashed line shows the mean result from all respondents, while the solid coloured lines are a sample of results from individual participants.
Energies 15 09305 g004
Table 1. Theme-specific criteria (indicators, success criteria or metrics) for the six optional thematic surveys together with the typical number of pairwise comparisons presented to the respondent.
KPICriteriaPairwise
Theme1234567Comparisons
GovernanceGovernance StrategyIntegrated Management & Digital PlanningAccountability & Decision MakingTransparency & Consumer RedressKnowledge Exchange & ExperienceStandards & Regulation 20
EnvironmentGreenhouse Gas EmissionsBiodiversityHuman HealthResilience to EnvironmentNoise LevelsOther Ecosystem Impacts 20
Data ManagementDigital Technology EnablersICT InfrastructureVisibilityPrivacyGrid & Capacity ManagementInvestment Decisions 18
People & LivingCommunity EngagementFuel PovertyCost of EnergyThermal ComfortAccess to ServicesCarbon ReductionJob Opportunities17
Business & EconomicsMarket DesignAttractive to InvestorsCompetitive Energy PricingPromoting GrowthRevenue from DecarbonisationTechno- Economic Metrics 34
Technical PerformanceRobustnessReproducibilitySystem PerformanceMaturityEnergy & InfrastructureLocal Renewable Generation 15
Table 2. Different types of stakeholders who completed the survey.
Main Involvement in the SectorQuantityPercentage
Research Organisation or University11147.4
Small End User3715.8
Non-Governmental Organisation (NGO) or Non-Profit Organisation (NPO)166.8
Local Authority156.4
Energy Industry146.0
Consultant125.1
Community Energy93.8
Other93.8
Product Manufacturer and Retailer52.1
Government20.9
Finance Sector10.4
Large End User10.4
Network Operators and Advisors10.4
Regulators10.4
Table 3. Theme-specific KPI weightings calculated from the DCE thematic surveys.
KPICriteria Ranking and WeightsIncluded
Theme1234567Participants
GovernanceGovernance Strategy (23.3%)Accountability & Decision Making (19.7%)Standards & Regulation (16%)Integrated Management & Digital Planning (15.2%)Knowledge Exchange & Experience (13.4%)Transparency & Consumer Redress (12.4%) 30
EnvironmentGreenhouse Gas Emissions (32.1%)Other Ecosystem Impacts (20.3%)Biodiversity (20.2%)Human Health (17.1%)Resilience to Environment (8.8%)Noise Levels (1.5%) 56
Data ManagementGrid & Capacity Management (20.6%)Digital Technology Enablers (19.5%)Investment Decisions (19.1%)ICT Infrastructure (18.9%)Visibility (13.2%)Privacy (8.8%) 16
People & LivingFuel Poverty (19.4%)Carbon Reduction (16.5%)Cost of Energy (15.1%)Thermal Comfort (14.2%)Community Engagement (12.6%)Access to Services (11.7%)Job Opportunities (10.5%)51
Business & EconomicsMarket Design (22.3%)Promoting Growth (21.4%)Techno- Economic Metrics (15.5%)Competitive Energy Pricing (14.8%)Attractive to Investors (13%)Revenue from Decarbonisation (13%) 31
Technical PerformanceRobustness (26.6%)Energy & Infrastructure (18.6%)Local Renewable Generation (18.5%)Reproducibility (13.0%)System Performance (12.2%)Maturity (11.1%) 44
Table 4. Alignment of KPI themes and criteria with the existing literature.
ArticlesKPI Theme (Number of Criteria)
This studyData Management (6)Technical Performance (5)Business & Economics (6)Environment (6)People & Living (7)Governance (6)
Heo et al. [5]Technological (4)Market (3)Economic (3)Environmental (3) Policy (4)
Kaya and Kahraman [46]Technical (7)Economics (9)Environmental (9)Social (4)
Daim et al. [23]Technical (6)Economic (3)Environmental (3)Social (1)
Štreimikienė et al. [6]Technological (4)Economical (4)Environment protection (4)Social ethics (3)Institutional & political (5)
Sahabuddin and Khan [11] Economics (3)Environmental (3)Social (6)
Barney et al. [8]Technical (2)Economics (2)Environmental (2)Social (2)
Publisher’s Note: MDPI stays neutral with regard to jurisdictional claims in published maps and institutional affiliations.

