

Energy Harvesting in the Crane-Hoisting Mechanism


Abstract
:1. Introduction
2. Mathematical Model Formulation
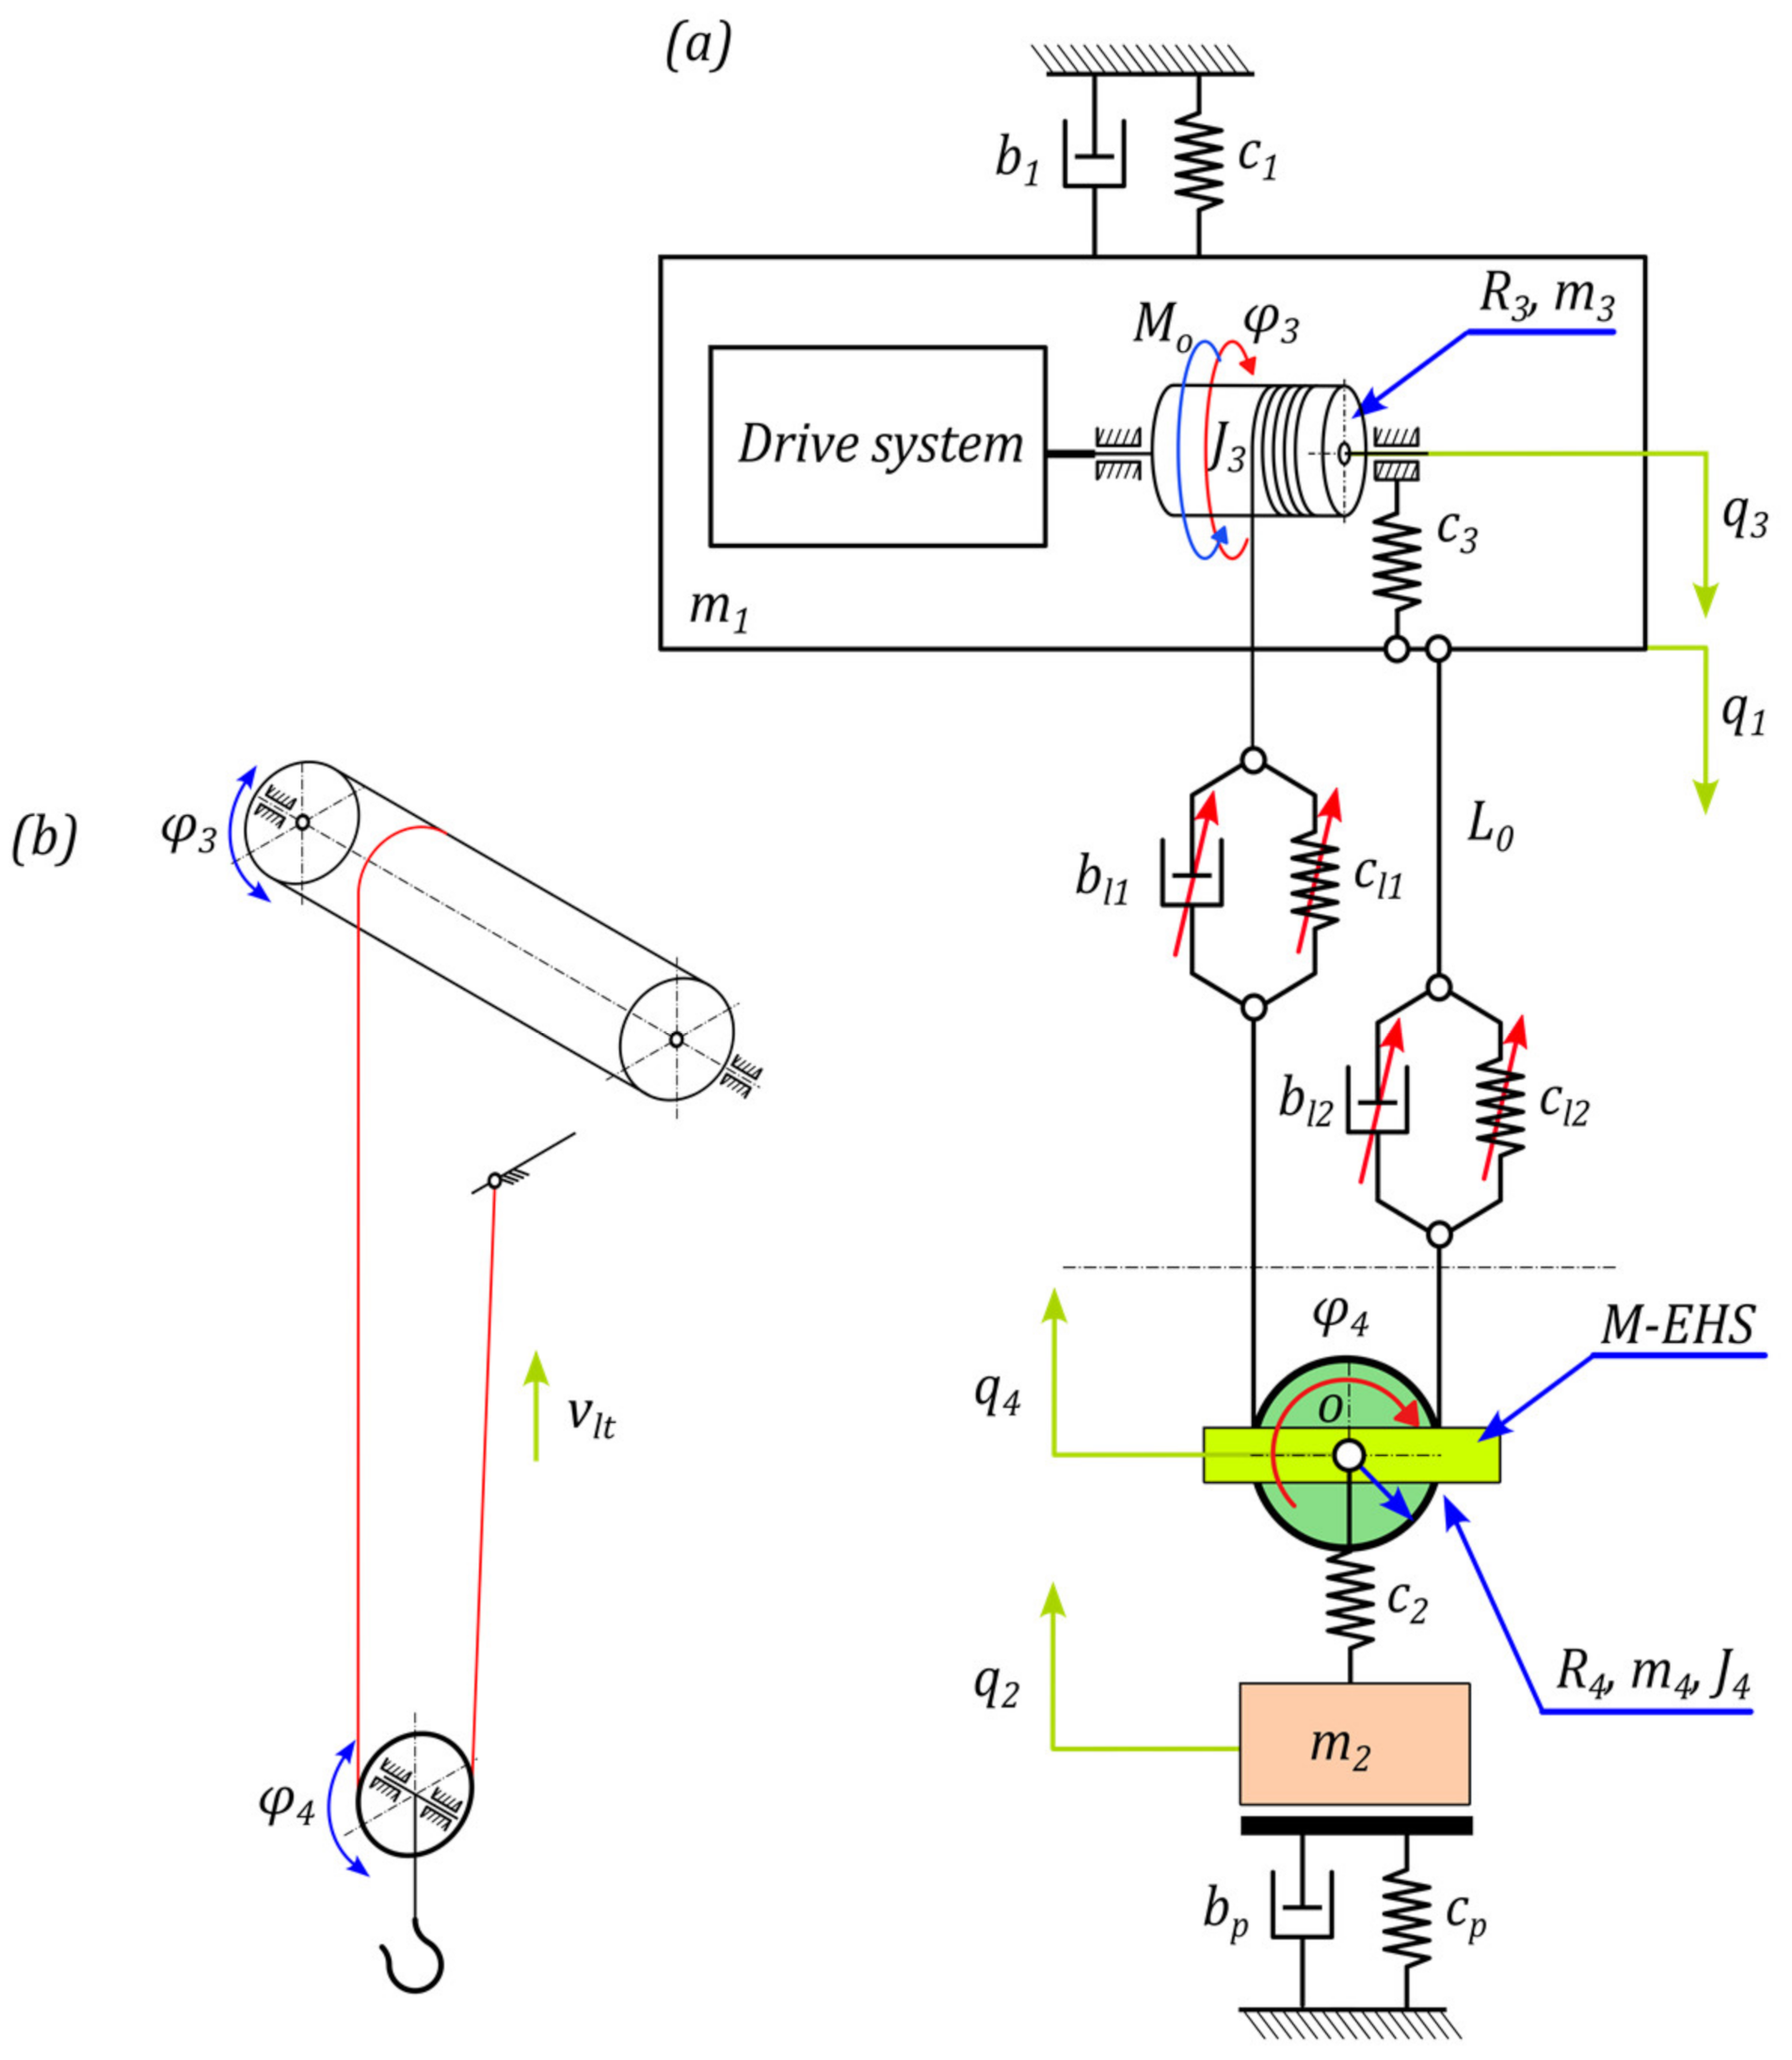
2.1. Model of the Overhead Crane-Hoisting Mechanism with the Simplified Drive System
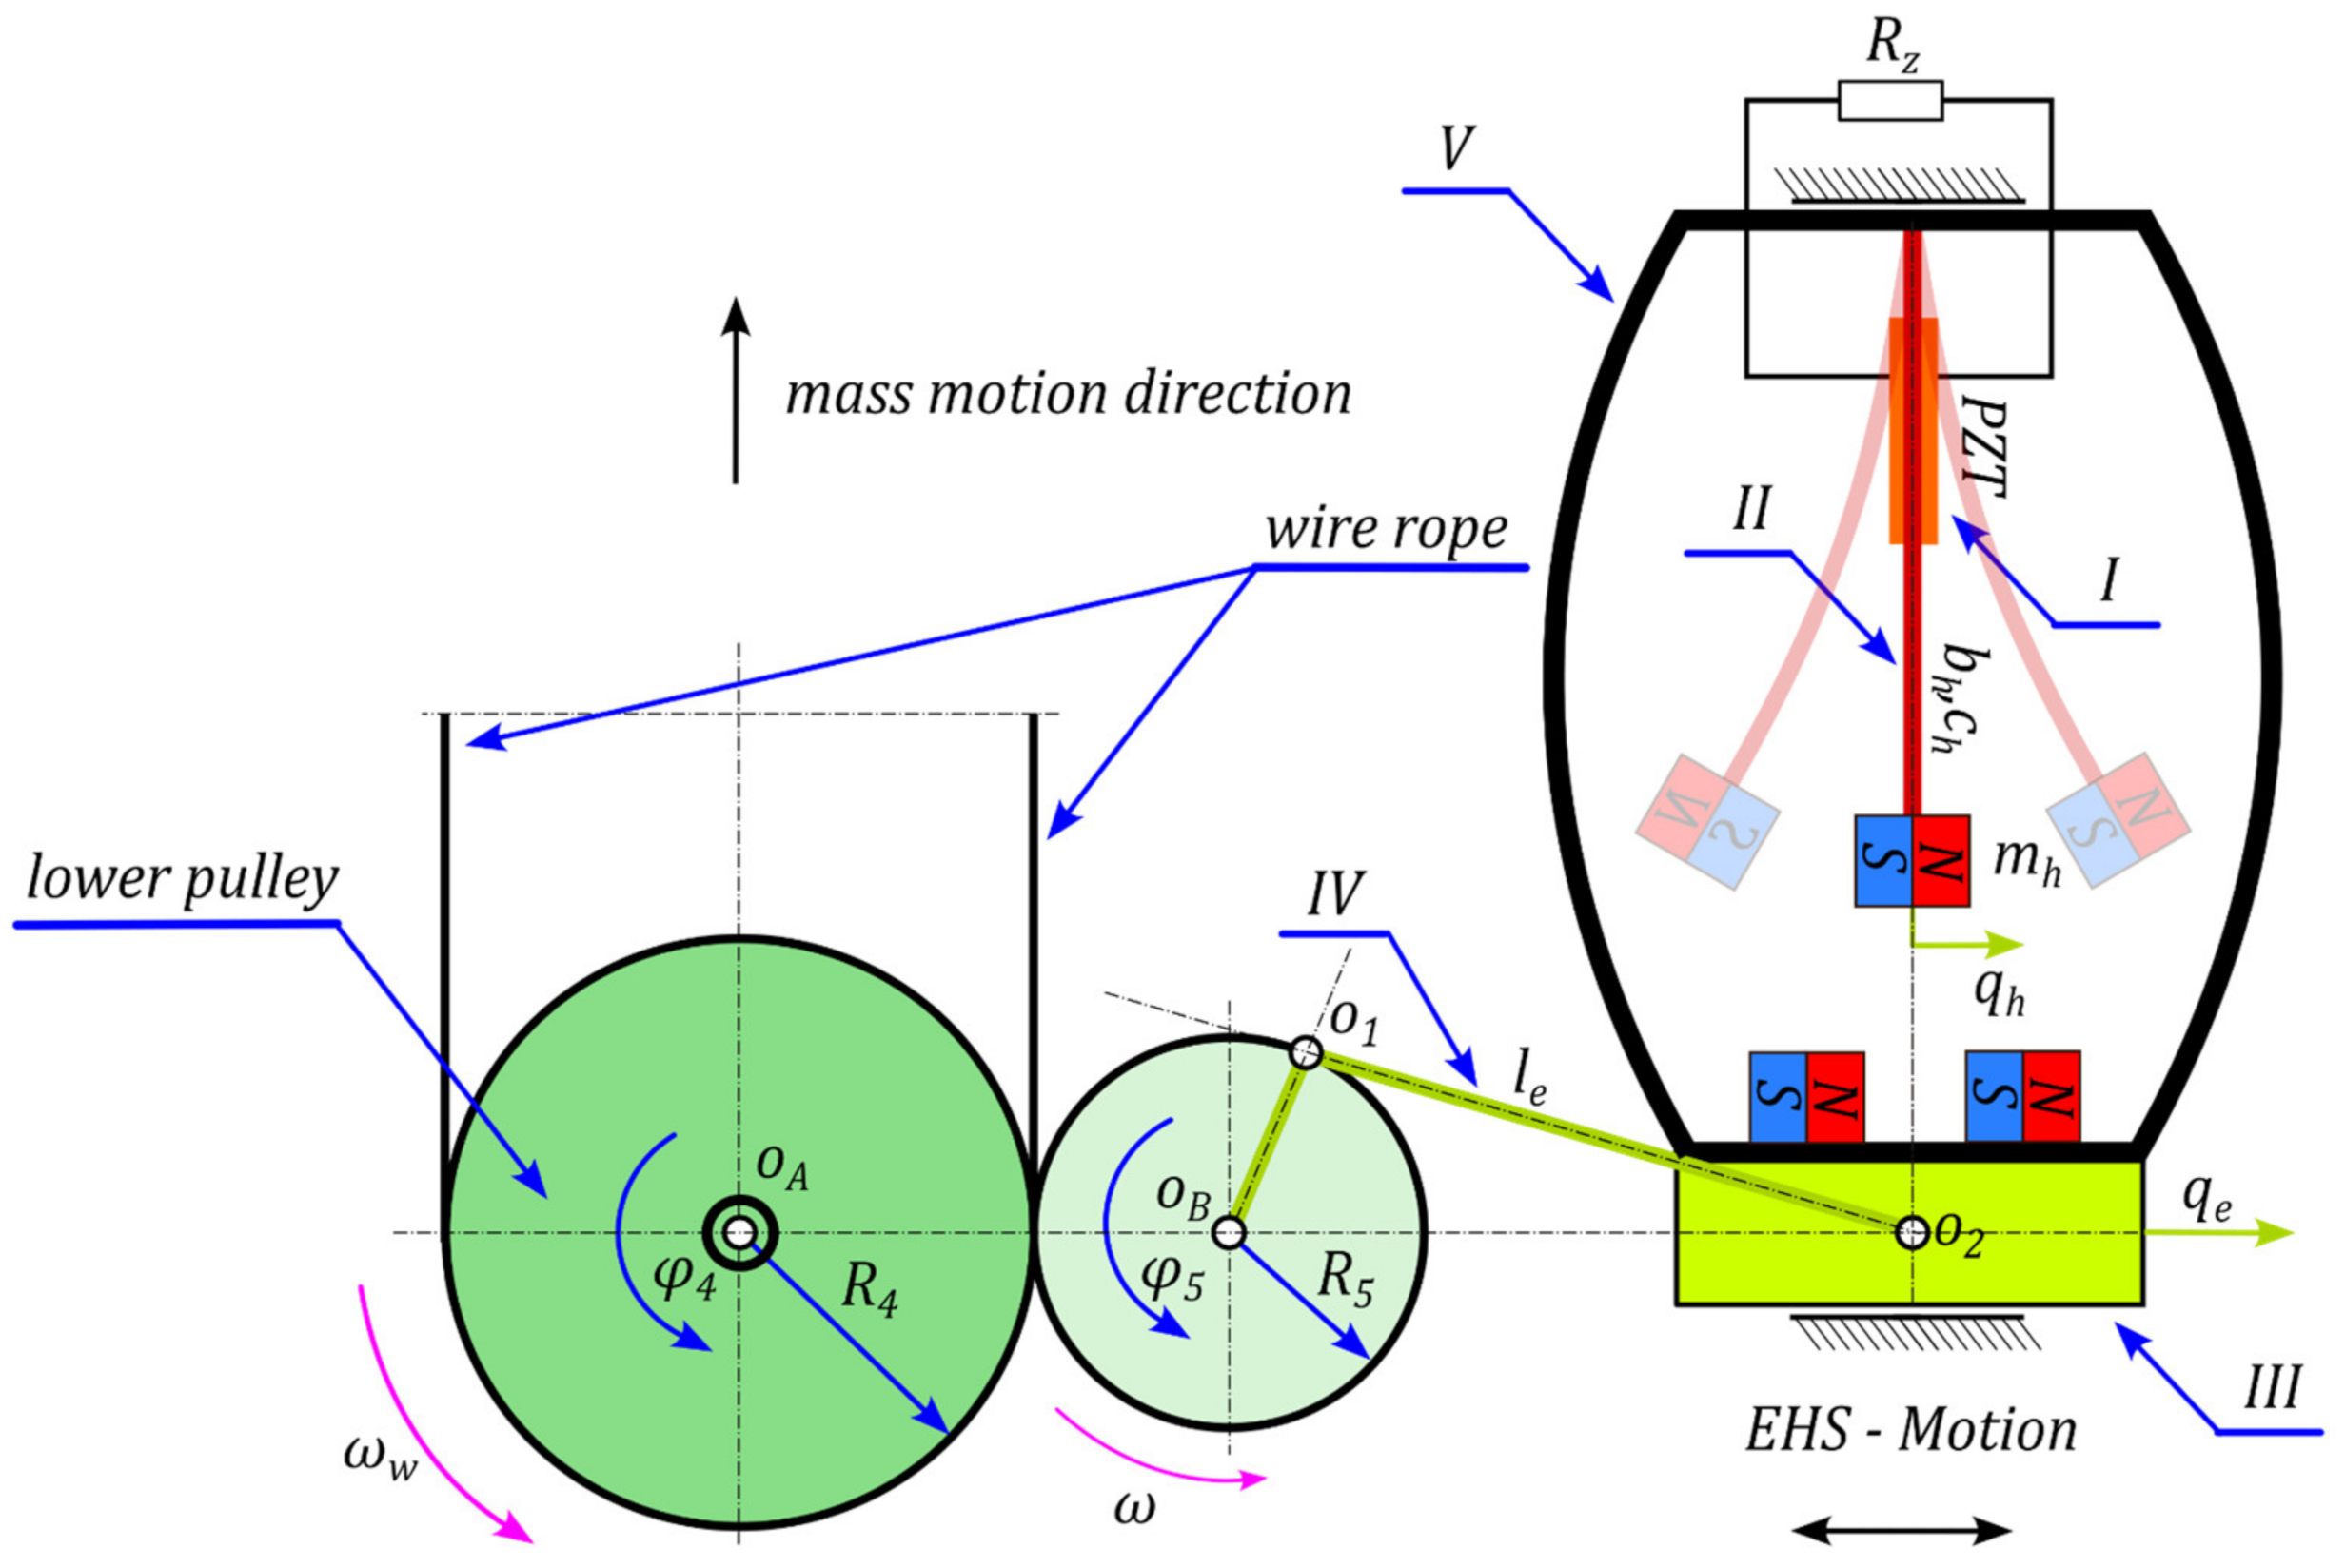
2.2. Model of M-EHS (Motion Energy–Harvesting System)
3. Model Test Results
4. Model Test Results and Effectiveness of M-EHS for Different Excitation Parameters
5. Summary and Conclusions
- The proposed M-EHS, together with the model of the hoisting mechanism, provided the possibility of analyzing any hoisting system together with the energy-harvesting system.
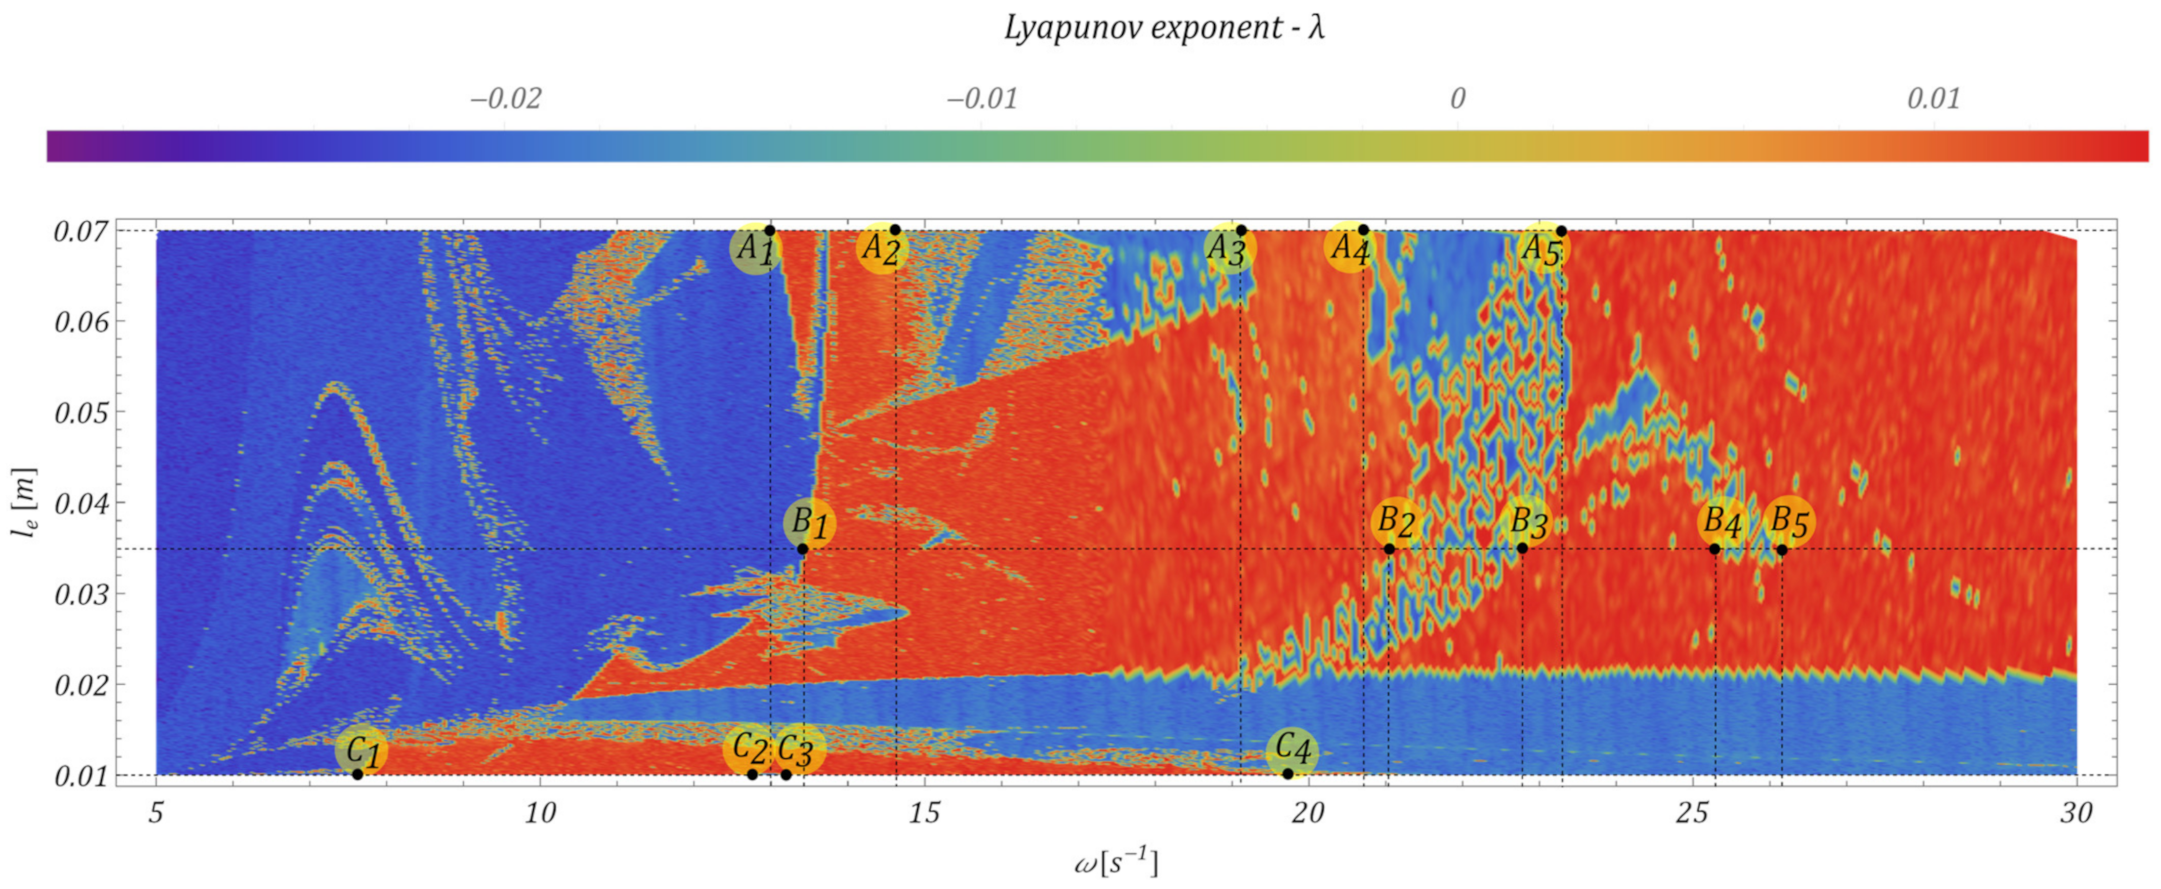
- The proposed mechanism of obtaining energy from the movement of the lower pulley was effective in a relatively wide range of operating speeds, which is shown in Figure 10 (range ); because of the specific parameters of the vibrating system, relatively effective acquisition occurred for the working speed of the selected hoisting mechanism.
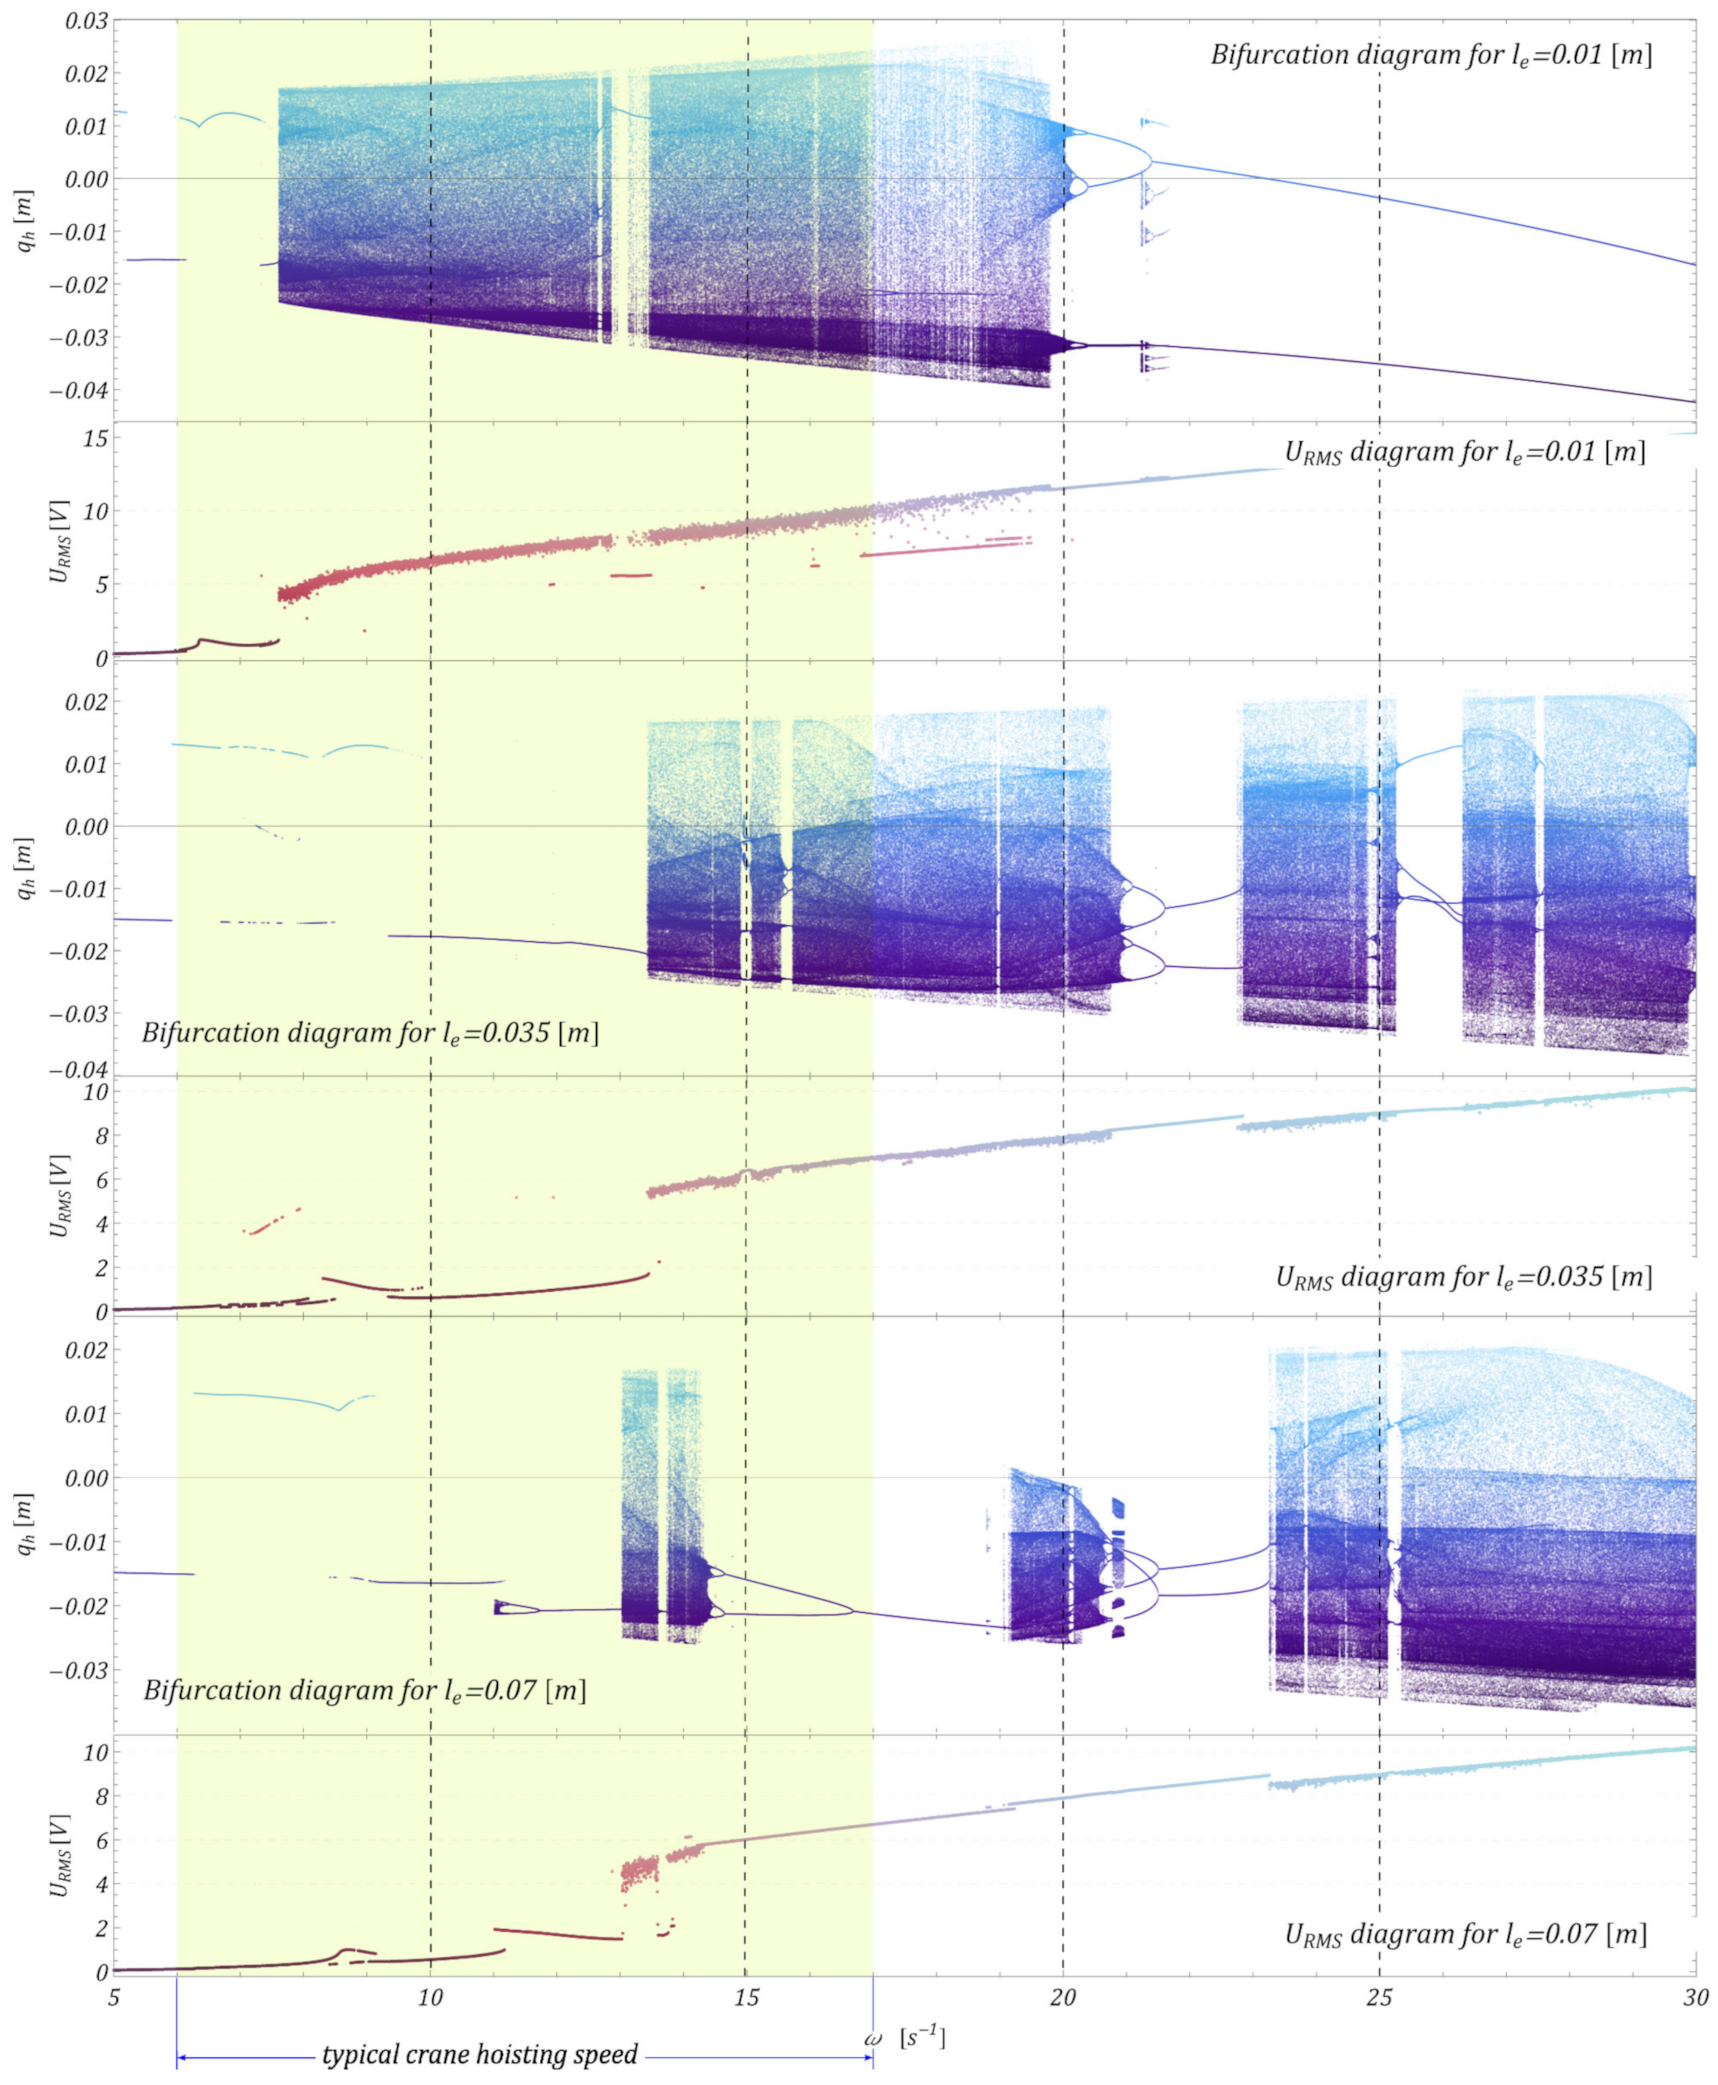
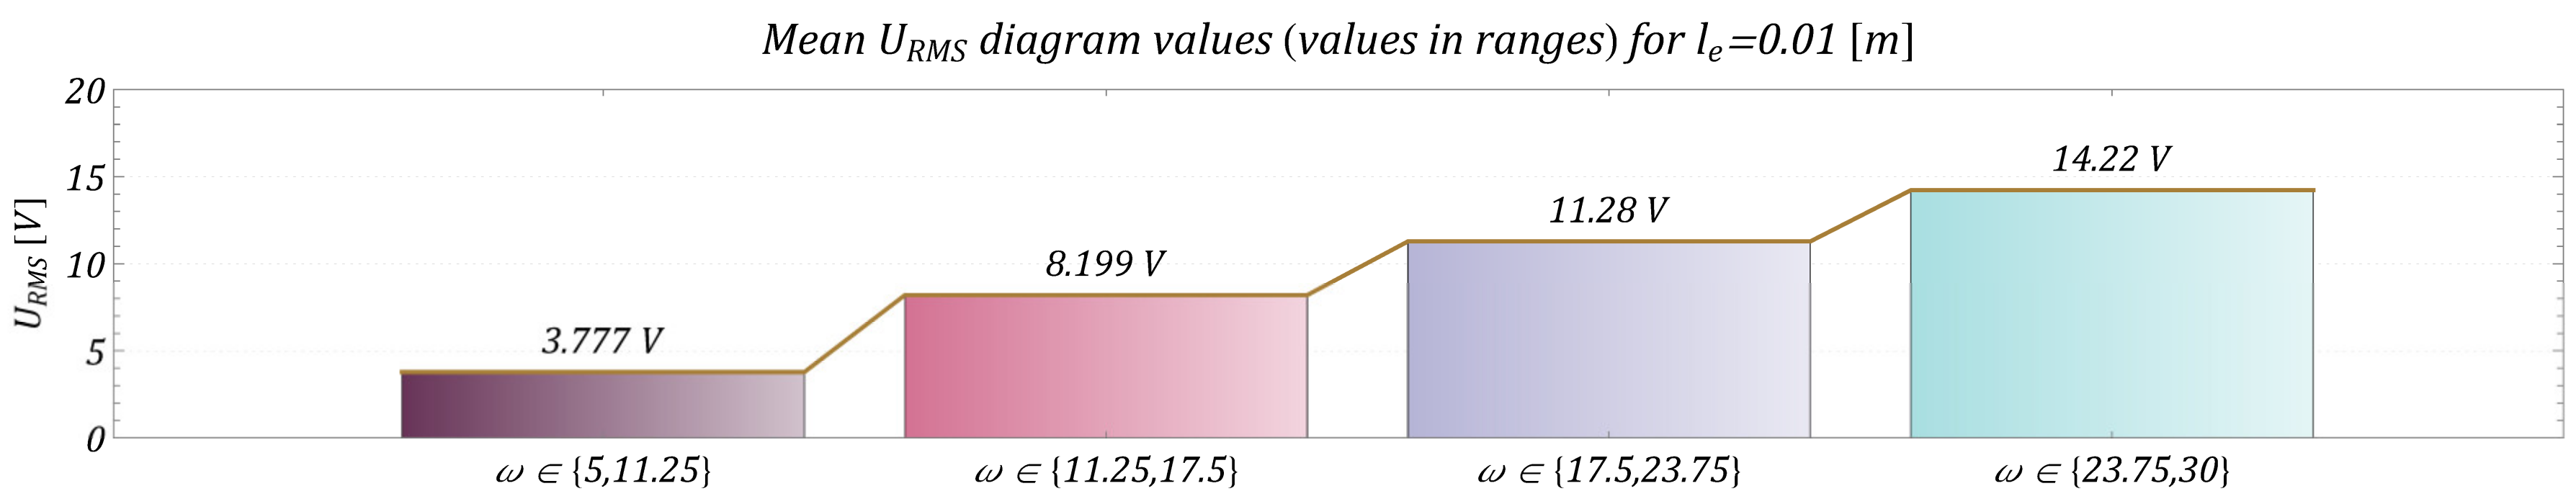
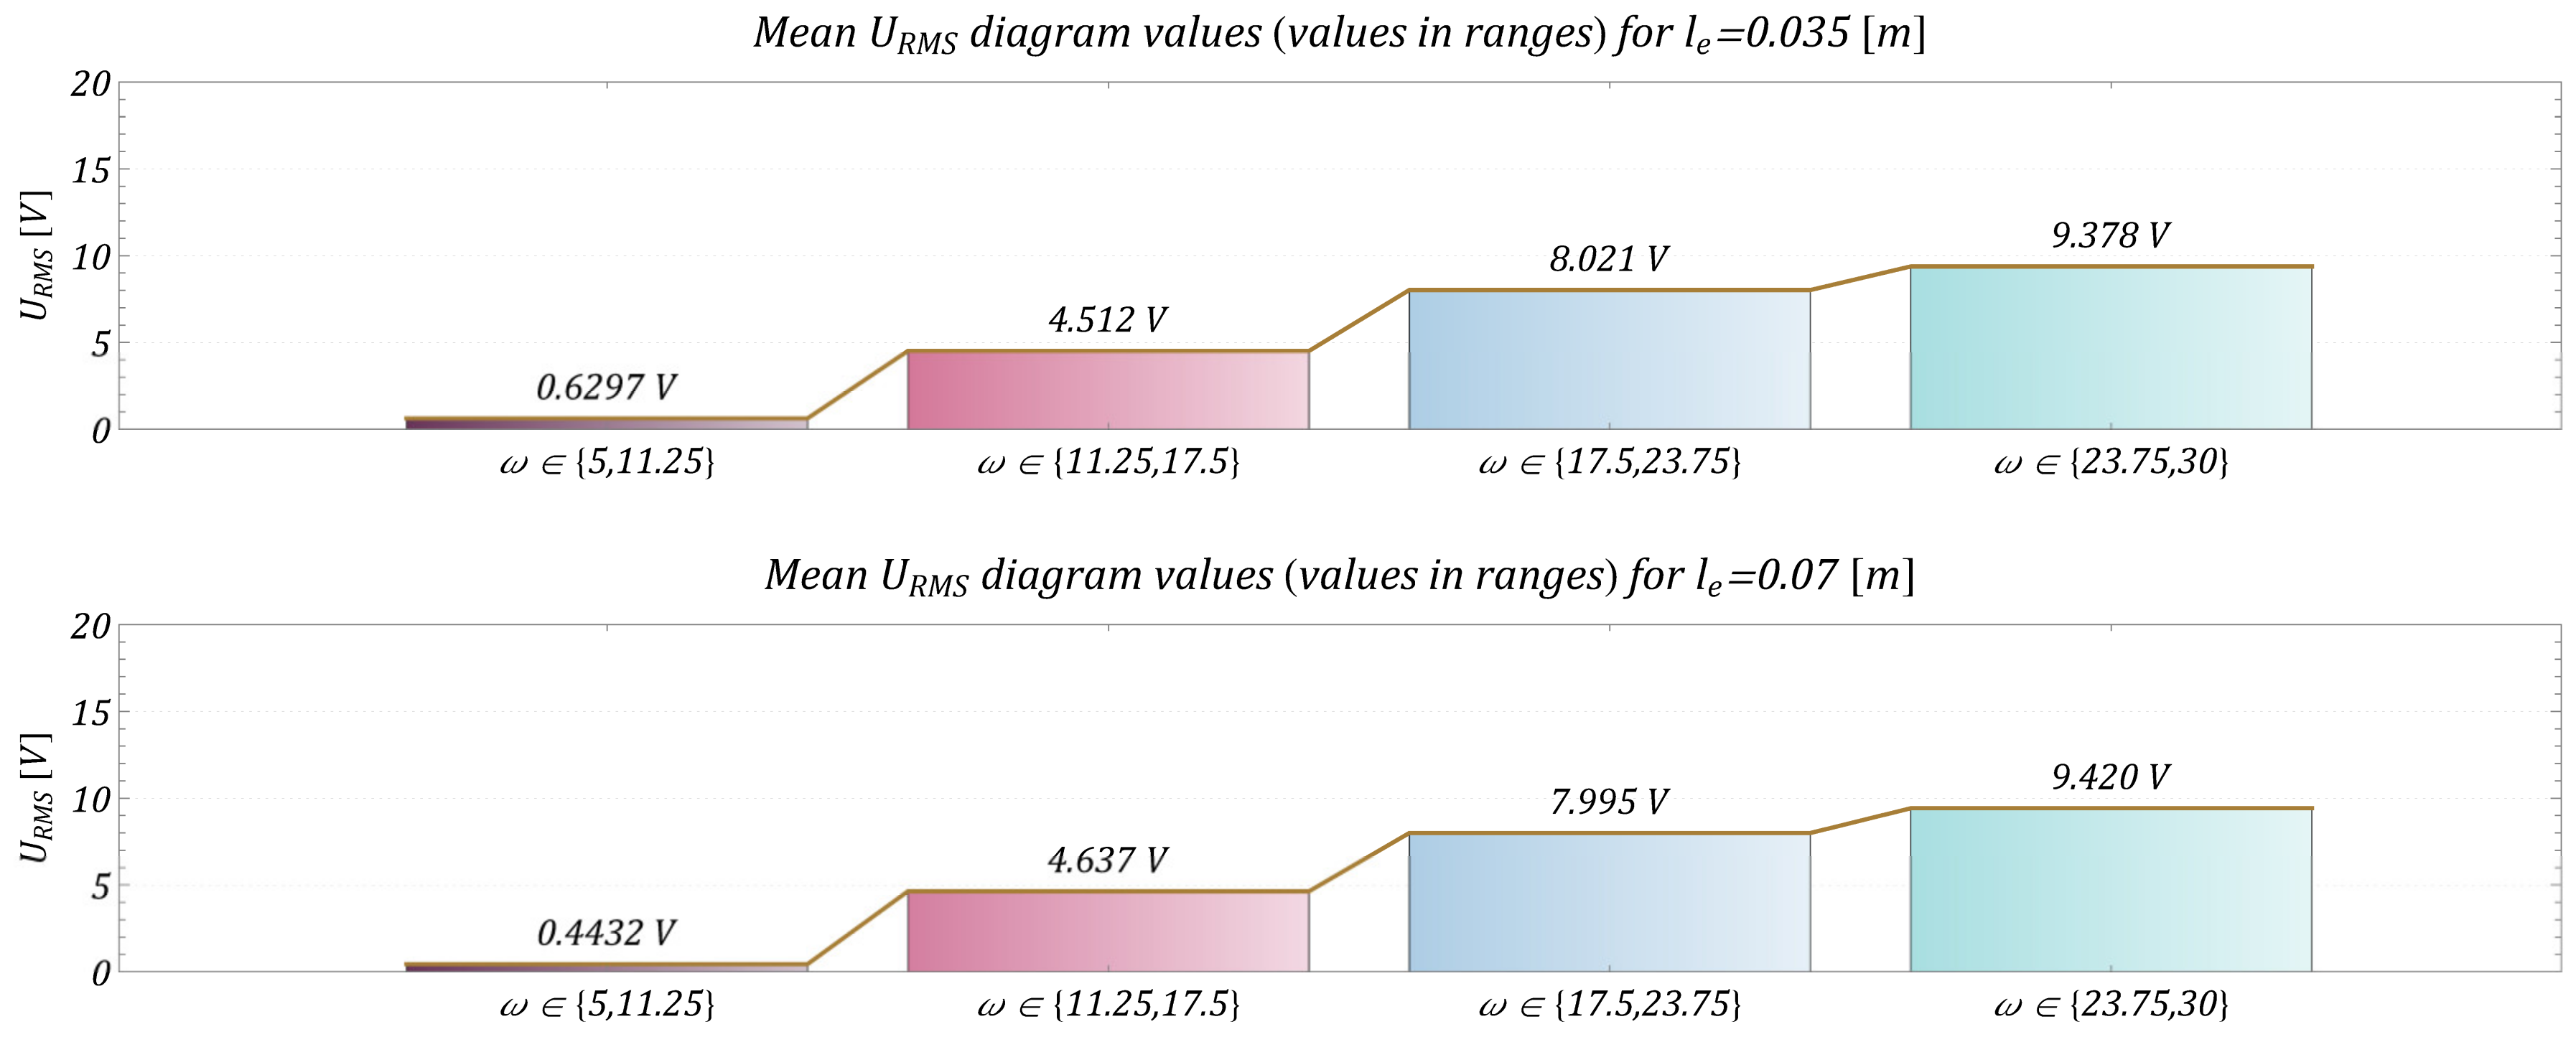
- Changing the parameters of the model, such as the excitation frequency and mainly the length of the arm, made it possible to increase or decrease the efficiency, which can be seen in Figure 19, summarizing the values of the RMS voltage on the piezoelectric electrodes in selected ranges of the excitation frequency and the length of the arm.
Author Contributions
Funding
Data Availability Statement
Acknowledgments
Conflicts of Interest
Abbreviations
| EH | Energy harvesting |
| IoT | Internet of Things |
| M-EHS | Motion energy–harvesting system |
References
- International Energy Agency. World Energy Model Stated Policies Scenario. 2019. Available online: https://www.iea.org/reports/world-energy-model/stated-policies-scenario (accessed on 14 October 2022).
- Nikas, A.; Gambhir, A.; Trutnevyte, E.; Koasidis, K.; Lund, H.; Thellufsen, J.Z.; Mayer, D.; Zachmann, G.; Miguel, L.; Ferreras-Alonso, N.; et al. Perspective of comprehensive and comprehensible multi-model energy and climate science in Europe. Energy 2021, 215, 119153. [Google Scholar] [CrossRef]
- Priya, S.; Inman, D.J. (Eds.) Energy Harvesting Technologies; Springer: New York, NY, USA, 2009; Volume 21, p. 2. [Google Scholar]
- Siddique, A.R.M.; Mahmud, S.; Van Heyst, B. A comprehensive review on vibration based micro power generators using electromagnetic and piezoelectric transducer mechanisms. Energy Convers. Manag. 2015, 106, 728–747. [Google Scholar] [CrossRef]
- Akinaga, H. Recent advances and future prospects in energy harvesting technologies. Jpn. J. Appl. Phys. 2020, 59, 110201. [Google Scholar] [CrossRef]
- Zhou, M.; Al-Furjan, M.S.H.; Zou, J.; Liu, W. A review on heat and mechanical energy harvesting from human–Principles, prototypes, and perspectives. Renew. Sustain. Energy Rev. 2018, 82, 3582–3609. [Google Scholar] [CrossRef]
- Fan, K.; Cai, M.; Wang, F.; Tang, L.; Liang, J.; Wu, Y.; Tan, Q. A string-suspended and driven rotor for efficient ultra-low frequency mechanical energy harvesting. Energy Convers. Manag. 2019, 198, 111820. [Google Scholar] [CrossRef]
- Hamlehdar, M.; Kasaeian, A.; Safaei, M.R. Energy harvesting from fluid flow using piezoelectrics: A critical review. Renew. Energy 2019, 143, 1826–1838. [Google Scholar] [CrossRef]
- Zou, H.X.; Li, M.; Zhao, L.C.; Gao, Q.H.; Wei, K.X.; Zuo, L.; Qian, F.; Zhang, W.M. A magnetically coupled bistable piezoelectric harvester for underwater energy harvesting. Energy 2021, 217, 119429. [Google Scholar] [CrossRef]
- Khazaee, M.; Rezaniakolaie, A.; Moosavian, A.; Rosendahl, L. A novel method for autonomous remote condition monitoring of rotating machines using piezoelectric energy harvesting approach. Sens. Actuators A Phys. 2019, 295, 37–50. [Google Scholar] [CrossRef]
- Fu, H.; Mei, X.; Yurchenko, D.; Zhou, S.; Theodossiades, S.; Nakano, K.; Yeatman, E.M. Rotational energy harvesting for self-powered sensing. Joule 2021, 5, 1074–1118. [Google Scholar] [CrossRef]
- Dudem, B.; Kim, D.H.; Bharat, L.K.; Yu, J.S. Highly-flexible piezoelectric nanogenerators with silver nanowires and barium titanate embedded composite films for mechanical energy harvesting. Appl. Energy 2018, 230, 865–874. [Google Scholar] [CrossRef]
- Abdelkareem, M.A.; Xu, L.; Ali, M.K.A.; Elagouz, A.; Mi, J.; Guo, S.; Liu, Y.; Zuo, L. Vibration energy harvesting in automotive suspension system: A detailed review. Appl. Energy 2018, 229, 672–699. [Google Scholar] [CrossRef]
- Guo, T.; Liu, G.; Pang, Y.; Wu, B.; Xi, F.; Zhao, J.; Bu, T.; Fu, X.; Li, X.; Zhang, C.; et al. Compressible hexagonal-structured triboelectric nanogenerators for harvesting tire rotation energy. Extrem. Mech. Lett. 2018, 18, 1–8. [Google Scholar] [CrossRef]
- Maurya, D.; Kumar, P.; Khaleghian, S.; Sriramdas, R.; Kang, M.G.; Kishore, R.A.; Kumar, V.; Song, H.-C.; Park, J.-M.; Taheri, S.; et al. Energy harvesting and strain sensing in smart tire for next generation autonomous vehicles. Appl. Energy 2018, 232, 312–322. [Google Scholar] [CrossRef]
- Bosso, N.; Magelli, M.; Zampieri, N. Application of low-power energy harvesting solutions in the railway field: A review. Veh. Syst. Dyn. 2021, 59, 841–871. [Google Scholar] [CrossRef]
- Zhang, X.; Pan, H.; Qi, L.; Zhang, Z.; Yuan, Y.; Liu, Y. A renewable energy harvesting system using a mechanical vibration rectifier (MVR) for railroads. Appl. Energy 2017, 204, 1535–1543. [Google Scholar] [CrossRef]
- Zhang, X.; Zhang, Z.; Pan, H.; Salman, W.; Yuan, Y.; Liu, Y. A portable high-efficiency electromagnetic energy harvesting system using supercapacitors for renewable energy applications in railroads. Energy Convers. Manag. 2016, 118, 287–294. [Google Scholar] [CrossRef]
- Song, Y. Finite-element implementation of piezoelectric energy harvesting system from vibrations of railway bridge. J. Energy Eng. 2019, 145, 04018076. [Google Scholar] [CrossRef]
- Dalala, Z.; Alwahsh, T.; Saadeh, O. Energy recovery control in elevators with automatic rescue application. J. Energy Storage 2021, 43, 103168. [Google Scholar] [CrossRef]
- Ahamad, N.B.B.; Su, C.L.; Zhaoxia, X.; Vasquez, J.C.; Guerrero, J.M.; Liao, C.H. Energy harvesting from harbor cranes with flywheel energy storage systems. IEEE Trans. Ind. Appl. 2019, 55, 3354–3364. [Google Scholar] [CrossRef]
- Tan, K.H.; Fah, Y.F. Reducing fuel consumption using flywheel battery technology for rubber tyred gantry cranes in container terminals. J. Power Energy Eng. 2017, 5, 15–33. [Google Scholar] [CrossRef]
- Wang, H.; Zhang, Q.; Xie, F. Dynamic tension test and intelligent coordinated control system of a heavy scraper conveyor. IET Sci. Meas. Technol. 2017, 11, 871–877. [Google Scholar] [CrossRef]
- Iqbal, M.; Nauman, M.M.; Khan, F.U.; Abas, P.E.; Cheok, Q.; Iqbal, A.; Aissa, B. Vibration-based piezoelectric, electromagnetic, and hybrid energy harvesters for microsystems applications: A contributed review. Int. J. Energy Res. 2021, 45, 65–102. [Google Scholar] [CrossRef]
- Miao, G.; Fang, S.; Wang, S.; Zhou, S. A low-frequency rotational electromagnetic energy harvester using a magnetic plucking mechanism. Appl. Energy 2022, 305, 117838. [Google Scholar] [CrossRef]
- Li, Z.; Liu, Y.; Yin, P.; Peng, Y.; Luo, J.; Xie, S.; Pu, H. Constituting abrupt magnetic flux density change for power density improvement in electromagnetic energy harvesting. Int. J. Mech. Sci. 2021, 198, 106363. [Google Scholar] [CrossRef]
- Deng, Z.; Dapino, M.J. Review of magnetostrictive vibration energy harvesters. Smart Mater. Struct. 2017, 26, 103001. [Google Scholar] [CrossRef] [Green Version]
- Khan, F.U.; Qadir, M.U. State-of-the-art in vibration-based electrostatic energy harvesting. J. Micromechan. Microeng. 2016, 26, 103001. [Google Scholar] [CrossRef]
- Zhang, Y.; Wang, T.; Luo, A.; Hu, Y.; Li, X.; Wang, F. Micro electrostatic energy harvester with both broad bandwidth and high normalized power density. Appl. Energy 2018, 212, 362–371. [Google Scholar] [CrossRef]
- Erturk, A.; Inman, D.J. Piezoelectric Energy Harvesting; John Wiley & Sons: Hoboken, NJ, USA, 2011. [Google Scholar]
- Sezer, N.; Koç, M. A comprehensive review on the state-of-the-art of piezoelectric energy harvesting. Nano Energy 2021, 80, 105567. [Google Scholar] [CrossRef]
- Covaci, C.; Gontean, A. Piezoelectric energy harvesting solutions: A review. Sensors 2020, 20, 3512. [Google Scholar] [CrossRef]
- Febbo, M.; Machado, S.P.; Osinaga, S.M. A novel up-converting mechanism based on double impact for non-linear piezoelectric energy harvesting. J. Phys. D Appl. Phys. 2020, 53, 475501. [Google Scholar] [CrossRef]
- Vijayan, K.; Friswell, M.I.; Khodaparast, H.H.; Adhikari, S. Non-linear energy harvesting from coupled impacting beams. Int. J. Mech. Sci. 2015, 96, 101–109. [Google Scholar] [CrossRef] [Green Version]
- Gibus, D.; Gasnier, P.; Morel, A.; Garraud, N.; Badel, A. Non-linear losses study in strongly coupled piezoelectric device for broadband energy harvesting. Mech. Syst. Signal Process. 2022, 165, 108370. [Google Scholar] [CrossRef]
- Litak, G.; Margielewicz, J.; Gąska, D.; Wolszczak, P.; Zhou, S. Multiple solutions of the tristable energy harvester. Energies 2021, 14, 1284. [Google Scholar] [CrossRef]
- Halim, M.A.; Park, J.Y. Modeling and experiment of a handy motion driven, frequency up-converting electromagnetic energy harvester using transverse impact by spherical ball. Sens. Actuators A Phys. 2015, 229, 50–58. [Google Scholar] [CrossRef]
- Ramezanpour, R.; Nahvi, H.; Ziaei-Rad, S. Electromechanical behavior of a pendulum-based piezoelectric frequency up-converting energy harvester. J. Sound Vib. 2016, 370, 280–305. [Google Scholar] [CrossRef]
- Fu, H.; Yeatman, E.M. A methodology for low-speed broadband rotational energy harvesting using piezoelectric transduction and frequency up-conversion. Energy 2017, 125, 152–161. [Google Scholar] [CrossRef] [Green Version]
- Izadgoshasb, I.; Lim, Y.Y.; Tang, L.; Padilla, R.V.; Tang, Z.S.; Sedighi, M. Improving efficiency of piezoelectric based energy harvesting from human motions using double pendulum system. Energy Convers. Manag. 2019, 184, 559–570. [Google Scholar] [CrossRef]
- Kumar, R.; Gupta, S.; Ali, S.F. Energy harvesting from chaos in base excited double pendulum. Mech. Syst. Signal Process. 2019, 124, 49–64. [Google Scholar] [CrossRef]
- Dell’Anna, F.; Dong, T.; Li, P.; Wen, Y.; Yang, Z.; Casu, M.R.; Azadmehr, M.; Berg, Y. State-of-the-art power management circuits for piezoelectric energy harvesters. IEEE Circuits Syst. Mag. 2018, 18, 27–48. [Google Scholar] [CrossRef]
- Alghisi, D.; Ferrari, V.; Ferrari, M.; Crescini, D.; Touati, F.; Mnaouer, A.B. Single-and multi-source battery-less power management circuits for piezoelectric energy harvesting systems. Sens. Actuators A Phys. 2017, 264, 234–246. [Google Scholar] [CrossRef]
- Lefeuvre, E.; Badel, A.; Brenes, A.; Seok, S.; Yoo, C.S. Power and frequency bandwidth improvement of piezoelectric energy harvesting devices using phase-shifted synchronous electric charge extraction interface circuit. J. Intell. Mater. Syst. Struct. 2017, 28, 2988–2995. [Google Scholar] [CrossRef]
- Zhang, Z.; Xiang, H.; Shi, Z.; Zhan, J. Experimental investigation on piezoelectric energy harvesting from vehicle-bridge coupling vibration. Energy Convers. Manag. 2018, 163, 169–179. [Google Scholar] [CrossRef]
- Keshmiri, A.; Deng, X.; Wu, N. New energy harvester with embedded piezoelectric stacks. Compos. Part B Eng. 2019, 163, 303–313. [Google Scholar] [CrossRef]
- Wang, J.; Gu, S.; Zhang, C.; Hu, G.; Chen, G.; Yang, K.; Yurchenko, D. Hybrid wind energy scavenging by coupling vortex-induced vibrations and galloping. Energy Convers. Manag. 2020, 213, 112835. [Google Scholar] [CrossRef]
- Lallart, M.; Zhou, S.; Yang, Z.; Yan, L.; Li, K.; Chen, Y. Coupling mechanical and electrical nonlinearities: The effect of synchronized discharging on tristable energy harvesters. Appl. Energy 2020, 266, 114516. [Google Scholar] [CrossRef]
- Margielewicz, J.; Gąska, D.; Litak, G.; Wolszczak, P.; Trigona, C. Nonlinear Dynamics of a Star-Shaped Structure and Variable Configuration of Elastic Elements for Energy Harvesting Applications. Sensors 2022, 22, 2518. [Google Scholar] [CrossRef]
- Margielewicz, J.; Gąska, D.; Litak, G.; Wolszczak, P.; Yurchenko, D. Nonlinear dynamics of a new energy harvesting system with quasi-zero stiffness. Appl. Energy 2022, 307, 118159. [Google Scholar] [CrossRef]
- Li, X.; Zhang, J.; Li, R.; Dai, L.; Wang, W.; Yang, K. Dynamic responses of a two-degree-of-freedom bistable electromagnetic energy harvester under filtered band-limited stochastic excitation. J. Sound Vib. 2021, 511, 116334. [Google Scholar] [CrossRef]
- Yang, K.; Tong, W.; Lin, L.; Yurchenko, D.; Wang, J. Active vibration isolation performance of the bistable nonlinear electromagnetic actuator with the elastic boundary. J. Sound Vib. 2022, 520, 116588. [Google Scholar] [CrossRef]
- Li, X.; Yurchenko, D.; Li, R.; Feng, X.; Yan, B.; Yang, K. Performance and dynamics of a novel bistable vibration energy harvester with appended nonlinear elastic boundary. Mech. Syst. Signal Process. 2023, 185, 109787. [Google Scholar] [CrossRef]
- Ahmad, M.M.; Khan, N.M.; Khan, F.U. Multi-degrees of freedom energy harvesting for broad-band vibration frequency range: A review. Sens. Actuators A Phys. 2022, 344, 113690. [Google Scholar] [CrossRef]
- Gąska, D.; Margielewicz, J.; Haniszewski, T.; Matyja, T.; Konieczny, Ł.; Chróst, P. Numerical identification of the overhead travelling crane’s dynamic factor caused by lifting the load off the ground. J. Meas. Eng. 2015, 3, 1–8. [Google Scholar]
- Haniszewski, T. Metodyka Modelowania Mechanizmów Wykonawczych Suwnic; Politechniki Śląskiej: Polish Province of Silesia, Poland, 2021; p. 894. [Google Scholar]
- Costello, G.A. Theory of Wire Rope; Springer: New York, NY, USA, 1997. [Google Scholar] [CrossRef]
- Zhou, S.; Cao, J.; Erturk, A.; Lin, J. Enhanced Broadband Piezoelectric Energy Harvesting Using Rotatable Magnets. Appl. Phys. Lett. 2013, 102, 173901. [Google Scholar] [CrossRef] [Green Version]
- Zhang, X.; Yang, W.; Zuo, M.; Tan, H.; Fan, H.; Mao, Q.; Wan, X. An Arc-Shaped Piezoelectric Bistable Vibration Energy Harvester: Modeling and Experiments. Sensors 2018, 18, 4472. [Google Scholar] [CrossRef] [PubMed] [Green Version]
- Stanton, S.C.; McGehee, C.C.; Mann, B.P. Nonlinear Dynamics for Broadband Energy Harvesting: Investigation of a Bistable Piezoelectric Inertial Generator. Phys. D Nonlinear Phenom. 2010, 239, 640–653. [Google Scholar] [CrossRef]
- Zhou, S.; Cao, J.; Inman, D.J.; Lin, J.; Liu, S.; Wang, Z. Broadband Tristable Energy Harvester: Modeling and Experiment Verification. Appl. Energy 2014, 133, 33–39. [Google Scholar] [CrossRef]
- Huang, D.; Zhou, S.; Litak, G. Theoretical Analysis of Multi-Stable Energy Harvesters with High-Order Stiffness Terms. Commun. Nonlinear Sci. Numer. Simul. 2019, 69, 270–286. [Google Scholar] [CrossRef]
- Strogatz, S.H. Nonlinear Dynamics and Chaos: With Applications to Physics, Biology, Chemistry, and Engineering; CRC Press: Boca Raton, FL, USA, 2018. [Google Scholar] [CrossRef]
- Upadhyay, R.K.; Iyengar, S.R.K. Introduction to Mathematical Modeling and Chaotic Dynamics; Chapman and Hall/CRC: New York, NY, USA, 2013; pp. 1–349. [Google Scholar]
- Litak, G.; Margielewicz, J.; Gaska, D.; Rysak, A.; Trigona, C. On Theoretical and Numerical Aspects of Bifurcations and Hysteresis Effects in Kinetic Energy Harvesters. Sensors 2022, 22, 381. [Google Scholar] [CrossRef]


| Name | Symbol | Unit | Value |
|---|---|---|---|
| lifting capacity | 5000 | ||
| lifting speed | 0.208 | ||
| lifting height | 10 | ||
| motor | 10 | ||
| 98.96 | |||
| gear ratio | 60 | ||
| rope drum diameter | 0.5 | ||
| wire rope type | |||
| wire rope diameter | 0.012 | ||
| number of strands of rope | 4 | ||
| drum rotation | ~1.65 | ||
| Symbol | Name | Value | Unit |
|---|---|---|---|
| rated power | 10 × 103 | ||
| overload | 320 | ||
| moment of inertia of the rotor | 0.1425 | ||
| maximum, critical moment | 323.36 | ||
| nominal moment | 101.05 | ||
| speed-rated rotor | 945 | ||
| synchronous speed | 1000 | ||
| nominal slip | 0.055 | ||
| critical slip | 0.343 | ||
| rated angular speed of the motor | 98.96 | ||
| circular frequency of the supply network | 314.15 | ||
| synchronous angular speed of the motor | 104.72 | ||
| number of pole pairs | 3 | ||
| mains frequency | 50 |
| Symbol | Name | Value | Unit |
|---|---|---|---|
| mass moment of inertia of the motor rotor | 0.1425 | ||
| mass moment of inertia of the clutch | 0.1634 | ||
| mass moment of inertia of the rope drum | 11.1647 | ||
| mass moment of inertia of the input stage of the substitute gear | 0.057 | ||
| mass moment of inertia of the output stage of the substitute gear | 0.635 | ||
| the stiffness of the shaft connecting the motor to the clutch | 2.05 × 10⁵ | ||
| the stiffness of the shaft connecting the clutch to the gear | 5.58 × 10⁴ | ||
| the stiffness of the shaft connecting the gears to the rope drum | 4.92 × 10⁶ | ||
| damping of the shaft connecting the motor with the clutch | 1.02 × 10³ | ||
| damping of the shaft connecting the clutch with the gear | 2.79 × 10² | ||
| damping of the shaft connecting the gears with the rope drum | 2.46 × 10⁴ |
| Symbol | Name | Value | Unit |
|---|---|---|---|
| the reduced mass of the girder together with the weight of the winch trolley | 5500 | ||
| mass of the load | 1850 | ||
| weight of the rope drum | 280 | ||
| doubled weight of the pulley, bottom pulley | 30 | ||
| mass moment of inertia of doubled pulley, bottom pulley | 0.3 | ||
| girder stiffness | 4.6 × 10⁶ | ||
| ground stiffness | 2.0 × 10⁸ | ||
| stiffness of the rope drum axle bearings | 1.8 × 10⁸ | ||
| hook stiffness | 2 × 10⁷ | ||
| ground damping | 1 × 10⁶ | ||
| Damping of the girder | 5.0168 × 10³ | ||
| radius of the rope drum | 0.25 | ||
| radius of the lower pulley | 0.14 | ||
| rope diameter | 0.012 | ||
| initial rope length | 10 | ||
| metallic cross section of the rope | 5.53 × 10⁻⁵ | ||
| steel density | 7850 | ||
| Young’s modulus for steel | 2.1 × 10¹¹ | ||
| the modulus of elasticity of the rope | 1.05 × 10¹¹ | ||
| acceleration due to gravity | 9.81 | ||
| lifting speed | 0.208 | ||
| angular velocity of the rope drum | 1.67 | ||
| number of strands of rope | 4 | ||
| dimensionless damping factor for wire ropes | 0.07 | ||
| transmission ratio | 60 | ||
| transmission of the rope system | 2 |
| Name | Symbol | Value | Unit |
|---|---|---|---|
| inertial element (mass) loading the beam | |||
| energy losses in a mechanical system | |||
| stiffness of beam-pzt system | |||
| arm length | |||
| Angular velocity of lower pulley | |||
| radius of the wheel cooperating with the lower pulley | |||
| parameters defining the potential barrier | |||
| ratio | |||
| equivalent resistance of the electrical circuit | |||
| equivalent capacity of the electric circuit | |||
| electromechanical constant of piezoelectric converter |
Publisher’s Note: MDPI stays neutral with regard to jurisdictional claims in published maps and institutional affiliations. |
© 2022 by the authors. Licensee MDPI, Basel, Switzerland. This article is an open access article distributed under the terms and conditions of the Creative Commons Attribution (CC BY) license (https://creativecommons.org/licenses/by/4.0/).
Share and Cite
Haniszewski, T.; Cieśla, M. Energy Harvesting in the Crane-Hoisting Mechanism. Energies 2022, 15, 9366. https://doi.org/10.3390/en15249366
Haniszewski T, Cieśla M. Energy Harvesting in the Crane-Hoisting Mechanism. Energies. 2022; 15(24):9366. https://doi.org/10.3390/en15249366
Chicago/Turabian StyleHaniszewski, Tomasz, and Maria Cieśla. 2022. "Energy Harvesting in the Crane-Hoisting Mechanism" Energies 15, no. 24: 9366. https://doi.org/10.3390/en15249366
APA StyleHaniszewski, T., & Cieśla, M. (2022). Energy Harvesting in the Crane-Hoisting Mechanism. Energies, 15(24), 9366. https://doi.org/10.3390/en15249366