Abstract
In this paper, the results of an experimental study on hydrogen production at a tungsten discharge electrode with negative polarity in the DC electrolysis of a typical 10 wt% Na2CO3 aqueous solution in three operational regimes (the Faradaic, transition, and plasma-driven solution electrolysis (PDSE)) are presented for the first time. To focus the study on hydrogen production, a flowing inert gas (argon) was used to transport the gas mixture produced at the discharge electrode and prevent any other potential chemical reactions. The results showed that the highest hydrogen production rate of 0.147 g(H2)/h was achieved in the cathodic PDSE regime at the applied DC voltage of 198 V. However, the energy yield of hydrogen production of 0.405 g(H2)/kWh obtained at the applied voltage range of 141–170 V in the PDSE regime was lower than that obtained in the Faradaic regime (0.867 g(H2)/kWh) at 28 V. The energy balance of hydrogen production in the cathodic PDSE regime for the typical aqueous solution of Na2CO3 carried out for the first time showed that a significant share (˃98%) of the electrical energy consumed is spent on heating and evaporation of the electrolytic solution. This explains why the energy yield of hydrogen production is low in the PDSE regime. Because most of the energy is consumed for heat generation in the cathodic PDSE regime, organic liquid hydrogen carriers, such as alcohols, which have a lower boiling temperature, heat of evaporation, and standard Gibbs free energy, should be considered better aqueous electrolytic solutions in terms of the energy yield of hydrogen production in the PDSE regime.
1. Introduction
Currently, hydrogen is considered an energy carrier of the future because of its highest specific energy density of about 121 MJ/kg, low environmental impact, and wide range of applications [1,2,3]. Many hydrogen-producing processes exist [4,5], but electrolysis is regarded as the future way to produce green hydrogen using renewable electricity [6].
Plasma-driven solution electrolysis (PDSE) has garnered attention as one of the possible ways to achieve green hydrogen production [7]. DC electrolysis is transformed from its Faradaic regime to the transition regime and then to the PDSE regime with an increase in the applied DC voltage. When the applied DC voltage is high enough, the first plasma discharges are induced in the water-vapor envelope formed around the discharge electrode [8]. Our recent analysis [9] showed that hydrogen is more favorably produced in the cathodic PDSE regime when the discharge electrode is negatively charged compared to the anodic regime.
Hydrogen production in the cathodic PDSE regime of the typical aqueous solutions of electrolytes, such as those of K2CO3, Na2CO3, KOH, NaOH, and H2SO4, has been studied by several research groups. The results of their studies are presented in [10,11,12,13,14,15]. The main objective of those studies was mainly the determination of the hydrogen production parameters at the discharge electrode in the PDSE regime of electrolysis without any comparison with the parameters of hydrogen production in the Faradaic and transition regimes.
Mizuno et al. [16] studied heat balance in the cathodic PDSE regime of 0.2 M K2CO3 aqueous solution at an applied DC voltage between 70 V and 200 V. However, the results obtained in the study contradict the first law of thermodynamics.
Zongcheng et al. [12] studied the chemical yields and energy consumption for hydrogen production in the cathodic PDSE regime of Na2CO3 aqueous solution with an electrical conductivity of 2 mS/cm, varying the applied DC voltage within the range of 50 V to 650 V. In the study, it was shown that water evaporation accounted for much of the power consumed. It was estimated that at an applied DC voltage of 650 V, around 97 % of the total electrical energy consumed in the experiment was spent on water evaporation. However, the study does not give any details regarding the share of the electric energy spent on the heating of the electrolytic solution and the disintegration of the discharge electrode.
Gromov et al. [17] studied the formation of the metal particles and thermal balance of the cathodic PDSE in potassium hydroxide aqueous solutions at an electrolyte concentration in the range of 0.125–0.625 wt%. However, the study does not contain any information about the applied DC voltage at which the thermal balance was analyzed while also varying the electrolyte concentration; the reactor used in the study was an open system, and the shares of the electric energy spent on discharge electrode disintegration and on the production of the gasses at the discharge electrode were not taken into account.
Therefore, the literature review of the experimental results on hydrogen production in the cathodic PDSE regime of a typical electrolytic solution revealed a lack of data regarding hydrogen production parameters in the Faradaic and transition regimes of electrolysis and the proper energy balance analysis of the hydrogen production in the PDSE regime. The lack of these data stimulated us to study (i) the energy yield and rate of hydrogen production in the Faradaic, transition, and PDSE regimes of DC electrolysis with an increase in the applied DC voltage, (ii) the energy balance of hydrogen production in the cathodic PDSE regime of a typical aqueous solution of Na2CO3 while varying the applied DC voltage.
2. Experimental Methods and Setup
2.1. Experimental Setup
The scheme of the experimental setup used in our study of hydrogen production at the discharge electrode in the DC electrolysis of a 10 wt% Na2CO3 aqueous solution, including the Faradaic, transition, and PDSE regimes, is shown in Figure 1.
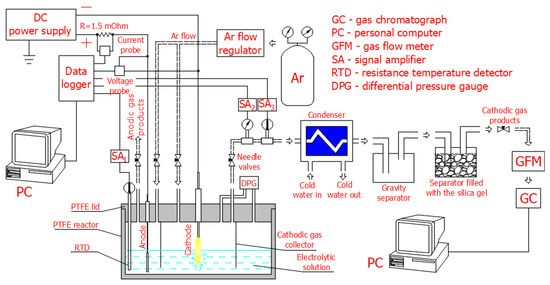
Figure 1.
Scheme of the experimental setup used to study hydrogen production at the discharge electrode in the DC electrolysis of a 10 wt% Na2CO3 aqueous solution in 3 regimes: Faradaic, transition, and PDSE.
The photo of the experimental setup is shown in Figure 2.
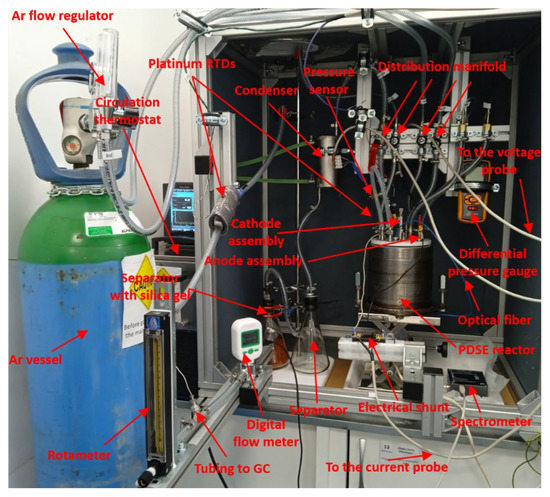
Figure 2.
Photo of the experimental setup.
The internal vessel of the PDSE reactor made of polytetrafluoroethylene (PTFE) was sealed with a PTFE lid and had 2 chambers (the anodic and cathodic) for installing a 25 mm × 70 mm nickel (Ni) foam (Nanografi) anode (see Figure 3a) that served as a counter electrode, and a 2 mm tungsten rod cathode served as a discharge electrode (see Figure 3b). Ni was chosen as the material for the positively charged counter electrode to avoid its anodic dissolution in the electrolytic cell. The foam structure provided the counter electrode with a high active surface area, which prevented plasma formation at the counter electrode. Since the discharge electrode operates at high temperatures in the plasma region, tungsten was chosen as the discharge electrode material.
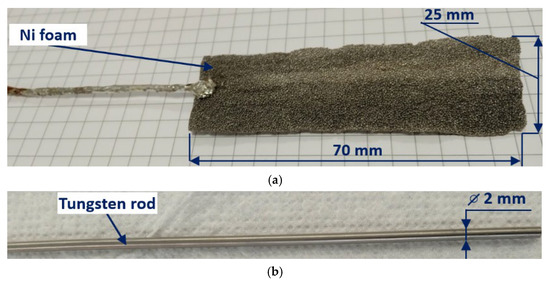
Figure 3.
Ni foam anode (a) and tungsten cathode (b) used in the PDSE reactor.
In the upper part of the PDSE reactor, the chambers were separated from each other by the PTFE cylindrical gas collector. The cathodic chamber with the discharge electrode, at which the electric discharge plasma was initiated, was placed in the center of the PDSE reactor. A 10 mm long part of the discharge electrode and a 45 mm long part of the counter electrode were immersed in a 10 wt% Na2CO3 aqueous solution with an average conductivity of 77.2 mS/cm (at 22 °C).
The DC voltage was supplied from the power source, which consisted of the LTC-300-8D (Rucelf, Kolomna, Russia) variable autotransformer of 2.4 kVA nominal power equipped with a diode bridge and two smoothing capacitors of 16 mF (Kemet, Fort Lauderdale, FL, USA) providing the electrolytic cell with the rippled DC voltage.
The instantaneous discharge voltage was measured using a WAD-A-MAX-608 (Acon, Lismore, Australia) voltage probe, while the instantaneous discharge current was measured using the voltage drop across a resistor of 1.5 mOhm using a WAD-A-MAX-609 (Acon) precision isolation amplifier. All signals of the current and voltage probes were recorded using a WAD-AD12-128H (Acon) data logger. The data acquisition frequency was set at 100 kHz for each probe. The electric energy consumed by the autotransformer of the DC power supply was additionally measured by the KEW 5020 (Kyoritsu, Tokyo, Japan) 3-channel logger.
The PTFE lid also had an insert for installing a HEL-705 (Honeywell, Charlotte, NC, USA) Pt-1000 resistance temperature detector (RTD) to measure the electrolytic solution temperature within the reactor, two fittings for connecting to a GM520 (Benetech, Palo Alto, CA, USA) digital differential pressure gauge (DPG) to measure the pressure difference between the anodic and cathodic chambers, and four fittings with hoses equipped with needle valves to purge the gas products from the anodic and cathodic chambers.
The coiled tube heat exchanger was applied to condense water vapor from the cathodic gas–vapor mixture prior to the measurement of the volume flow rate of the cathodic gas and gas chromatography. Cooling to 0 °C was achieved with a CC-K6 (HUBER) circulation thermostat. Additionally, two separators were installed after the condenser. The first, called the gravity separator, was used to separate droplets of condensate from the cathodic gas flow. The second one was filled with silica gel to absorb moisture from the cathodic gas flow.
The temperature of the cathodic gas–vapor mixture was measured using a HEL-705 (Honeywell) Pt-1000 resistance temperature detector (RTD). The static pressure in the cathodic gas–vapor mixture flow was measured by an IPT-1000 (Institute of Semiconductor Physics, Kyiv, Ukraine) pressure sensor. An MF 5706 (Siargo, Santa Clara, CA, USA) digital volume flow meter was used to measure the flow rate of the cathodic gas. In addition, a rotameter (Aalborg, Orangeburg, NY, USA) was also used to measure the flow rate of the cathodic gas. The data acquisition frequency was set at 1 Hz for the RTDs, the pressure sensor, and the digital flow meter.
The qualitative and quantitative contents of the cathodic gas after the condensate separation and the moisture absorption were measured by an 8610C (SRI Instruments, Bad Honnef, Germany) gas chromatograph (GC) with a thermal conductivity detector (TCD).
The weight of the discharge electrode and the weight of both separators before and after each experiment were measured using AS220.3Y (Radwag, Radom, Poland) analytical scales.
2.2. Experimental Procedure
The PDSE reactor was filled with 1 kg of 10 wt% Na2CO3 aqueous solution and heat insulated. In each experiment, the initial temperature of the aqueous electrolytic solution before applying voltage was 22 °C. Hydrogen production was studied when DC electrolysis transitioned from the Faradaic regime to the PDSE regime as the applied DC voltage increased from 28 V to 226 V with a 28 V step. After setting the applied DC voltage, the values of the instantaneous discharge current and voltage, the electrolytic solution temperature within the PDSE reactor, the pressure and temperature of the cathodic gas–vapor mixture flow, and the flow rate of the cathodic gas were recorded. The content of the produced gas mixture was measured by GC one time in each experiment. The duration of each experiment was 300 s. After data recording was finished, MATLAB 2016b was used to process and present the collected data in graphical representations.
The weight loss of the discharge electrode was measured as the difference between the weights of the discharge electrode before and after each experiment. The amount of water vapor produced by the plasma discharges at the discharge electrode was found from the change in the weight of both separators before and after each experiment.
3. Method of Calculating the Energy Yield and Rate of Hydrogen Production
The total weight of hydrogen produced in the experiment in g was calculated using the formula:
where is the average flow rate of the produced hydrogen in sLpm, is the duration of the experiment in s (), and is the hydrogen density in g(H2)/L under standard conditions. In this study, according to the datasheet of the manufacturer of the digital flow meter, the standard conditions are 20 °C and 101,325 Pa.
The average volume flow rate of the produced hydrogen in sLpm was calculated using the formula:
where is the volume concentration of hydrogen in the cathodic gas measured by GC in vol%, and is the average flow rate of the cathodic gas in sLpm.
The average flow rate of the cathodic gas in sLpm was calculated using the formula:
where is the instantaneous flow rate measured by the digital flow meter in sLpm, is the start of the experiment (), and is the end of the experiment ().
The rate of hydrogen production in g(H2)/h was defined using the formula:
The total electric energy consumption in J was calculated using the formula:
where is the instantaneous discharge current in A, is the instantaneous discharge voltage in V, is the time in s.
The energy yield of hydrogen production in g(H2)/kWh was defined using the following formula:
where is the conversion coefficient of J into kWh.
4. Method of Calculating the Energy Balance of Hydrogen Production in the Cathodic PDSE Regime
To estimate the energy balance, the following assumptions were taken into consideration:
- The PDSE reactor is an adiabatic system, i.e., . There is not any thermal energy exchange with the environment.
- The electric energy supplied to the PDSE reactor is consumed only for (i) heating of the electrolytic solution, (ii) evaporation of the solvent (distilled water), (iii) disintegration (sputtering) of the discharge electrode, (iv) heating of the carrier gas (Ar), and (v) water decomposition.
- In the experiment, the heating of the vessel and lid of the PDSE reactor is negligible because they are made of PTFE, which has a low specific heat capacity.
The change in the total enthalpy of the system in J is defined using the following expression [18]:
where ∆G is the Gibbs free energy (electric energy supplied to the PDSE reactor) in J, and is the heat input from the environment in J.
Since the system is considered adiabatic, i.e., , then . Therefore, the electric energy supplied to the PDSE reactor is consumed only to change the total enthalpy of the system, i.e.:
According to the assumptions given above, we can conclude that the total enthalpy change of the system is defined using the following expression:
where is the enthalpy change of the electrolytic solution in J, is the enthalpy change of solvent evaporation in J, is the enthalpy change of the sputtering of the discharge electrode in J, is the enthalpy change that occurs during Ar heating in J, and is the enthalpy change of water decomposition in J.
The enthalpy change of the electrolytic solution in J is calculated using the following formula:
where is the initial enthalpy of the electrolytic solution in J and is the final enthalpy of the electrolytic solution in J.
The initial and final enthalpies of the electrolytic solution in J are defined using the following expressions:
where is the isobaric specific heat capacity of the electrolytic solution in J/(kg × K), is the weight of the electrolytic solution (), and and are the initial and final temperatures of the electrolytic solution in K, respectively.
The specific heat capacity of the electrolytic solution in J/(kg × K) is defined as an additive property, i.e.:
where is the isobaric specific heat capacity of Na2CO3 in J/(kg × K) [19], is the isobaric specific heat capacity of the solvent (distilled water) in J/(kg × K), and is the weight fraction of the solute ().
For the distilled water, the following function was used to calculate its isobaric specific heat capacity in J/(kg × K) in the temperature range 0–100 °C [20]:
where is the temperature of the electrolytic solution in °C.
The enthalpy change of solvent evaporation in J:
where is the weight of the evaporated solvent (distilled water) in g and is the latent heat of water evaporation in J/g [19].
The weight of the evaporated solvent (distilled water) in g was defined using the formula:
where is the initial weight of the separators (before the experiment) in g and is the final weight of the separators (after the experiment) in g.
The enthalpy change of the disintegration (sputtering) of the discharge electrode in J was calculated using the formula:
where is the weight loss of the discharge electrode in g and is the surface binding energy (SBE) for the sputtering of the discharge electrode material (tungsten) in J/g [21]. In this study, we assume that the disintegration of the discharge electrode is mainly caused by ion bombardment known as a sputtering.
The weight loss of the discharge electrode was calculated using the formula:
where is the initial weight of the discharge electrode (before the experiment) in g and is the final weight of the discharge electrode (after the experiment) in g.
The enthalpy change of the carrier gas (Ar) in J was calculated using the formula:
where is the isobaric molar heat capacity of Ar in J/(mol × K) [19], is the average flow rate of Ar in sLpm, is the initial temperature of Ar in °C (at the inlet of the PDSE reactor), and is the final temperature of Ar in °C (at the outlet of the PDSE reactor).
The average volume flow rate of Ar in sLpm was calculated using the formula:
where is the volume concentration of Ar in the cathodic gas measured by GC in vol%.
The enthalpy change of water decomposition in J:
where is the thermodynamically minimal energy consumption for the formation of one hydrogen mole in the water decomposition reaction (equal to the standard enthalpy of water), [22].
Using the formulae given above, we can determine the enthalpies consumed for the heating of the electrolytic solution (), the evaporation of the electrolytic solution (), the sputtering of the discharge electrode (), the heating of the carrier gas (), and water decomposition ().
5. Results and Discussion
5.1. Hydrogen Production
In our previous experimental study [8] on the transformation of the DC electrolysis of a 10 wt% Na2CO3 aqueous solution from its Faradaic regime to the cathodic PDSE regime by increasing the applied DC voltage, we found values of the breakdown voltage and discharge onset voltage indicating the origin of the three regimes of DC electrolysis, i.e., the Faradaic, transition, and PDSE regimes. With respect to the experimental conditions described in [8], they were 59 V and 74 V (corresponding to 42 V and 52 V of the RMS applied AC voltage mentioned in [8]). In other words, the Faradaic electrolysis occurred at the discharge electrode when the applied DC voltage was below 59 V. When the applied voltage was between 59 V and 74 V, the transition phase existed. When the applied voltage exceeded 74 V, the PDSE regime formed around the discharge electrode. As the present experiment was very similar to that described in [8], we assumed that values of the breakdown voltage of 59 V and values of the discharge onset voltage of 74 V on the I(V) characteristic were the same in both experiments.
Figure 4 shows the influence of the applied DC voltage on the energy yield and rate of hydrogen production in the electrolysis of a 10 wt% Na2CO3 aqueous solution in the Faradaic (marked I), transition (marked II), and PDSE regimes (marked III).
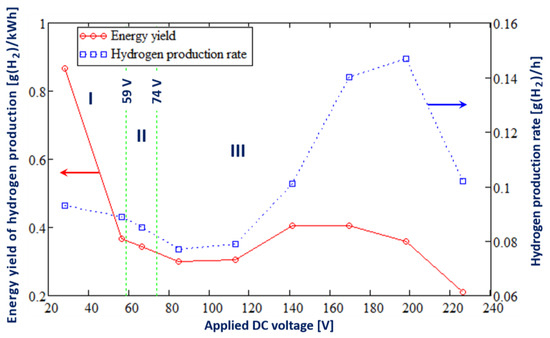
Figure 4.
Influence of the applied DC voltage on the energy yield and rate of hydrogen production in the DC electrolysis of a 10 wt% Na2CO3 aqueous solution for 3 regimes: the Faradaic (marked I), transition (marked II), and PDSE (marked III) regimes.
As seen in Figure 4, in the Faradaic regime of electrolysis, an increase in the applied DC voltage from 28 V to 57 V leads to a drop in the hydrogen production rate from 0.093 to 0.089 g(H2)/h. Further increasing the applied DC voltage to 66 V results in the transformation of the Faradaic regime of electrolysis to the transition regime, in which the formation of the gas-vapor envelope around the discharge electrode occurs due to electrochemical water splitting and solvent (water) evaporation due to Joule heating. In the transition region of electrolysis at an applied DC voltage of 66 V, the hydrogen production rate was 0.085 g(H2)/h, which is lower than that in the Faradaic regime. At the applied DC voltage of 74 V, the first plasma discharges are initiated in the vicinity of the discharge electrode, and the PDSE regime of electrolysis begins. The subsequent increase in the applied DC voltage up to 85 V leads to a drop in the hydrogen production rate. Thus, at an applied DC voltage of 85 V, the hydrogen production rate is 0.077 g(H2)/h. Further increases in the applied voltage result in a rising hydrogen production rate. At an applied DC voltage of 198 V, the highest hydrogen production rate of 0.147 g(H2)/h is achieved in the PDSE regime of electrolysis. At an applied DC voltage higher than 198 V, the hydrogen production rate decreases.
In the Faradaic regime of electrolysis, an increase in the applied voltage from 28 to 57 V results in a considerable decrease in the energy yield of hydrogen production, from 0.867 g(H2)/kWh to 0.367 g(H2)/kWh. This can be explained by the increase in the electric current at the discharge electrode with increasing applied DC voltage. In the transition phase at an applied DC voltage of 66 V, we observe a further drop in the energy yield of hydrogen production to 0.299 g(H2)/kWh. The subsequent increase in the applied DC voltage leads to the formation of the plasma discharges at the discharge electrode. In the PDSE regime of electrolysis, the energy yield of hydrogen production reaches its maximal value of 0.405 g(H2)/kWh at an applied DC voltage of around 141–170 V and then decreases.
Figure 5 shows the change in the composition of the gas mixture evolved from the discharge electrode with increases in the applied DC voltage.
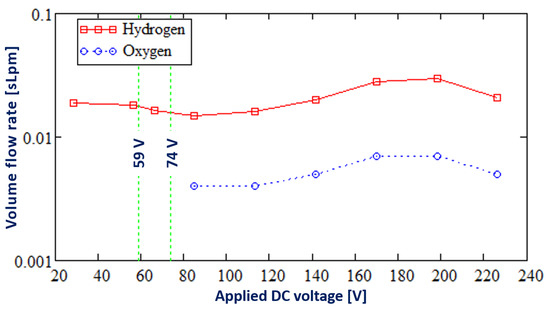
Figure 5.
The composition of the gas mixture evolved from the discharge electrode.
As seen in Figure 5, only hydrogen is produced at the discharge electrode in the Faradaic and transition regimes of DC electrolysis when the applied DC voltage is below 74 V. In the PDSE regime of electrolysis, apart from hydrogen, oxygen also evolved from the discharge electrode as a result of the water splitting by the plasma discharges. In the PDSE regime, the ratio of hydrogen to oxygen corresponds to the stoichiometric ratio of the water-splitting reaction, i.e., two moles of hydrogen over one mole of oxygen.
5.2. Energy Balance Analysis
Figure 6 shows the weight loss of the discharge electrode as a function of the applied DC voltage.
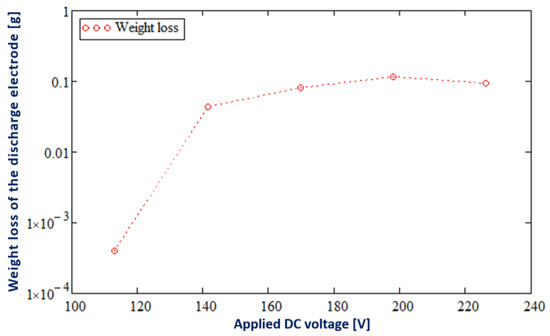
Figure 6.
The weight loss of the tungsten discharge electrode as a function of the applied DC voltage in the cathodic PDSE regime of the DC electrolysis of a 10 wt% Na2CO3 aqueous solution.
As seen in Figure 6, the mass loss of the discharge electrode increases exponentially with the increase in the applied DC voltage, especially at an applied DC voltage higher than 113 V. When the applied DC voltage is lower than 113 V, the weight loss of the discharge electrode is zero. Thus, the highest value of the mass loss is around 0.1168 g at 198 V. A sputtered discharge electrode underwent weight loss with similar exponential characteristics in [23].
Results of the energy balance analysis of the hydrogen production in the cathodic PDSE regime of electrolysis of a 10 wt% Na2CO3 aqueous solution at an applied DC voltage in the range of 85 V to 226 V are presented in Table 1.

Table 1.
Results of the energy balance study of the hydrogen production in the cathodic PDSE regime of electrolysis of a 10 wt% Na2CO3 aqueous solution at an applied voltage in the range of 85 to 226 V. Shares of the total electrical energy () consumed for the electrolytic solution heating (), the electrolytic solution evaporation (), the sputtering of the discharge electrode (), the carrier gas heating (), and the water decomposition ().
As seen from Table 1, around 34–43% of the electric energy supplied to the electrodes is spent on the heating of the electrolytic solution (). The majority of the rest of the energy, from around 56% to 64%, is spent on the evaporation of the electrolytic solution. The discharge electrode also loses its weight due to sputtering. The highest share of the total energy spent on sputtering constitutes 0.44% at an applied DC voltage of 198 V. The electric energy consumed for the heating of the carrier gas (Ar) is less than 0.23%. The electric energy consumed for hydrogen production in the cathodic PDSE regime is 1.61% at an applied DC voltage of 141–170 V.
The energy balance analysis showed that more than 98% of the supplied electrical energy is spent on heat generation. That is why the share of the total energy spent on hydrogen production in the cathodic PDSE regime constitutes only 1.61%.
The energy balance analysis carried out in this work suggests that to increase the share of the total energy spent on hydrogen production in the cathodic PDSE regime, preheating of the electrolytic solution should be done using an inexpensive heat source (e.g., solar heat, the waste heat of industrial processes, etc.). Because most energy during the cathodic PDSE goes towards heating and evaporation of the aqueous electrolytic solution, the use of PDSE for hydrogen production should be cost-effective when electrolytic solutions with the so-called organic liquid hydrogen carriers such as alcohols are used instead of the typical electrolytic solutions. As shown in our previous studies [24,25], the presence of alcohols in the electrolytic solution has a positive effect on the main parameters of hydrogen production in the PDSE regime of electrolysis because of the following reasons:
- The high hydrogen content;
- The alcohols have low boiling temperatures;
- Hydrogen production by the thermal decomposition of the alcohols occurs at a lower temperature compared to the direct thermal decomposition of water;
- The alcohols have a low enthalpy of vaporization;
- The alcohols have lower Gibbs free energies compared to water.
6. Conclusions
The hydrogen production in the DC electrolysis (including Faradaic, transition, and PDSE regimes) of a 10 wt% Na2CO3 aqueous solution was studied and the following conclusions can be drawn:
- In the cathodic PDSE regime of electrolysis of a 10 wt% Na2CO3 aqueous solution, the highest energy yield of hydrogen production was 0.405 g(H2)/kWh at an applied DC voltage of 141–170 V. In contrast, the highest hydrogen production rate of 0.147 g(H2)/h was received at an applied voltage of 198 V.
- Only hydrogen is produced at the discharge electrode in the Faradaic and transition regimes of electrolysis at an applied DC voltage below 74 V. In the PDSE regime of electrolysis when the applied DC voltage is higher than 74 V, oxygen also evolved from the discharge electrode.
- The energy balance analysis of the hydrogen production in the cathodic PDSE regime showed that more than 98% of the supplied electrical energy is spent on heat generation. For this reason, the share of the total energy consumed for hydrogen production in the cathodic PDSE regime is only 1.61%.
- Because the main effect of the cathodic PDSE regime of electrolysis is heat generation, this regime of electrolysis can be beneficial for hydrogen production from the electrolytic solutions containing so-called organic liquid hydrogen carriers such as alcohols that have lower boiling temperatures, lower heats of evaporation, lower standard Gibbs free energies, and higher hydrogen contents compared to the typical aqueous electrolytic solutions.
Author Contributions
Conceptualization, S.B. and J.M.; methodology, S.B. and J.M; formal analysis, S.B. and J.M.; investigation, S.B. and J.M.; writing—original draft preparation, S.B. and J.M.; writing—review and editing, S.B. and J.M.; visualization, S.B.; supervision, J.M.; project administration, J.M.; funding acquisition, S.B. and J.M. All authors have read and agreed to the published version of the manuscript.
Funding
The project was financed within the program of the Ministry of Science and Higher Education called “Regionalna Inicjatywa Doskonałości” in the years 2019–2022; the project number was 006/RID/2018/19 and the sum of financing was PLN 11,870,000. Sergii Bespalko would like to thank the Polish National Agency for Academic Exchange (NAWA) for the funding under the Ulam Program—Seal of Excellence (the grant agreement no. PPN/SEL/2020/1/00004/U/00001).
Data Availability Statement
Not applicable.
Conflicts of Interest
The authors declare no conflict of interest.
Acronyms
| AC | alternating current |
| CGDE | contact glow discharge electrolysis |
| DC | direct current |
| DPG | differential pressure gauge |
| GC | gas chromatograph |
| GFM | gas flow meter |
| PC | personal computer |
| PDSE | plasma-driven solution electrolysis |
| PTFE | polytetrafluoroethylene |
| RMS | root-mean-square |
| RTD | resistance temperature detector |
| SA | signal amplifier |
| SBE | surface binding energy |
| sLpm | standard liter per minute |
| TCD | thermal conductivity detector |
References
- Rivard, E.; Trudeau, M.; Zaghib, K. Hydrogen Storage for Mobility: A Review. Materials 2019, 12, 1973. [Google Scholar] [CrossRef] [PubMed]
- Jovan, D.J.; Dolanc, G. Can Green Hydrogen Production Be Economically Viable under Current Market Conditions. Energies 2020, 13, 6599. [Google Scholar] [CrossRef]
- Rosen, M.A.; Koohi-Fayegh, S. The prospects for hydrogen as an energy carrier: An overview of hydrogen energy and hydrogen energy systems. Energy Ecol. Environ. 2016, 1, 10–29. [Google Scholar] [CrossRef]
- Kochański, M.; Korczak, K.; Dybiński, O.; Kwas, M.; Osipowicz, K.; Patejuk, A.; Sawicka, A.; Swoczyna, B. The technical and economical perspectives for the production and storage of hydrogen in Poland. Acta Innov. 2013, 8, 50–62. Available online: https://www.proakademia.eu/en/acta-innovations/find-issueskw/all-articles2013-8/the-technical-and-economical-perspectives-for-the-production-and/ (accessed on 18 November 2022).
- Lamb, J.J.; Hillestad, M.; Rytter, E.; Bock, R.; Nordgård, A.S.; Lien, K.M.; Burheim, O.S.; Pollet, B.G. Chapter 3-Traditional Routes for Hydrogen Production and Carbon Conversion. In Hydrogen and Fuel Cells Primers, Hydrogen, Biomass and Bioenergy; Lamb, J.J., Pollet, B.G., Eds.; Academic Press: Cambridge, MA, USA, 2020; pp. 21–53. [Google Scholar] [CrossRef]
- Peterssen, F.; Schlemminger, M.; Lohr, C.; Niepelt, R.; Bensmann, A.; Hanke-Rauschenbach, R.; Brendel, R. Hydrogen supply scenarios for a climate neutral energy system in Germany. Int. J. Hydrogen Energy 2022, 47, 13515–13523. [Google Scholar] [CrossRef]
- Gupta, S.K. Contact Glow Discharge Electrolysis: A Novel Tool for Manifold Applications. Plasma Chem. Plasma Process. 2017, 37, 897–945. [Google Scholar] [CrossRef]
- Bespalko, S.; Mizeraczyk, J. The plasma discharges in the anodic and cathodic regimes of plasma driven solution electrolysis for hydrogen production. Przegląd Elektrotechniczny 2022, 98, 122–125. [Google Scholar] [CrossRef]
- Bespalko, S.; Mizeraczyk, J. Overview of the Hydrogen Production by Plasma-Driven Solution Electrolysis. Energies 2022, 15, 7508. [Google Scholar] [CrossRef]
- Toth, J.R.; Hawtof, R.; Matthiesen, D.; Renner, J.; Sankaran, R.M. On the non-faradaic hydrogen gas evolution from electrolytic reactions at the interface of a cathodic atmospheric-pressure microplasma and liquid water surface. J. Electrochem. Soc. 2020, 167, 116504. [Google Scholar] [CrossRef]
- Mizuno, T.; Akimoto, T.; Azumi, K.; Ohmori, T.; Aoki, Y.; Takahashi, A. Hydrogen Evolution by Plasma Electrolysis in Aqueous Solution. Jpn. J. Appl. Phys. 2005, 44, 396–401. [Google Scholar] [CrossRef]
- Yan, Z.C.; Li, C.; Lin, W. Experimental study of plasma under-liquid electrolysis in hydrogen generation. Chin. J. Process Eng. 2006, 6, 396–401. Available online: https://cybercemetery.unt.edu/archive/brc/20120621021503/http:/www.jproeng.com/qikan/manage/wenzhang/206517.pdf (accessed on 18 November 2022).
- Saksono, N.; Feryansyah, R.; Bismo, S. Hydrogen production using non-thermal plasma electrolysis in KOH solution. Proceeding of the 12th International Conference on QiR (Quality in Research), Bali, Indonesia, 4–7 July 2011; pp. 112–118. [Google Scholar]
- Saksono, N.; Ma’arif, M.F.; Faiz, M.B.; Bismo, S. Hydrogen production system with plasma electrolysis method in natrium carbonate-acetate acid solution. Proceeding the Regional Conference on Chemical Engineering 2014, Yogyakarta, Indonesia, 2–3 December 2014; pp. 1–10. [Google Scholar]
- Saksono, N.; Kartohardjono, S.; Yuniawati, T. High performance plasma electrolysis reactor for hydrogen generation using a NaOH-methanol solution. Int. J. Technol. 2016, 7, 1421–1429. [Google Scholar] [CrossRef][Green Version]
- Mizuno, T.; Ohmori, T.; Akimoto, T.; Takahashi, A. Production of Heat during Plasma Electrolysis in Liquid. Jpn. J. Appl. Phys. 2000, 39, 6055. [Google Scholar] [CrossRef]
- Gromov, A.A.; Nalivaiko, A.Y.; Fehn, T.; Yahya, D.P.; Osipenkova, A.A.; Koleczko, A.; Knapp, S.; Teipel, U.D. Cathode plasma electrolysis in diluted potassium hydroxide solutions: Particles formation and energetic estimation. J. Electroanal. Chem. 2019, 844, 155–160. [Google Scholar] [CrossRef]
- Klein, S.; Nellis, G. Thermodynamics; Cambridge University Press: Cambridge, UK, 2012. [Google Scholar] [CrossRef]
- Linstrom, P. NIST Chemistry WebBook-SRD 69, National Institute of Standards and Technology. 2017. Available online: https://webbook.nist.gov/chemistry (accessed on 18 November 2022).
- Zaytsev, I.D.; Aseyev, M.A. Physical and Chemical Properties of Binary and Multicomponent Solutions of Inorganic Substances; Khimiya: Moscow, Russia, 1988. [Google Scholar]
- Yang, X.; Hassanein, A. Atomic scale calculations of tungsten surface binding energy and beryllium-induced tungsten sputtering. Appl. Surf. Sci. 2014, 293, 187–190. [Google Scholar] [CrossRef]
- Active Thermochemical Tables. Argonne National Laboratory. Available online: https://atct.anl.gov/Thermochemical%20Data/version%201.118/index.php (accessed on 18 November 2022).
- Feldman, J.M.; Williams, E.M. Electrode sputtering in high pressure electric discharges. Appl. Sci. Res. Sect. B 1962, 10, 7–22. [Google Scholar] [CrossRef]
- Mizeraczyk, J.; Urashima, K.; Jasiński, M.; Dors, M. Hydrogen production from gaseous fuels by plasmas-A review. Int. J. Plasma Environ. Sci. Technol. 2014, 8, 89–97. [Google Scholar]
- Mizeraczyk, J.; Jasiński, M. Plasma processing methods for hydrogen production. Eur. Phys. J. Appl. Phys. 2016, 75, 24702. [Google Scholar] [CrossRef]
Publisher’s Note: MDPI stays neutral with regard to jurisdictional claims in published maps and institutional affiliations. |
© 2022 by the authors. Licensee MDPI, Basel, Switzerland. This article is an open access article distributed under the terms and conditions of the Creative Commons Attribution (CC BY) license (https://creativecommons.org/licenses/by/4.0/).