Article

Is China’s Natural Gas Consumption Converging? Empirical Research Based on Spatial Econometrics

1
China Energy Investment Corporation, Beijing 100011, China
2
School of Economics and Management, China University of Geosciences (Wuhan), Wuhan 430074, China
*
Author to whom correspondence should be addressed.
Energies 2022, 15(24), 9448; https://doi.org/10.3390/en15249448
Submission received: 24 August 2022 / Revised: 4 December 2022 / Accepted: 12 December 2022 / Published: 13 December 2022
(This article belongs to the Special Issue New Insights into Energy Economics and Sustainable Development)

Abstract

:
Excessive regional differences in energy consumption have led to inequality and energy poverty. It is essential to clarify the factors of energy consumption convergence to solve this problem. We use the spatial convergence model to analyze the convergence characteristics and conditions of China’s natural gas consumption from 2005 to 2017. The results of spatial absolute convergence show that there is absolute convergence of natural gas consumption in China, and the economic competition among provinces slightly hinders the convergence. Furthermore, based on the spatial Durbin model and the spatial conditional convergence model, we found that insufficient pipe network construction and the price difference caused by provincial borders are the main factors hindering the flow of natural gas, which also restricts the spatial convergence of natural gas consumption. The development of the tertiary industry and the improvement of purchasing power will help accelerate the convergence of natural gas consumption. This research not only evaluates the spatial convergence of China’s natural gas consumption for the first time, but also provides an analytical idea for formulating policies to eliminate poverty in energy consumption.

1. Introduction

In recent decades, China’s natural gas market has achieved miraculous growth, with the consumption reaching 300 billion cubic meters (bcm) [1] in 2020. Behind the rapid growth of consumption is the potential problem of regional allocation imbalance [2], which may result in energy poverty [3], energy efficiency decline [4], and energy misallocation [5]. China has tried to alleviate the imbalance of natural gas through a series of measures, such as large-scale cross-regional pipe network construction, third-party access and price regulation [6,7]. However, as the world’s fastest growing natural gas consumer, China is often investigated on the driving force of rapid growth [8]. Scholars have ignored the significance of the regional imbalance problem behind China’s rapid growth to the world’s fair energy distribution. There is no research to investigate whether China’s natural gas consumption is gradually moving towards regional balance, much less whether China’s natural gas consumption converges or not and how fast it converges, which has not been answered. Answering these questions about China’s natural gas market will provide valuable experience and guidance for other countries.
Many scholars pay attention to the temporal–spatial evolution and influencing factors of natural gas consumption, which provide some indirect evidence for whether China’s natural gas consumption tends to converge. Wang and Lin (2017) applied panel unit root and heterogeneous panel cointegration methods to investigate influencing factors of China’s natural gas consumption. They found that the gas population rate plays a more important role in gas consumption in the long run and the impact of GDP weakens it [9]. Jiang et al. (2020) further studied the driving factors of natural gas consumption in China and found that there was obvious regional heterogeneity in the effects of different factors [10]. Zhao et al. (2020) found that environmental regulation policy can potentially increase natural gas consumption, but the policy effect is not significant in coal-based areas, which leads to a regional imbalance of natural gas consumption [11]. Tu and Rasoulinezhad (2021) also highlighted positive effects of green bond policy on energy efficiency [12]. The above research mainly analyzes the changing rules and spatial differences of natural gas consumption from local factors, such as regional industrial structure, energy consumption structure, urbanization rate, policy regulation, etc. However, this kind of analysis obviously regards regions as independent spatial units, ignoring that the interaction between regions is also an important factor affecting the energy flow and allocation pattern.
Some scholars’ research has preliminarily discovered the spatial spillover effect of natural gas consumption, potentially revealing the influence of regional spatial correlation on the spatial pattern of natural gas consumption. Bu et al. (2020) used social network analysis (SNA) and logarithmic mean Divisia index (LMDI) methods, finding that there were spillover effects between China’s regional natural gas consumption [13]. What is more, the economy is the main driving factor of gas consumption. Wang et al. (2020a) further analyzed the mechanism of spatial spillover of natural gas consumption from the spatial interaction of environmental regulation policies and found that environmental regulation would promote local natural gas consumption by affecting regional characteristics, such as industry and energy consumption, and then indirectly affect the consumption of surrounding areas under the total amount constraint [2]. Curtis et al. (2020) also found that residents’ choice of natural gas is influenced by the distance between their place of residence and the gas network, which reveals the influence of the network layout and the spatial matching of consumers’ location on natural gas consumption [14]. The spatial correlation and spatial spillover of regional economy and society will promote the agglomeration or diffusion of natural gas consumption in geographical space, thus affecting the consumption pattern. Therefore, from this perspective, it is necessary to evaluate the regional natural gas consumption gap and convergence trend from the objective reality of the spatial interaction between regions.
Although there is no research to incorporate spatial convergence analysis into the study of natural gas consumption imbalance, we can still learn from the literature on spatial differences of energy efficiency and the spatial convergence of energy consumption. A large number of studies have applied convergence theory to the fairness of energy consumption and the steady state of consumption growth. For example, Shi et al. (2020) investigated the convergence and dynamics of household energy consumption in China, which found that Chinese households have two convergence clubs [15]. Akram et al. (2020) examined the stochastic conditional convergence energy consumption in India. The results showed that the convergence characteristics of different energy varieties and different consumption sectors are quite different [16]. Mohammadi and Ram (2017), Hao and Peng (2017), and Kounetas (2018) had also performed similar research [17,18,19]. The above research is basically based on the classical convergence model and has not considered the important influence of regional spatial correlation on regional differences in energy consumption. Xu and Klaiber (2019) provided empirical evidence for spatial convergence analysis from the perspective of pipe network spatial correlation [20]. Cheng et al. (2020) and Castellanos-Sosa et al. (2022) provided us with the model support for spatial convergence analysis [21,22].
To sum up, the imbalance of natural gas consumption among regions not only comes from the difference of local economic and social development, but is also affected by the spatial correlation and spillover effect of regional economic and social development, and there may be a typical convergence of spatial conditions. As Zhao et al. (2022) pointed out in the research of wind energy consumption prediction, energy consumption evaluation is very sensitive to model setting and estimation methods [23]. Therefore, when evaluating whether China’s natural gas consumption tends to converge and how fast it converges, the spatial correlation factor should also be taken into account, which implies that the spatial convergence model will revise the biased estimation of the non-spatial convergence model [24]. In view of this, this paper has the following three contributions: (1) This paper is the first study to investigate spatial convergence natural gas consumption in China. It provides a reference for China to objectively understand the current situation of natural gas consumption, and also provides a certain decision-making basis for improving regional imbalance. (2) The regional geographical correlation and economic correlation are included in the convergence analysis to study whether there is absolute convergence of China’s natural gas consumption under the condition of spatial correlation, and how fast it converges. (3) Based on the spatial econometric model, we comprehensively analyze the driving factors of China’s natural gas consumption, and then evaluate whether there is a conditional convergence of China’s natural gas consumption under various economic and social constraints.

2. Institutional Background

China’s environmental governance goals and energy transformation demands emphasize more natural gas use. The provinces are caught in the homogeneous increase of natural gas demand [2]. The result of uncoordinated resource competition is that natural gas flows to the provinces with stronger purchasing power, but not to the provinces with shortage [25]. This inevitably gathers resources to areas with a higher economic level, exacerbates the imbalance of resource allocation, and forms the “Matthew effect” [26]. Meanwhile, the competition of provinces and network connection implied that the spatial spillover of consumption could not be ignored [2,13,24]. The imbalance of gas allocation in China is typical, reflecting that the lack of a reasonable distribution institution in countries that rely on imported natural gas will lead to unfair resource allocation. From this perspective, the investigation of China’s gas consumption convergence is universal.

3. Spatial Characteristics and Correlation of Natural Gas Consumption in China

3.1. Temporal and Spatial Evolution Analysis of Natural Gas Consumption

From 2005 to 2017, the consumption of natural gas in China’s provinces increased significantly, and it had obvious characteristics of the spatial dependence on the pipe network, as shown in Figure 1. Before and after several key time nodes, such as 2004 (the West First Line was put into operation), 2010 (the Sichuan-East Gas Transmission Line was put into operation), and 2013–2014 (the West Second Line and the West Third Line were put into operation, and the China–Myanmar Line was officially ventilated), the natural gas consumption in related areas was greatly increased, reflecting that China’s natural gas consumption extends along the pipe network in space, forming a zonal or arc distribution across regions. Specifically, natural gas consumption has generally formed a “W-shaped” distribution in space, with Xinjiang, Heilongjiang-Sichuan and Pearl River Delta as the “peak” and the middle area as the “valley”. This typical “center-periphery” system shows that China’s natural gas consumption has a “concentrated shadow” in space, and the imbalance phenomenon is fully reflected. Locally, China’s natural gas consumption shows a variety of forms, such as “single peak” (Xinjiang), “spindle” (north-south) and “dumbbell” (Beijing-Tianjin-Hebei-Pearl River Delta, Xinjiang-Beijing-Tianjin-Hebei, Xinjiang-Pearl River Delta), which are typical “club” clusters. This implies that natural gas consumption is spatially related, and a consumption cluster is formed in the process of consumption growth.
The gathering process of natural gas consumption in China can be divided into three stages. In the first stage, the west line was initially built, and the cross-regional consumption pattern from Xinjiang to the east was formed by relying on pipelines. In the second stage, the pipeline network developed rapidly, the branch line was gradually improved, and natural gas consumption showed the characteristics of local diffusion. In the third stage, the deepening of the economic gap led to the enhancement of the polarization effect of natural gas consumption in Beijing, Jiangsu, Zhejiang, Shanghai, Sichuan and Chongqing, and other areas with better economic development, forming a gas consumption agglomeration pattern centered on several major economies. The close relationship between natural gas consumption and economic and social development indicates that natural gas consumption will not only form agglomeration in geographical space, but also form cross-regional natural gas consumption competition under the background of cross-regional economic competition.

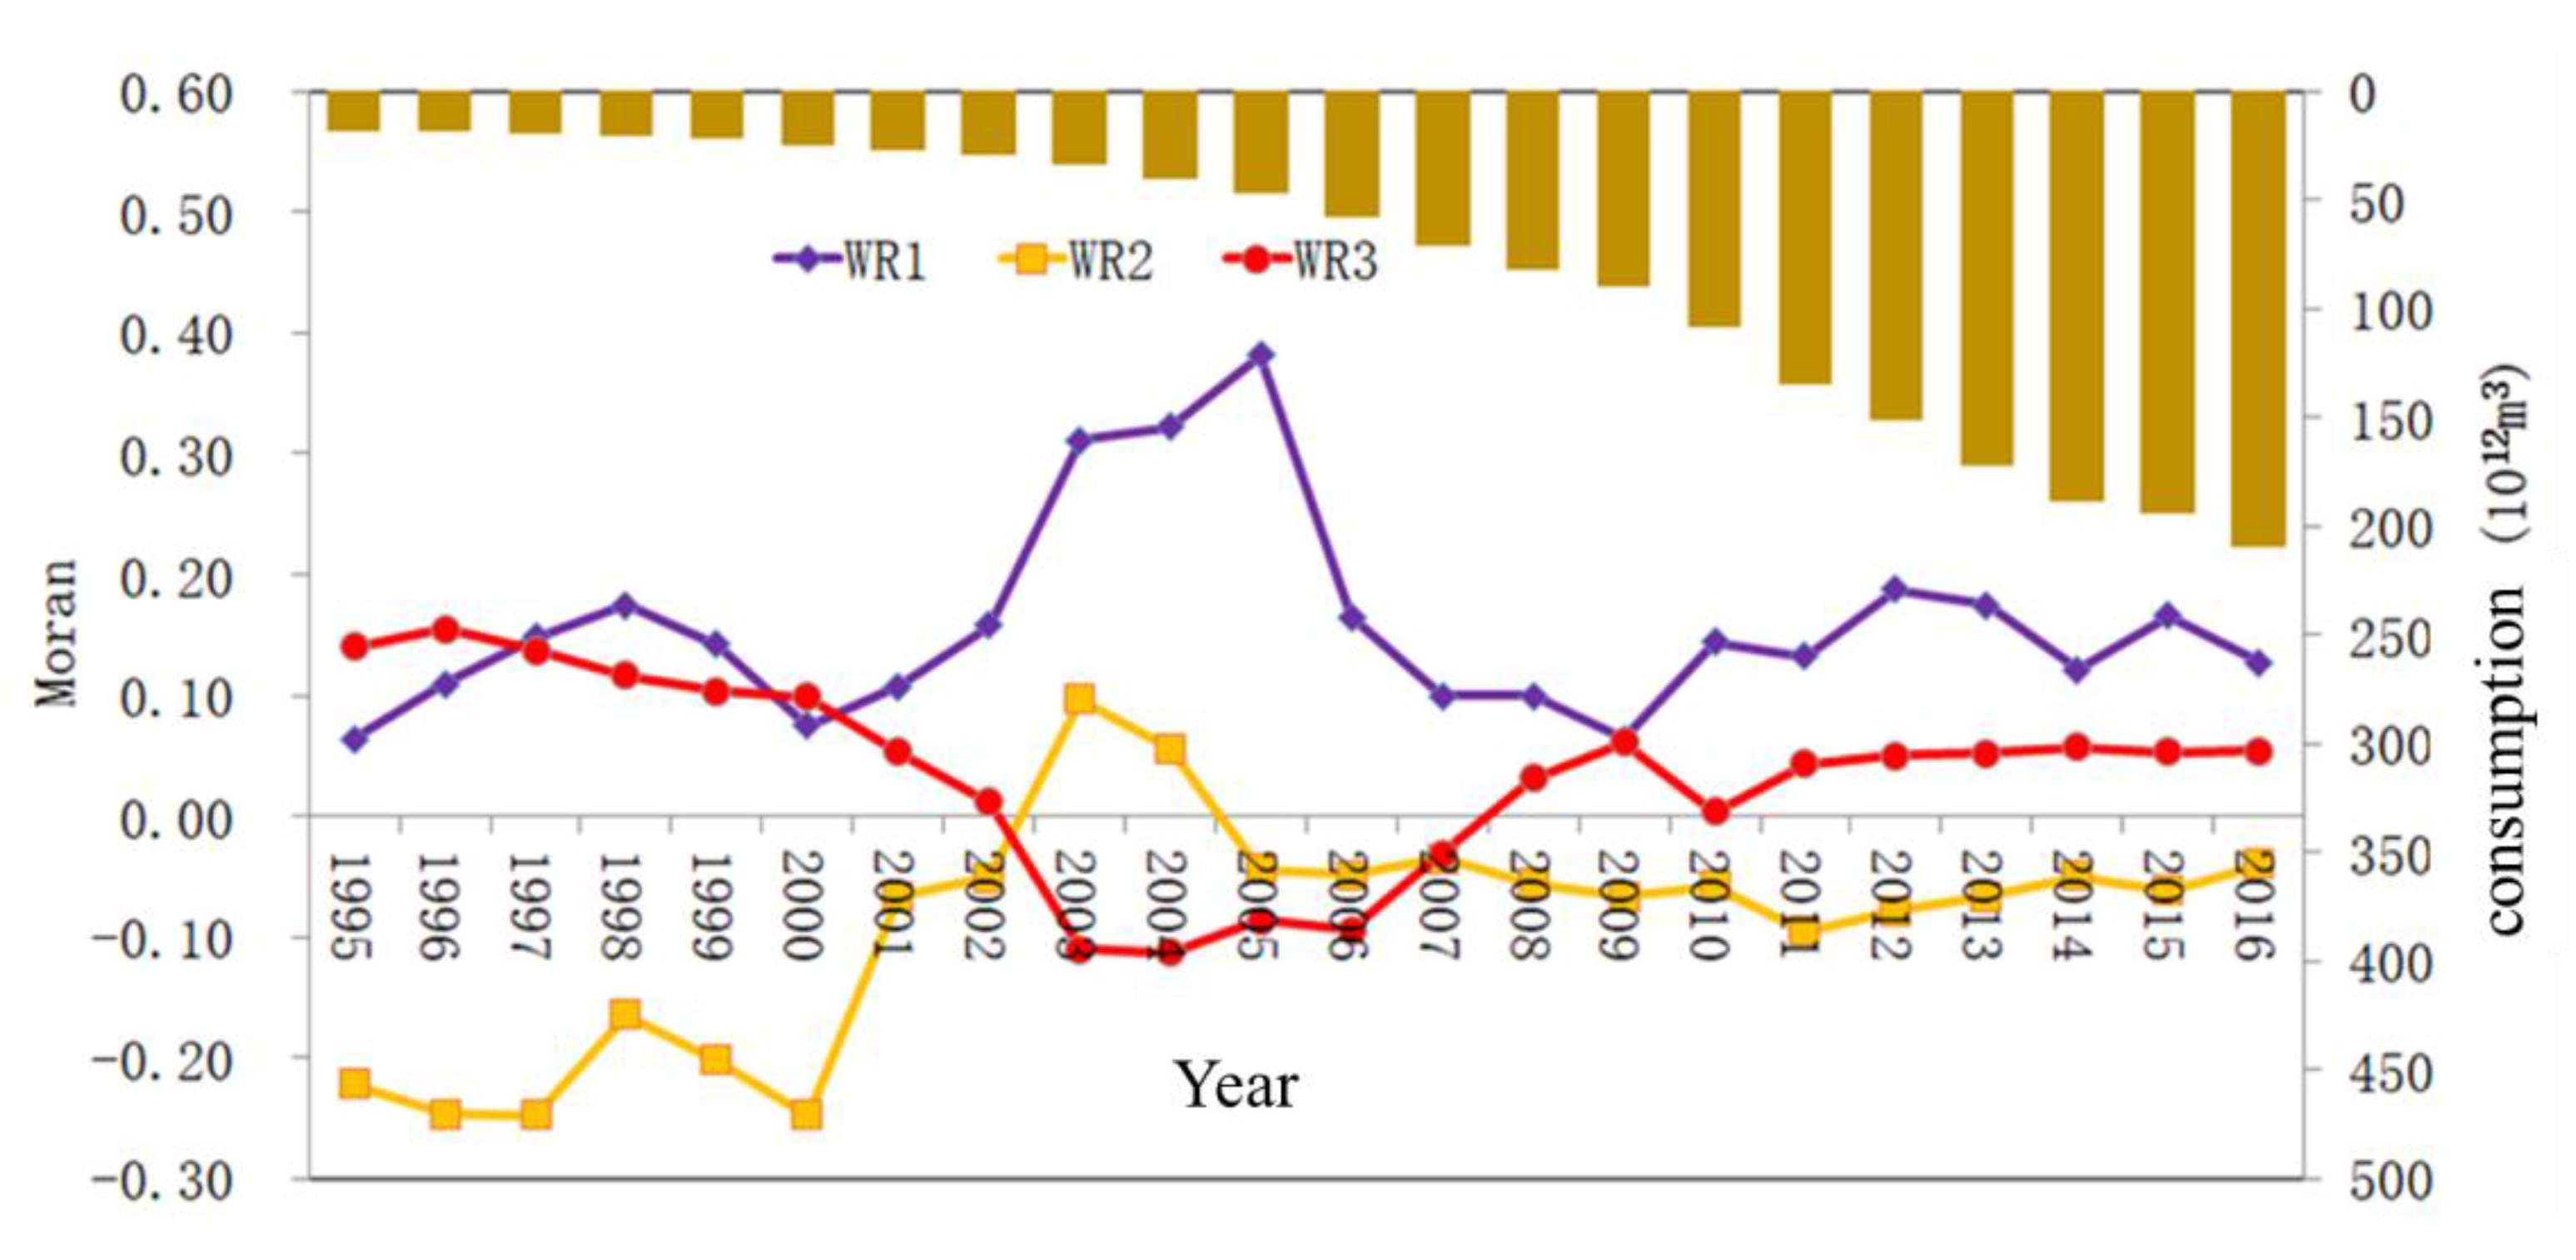
3.2. Spatial Correlation Analysis of Natural Gas Consumption

From the above-mentioned basic characteristics of the temporal and spatial evolution of natural gas, it has been preliminarily found that there is spatial correlation in natural gas consumption. We further describe the degree of spatial correlation based on the Moran’I index [27]. The Moran’I index can be measured as follows:
M o r a n I = n S 0   z i W z j z i z i
where n is the number of regions, and zi and zj are the normalized value of the natural gas consumption of province i and j, respectively. W represents an n by n spatial weight matrix, which will be introduced as follows: S0 is the sum of the elements of the weight matrix.
We have constructed the first-order (WR1), second-order (WR2), and third-order (WR3) spatial weight matrixes to observe the spatial correlation of natural gas consumption between neighbors and cross-regions, as shown in Figure 2. First-order denotes the connection of a province and its neighbor. Second-order denotes the connection of a province and its neighbors’ neighbor. Third-order can be explained in the same way. These three Moran’I indexes help us to examine global and local spatial patterns of natural gas consumption [28].
On the whole, the Moran’I index of the three matrices tends to be stable in fluctuation. Among them, the Moran index of neighboring provinces (first-order) has always been greater than 0, which indicates that the natural gas consumption among neighboring regions has a long-term positive correlation, which is also the embodiment of consumption spatial agglomeration. The second-order Moran index and the third-order Moran index are opposite, indicating that the second-order neighbors are often “depressions” for consumption in space. The Moran index reveals that China’s natural gas consumption has obvious “core-edge” and polarized consumption characteristics from the perspective of average correlation, and this pattern tends to be stable after 2010, which suggests that China’s natural gas consumption may be moving towards spatial convergence. However, the simple Moran index analysis cannot analyze the convergence speed and internal driving force of consumption space, and it also does not examine the internal dependence between natural gas consumption and economic cross-regional spatial correlation. Next, based on the complete convergence model, we analyzed the convergence characteristics and convergence conditions of China’s natural gas consumption under different spatial matrices.

4. Absolute Spatial Convergence of Natural Gas Consumption in China

4.1. Model of Absolute Spatial Convergence

In the new classical economics, the declining property of marginal return determines that there is an objective law of convergence of economic development among regions with different economic levels, and the regional economic level determines the energy consumption, which makes the energy consumption in different regions tend to converge. The β convergence is divided into absolute convergence and conditional convergence. The difference between the two lies in whether the influence of regional economic and social characteristics on convergence is considered. Absolute convergence only considers the initial state of an attribute in different regions, while conditional convergence holds that different economies not only have different initial endowments, but also have significant differences in structural characteristics in the development process, and the steady-state conditions after convergence are also different. In spatial convergence based on classical convergence theory, the spatial lag variable is introduced to judge whether the region will converge in space. The spatial absolute convergence model is as follows:
γ i , t + T = α β ln ( E i t ) + ρ W k γ i , t + T + μ i + η t + ε i t , ε i t N ( 0 , σ 2 )
where γ i , t + T = ln ( E i , t + T / E i t ) / T , E i , t + T and E i t represent natural gas consumption in year t + T and t of province i, respectively. β > 0 indicates that there is absolute convergence. The convergence rate r = ln ( 1 β ) / T . Coefficient ρ indicates the spatial interaction between provinces. W k are different kinds of spatial matrixes, which include an adjacent matrix (W1), a geographic distance matrix (W2) and an economic geographic matrix (W3). α is a constant term. μ i denotes the provincial fixed effect and η t denotes a time fixed effect. ε i t is an error term. Particularly, W2 and W3 are constructed as follows:
W 2 = 1 / d i j   ( i j )
where dij indicates the geographic distance between province i and j.
W 3 = W 2 d i a g ( X 1 ¯ / X ¯ , X 2 ¯ / X ¯ , , X n ¯ / X ¯ )
where X i ¯ in the diagonal matrix represents the average economic output value of province i in period T, and X ¯ represents the national average GDP. If X i ¯ / X ¯ > X j ¯ / X ¯ , the spillover of province i is much more than province j. On the basis of W2, the spatial pattern of economic radiation is added in W3, and the spatial relation is expanded from geographical space to economic-geographical space, which helps to explain the change in the natural gas consumption pattern caused by economic competition, as we mentioned in Section 2.

4.2. Results

In view of the large-scale construction of long-distance pipelines in China since 2005, we selected 2005–2017 as T to analyze the absolute convergence. Based on the Equation (2), the results of the spatial absolute convergence are shown in Table 1.
There is absolute convergence of China’s natural gas consumption. Without considering the spatial interaction, the convergence rate is faster, which indicates that the spatial correlation between regions will significantly affect the convergence and reduce the convergence rate. Among the three spatial matrices, the convergence rate of natural gas consumption of the geographical distance matrix is faster than that of the adjacent matrix, which indicates that the cross-regional network attribute of natural gas is an important factor restricting spatial convergence. After further controlling for economic connection, the convergence is faster (as shown in Table 1 W3), which shows that the economic development gap between the regions is also the reason for slowing down the convergence process of natural gas consumption space. The three spatial matrices are significantly positive, indicating that the spatial effect promotes the growth rate of consumption, while the adjacency is smaller than the geography and the economic geography is smaller than the adjacency, which shows that the economic differences will widen the consumption gap between regions and aggravate the imbalance of the natural gas spatial pattern.

5. Conditional Spatial Convergence of Natural Gas Consumption in China

5.1. Influencing Factors of Natural Gas Consumption from the Spatial Perspective

5.1.1. Spatial Econometric Model of Influencing Factors Analysis

According to the variables, which were used to explain the natural gas consumption and spillover introduced by Bu et al. (2020) and Wang et al. (2020a) [2,13], we build the Spatial Durbin Model to analyze the influencing factors of natural gas consumption. The framework of factors proposed by Bu et al. (2020) and Wang et al. (2020a) provide us with support to find the conditions of convergence. The Spatial Durbin Model is given as follows:
ln Y i t = α + β W Y i t + ρ l k ln ( X i , t , k ) + D ρ d k W ln ( X i , t , k ) + μ i + η t + ε i t
where D = 0, the Spatial Durbin Model transfers into the Spatial Lag Model, which only focuses on the spatial interaction of gas consumption between regions. The SLM provides a reference for the robustness of the SDM. Xitk contain the main influencing factors of natural gas consumption, including labor (L), which indicates resident consumption; industrial output (IND), which indicates the industrial scale effect of gas consumption; tertiary industrial output (TIR), which indicates the commercial scale effect of gas consumption; the regional consumption level index (CLI), which is used to measure purchasing power; the gas pipeline length within the province (LEN), which indicates transmission ability within the region; gas price (GP) and oil price (OP), which are settled to control market fluctuation; and temperature (TEM). In addition, GDP and industrial output are collinear, so GDP is not placed in the model.

5.1.2. Results

Based on Equation (5), we estimate the local effect and spatial spillover effect of various factors under the three matrices, respectively. The results are shown in Table 2.
The above table shows that the indicators selected in this paper can effectively explain the spatial influence mechanism of natural gas consumption: the spatial lag model reflects the significant interaction between regional consumption, and the improvement of consumption level, the increase in population, the expansion of industrial and commercial scale and the extension of gas pipelines can significantly stimulate local natural gas consumption, with the self-price elasticity of natural gas being significantly negative and the cross-price elasticity being significantly positive. The above results are in line with the actual situation and the fitting degree (R2) of the model is high, which shows that the framework of influencing factors proposed in this paper is reasonable.
The defects of the spatial lag model limit the positive (negative) externalities caused by the upgrading and flow of local factors to the local scope, ignoring the exogenous interaction effects among the influencing factors. We analyze the spatial spillover effect of various factors on natural gas consumption through the model. In the SDM results, the rising of the regional consumption level and the expansion of industrial scale have significant negative effects on neighboring areas, and this negative effect will be superimposed with the spread of the pipe network in the global scope, and the polarization effect of economic development will further aggravate this imbalance.
If the spatial lag term is not added, the regression coefficient can well reflect the influence of independent variables on dependent variables, but if there is a spatial lag term, the regression coefficient can no longer accurately reflect the influence of independent variables on dependent variables, which is more complicated. Therefore, Lesage (2015) put forward the concepts of direct effect and indirect effect to measure the influence of independent variables on dependent variables [29]. The direct effect is used to measure the average influence of X on Y in this region, and the indirect effect is used to measure the average influence of X on Y in other regions. We estimated the direct and indirect effects of the SDM model, and the results are shown in Table 3.
Based on the spatial Durbin model of gas consumption proposed by Wang et al. (2020a) [2], we developed the model by distinguishing the industrial and commercial scale and adding temperature as a control variable. Compared with their regression results, the R2 of our results increases, which indicates that our model explanation is stronger.
In the regression results, neighboring provinces are most sensitive to the local natural gas price changes and the consumption will increase significantly; and the cross-regional indirect effect is small and insignificant, which indicates that there are obstacles to the integration of the national natural gas market. However, it cannot be denied that the cross-regional coverage of the natural gas pipeline network weakens the negative impact of the price increase on demand, and economically developed provinces along the pipeline have a strong bearing capacity for the price increase, and externalities are diluted step by step with the diffusion of the pipeline network.
The price increase of refined oil can stimulate the consumption of natural gas, but it is not significant under the spatial Durbin model, which indicates that there is a strong linkage mechanism of refined oil prices among regions, and the cross-regional price transmission speed is very fast; The pipeline network construction in the province has no significant impact on the natural gas demand in adjacent areas, but the pipeline expansion under the global network can significantly improve the average natural gas consumption level, which reflects the objective fact that the natural gas network promotes the cross-regional circulation of resource elements. However, the protection mechanism formed by dividing the market and multi-head management with the economically developed areas as the center, reduces its liquidity. In addition, the small and insignificant indirect effect of the adjacent matrix also indicates that the lack of branch lines in adjacent areas hinders the uniform spread of the spatial effect in the whole world to some extent, and the imbalance between cross-regional conduction and adjacent conduction is also an important reason for the low transmission efficiency of natural gas in China.
The expansion of local industrial scale has significantly stimulated the consumption of natural gas in the province, reflecting the high dependence of China on natural gas in the transition from the middle to the later stage of industrialization, and the “polarization effect” among neighboring provinces is greater than the “spillover effect”, which indicates that the characteristics of natural gas consumption in China are endogenous to the industrialization process, and a spatial layout with multiple blooms and high contraction is being formed. The main body of tertiary industry development is urban clusters, showing the characteristics of diffuse natural gas consumption, especially under the economic connection network, which shows that the rapid development of tertiary industry in the central city of urban agglomeration can effectively radiate the surrounding areas, and the competing relationship with other economic centers coexists.
On the whole, the spatial effect diffusion mode of natural gas consumption is endogenous to the spatial relationship required by different industrial structures. Most of the influencing factors of natural gas consumption have the largest indirect effect under the geographical distance matrix, followed by the indirect effect of the economic geographical distance matrix, and the indirect effect of the adjacent matrix is the smallest, which indicates that there is an obvious cross-regional diffusion effect of natural gas consumption, while the resource competition brought by regional economic development hinders the flow of elements, and the administrative boundary restricts the network traffic of spatial spillover. The spatial interaction between natural gas consumption and its influencing factors is an important reason for the competition and contradiction in regional economic development. To sum up, in order to maximize the positive spatial effect of the natural gas network, the region should not only get rid of the closed development thinking of “vassal economy”, and expand the scope and path of factor circulation, but also reasonably control the flow rate and growth rate of factor circulation.

5.2. Conditional Spatial Convergence

5.2.1. Model of Conditional Spatial Convergence

After determining the main impression factors of natural gas consumption, the economic and social conditions for the convergence of natural gas consumption have actually been made clear. Therefore, we introduce the above factors into the absolute convergence model and construct the following conditional convergence model.
γ i , t + T = α β ln ( E i t ) + k = 1 m σ i ln ( X i , k ) + ρ W γ i , t + T + μ i + η t + ε i t
Different from the absolute convergence model, the conditional convergence model adds a series of economic and social factors as the exogenous environment that affects the convergence rate. Because the dependent variable of the convergence model is the growth of natural gas consumption, all kinds of influencing factors also take the form of growth. From this perspective, the conditional convergence model is a dynamic model, and the estimated coefficients of various influencing factors reflect their marginal contribution to the increase in natural gas consumption.

5.2.2. Results

Based on Equation (6), the conditional convergence results of China’s natural gas consumption are shown in Table 4.
The results show that there is a conditional convergence of China’s natural gas consumption under the three weights, among which the convergence speed of the economic geography matrix is the fastest. It preliminarily indicates that the spatial relationship between economy and society accelerates the convergence of China’s natural gas consumption. In other words, China’s natural gas spatial convergence will only proceed smoothly under certain economic and social conditions. Between neighboring provinces, the growth rate of natural gas consumption is synchronous, showing regional common growth. However, there is a trade-off competition in the growth of natural gas consumption among regions with similar economic development levels, which can be found from the negative ρ in W3.
As all kinds of factors mostly follow the law of diminishing marginal returns, the factors conducive to increasing consumption growth are often conducive to low-consumption areas catching up with high-consumption areas, thus promoting convergence [30].
From this point of view, factors with significantly positive coefficients are more conducive to accelerating convergence. Specifically, the increasing scale of the commercial sectors (TIR) will help to promote convergence instead of the industrial sector, which implies that a transformation from industry to tertiary industry can accelerate the convergence of regional natural gas and promote the fairness of distribution. Wang and Lin (2014) obtained a similar conclusion from the perspective of natural gas price elasticity in the commercial sector, which provided evidence for industrial transformation to promote the fair allocation of energy [31]. Our research proves that this result is still true after considering the spatial spillover effect.
The regional difference of consumption between the civil and commercial sectors is an important internal cause of the imbalance of natural gas consumption in China [13]. On this basis, it is not difficult to understand the positive effect of the construction of a pipe network in the province on convergence. The provincial pipeline network is the necessary infrastructure required to improve the consumption of civil and commercial natural gas. Increasing the scale of the pipeline network in low-consumption areas is an important way to enhance their consumption capacity and narrow the regional consumption gap. However, it is worth noting that under the background of resource competition among provinces, it is difficult to promote the cooperative construction of inter-regional pipe networks, which emphasizes the i6mportance of a National Pipeline Network Company in the unified planning of pipe network construction and PPP project guidance.
However, the increase in purchasing power has a negative impact on natural gas consumption. The reason may be that areas with higher purchasing power tend to have lower energy consumption as a whole, as explained by the environmental Kuznets curve. This result is consistent with Beyca et al. (2019) and Wang et al. (2020b) [32,33] Increasing purchasing power can potentially reduce energy consumption, which may promote the transfer of natural gas to economically backward provinces.
Too high a gas price is obviously not conducive to increasing consumption in low-consumption areas, but it can also inhibit the monopoly of resources in high-consumption areas. Therefore, providing higher subsidies to poor provinces will reduce the pressure of high gas prices, thus reducing the “Matthew effect” of natural gas allocation caused by unbalanced economic development, as Dupont and Martin (2006) proposed [34]. Andres et al. (2019) also pointed out a similar idea of governance in the water market [35]. However, in fact, the opposite is true in China. This provides a reasonable explanation for the central government to insist on setting up a national pipe network company in order to reduce the transition of natural gas to economically developed provinces.

6. Conclusions and Policy Implications

Based on the spatial convergence model, this study evaluated the convergence characteristics of China’s natural gas consumption for the first time, and analyzed the internal driving factors of consumption, thus revealing the conditions needed to reduce the spatial inequality of China’s natural gas consumption and providing enlightenment for improving the fairness of energy consumption and eliminating energy poverty. The conclusions are as follows: (1) China’s natural gas consumption has absolute convergence, but the huge economic development differences among regions hinders the convergence process. (2) Commercial development is conducive to the increase in natural gas consumption, which is one of the ways for backward areas to obtain more natural gas through industrial transformation. (3) The growth of natural gas consumption in China is mainly influenced by price, pipeline network construction, and industrialization. Among them, the lack of pipe network construction and administrative boundaries hinders the inter-regional natural gas flow and price transmission, showing a typical market segmentation phenomenon. (4) Strengthening the construction of the pipeline network to increase the natural gas consumption capacity of the civil and commercial sectors will help to promote convergence. The regional difference of gas price is the key factor to determine whether low-consumption areas can catch up with high-consumption areas.
According to the above conclusions, there are the following policy implications: (1) The spatial convergence model can support policy making to improve energy poverty and regional inequality. (2) Strengthening the construction of the inter-regional pipe network is a necessary condition to promote natural gas flow and improve spatial allocation. It depends on cooperation between local governments and unified planning of a National Pipeline Network Company. (3) Areas with backward economies need more subsidies to deal with the negative impact of high gas prices on natural gas demand, but the current competition among provincial governments makes it difficult to implement this measure. Therefore, it is a better policy choice for the central government to uniformly dispatch natural gas through the national pipeline network company.

7. Limitations of the Research and Directions for Future Research

This study preliminarily reveals the necessary conditions for the convergence of natural gas consumption, and thus puts forward some basic policy suggestions. However, this study also has limitations; for example, the structure of China’s natural gas pipeline network is not included in the model, which cannot reveal the exogenous influence of network structure characteristics on the convergence of natural gas consumption. In addition, it has been found that the resistance to the convergence of China’s natural gas consumption comes from administrative boundaries, but what causes this boundary effect needs further study. This provides a direction for our future research: (1) Generalize China’s natural gas network into a matrix and introduce it into the spatial econometric model to depict the flow of resources along the physical network and the resulting cross-regional trading relationship. (2) How did the boundary effect of China’s natural gas market come into being? This needs to be reconsidered in the market segmentation theory. (3) How to design a regional differentiated pricing mechanism, which needs to be further studied by simulation analysis.
Furthermore, the original intention of this paper was to observe the long-term convergence conditions of the natural gas market rather than the short-term. However, after 2017, short-term gas shortage, COVID-19 and other black swan events followed one after another. These exogenous shocks did have a huge impact on China’s natural gas supply chain and related industrial chains. We do not deny that these events will affect the convergence of natural gas consumption, but since their mechanism on the convergence of natural gas consumption is more complicated, the long-term framework of this paper will no longer be applicable. Therefore, we did not add samples after 2017 in this paper. A DID (difference-in difference) model or cointegration model, which are more suitable for evaluating short-term shocks, needs to be established to investigate the effects of these events on convergence.

Author Contributions

Conceptualization, X.G. and X.L.; methodology, X.L. and Y.W.; software, X.L. and Y.W.; validation, X.G. and X.L.; formal analysis, X.G., X.L. and Y.W.; data curation, Y.W.; writing—original draft preparation, X.G. and X.L.; writing—review and editing, X.L.; visualization, X.L. and Y.W.; supervision, X.G.; funding acquisition, X.G. All authors have read and agreed to the published version of the manuscript.

Funding

This research was funded by the National Natural Science Foundation of China (Nos. 71874166) and Policy and Economic Projects of CNACG (Nos. ZMD-2021-R01).

Data Availability Statement

The data on energy consumption are from the energy balance tables of all provinces in the China Energy Statistics Yearbook from 2006 to 2018 (http://www.stats.gov.cn/tjsj/tjcbw/201806/t20180612_1604117.html). The air pollution governance data are from the China Environmental Yearbook from 2006 to 2018 (http://cnki.scstl.org/CSYDMirror/Trade/yearbook/single/N2018050254?z=Z008). The energy prices gas consumption population and pipeline length are from the China Price Statistics Yearbook (http://www.stats.gov.cn/tjsj/ndsj/), EPS database (http://olap.epsnet.com.cn/data-resource.html) and CEIC database (https://www.ceicdata.com/en). Other data are from the China Statistical Yearbook from 2006 to 2018. Due to the lack of data and inconsistent statistical caliber.

Acknowledgments

We are grateful for the coauthors, comments and suggestions from the editor and anonymous reviewers who helped improve the paper. We would also like to express our gratitude to the China National Natural Science Foundation and CNACG for providing funding support.

Conflicts of Interest

The authors declare no conflict of interest.

References

  1. Dale, S. BP Statistical Review of World Energy; BP Plc: London, UK, 2021; pp. 14–16. [Google Scholar]
  2. Wang, X.; Lu, X.; Zhou, N.; Xiao, J.; Chen, J. Does environmental regulation affect natural gas consumption? Evidence from China with spatial insights. Sustainability 2020, 12, 3354. [Google Scholar] [CrossRef] [Green Version]
  3. Dong, K.; Jiang, Q.; Shahbaz, M.; Zhao, J. Does low-carbon energy transition mitigate energy poverty? The case of natural gas for China. Energy Econ. 2021, 99, 105324. [Google Scholar] [CrossRef]
  4. Sueyoshi, T.; Yuan, Y. China’s regional sustainability and diversified resource allocation: DEA environmental assessment on economic development and air pollution. Energy Econ. 2015, 49, 239–256. [Google Scholar] [CrossRef]
  5. Zhou, D.; Hu, F.; Zhu, Q.; Wang, Q. Regional allocation of renewable energy quota in China under the policy of renewable portfolio standards. Resour. Conserv. Recycl. 2022, 176, 105904. [Google Scholar] [CrossRef]
  6. Zhang, H. China’s natural gas sector regulation in the context of pipeline restructuring: Towards independent gas pipeline operation? J. World Energy Law Bus. 2021, 14, 447–463. [Google Scholar] [CrossRef]
  7. Chai, J.; Zhang, X.; Lu, Q.; Zhang, X.; Wang, Y. Research on imbalance between supply and demand in China’s natural gas market under the double-track price system. Energy Policy 2021, 155, 112380. [Google Scholar] [CrossRef]
  8. Liu, D.; Xu, H. A rational policy decision or political deal? A multiple streams’ examination of the Russia-China natural gas pipeline. Energy Policy 2021, 148, 111973. [Google Scholar] [CrossRef]
  9. Wang, T.; Lin, B. China’s natural gas consumption peak and factors analysis: A regional perspective. J. Clean. Prod. 2017, 142, 548–564. [Google Scholar] [CrossRef]
  10. Jiang, H.; Dong, X.; Jiang, Q.; Dong, K. What drives China’s natural gas consumption? Analysis of national and regional estimates. Energy Econ. 2020, 87, 104744. [Google Scholar] [CrossRef]
  11. Zhao, J.; Jiang, Q.; Dong, X.; Dong, K. Would environmental regulation improve the greenhouse gas benefits of natural gas use? A Chinese case study. Energy Econ. 2020, 87, 104712. [Google Scholar] [CrossRef]
  12. Tu, C.A.; Rasoulinezhad, E. Energy efficiency financing and the role of green bond: Policies for post-Covid period. China Financ. Rev. Int. 2021, 12, 203–218. [Google Scholar]
  13. Bu, Y.; Wang, E.; Bai, J.; Shi, Q. Spatial pattern and driving factors for interprovincial natural gas consumption in China: Based on SNA and LMDI. J. Clean. Prod. 2020, 263, 121392. [Google Scholar] [CrossRef]
  14. Curtis, J.; Tovar, M.A.; Grilli, G. Access to and consumption of natural gas: Spatial and socio-demographic drivers. Energy Policy 2020, 143, 111614. [Google Scholar] [CrossRef]
  15. Shi, X.; Yu, J.; Cheong, T.S. Convergence and distribution dynamics of energy consumption among China’s households. Energy Policy 2020, 142, 111496. [Google Scholar] [CrossRef]
  16. Akram, V.; Rath, B.N.; Sahoo, P.K. Stochastic conditional convergence in per capita energy consumption in India. Econ. Anal. Policy 2020, 65, 224–240. [Google Scholar] [CrossRef]
  17. Mohammadi, H.; Ram, R. Convergence in energy consumption per capita across the US states, 1970–2013: An exploration through selected parametric and non-parametric methods. Energy Econ. 2017, 62, 404–410. [Google Scholar] [CrossRef]
  18. Hao, Y.; Peng, H. On the convergence in China’s provincial per capita energy consumption: New evidence from a spatial econometric analysis. Energy Econ. 2017, 68, 31–43. [Google Scholar] [CrossRef]
  19. Kounetas, K.E. Energy consumption and CO2 emissions convergence in European Union member countries. A tonneau des Danaides? Energy Econ. 2018, 69, 111–127. [Google Scholar] [CrossRef]
  20. Xu, S.; Klaiber, H.A. The impact of new natural gas pipelines on emissions and fuel consumption in China. Resour. Energy Econ. 2019, 55, 49–62. [Google Scholar] [CrossRef]
  21. Cheng, Z.; Liu, J.; Li, L.; Gu, X. Research on meta-frontier total-factor energy efficiency and its spatial convergence in Chinese provinces. Energy Econ. 2020, 86, 104702. [Google Scholar] [CrossRef]
  22. Castellanos-Sosa, F.A.; Cabral, R.; Mollick, A.V. Energy reform and energy consumption convergence in Mexico: A spatial approach. Struct. Chang. Econ. Dyn. 2022, 61, 336–350. [Google Scholar] [CrossRef]
  23. Zhao, E.; Sun, S.; Wang, S. New developments in wind energy forecasting with artificial intelligence and big data: A scientometric insight. Data Sci. Manag. 2022, 5, 84–95. [Google Scholar] [CrossRef]
  24. Ren, X.; Lu, Z.; Cheng, C.; Shi, Y.; Shen, J. On dynamic linkages of the state natural gas markets in the USA: Evidence from an empirical spatio-temporal network quantile analysis. Energy Econ. 2019, 80, 234–252. [Google Scholar] [CrossRef]
  25. Luo, G.; Liu, S.; Yan, X.; Guo, Y. Institutional constraints to China’s low carbon transition: A case study of China’s coal-to-gas program. Struct. Chang. Econ. Dyn. 2021, 57, 121–135. [Google Scholar] [CrossRef]
  26. Li, F.; Li, X. An empirical analysis on regional natural gas market of China from a spatial pattern and social network perspective. Energy 2022, 244, 122598. [Google Scholar] [CrossRef]
  27. Anselin, L. Local indicators of spatial association—LISA. Geogr. Anal. 1995, 27, 93–115. [Google Scholar] [CrossRef]
  28. Lin, B.; Huang, G. The evolution trend of regional carbon emissions in china under the gradient development model—Based on the perspective of spatial analysis. J. Financ. Res. 2011, 378, 35–46. [Google Scholar]
  29. LeSage, J. Spatial econometrics. In Handbook of Research Methods and Applications in Economic Geography; Edward Elgar Publishing: Cheltenham, UK, 2015; pp. 23–40. [Google Scholar]
  30. Faini, R. Increasing returns, migrations and convergence. J. Dev. Econ. 1996, 49, 121–136. [Google Scholar] [CrossRef]
  31. Wang, T.; Lin, B. China’s natural gas consumption and subsidies—From a sector perspective. Energy Policy 2014, 65, 541–551. [Google Scholar] [CrossRef]
  32. Beyca, O.F.; Ervural, B.C.; Tatoglu, E.; Ozuyar, P.G.; Zaim, S. Using machine learning tools for forecasting natural gas consumption in the province of Istanbul. Energy Econ. 2019, 80, 937–949. [Google Scholar] [CrossRef]
  33. Wang, C.; Guo, Y.; Shao, S.; Fan, M.; Chen, S. Regional carbon imbalance within China: An application of the Kaya-Zenga index. J. Environ. Manag. 2020, 262, 110378. [Google Scholar] [CrossRef] [PubMed]
  34. Dupont, V.; Martin, P. Subsidies to poor regions and inequalities: Some unpleasant arithmetic. J. Econ. Geogr. 2006, 6, 223–240. [Google Scholar] [CrossRef]
  35. Andres, L.A.; Thibert, M.; Lombana Cordoba, C.; Danilenko, A.V.; Joseph, G.; Borja-Vega, C. Doing More with Less: Smarter Subsidies for Water Supply and Sanitation; World Bank: Washington, DC, USA, 2019. [Google Scholar]
Figure 1. Temporal and spatial evolution of natural gas consumption in China.
Energies 15 09448 g001
Figure 2. Global Moran’I Index of First-, Second- and Third-Order Adjacent Matrices.
Energies 15 09448 g002
Table 1. Absolute convergence of natural gas consumption.
Coff.Non-SpatialW1W2W3
β0.0665 ***0.0551 ***0.0576 ***0.0593 ***
ρ-0.0363 **0.1203 ***0.1301 **
α0.3113 ***0.2106 ***0.0464 *−0.0066 *
R20.70320.76040.80910.7750
convergence rate0.5853%0.4876%0.5091%0.5237%
Notes: *** p < 0.001. ** p < 0.01. * p < 0.1 (the same as following tables).
Table 2. The influencing factors analysis by SLM and SDM.
SLMSDM
W1W2W3W1W2W3
CLI0.540 ***0.601 ***0.575 ***0.904 ***0.715 ***0.660 ***
L0.117 *0.124 **0.130 **0.240 **0.149 *0.144 *
IND0.1120.1150.126 0.371 **0.257 **0.258 **
TIR0.535 ***0.479 ***0.549 ***0.369 **0.412 **0.443 **
LEN0.138 ***0.144 ***0.149 ***0.133 ***0.136 ***0.139 ***
GP−0.800 ***−0.731 ***−0.819 ***−1.282 ***−0.848 ***−0.923 ***
TEM−0.393 **−0.353 **−0.403 **−0.669 **−0.442 **−0.433 **
OP0.634 **0.595 **0.615 **0.239 0.422 *0.512 **
W*GC0.254 ***0.674 ***0.511 ***0.473 ***0.634 ***0.526 ***
W*CLI −0.815 ***−1.362 **−1.598 **
W*L −0.167 0.0410.180
W*IND −0.488 **−1.074 **−1.363 **
W*TIR 0.170 0.662 1.180 *
W*LEN −0.020 0.298 *0.351
W*GP 1.273 ***0.7651.360
W*TEM 0.394 −0.254−1.059
W*OP 0.103 0.7290.260
R20.79920.80760.79600.83750.81540.8057
Table 3. Spatial effect decomposition of the Spatial Durbin Model.
Total EffectDirect EffectIndirect Effect
W1W2W3W1W2W3W1W2W3
CLI0.159−1.888−2.0810.850 ***0.635 ***0.606 ***−0.691 **−2.523−2.687 *
L0.1360.5480.6690.237 **0.164 **0.155 **−0.1010.3830.514
IND−0.241−2.337 *−2.401 **0.328 **0.1750.208 *−0.569 **−2.513 *−2.609 **
TIR1.036 **3.0133.521 **0.415 **0.496 **0.506 **0.621 *2.5173.015 **
LEN0.221 **1.225 **1.053 *0.139 ***0.170 ***0.156 ***0.0831.055 *0.897 *
GP0.007−0.3140.990−1.185 ***−0.831 ***−0.884 ***1.192 **0.5161.874
TEM−0.514−1.869−3.091−0.658 **−0.497 **−0.481 **0.144−1.372−2.610
OP0.6563.1901.7990.2640.505 **0.541 **0.3922.6841.259
Table 4. Conditional convergence of natural gas consumption.
W1W2W3
ET = 0(β)0.0694 ***0.0774 ***0.0783 ***
ρ0.0275 ***−0.0092−0.0263 *
CLI−0.1288 ***−0.0881 ***−0.0717 **
L0.1306 *0.1452 *0.1577 **
IND0.0578−0.0719−0.1021
TIR0.1252 **0.0719 **0.0571 *
LEN0.0429 ***0.0452 ***0.0459 ***
GP−0.0941 ***−0.0521 *−0.0446 *
TEM0.00090.01810.0179
OP−0.29790.25280.3345 *
α−0.1317−0.7045−0.7199
convergence rate0.5994%0.6713%0.6795%
Publisher’s Note: MDPI stays neutral with regard to jurisdictional claims in published maps and institutional affiliations.

