Article

Characteristics of Wastewater from Municipal Waste Bio-Drying and Its Impact on Aquatic Environment—Long-Term Research on a Technical Scale

1
Institute of Engineering and Environmental Protection, University of Warmia and Mazury in Olsztyn, Str. Oczapowskiego 5, 10-719 Olsztyn, Poland
2
Technical and Construction Department, Commune Office in Reszel, Str. Rynek 24, 11-440 Reszel, Poland
3
Technical Department, Municipal Waste Management Plant in Olsztyn, Str. Lubelska 53, 10-410 Olsztyn, Poland
*
Author to whom correspondence should be addressed.
Energies 2022, 15(24), 9467; https://doi.org/10.3390/en15249467
Submission received: 13 November 2022 / Revised: 9 December 2022 / Accepted: 10 December 2022 / Published: 14 December 2022

Abstract

:
The implementation of appropriate solutions for municipal waste management is still a significant challenge for the operators of technological facilities. Although there are many separate collection procedures and waste neutralisation systems available, it is still necessary to search for new economically and technologically justified solutions. The priority is environmental care and circular economy compliance. An important aspect is recycling and energy recovery from waste as an alternative fuel. Preparation of municipal waste for energy production requires many preliminary unit processes, and one of the most important factors is drying. It should be emphasised that environmental impact assessment is an indispensable aspect of waste management. The aim of long-term research was to determine the effect of bio-drying of municipal waste on the characteristics of technological and precipitation wastewater and its impact on the quality of the aquatic environment. An investigation was carried out between 2015–2021 on a large-scale installation for 200,000 residents. It was proven that during the wastewater treatment plant operation, the concentration of N-NH4 was exceeded. The concentrations of other pollution indicators corresponded to the normative values. The quality of groundwater also deteriorated. A comparative analysis of municipal waste drying methods showed that the bio-drying process has a significantly lower impact on the natural environment than the methods that are lower in the municipal waste management hierarchy.

1. Introduction

Progressive urbanisation, the ever-expanding global population, and the related rapidly increasing consumption have a direct impact on the amount of municipal waste generated. In 2015, urban areas generated almost 1.3 billion tonnes of solid waste, with this value expected to rise to 2.2 billion tonnes by 2025 [1]. The per capita generation of solid waste in EU countries is estimated to range from 0.9 to 1.6 kg/day, while for Asian countries, this value ranges from 0.7 to 1.5 kg/day [2,3].
Recent years have seen rapid changes in municipal waste management and advances in the available waste neutralisation technologies [4,5]. This is primarily linked to the growing environmental awareness of the public and, consequently, to the implementation of new, sustainable standards of conduct that are based on the principles of the circular economy, bioeconomy, and broadly understood material and energy recycling [6]. A current and still-developing trend is a solid waste biorefinery approach as a sustainable strategy in a circular bioeconomy [7,8]. Under this approach, municipal waste is regarded as a source of energy and of products with added value, including fertilisers, chemicals, feed additives, biofuels, and many other bioproducts and substances that enable the production of other, economically valuable end products [9,10].
Under the biorefinery approach, municipal waste treatment, management, and neutralisation should be justified both economically and environmentally [11,12]. After all, since inadequate municipal waste management results in significant pollutant emissions, it is reasonable to search for environmentally friendly and clean technologies, and there is a need to monitor emissions and the spread of pollutants from waste storage and treatment facilities [13,14]. One of the essential aspects is the assessment of the impact of waste treatment and final disposal facilities on the hydrosphere, including the precipitation water characteristics, surface water biocoenosis, and primarily on the quality of groundwater used for human consumption.
Fresh water is a limited resource and is, therefore, a very important component of the environment, essential for most biocoenoses, and necessary for the proper functioning of the Earth’s ecosystem, including societies and the global economy. Groundwater, which accounts for 97% of the Earth’s freshwater resources, is a source of drinking water for approximately two billion people [15], and provides approximately 40% of the global irrigation system [16]. Progressing problems related to both the quality and the availability of groundwater are observed worldwide [17,18,19,20]. Therefore, there is a need to implement procedures for water resource monitoring and protection. Within the European Union, the freshwater protection system is founded on the Water Framework Directive 2000/60/EC of the European Parliament and of the Council of 23 October 2020 [21]. Under the requirements of the Directive, the Member States are obliged to review the impact of human activities on the aquatic environment and to monitor its quality. The Framework Water Directive only provides general guidelines for the assessment of a groundwater system based on the physico-chemical parameters, as the threshold values for pollutants, groups of pollutants, and pollution indicators are established individually by the Member States. While the monitoring system recommended under the Directive involves the use of one threshold value [22], Poland uses a five-stage classification, thus guaranteeing a deeper insight into groundwater quality [23].
The physical and chemical properties of groundwater are determined by both the natural factors (e.g., lithology, infiltration rate, type of geochemical reactions, salt solubility, and the feed water quality) and the anthropogenic activities [24,25,26]. The anthropogenic sources of soil and water environmental pollution include, e.g., broadly understood industrial [27,28,29] and agricultural activities [30] as well as municipal waste management activities [31,32,33,34,35]. As regards the latter, the main sources of pollution include landfill leachate, and the inadequate operations of municipal waste treatment facilities carried out in too-close proximity to water resources and without an adequate system for the collection and treatment of process wastewater.
While landfilling remains the most common method of municipal waste disposal in Poland, the most widely used technology for its treatment is mechanical biological treatment (MBT). A reference example of an MBT facility at the national level is Zakład Unieszkodliwiania Odpadów Komunalnych (Municipal Waste Disposal Plant, hereinafter referred to as ZUOK) in Olsztyn. With a capacity of 130,000 Mg/year, the plant described is the largest mixed municipal waste treatment facility in this part of the country [36]. In contrast to most MBT installations, the biological part of the ZUOK plant is based on the municipal waste bio-drying process that is aimed at the production of the pr-RDF alternative fuel. The additional aim of the ZUOK is to valorise selectively collected municipal waste into assortments with commercial potential and to transfer them to material recycling companies in accordance with the circular economy requirements.
Despite the mandatory control of groundwater quality by municipal waste treatment plants, the actual effect of these plants on the soil and water environment is still a relatively poorly described topic. The available literature on the subject lacks reliable and credible data obtained from the installations operated on a commercial scale and covered by methodical, multiannual control and monitoring. Hence, the need arises to undertake and properly conduct an analysis of this research topic in order to describe, in particular, the emission levels of the liquid pollutants generated during the mechanical and biological treatment of municipal waste and its effect on changes in the aquatic environment exposed to its impact. The aim of this study is to determine the volume of pollutant emissions in industrial wastewater and precipitation water generated at the Municipal Waste Disposal Plant (ZUOK) and to determine the changes in the groundwater parameters within the area of plant operation in the years 2015–2021.

2. Materials and Methods

2.1. Characteristics of the Object under Study

The ZUOK site in Olsztyn (53°47′15″ N, 20°33′08″ E) is a mechanical and biological treatment (MBT) installation with a nominal capacity of 130,000 Mg/year, located in the main hall and designed for the disposal of mixed municipal waste. The morphological composition of municipal waste is subject to seasonal changes. Nevertheless, the approximate morphological composition in the region can be assumed as follows: paper and cardboard—7.2%, plastics—27.6%, glass packaging—3.9%, metals—2.7%, organic waste—51.7%, textiles—0.2%, fine fraction—1.6%, other—5.1% (source—ZUOK internal materials). The MBT line is primarily targeted at the production of alternative fuel from solid waste while offering the possibility of recovering some raw materials. The line operating at the ZUOK comprises the mixed waste reception point (1), the biological waste disposal section (2), the mechanical waste disposal and fuel production section (3), the sorting line for the selective collection packaging waste (4), an auxiliary facility for large-sized and construction waste management (5), a building with an installation for dismantling large-sized waste, audio/video devices, household appliances, and electrical and electromagnetic equipment (6), and the construction waste disposal and storage installation section (7). The location of particular line components is presented in detail in Figure 1.

2.2. Characteristics of the Biological Waste Disposal Section

The bio-drying plant for municipal waste at ZUOK uses technology from Eggersmann Anlagenbau GMBH. The main objective of the bio-drying process is to increase the calorific value of the processed municipal waste to at least 16 MJ/kg by reducing the waste moisture to about 15%. The biological part consists of 14 reactors that enable the process of autothermal biological drying. The active volume of each of the reactors is about 1000 m3. The technological process consists of five successive stages: crushing of the mixed waste to a grain size of <80 mm (1), automatic loading of the reactor (2), bio-drying of the municipal waste under controlled process conditions (3), emptying of the reactor with a wheel loader (4), and utilisation of the pre-RDF fuel produced (5).
The bio-drying process is carried out for ten days in five consecutive phases (Table 1). The temperature conditions are controlled based on an algorithm that controls the intensity of the waste aeration.
Valorisation of the pre- RDF consists of the removal of ash, ferromagnetic and paramagnetic metals, removal of PVC waste and final fragmentation of waste to granularity <20 mm. The produced RDF fuel is transferred to end users for energy recovery (cement plants and waste incineration).

2.3. Characteristics of the Water and Wastewater Management of the Object under Study

Three types of wastewater are generated at ZUOK in Olsztyn—industrial wastewater (technological wastewater), sanitary wastewater (domestic wastewater) and precipitation wastewater (rainwater from the ground surface and the engineering structures). Industrial wastewater, after mixing with sanitary wastewater (the plant employs 170 people), is discharged into the public sewer system and then treated at the municipal wastewater treatment plant. Rainwater, after treatment, is diverted to the local Thracian Lake. In addition, groundwater is monitored on the ZUOK site. The management and monitoring of wastewater and groundwater is carried out in accordance with the guidelines of the integrated permit (issued in accordance with the EU Directive 96/61/EC), which in turn is subject to detailed national regulations. For comparative purposes, Table 2 shows the range of the main parameters in industrial wastewater specified in the ZUOK integrated permit.
The industrial wastewater is generated at the ZUOK site in Olsztyn at three crucial locations, i.e., in the bio-drying chambers (1), at the point of post-process air neutralisation in the acid scrubber (2), and at the point of post-process air steam condensation on the biofilter (3). This wastewater is mixed in the washing plant (W1 unit), after which it continues flowing and is re-mixed with the sanitary wastewater originating from the administration and amenity building (4). The point of industrial wastewater collection for physico-chemical analyses was located downstream of the wastewater measuring point and upstream of the point of wastewater discharge into the main wastewater duct (5). Upstream of the discharge into the main wastewater duct, an aerated settling tank, which also serves as a sample collection point, and an ultrasonic meter (W2) are located, respectively. The processing system for industrial wastewater collection is marked in yellow in Figure 2.
The precipitation water that runs off the ground surface and the ZUOK engineering structures, i.e., roads, vehicle circulation areas, parking areas, and roofs, first enters the sand trap (A) where the mixture is pre-treated to remove the readily settling suspended solids. The pre-treated wastewater then enters, through the drainage system, the lamellar separator of oil-derivative substances (B), in which the wastewater is separated into oil-derivative substances (oil substances) and mineral-suspended solids (sands, slurries). Further downstream, precipitation wastewater flows through the inspection chamber (C). The final component for the treated precipitation water discharge is the fire-fighting storm tank (D). When the tank is overfilled, the precipitation water is diverted via a set of pumps (E) into a stream flowing away from Thracian Lake. The discharge channel into the stream was the point of precipitation water sample collection from the ZUOK site. The precipitation water from the access road to the ZUOK is treated on two sand traps integrated with two oil-derivative substance separators (F, G) and then flows through the open channels (H) into a small reservoir. The technical system of precipitation wastewater drainage and neutralisation, along with the indicated locations of particular facilities, is provided in Figure 2 in blue colour.
At the ZUOK site in Olsztyn, three piezometers, i.e., 80 mm diameter boreholes used to monitor groundwater, are found. One of them, marked P-3, is located in the north-eastern part of the plot on which the plant is situated, i.e., on the groundwater inflow side, while the two others are located in the south-eastern part of the plot, i.e., on the groundwater outflow side. The water table level in the piezometers is between 8 and 10 m below the ground level. Groundwater samples are collected once every six months. The layout, along with the indicated locations of particular piezometers, is provided in Figure 2 in red colour.

2.4. Organisation and Analytical Scope of the Study

The study on industrial wastewater, precipitation wastewater, and groundwater was carried out in the years 2015–2021. Testing was carried out by accredited laboratories as commissioned by Zakład Gospodarki Odpadami Komunalnymi Sp. z o.o. (Municipal Waste Management Company, Ltd.) in Olsztyn, Poland. All tests were carried out in accordance with the existing standards.
The scope of analyses of industrial process wastewater included:
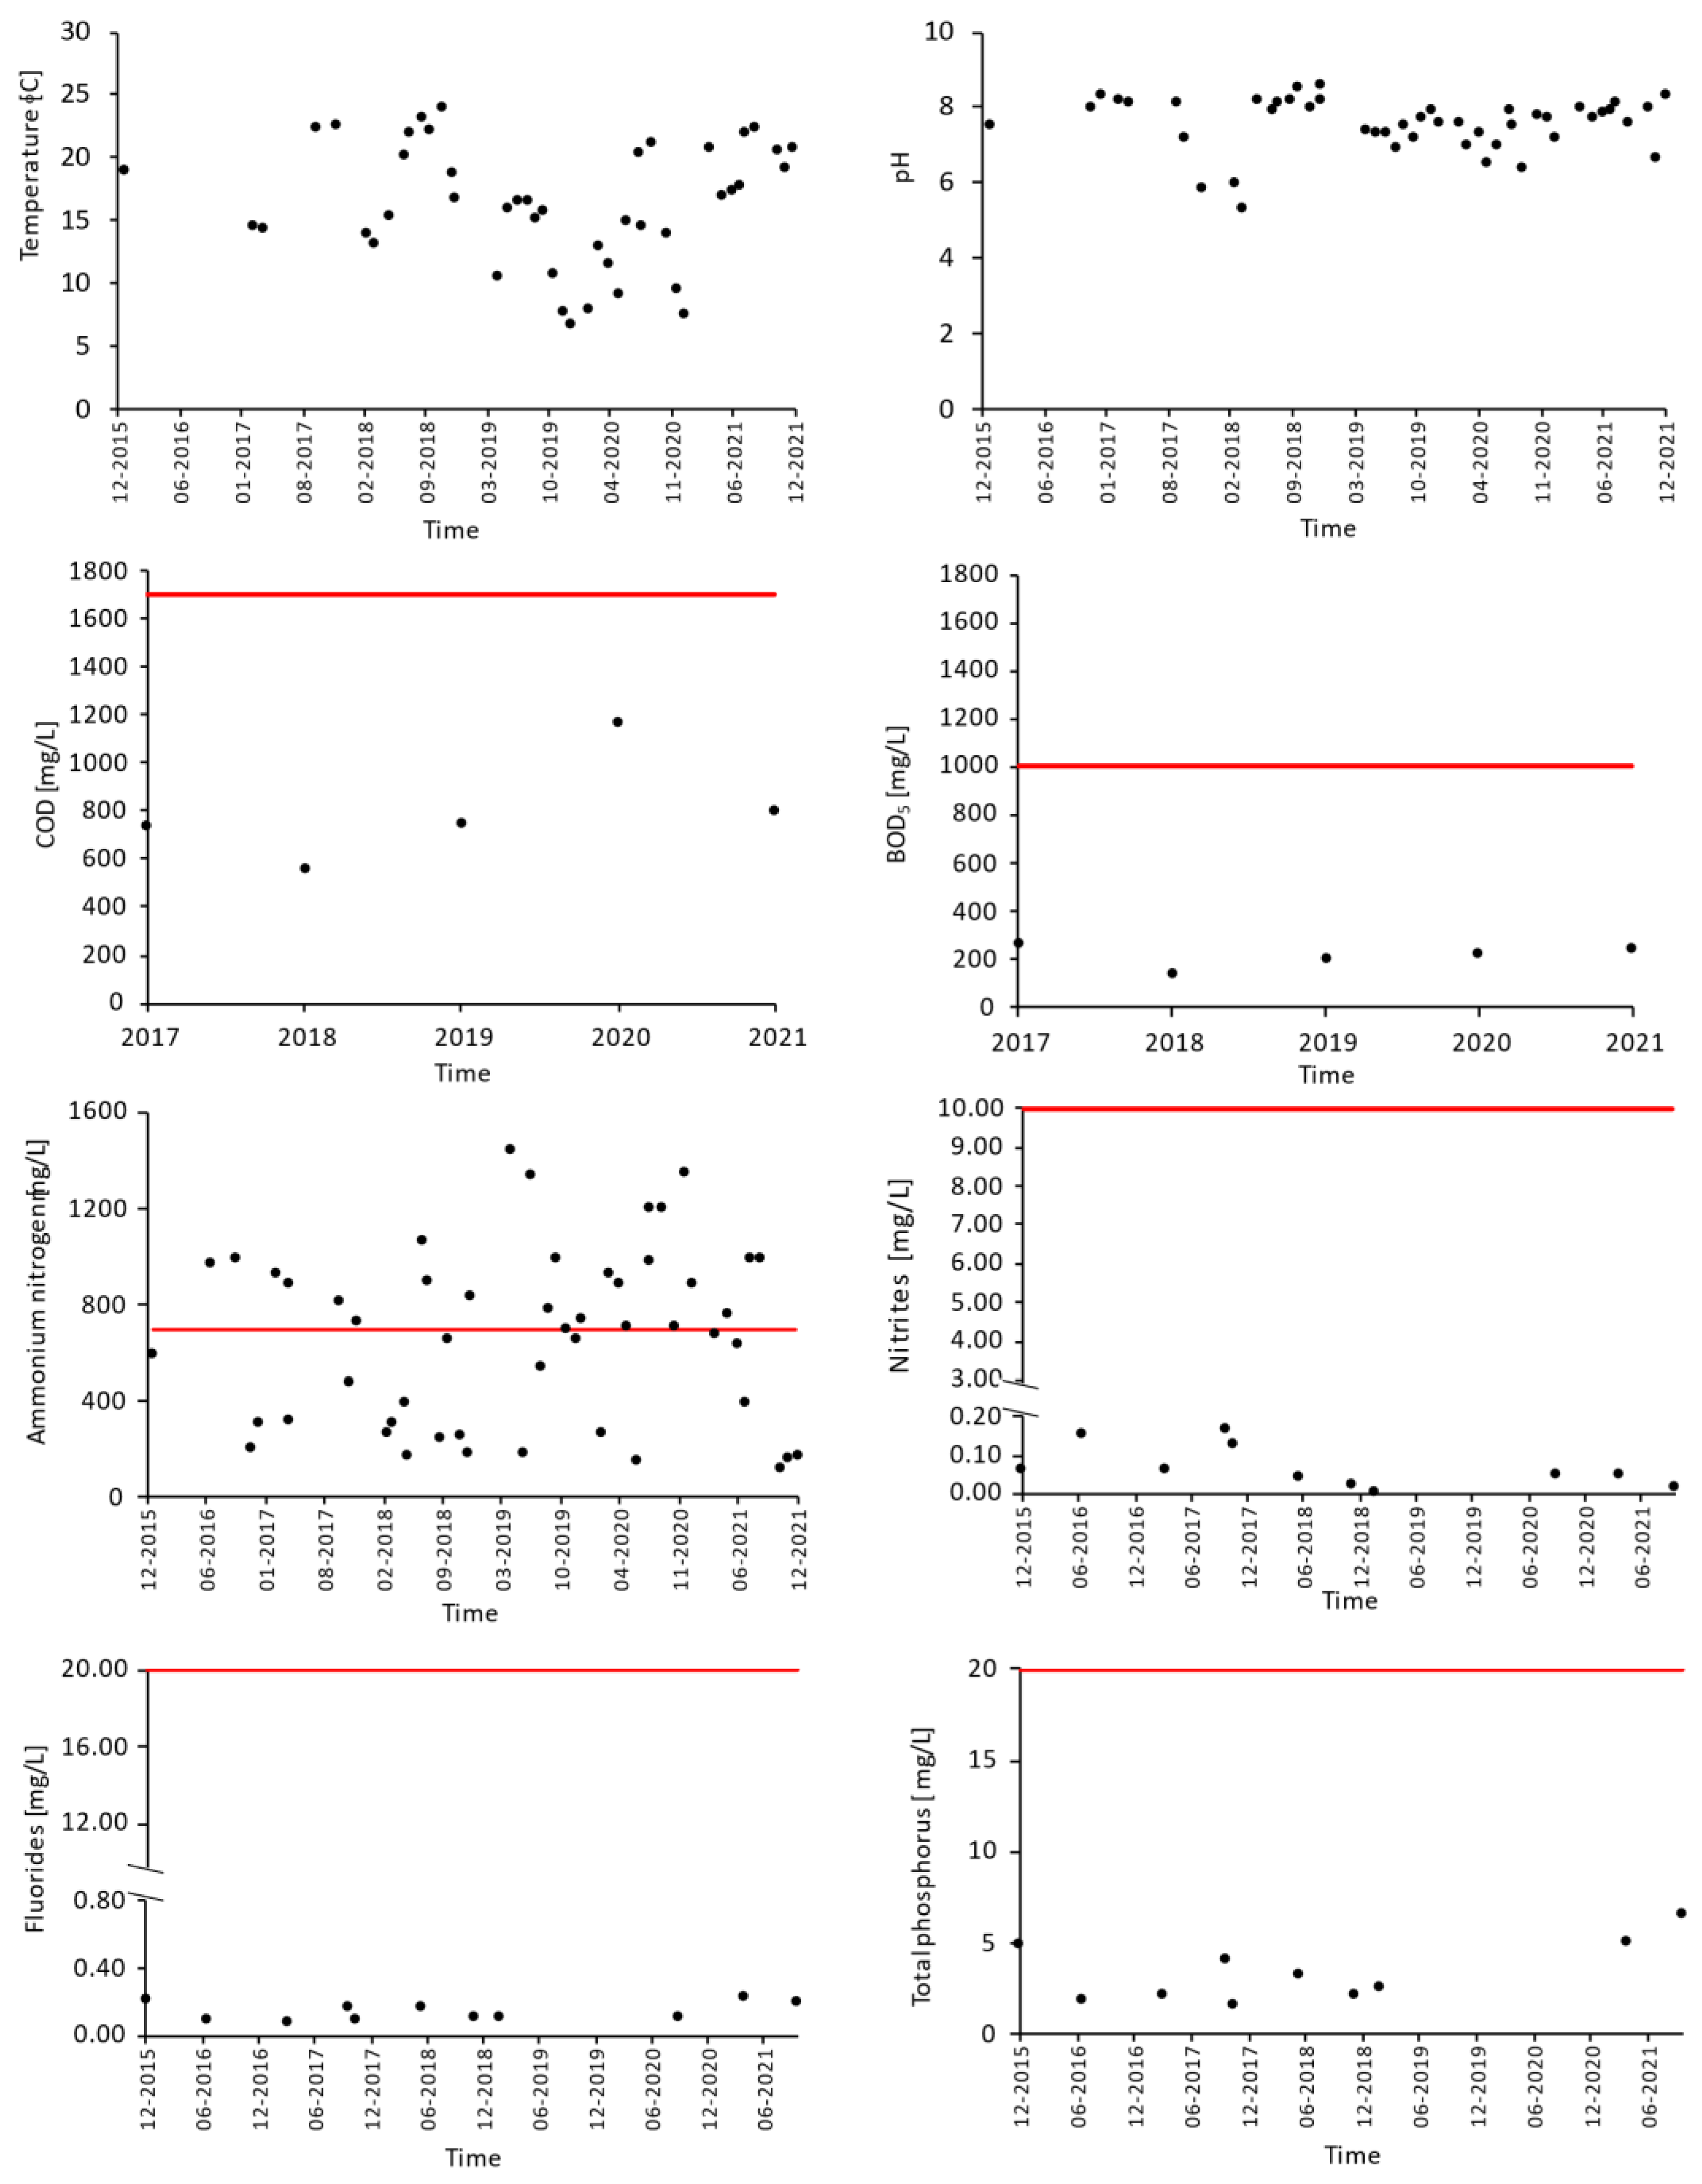
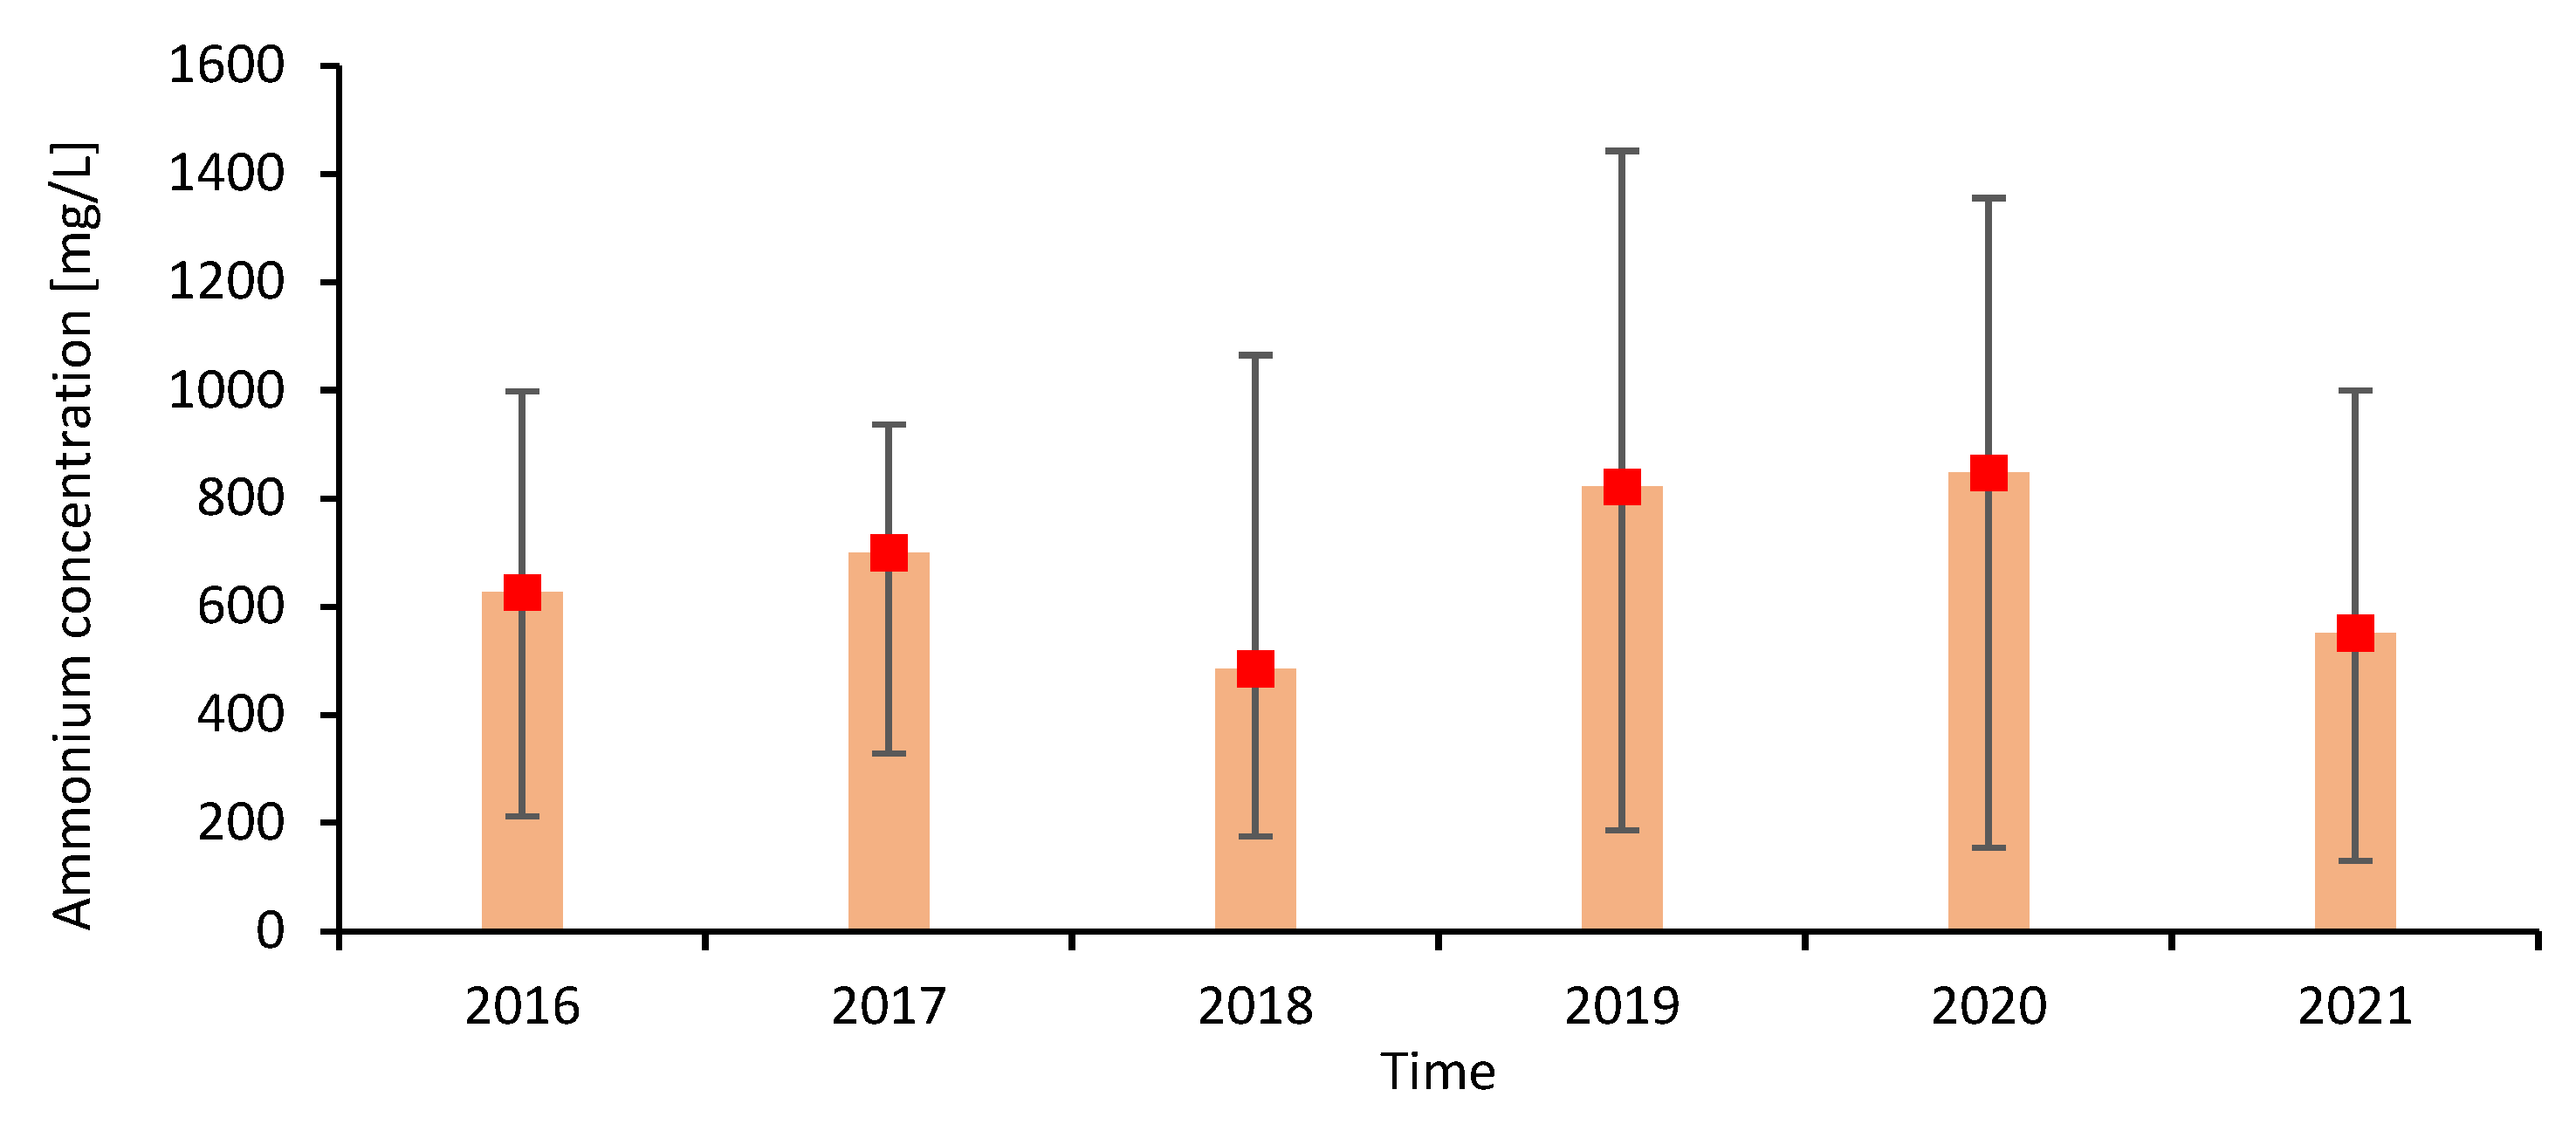
basic physico-chemical parameters with high sampling frequency, i.e., ammonium nitrogen (PN ISO 5664:2002), temperature (PN-C-04584:1977), and the pH (PN-EN ISO 10523:2012);
basic physico-chemical parameters with low sampling frequency, i.e., chemical oxygen demand (PN-ISO 6060:2006), biological oxygen demand (PN-EN 1899-1:2002), nitrites (PN-EN 26777:1999), fluorides (PN-78/C-04588/03), and total phosphorus (PN-ISO 13730:1999);
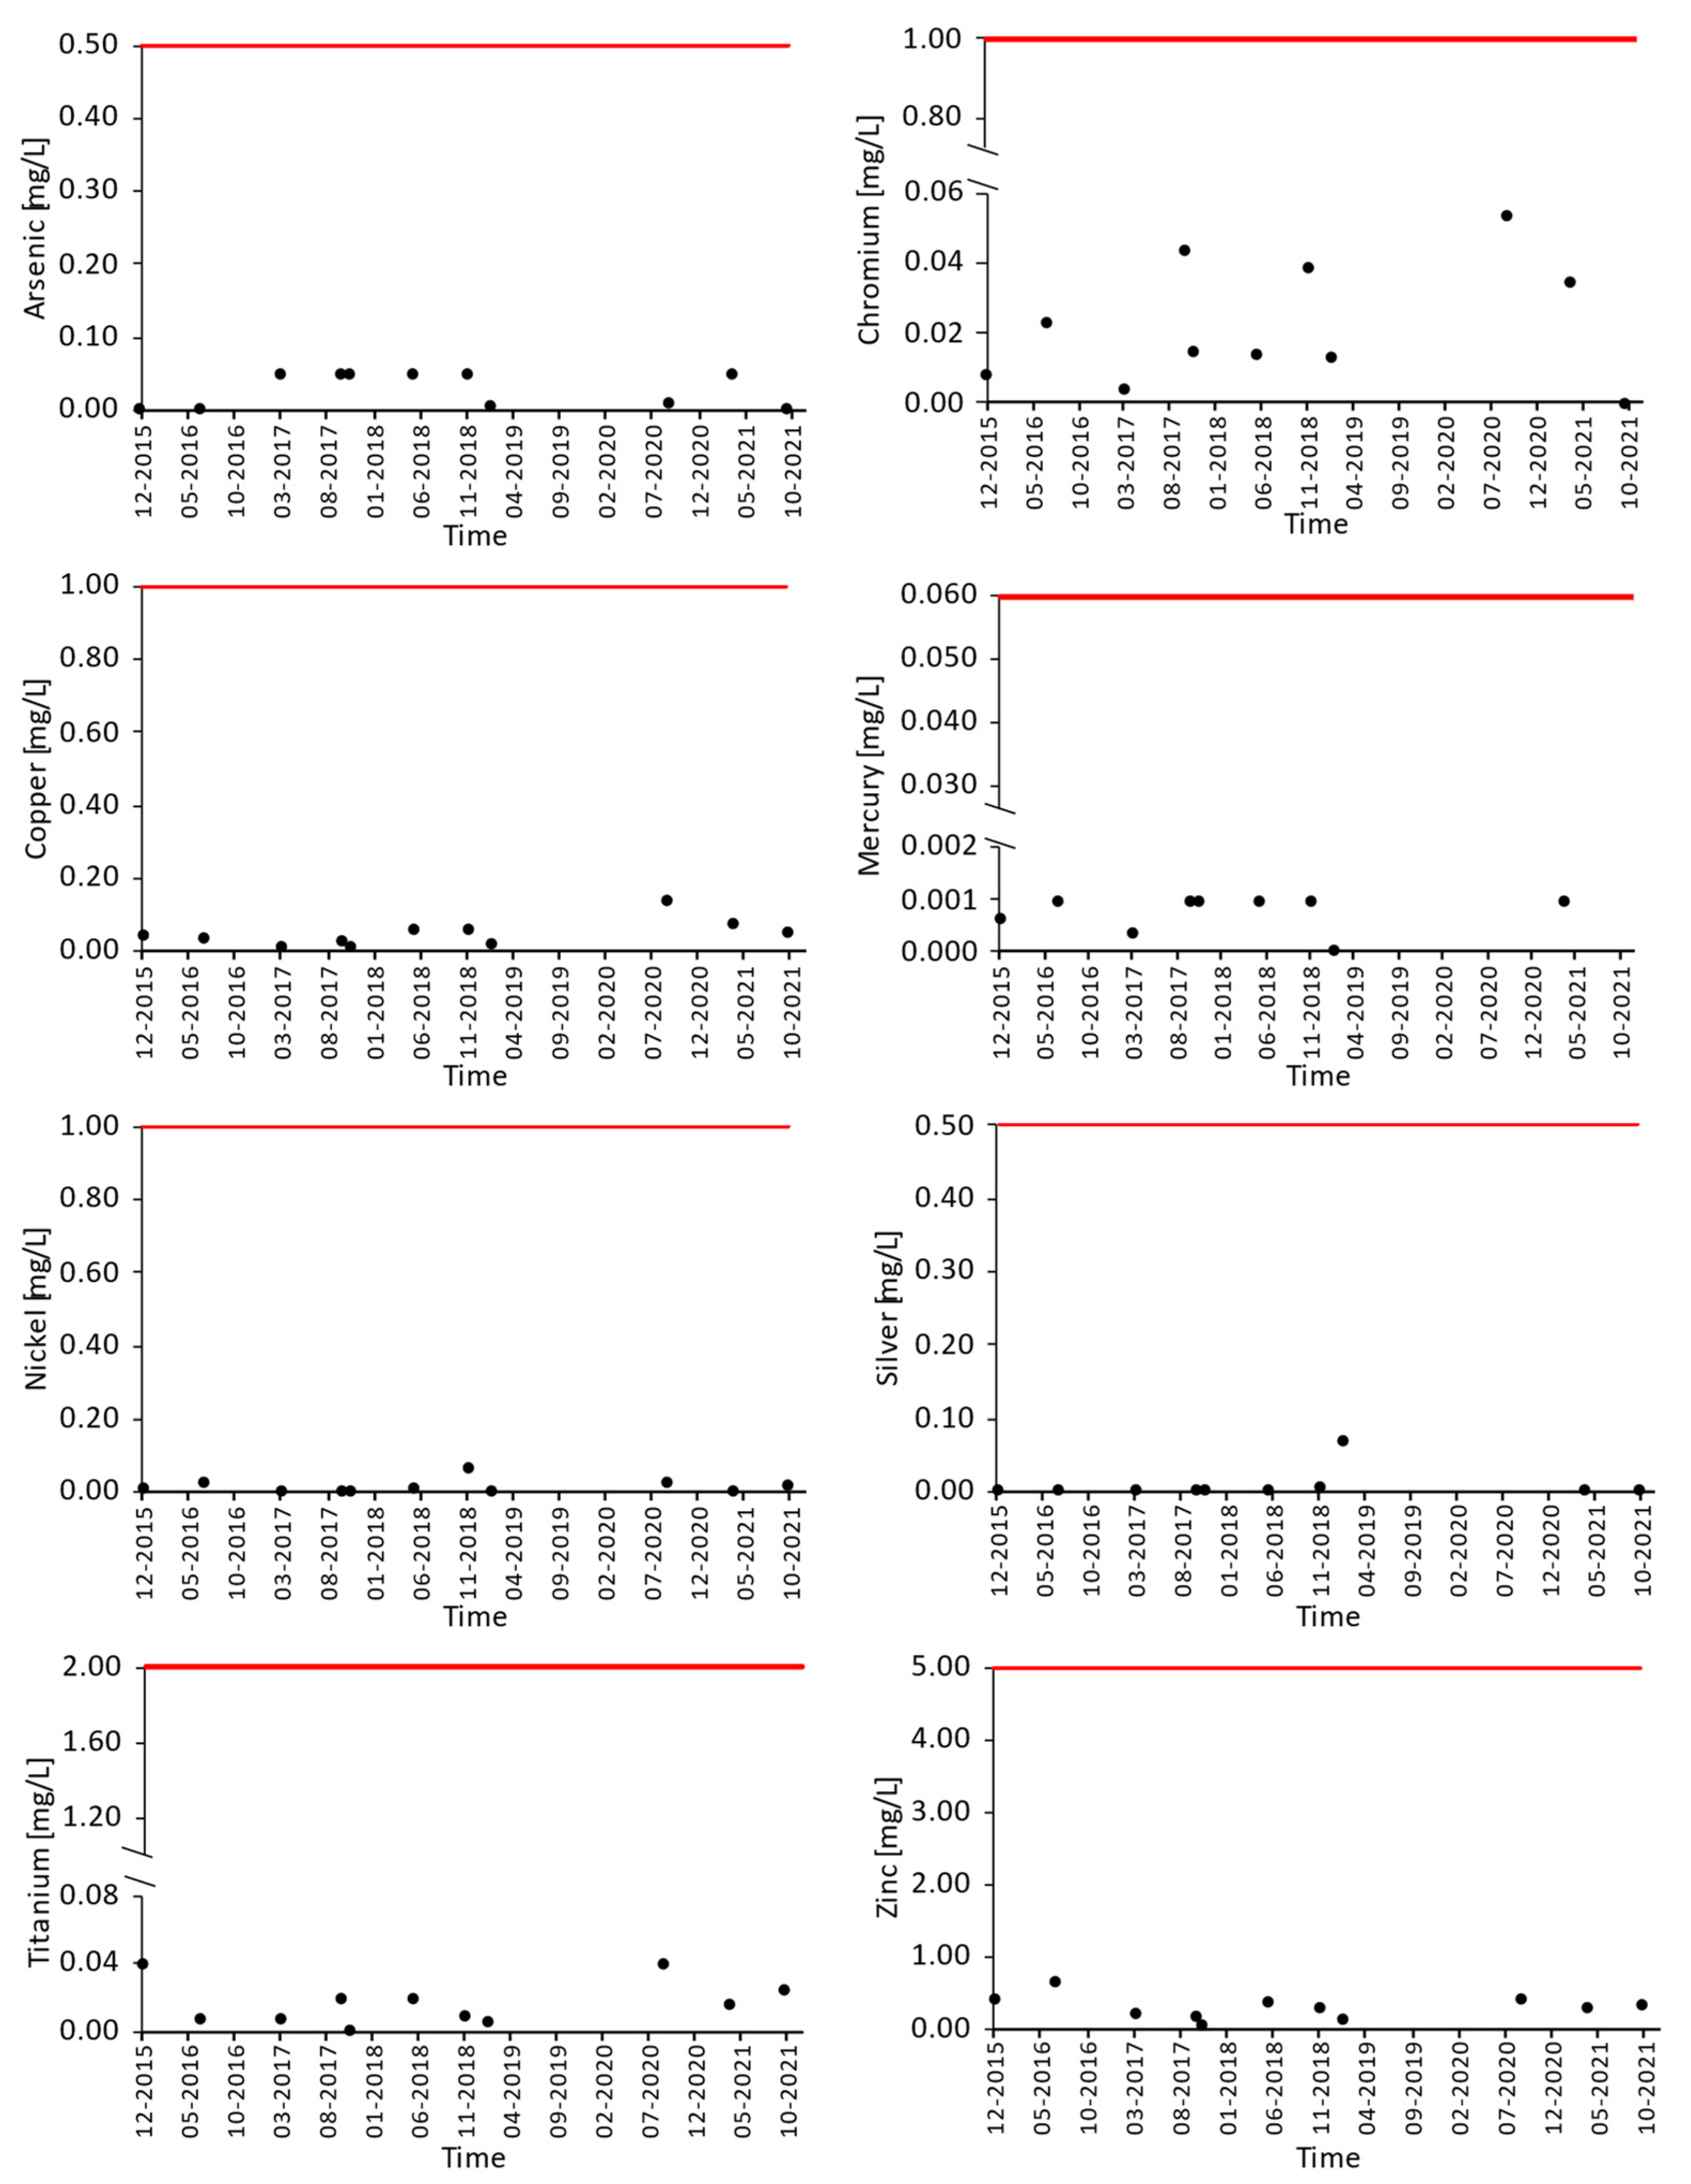
contents of heavy metals, i.e., arsenic, chromium, zinc, copper, nickel, silver, titanium (PN-EN ISO 11885:2009) and mercury (PN-EN ISO 1483:2007, Chapter 4);
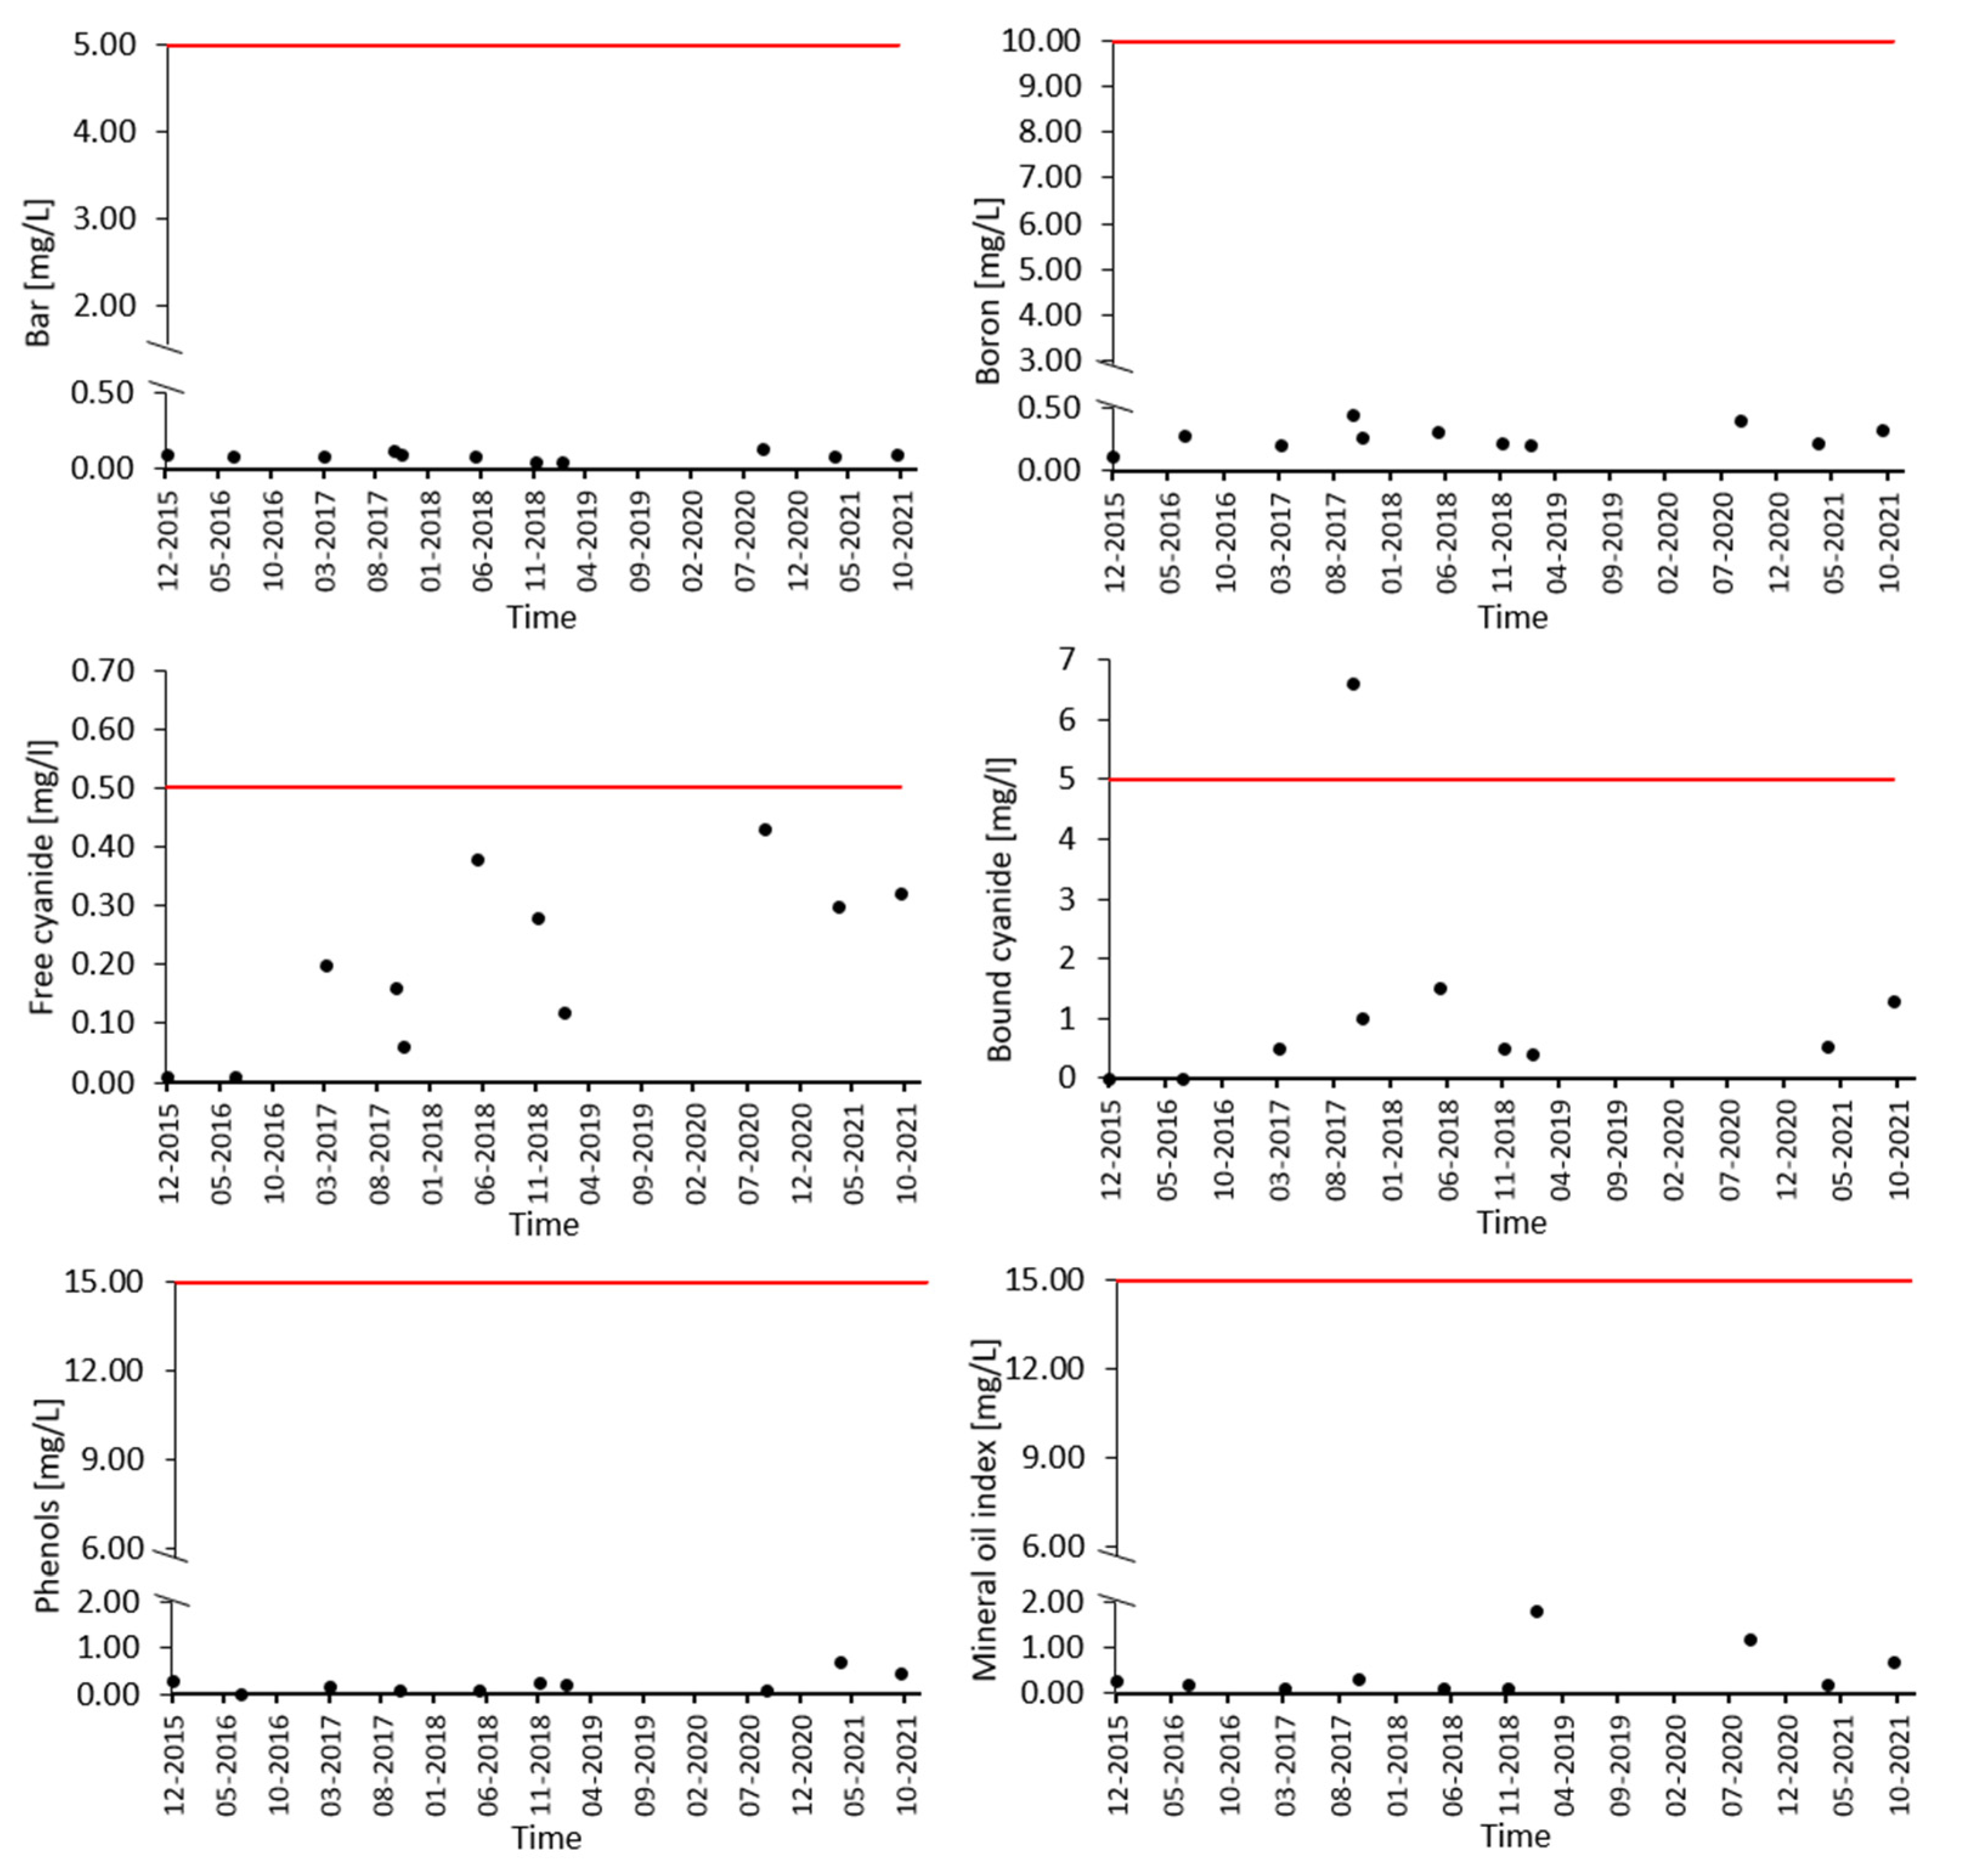
contents of other elements and toxic substances, i.e., barium, boron (PN-EN ISO 11885:2009), free cyanides, bound cyanides (PN-EN ISO 14403-2:2012), and oil-derived hydrocarbons (PN-EN ISO 9377-2:2003).
High-frequency sampling tests were carried out at monthly intervals, while other tests were at six-monthly intervals; COD and BOD5 test were performed once a year. All samples were collected by an accredited employee of an accredited laboratory in accordance with ISO PN ISO 5667-10:1997.
Further tests were conducted on the precipitation wastewater drained from the hard-surfaced road and the paved area of the ZUOK. The scope of analyses of precipitation wastewater is specified in the integrated permit, according to which the following are subject to monitoring:
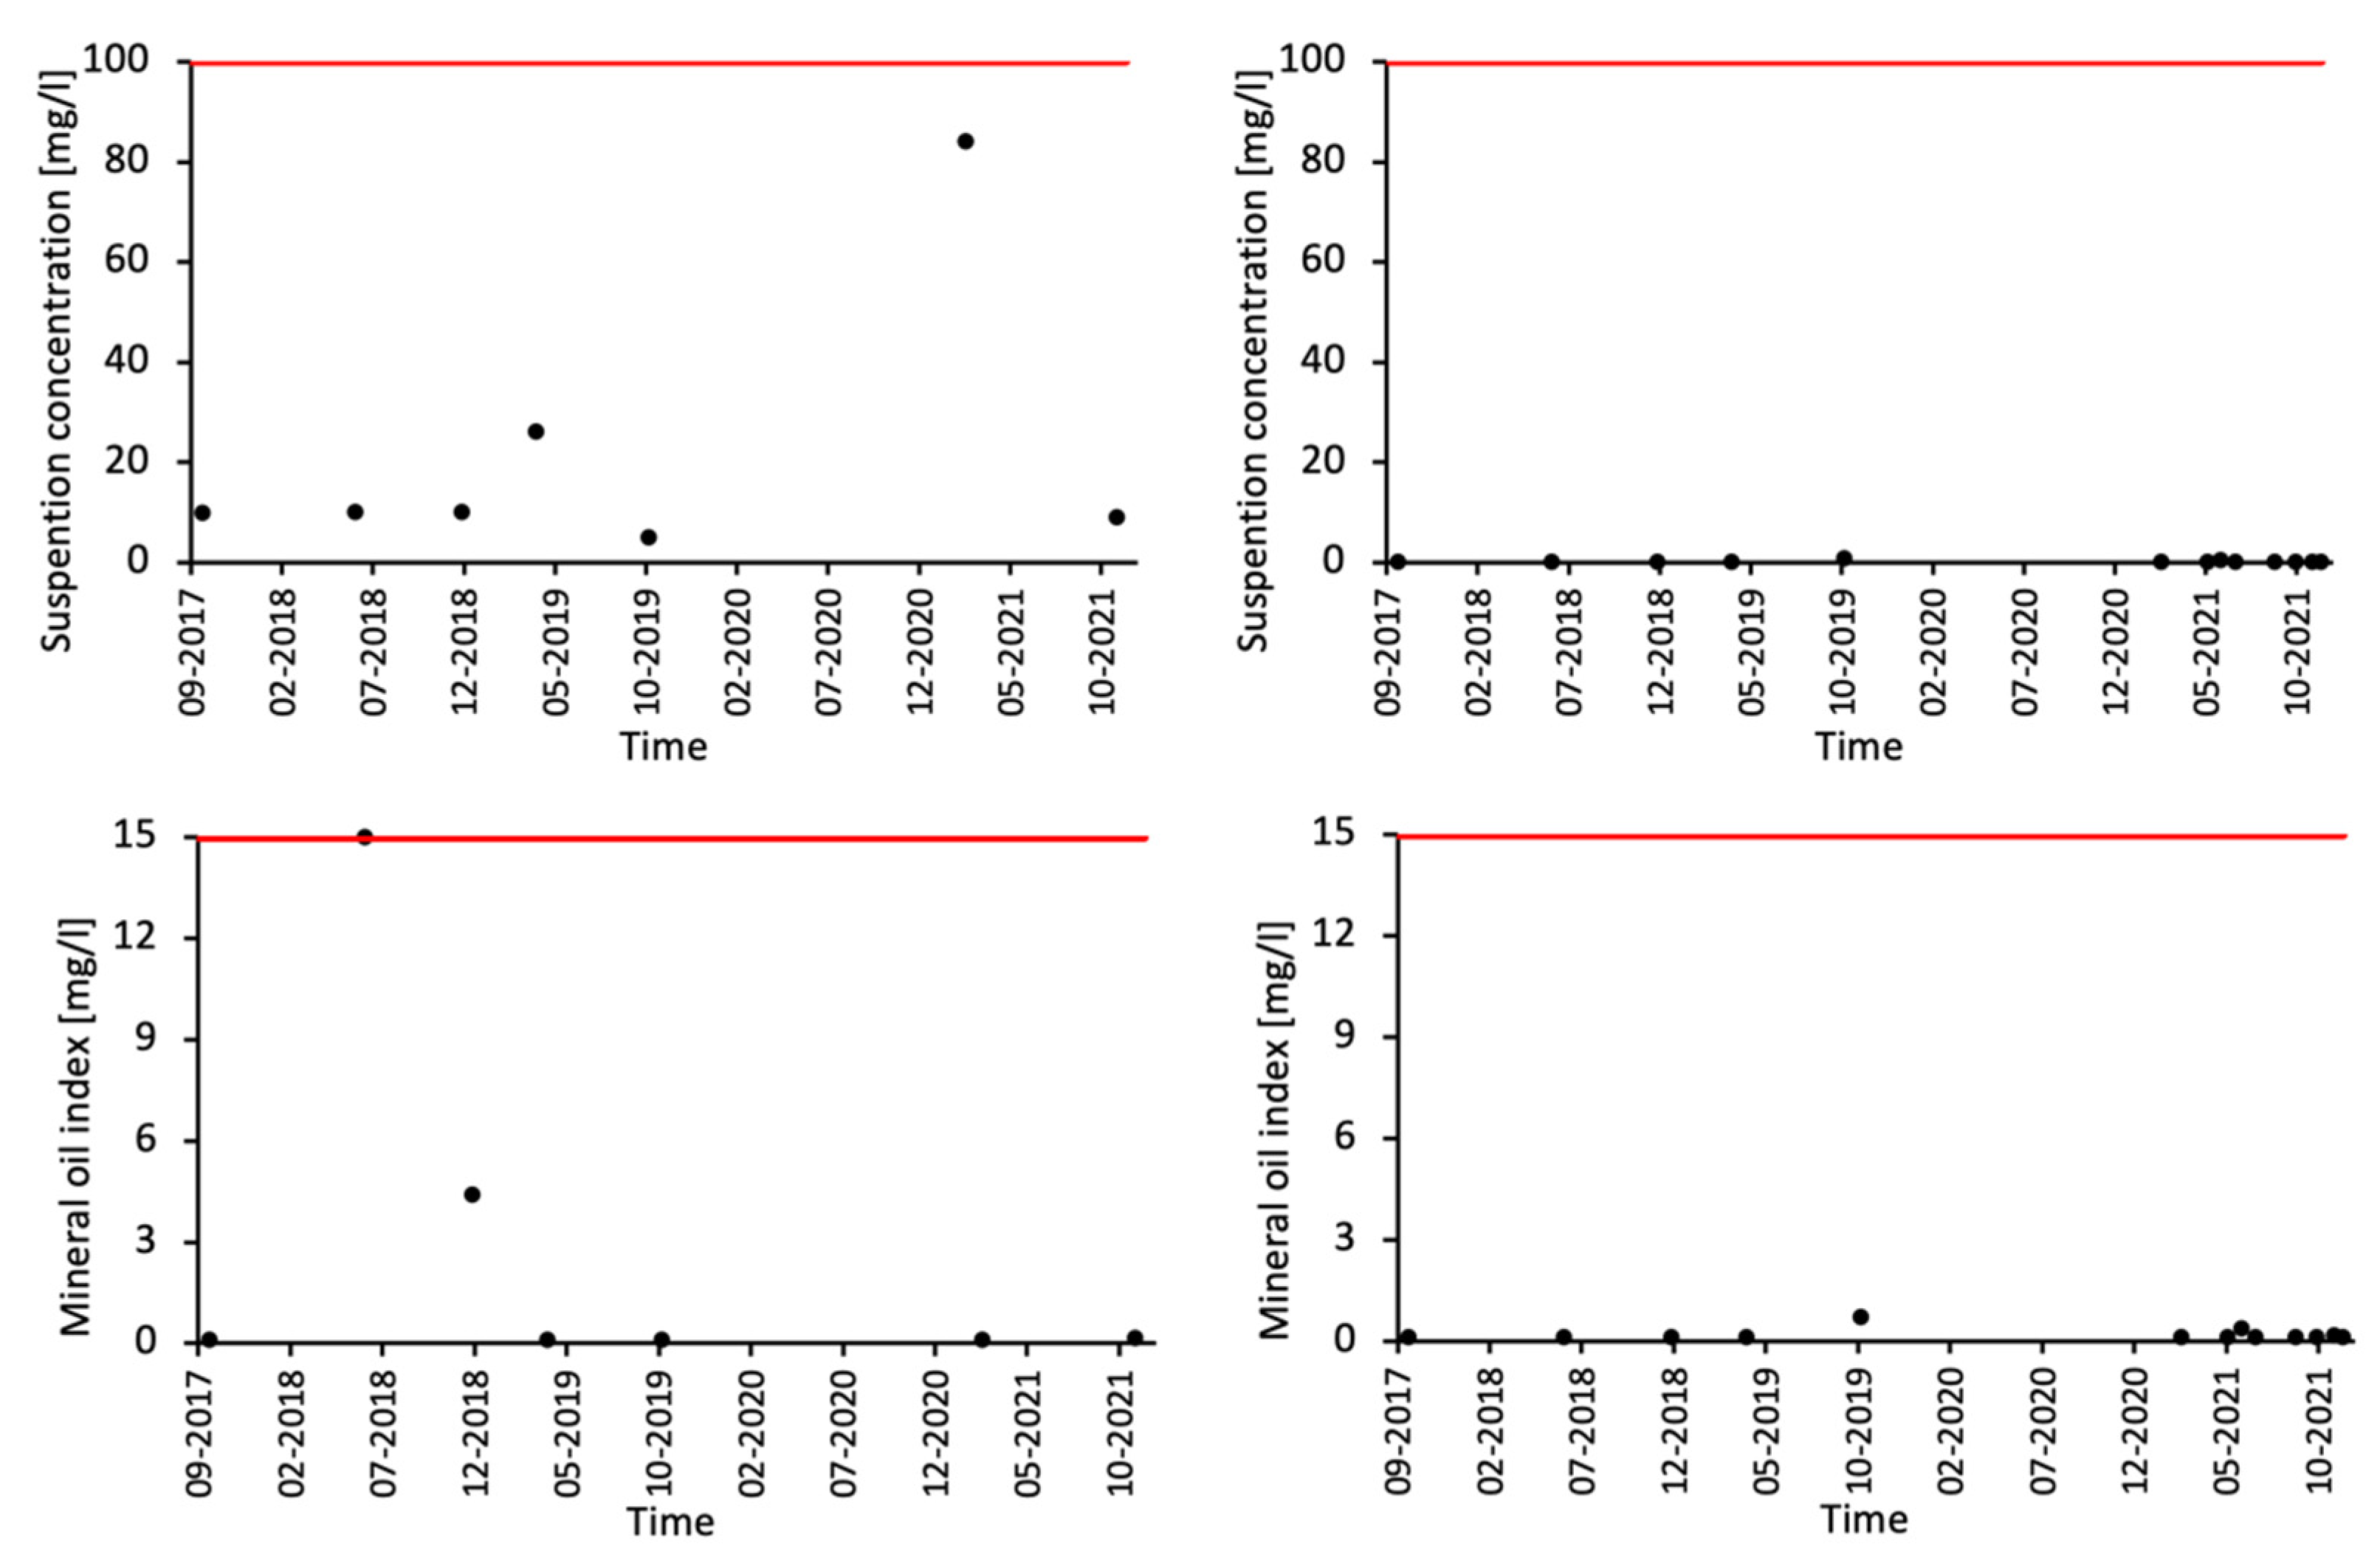
total suspended solids (PN-EN 872:2007 + Ap1:2007),
oil-derived hydrocarbons (PN-EN ISO 9377-2:2003).
Tests on precipitation wastewater were carried out twice a year.
The groundwater testing involved the collection of material in the form of water samples from three piezometers (P-1, P-2, and P-3) distributed on the plant site and the tabular presentation of the results obtained, including the sample collection frequency. The scope of the diagnostic groundwater monitoring tests included the following physico-chemical parameters:
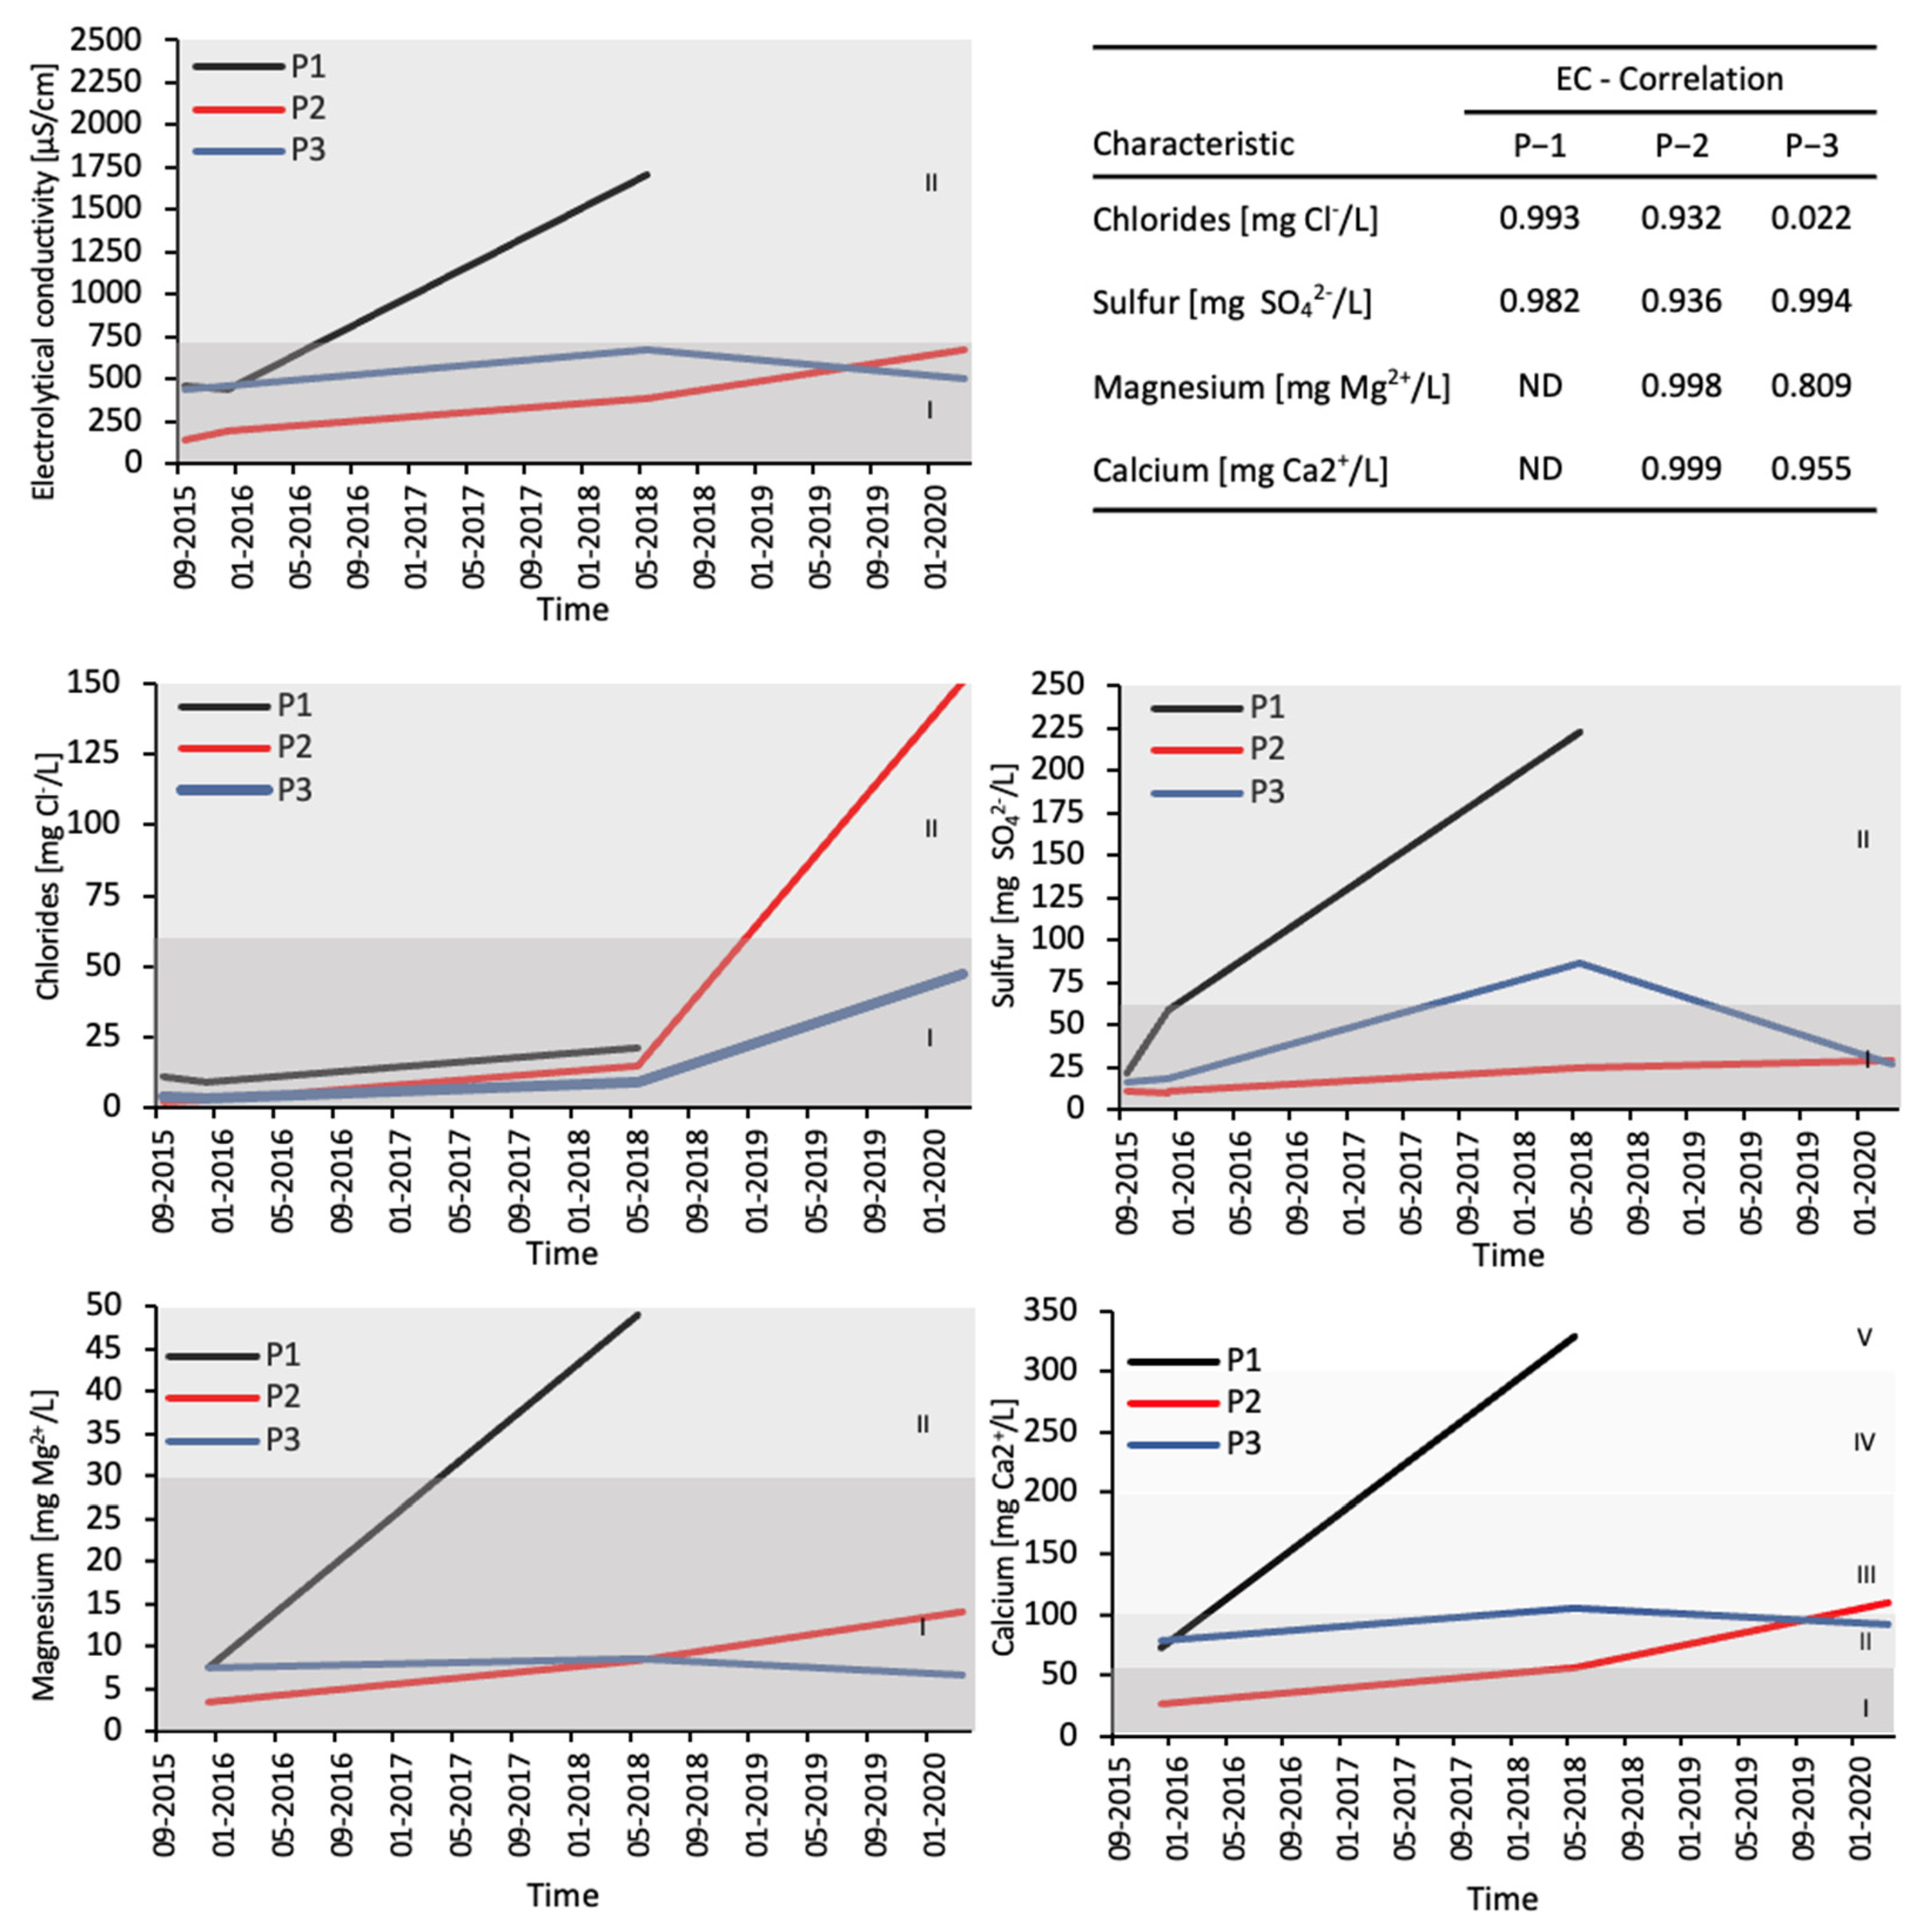
general: the pH (PN-EN ISO 10523:2012), temperature (PN-C-04584:1977), electrolytic conductivity (PN-EN 27888:1999), dissolved oxygen (PN-EN 25813:1997), total organic carbon (PN EN 1484:1997);
ions: calcium, chlorine, magnesium, and sulphates (PN-EN ISO 10304-1:2009 + AC:2012);
inorganic: nitrates, nitrites (PN-78/C-04588/03);
heavy metals: cadmium, chromium, copper, iron, lead, manganese, zinc (PN-EN ISO 11885:2009), and mercury (PN-EN ISO 1483:2007, Chapter 4);
oil-derived hydrocarbons: polycyclic aromatic hydrocarbons, C6-C12 hydrocarbons, and the mineral oil index (PN-EN ISO 9377-2:2003).
Based on the results from the piezometers P-1, P-2, and P-3, the physico-chemical indices of the groundwater were then assigned five quality class levels. The classification was carried out in accordance with the guidelines set out in the Regulation of the Minister of Environment of 23 July 2008 on the criteria and methods of groundwater status assessment (Journal of Laws No 143, item 896), according to which:
classes I–III designate waters of very good, good, and satisfactory quality, respectively,
class IV designates waters of unsatisfactory quality, in which the physico-chemical parameter values are elevated due to the natural processes occurring in groundwater and the pronounced impact of human activities,
class V designates waters of poor quality, in which the physico-chemical parameter values confirm the significant impact of human activities.

2.5. Statistical Analysis

The study calculated the Pearson correlation (r) between selected variables. The analysis was conducted in the Statistica program ver. 13.1.

3. Results

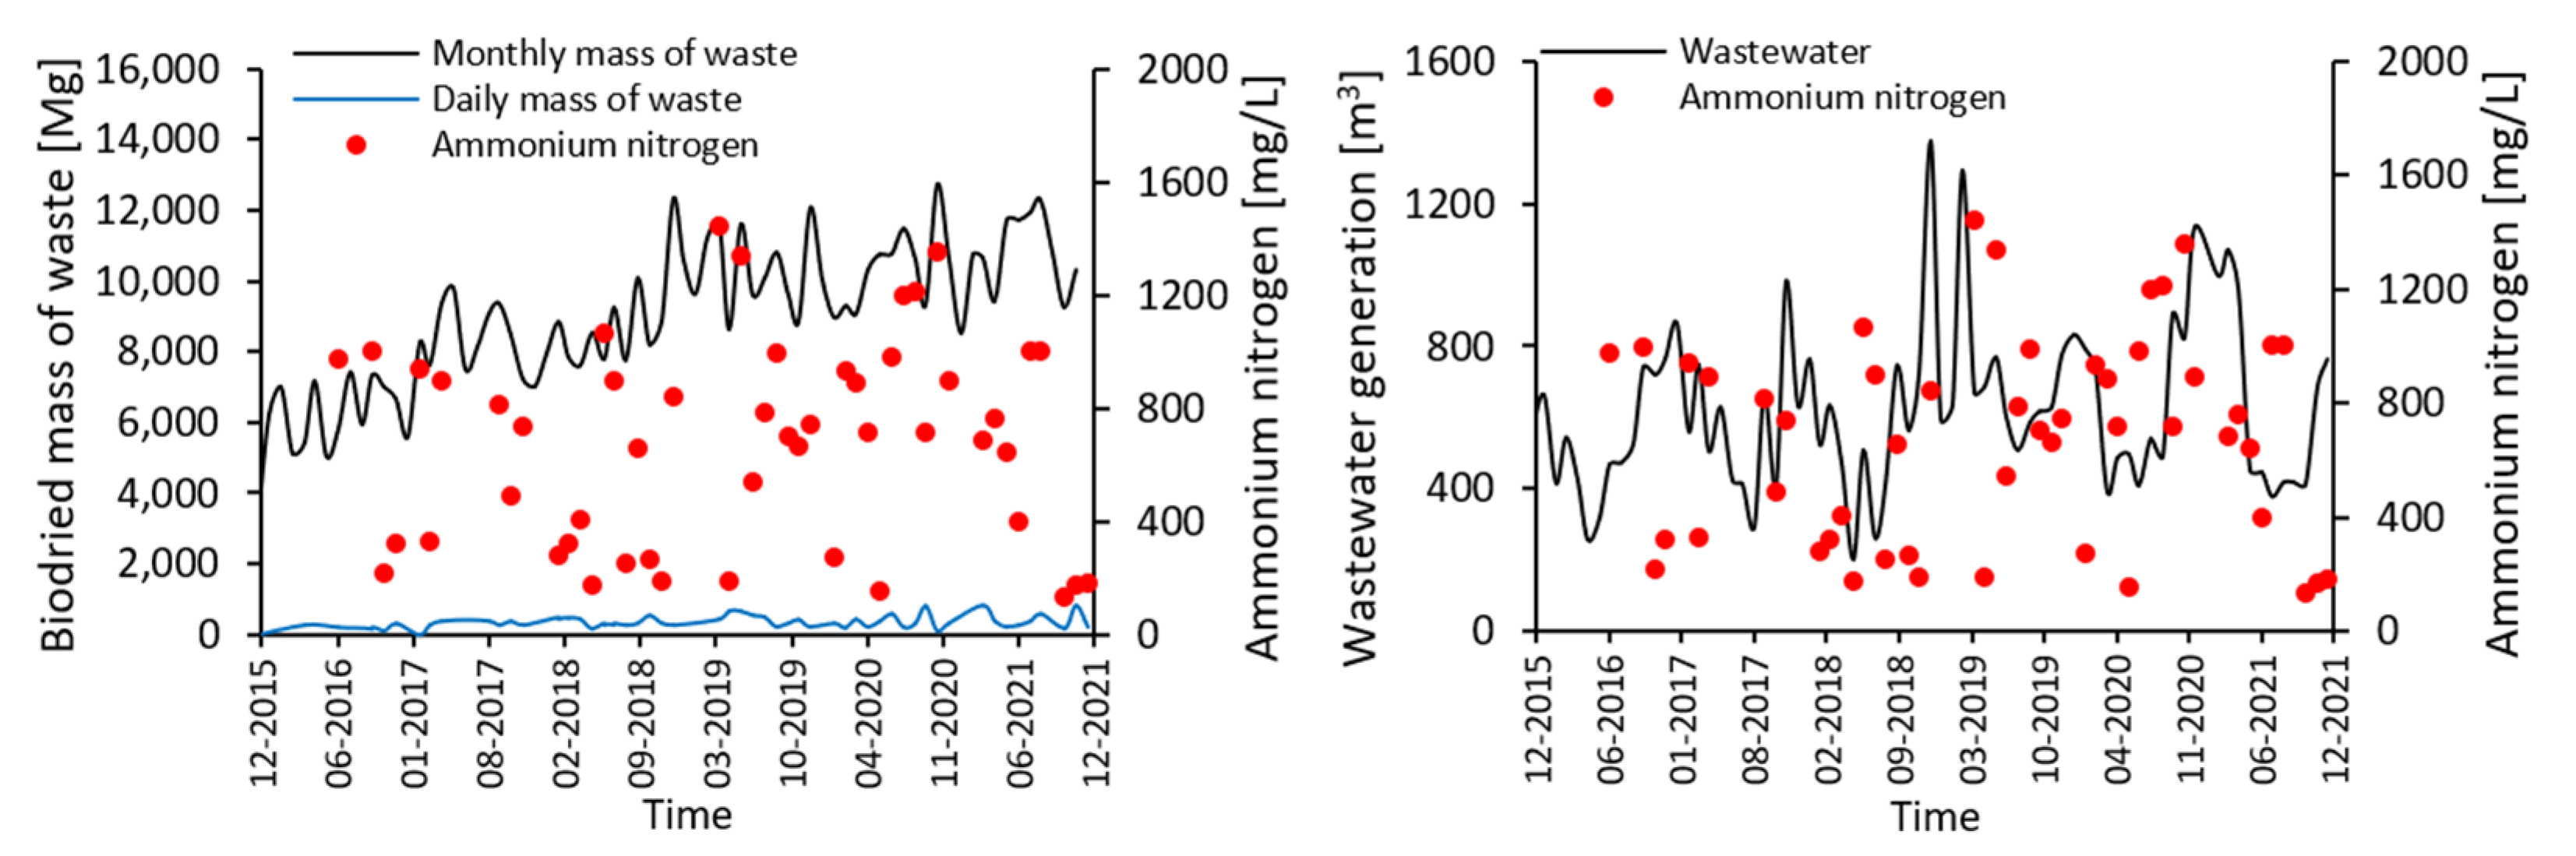
3.1. Industrial Wastewater

The temperature of industrial wastewater was one of the basic physico-chemical indicators under monitoring. This parameter was analysed between December 2015 and December 2021 (Figure 3). The lowest temperature (6.75 °C) was noted in December 2019, while the highest (23.8 °C) was noted in October 2018. The pH value in the study period ranged from 5.1 to 8.5. The levels of ammonium nitrogen, COD, BOD5, nitrites, fluorides, and total phosphorus were also analysed in the wastewater. The concentration of the five latter parameters did not exceed the permissible values set out in the integrated permit and the existing emission standards. However, for ammonium nitrogen, the permissible value of 700 mg/L was exceeded sporadically, and its highest concentration of 1570 mg/L was noted in March 2019. The results discussed above are presented in Figure 3.
Correlations were calculated between the changes in the ammonium nitrogen concentration and the amount of municipal waste subjected to bio-drying in biological chambers and the volume of wastewater generated. Since the quality of industrial wastewater can be subject to large diurnal fluctuations, the ammonium nitrogen concentration results were compared with both the daily data (the daily weight of the waste treated) and monthly data (the monthly weight of the waste processed, the monthly amount of the wastewater generated). In the case under analysis, no correlation was found. The correlation values amounted to −0.062 and 0.063 for the treated waste stream and to 0.084 for the wastewater volume, respectively. Nevertheless, it is presumed that the concentration of wastewater occurs during the rainless period, which results in the wastewater stream being reduced by condensed vapours of the post-process air, which at that time moistens the dried biological filling of the biofilter. The results are shown in graphical form in Figure 4.
The industrial wastewater generated by the ZUOK in Olsztyn was also subjected to tests for heavy metal content. The permissible values and the heavy metal concentrations found in the wastewater under analysis during the period under monitoring are provided in Figure 5.
The concentrations of barium, boron, free and bound cyanides, as well as the concentrations of phenols and mineral oil, were also monitored in the wastewater. During the period under analysis, i.e., in August 2017, the permissible value of the bound cyanide concentration was exceeded once at 6.8 mg/L. The other chemical substances found in industrial wastewater during the study period concerned were at levels well below the permissible values as set out in the integrated permit obtained by the ZUOK in Olsztyn (Figure 6).

3.2. Precipitation Wastewater

In accordance with the mandatory formal and legal requirements, the facilities involved in waste MBP shall be obliged to monitor the precipitation wastewater quality. Qualitative testing of the precipitation wastewater generated by the ZUOK in Olsztyn was carried out in the period between January 2017 and December 2021. The test parameters included the suspended solid concentration and the mineral oil index, whose permissible values, as set out in the integrated permit, are 100 mg/L and 15 mg/L, respectively. Analysis of the test results from the plant site and the access road, according to the permissible value during the period from January 2017 to December 2021, revealed no exceeded permissible values. Throughout the study period, precipitation wastewater from the access road to the ZUOK was characterised by a relatively low suspended solid concentration. Out of the number of measurements taken, it was the individual measurements of the suspended solid index and the mineral oil index, amounting to 84 mg/L in March 2021, and 15.0 mg/L in June 2018, respectively, that showed an approximation to the permissible value (Figure 7).

3.3. Groundwater

The testing of groundwater was carried out between September 2015 and March 2020. During the period under analysis, a reduction in the water level was observed in the P-1 piezometer, which prevented the measurement performance in March 2020. With a few exceptions, the physico-chemical parameters at the test points were characterised by relatively good quality. The P-1 piezometer showed individual excesses of the calcium ion and nitrate concentrations in May 2018 at a level of 329 mg/L and 74 mg/L, respectively. The P-2 piezometer, being one of the piezometers located on the groundwater outflow side, was characterised by noticeably worse physico-chemical parameters, with the particularly noteworthy relatively lower pH value oscillating over the entire study period at the level of 5.9–6.8, and classifying the groundwater as quality class IV. At the point described, an increase in the total organic carbon from 8.31 mg/L in September 2015 to 13.2 mg/L in March 2020 was noted, which resulted in a downgrade from quality class II to class IV. Over the entire study period, a high manganese concentration was also observed in the P-2 piezometer, which classified the water as quality class V (2.54 mg/L in March 2020). It should be clarified, however, that the P-2 piezometer is located on the marshy-peat side, which may explain the low groundwater pH value and other adverse effects at that location. The P-3 piezometer noted a single instance of exceeding the mineral oil index value in March 2020 (2.3 mg/L). The change in the groundwater characteristics during the operation of the ZUOK in Olsztyn is provided in detail in Table 3.

4. Discussion

During the study period, cases of the ammonium nitrogen concentration exceeding the value set out in the integrated permit (700 mg/L) were noted. The observed ammonium nitrogen concentration fluctuated to reach the maximum concentration of 1443 mg/L (an average of 672.91 mg/L throughout the study period). These results do not deviate from other reports provided in the literature, and they appear to be relatively lower. Shao et al. (2012), during the process of mixed municipal waste bio-drying under laboratory conditions, obtained an average ammonium nitrogen concentration at a level of 1350 mg/L in the leachate, and an average concentration of 2140 mg/L in the condensate obtained through negative aeration [37]. Yuan et al. (2014), over a 6-day process of mixed waste bio-drying, obtained the ammonium nitrogen concentration at a level of 1410 mg/L [38]. Moreover, if, in accordance with the reports by Rada et al. (2007), the ammonium nitrogen concentration in the process air was assumed to be 163 mg/nm3, and the efficiency of ammonium nitrogen neutralisation efficiency in the acid scrubber to be 97% [39], the potential ammonium nitrogen concentration in the ZUOK process wastewater could be many times higher. However, attention should be paid to the significant role of precipitation which dilutes post-process wastewater through an open biofilter. Due to the open biofilter design, the operation of the ZUOK in Olsztyn is subject to dynamic seasonal changes. For the reason described above, an analysis was conducted on the correlation between individual quality parameters of industrial wastewater during the study period and the relevant weather data, including total daily precipitation, average daily temperature, total monthly precipitation, and average monthly temperature. Additionally, the above analysis included the calculations of the correlations between the wastewater parameters and the wastewater temperature and pH. Despite the very wide analytical scope, the calculations revealed no significant correlation either. Due to their specificity, the results obtained are difficult to relate to other literature data. A complete correlation analysis is provided in Table 4.
Large oscillations in the ammonium nitrogen concentration over time may suggest the occurrence of large instantaneous fluctuations and, thus, the need for continuous monitoring of the ammonium nitrogen levels in industrial wastewater. The bio-drying process in this aspect is not widely described in the literature. However, the described fluctuations in the ammonium nitrogen concentrations during the bio-drying process are indicated by Zhang et al. (2010) as being characteristic [40]. It should be noted that the ZUOK bio-drying installation comprises 14 reactors operating individually, i.e., being at different stages of the technological process, which affects the quantity and quality of the wastewater emitted. Besides the acid scrubber efficiency, the ammonium nitrogen concentration in industrial wastewater is certainly also dependent on the seasonal changes in the morphological concentration of waste, the results of which are lacking.
It is interesting to compare the ammonium nitrogen content in industrial wastewater generated during the waste bio-drying with the methods ranked lower in the waste handling hierarchy. The average monthly ammonium nitrogen concentration in the ZUOK industrial wastewater ranged from 484.91 mg/L (SD 175 mg/L) to 847 mg/L (SD 187 mg/L) (Figure 8). In a study by Fudala-Ksiazek et al. (2016), which analysed the composition of landfill leachates from the landfill site in Łężyce (Poland) and Nowy Dwór (Poland), the average multi-annual ammonium nitrogen concentration amounted to 666 mg/L (SD 214 mg/L) and 2210 mg/L (SD 314 mg/L) [41]. These data are consistent with the global data, which indicate the ammonium nitrogen concentration in landfill leachates at a level of up to 5000 mg/L [42]. The authors also report the average multi-annual ammonium nitrogen concentration in the composting process wastewater at levels from 839 mg/L (SD 782 mg/L) to 1190 mg/L (SD 449 mg/L).
It should be emphasised that industrial (technological) wastewater is transferred to the public sewer system, after which it is treated in a wastewater treatment plant, therefore—in the case of tightness of the wastewater collection system—there is no direct impact of industrial wastewater on the natural environment. However, the data obtained may be guidelines when designing municipal waste bio-drying installations on a technical scale in other conditions, for example, in places with limited municipal wastewater infrastructure.
The marginal suspended solid concentration and the low mineral oil index in precipitation wastewater from the ZUOK site are indicative of the properly selected and effective application of treatment systems and the proper operation of the pre-treatment facilities before the wastewater is discharged into the point of disposal. The results of the analysis of these parameters in precipitation wastewater from the access road to the ZUOK can provide, to a certain extent, a comparative background. It is noteworthy that the proportion of suspended matter was elevated three times during the February–March period. As reported by Vialkova et al. (2017), the suspended solid concentration in precipitation wastewater is strictly correlated with the season of the year and the generation of snowmelt water [43]. According to the data cited by the authors, snowmelt water can be characterised by the suspended solid concentration at levels ranging from 600 mg/L to as much as 2000 mg/L. Hence, the elevated concentration of this parameter in the ZUOK wastewater in February must be regarded as not coincidental and consistent with other reports. It is noteworthy, however, that only two parameters in precipitation wastewater are subjected to testing, which, in terms of the number of potential sources of chemical and biological pollutants found in municipal waste, appears to be insufficient and allows other research hypotheses to be put forward in the future.
The actual effect of the municipal waste bio-drying process on aquatic environmental conditions can be partially assessed based on the qualitative changes in groundwater in the area under analysis. A proper estimation of the environmental impact is limited, as there has been a considerable lowering of the water table level over the multi-annual measurement period, which resulted in the natural concentration of the analysed indicators to a high level. Three piezometers were investigated, of which one (the P-3 piezometer) was located on the groundwater inflow and the other two on the outflow. As previously mentioned, the analysis of the groundwater on the inflow side classifies it as class I–III, i.e., a class of at least satisfactory quality. As previously mentioned, over the entire period of analysis, a relatively low pH value and relatively high manganese levels were observed in the P-2 piezometer, which classified the groundwater as class IV and V, respectively. While the low pH value can be easily explained by the piezometer location in a marshy-peat area [44,45,46], the high manganese concentration is puzzling. It is presumed that manganese complexes naturally occurred in the ground in the peaty-marshy neighbourhood of piezometers with high organic matter potential forms in the presence of organic compounds and sulphates. Both the organic carbon index and the manganese content have been consistently elevated from the beginning of groundwater monitoring (and of the plant operation) from the peaty-marshy side, while the lowering groundwater level has been exacerbating this phenomenon. In general, these conclusions are in agreement with the results obtained by Zhai et al. (2021) [47]. It should be noted that the anthropogenic sources of manganese emissions include, e.g., Mn ore mining, alloy production, welding, dry alkaline battery production, ceramic use, fungicides, and the petrochemical industry, rather than municipal waste treatment activities [48]. This thread needs to be explored further.
Within the ZUOK impact zone, an increase in the groundwater electrolytic conductance is observed over the study period on the outflow side. As demonstrated above, the increase in electrolytic conductance is a result of the presence of sulphates as well as chlorine, calcium, and magnesium ions (Figure 9).
Despite the continuous increase in the electrolytic conductance level in the P-1 piezometer from 463 to 1707 μS/cm, and in the P-2 piezometer from 134 to 670 μS/cm, the groundwater still qualifies as quality class I and II in this regard.

5. Conclusions

This paper provides a qualitative characterisation of the industrial and precipitation wastewater generated during the multiannual operation of a mixed municipal waste treatment plant under technical conditions based on the bio-drying process. Moreover, it also presents the multiannual changes in the groundwater characteristics at the plant site.
Over the 6-year study period, exceedances of the ammonium nitrogen concentration in industrial wastewater above the value set out in the integrated permit at a level of 700 mg/L were noted. These results, however, do not deviate from the values typical of this process and, moreover, are significantly lower than the results that are characteristic of processes of disposal of municipal waste ranked lower in the municipal waste handling hierarchy. This may suggest that the threshold values as set out in the integrated permit for the bio-drying process are too stringent. The authors believe that the threshold value for ammonium nitrogen in industrial wastewater should be established at a level of 1300–1500 mg/L. In the case studied, ammonium–nitrogen emissions in industrial wastewater do not affect the quality of soil and water environment. This is ensured by the hermetic nature of the method of collecting industrial wastewater and its effective treatment in the wastewater treatment plant. However, in the conditions of a natural discharge of industrial wastewater, such a need may arise even with the application of the simplest methods.
The presented characterisation of precipitation wastewater indicates that the adverse environmental consequences associated with the leaching of pollutants from the plant site by migrating precipitation water can be effectively and efficiently mitigated. These results appear to be particularly significant. However, the data indicate a potential hazard due to vehicular (truck) traffic on the access road to the plant, which involves seasonal elevation of the suspended solid concentration during the snowmelt period and the mineral oil index during the summer period. This aspect may provide an important design guideline.
The proper determination of the impact of the municipal waste treatment plant on the soil and water environment is limited due to the relatively rapid lowering of the groundwater table level during the study period. For this reason, the concentration of calcium and magnesium ions was observed, which is highly correlated with an increase in electrolytic conductance. Significantly, a low groundwater pH value and a relatively high manganese concentration were observed at one of the measuring points, located on the outflow side, from the moment the plant was commissioned. A change in these parameters is natural and arises from the piezometer location.

Author Contributions

Conceptualisation, S.K. and M.D.; Data curation, M.R.; Formal analysis, S.K., M.D. and M.R.; Funding acquisition, S.K., M.D. and M.R.; Investigation, G.T. and M.R.; Methodology, M.D. and G.T.; Project administration, S.K. and M.D.; Resources, G.T.; Software, G.T.; Supervision, M.D.; Validation, G.T.; Visualisation, G.T. and M.R.; Writing—original draft, S.K. and M.D.; Writing—review and editing, S.K., M.D., G.T. and M.R. All authors have read and agreed to the published version of the manuscript.

Funding

This study was financed by the statutory fund of the Faculty of Geoengineering, University of Warmia and Mazury in Olsztyn (number 29.610.024.110).

Data Availability Statement

Not applicable.

Conflicts of Interest

The authors declare no conflict of interest.

References

  1. Hemidat, S.; Achouri, O.; El Fels, L.; Elagroudy, S.; Hafidi, M.; Chaouki, B.; Ahmed, M.; Hodgkinson, I.; Guo, J. Solid Waste Management in the Context of a Circular Economy in the MENA Region. Sustainability 2022, 14, 480. [Google Scholar] [CrossRef]
  2. Jaligot, R.; Chenal, J. Decoupling municipal solid waste generation and economic growth in the canton of Vaud, Switzerland. Resour. Conserv. Recycl. 2018, 130, 260–266. [Google Scholar] [CrossRef]
  3. Kazimierowicz, J.; Zieliński, M.; Dębowski, M. Influence of the Heating Method on the Efficiency of Biomethane Production from Expired Food Products. Fermentation 2021, 7, 12. [Google Scholar] [CrossRef]
  4. Czatzkowska, M.; Harnisz, M.; Korzeniewska, E.; Rusanowska, P.; Bajkacz, S.; Felis, E.; Jastrzębski, J.P.; Paukszto, Ł.; Koniuszewska, I. The impact of antimicrobials on the efficiency of methane fermentation of wastewater sludge, changes in microbial biodiversity and the spread of antibiotic resistance. J. Hazard. Mater. 2021, 416, 125773. [Google Scholar] [CrossRef] [PubMed]
  5. Kazimierowicz, J. Organic Waste Used in Agricultural Biogas Plants. J. Ecol. Eng. 2014, 15, 88–92. [Google Scholar] [CrossRef]
  6. Kazimierowicz, J. Biogas acquisition from selected mixtures of expired food products. J. Ecol. Eng. 2017, 18, 118–122. [Google Scholar] [CrossRef] [Green Version]
  7. Barañano, L.; Unamunzaga, O.; Garbisu, N.; Briers, S.; Orfanidou, T.; Schmid, B.; Martínez de Arano, I.; Araujo, A.; Garbisu, C. Assessment of the Development of Forest-Based Bioeconomy in European Regions. Sustainability 2022, 14, 4747. [Google Scholar] [CrossRef]
  8. Ulloa-Murillo, L.M.; Villegas, L.M.; Rodríguez-Ortiz, A.R.; Duque-Acevedo, M.; Cortés-García, F.J. Management of the Organic Fraction of Municipal Solid Waste in the Context of a Sustainable and Circular Model: Analysis of Trends in Latin America and the Caribbean. Int. J. Environ. Res. Public Health 2022, 19, 6041. [Google Scholar] [CrossRef]
  9. Cucchiella, F.; D’Adamo, I.; Gastaldi, M. Sustainable Italian Cities: The Added Value of Biomethane from Organic Waste. Appl. Sci. 2019, 9, 2221. [Google Scholar] [CrossRef] [Green Version]
  10. Kazimierowicz, J. Depletion Efficiency of Selected Expired Food Products in the Process of Methane Fermentation. J. Ecol. Eng. 2019, 20, 132–137. [Google Scholar] [CrossRef]
  11. Shrestha, B.; Hernandez, R.; Fortela, D.L.B.; Sharp, W.; Chistoserdov, A.; Gang, D.; Revellame, E.; Holmes, W.; Zappi, M.E. A Review of Pretreatment Methods to Enhance Solids Reduction during Anaerobic Digestion of Municipal Wastewater Sludges and the Resulting Digester Performance: Implications to Future Urban Biorefineries. Appl. Sci. 2020, 10, 9141. [Google Scholar] [CrossRef]
  12. Wojnowska-Baryła, I.; Kulikowska, D.; Bernat, K. Effect of Bio-Based Products on Waste Management. Sustainability 2020, 12, 2088. [Google Scholar] [CrossRef] [Green Version]
  13. Kazimierowicz, J.; Dzienis, L.; Dębowski, M.; Zieliński, M. Optimisation of methane fermentation as a valorisation method for food waste products. Biomass Bioenergy 2021, 144, 105913. [Google Scholar] [CrossRef]
  14. Mazzucco, W.; Costantino, C.; Restivo, V.; Alba, D.; Marotta, C.; Tavormina, E.; Cernigliaro, A.; Macaluso, M.; Cusimano, R.; Grammauta, R.; et al. The Management of Health Hazards Related to Municipal Solid Waste on Fire in Europe: An Environmental Justice Issue? Int. J. Environ. Res. Public Health 2020, 17, 6617. [Google Scholar] [CrossRef] [PubMed]
  15. Morris, B.L.; Lawrence, A.R.L.; Chilton, P.J.C.; Adams, B.; Calow, R.C.; Klinck, B.A. Groundwater and Its Susceptibility to Degradation: A Global Assessment of the Problem and Options for Management; Early Warning and Assessment Report Series, RS. 03-3; United Nations Environment Programme: Nairobi, Kenya, 2003; Volume 53, ISBN 9788578110796. [Google Scholar]
  16. Siebert, S.; Burke, J.; Faures, J.M.; Frenken, K.; Hoogeveen, J.; Döll, P.; Portmann, F.T. Groundwater use for irrigation—A global inventory. Hydrol. Earth Syst. Sci. 2010, 14, 1863–1880. [Google Scholar] [CrossRef] [Green Version]
  17. Aeschbach-Hertig, W.; Gleeson, T. Regional strategies for the accelerating global problem of groundwater depletion. Nat. Geosci. 2012, 5, 853–861. [Google Scholar] [CrossRef]
  18. Bierkens, M.F.P.; Wada, Y. Non-Renewable groundwater use and groundwater depletion: A review. Environ. Res. Lett. 2019, 14, 63002. [Google Scholar] [CrossRef]
  19. Foster, S.; Chilton, P.J. Groundwater: The processes and global significance of aquifer degradation. Philos. Trans. R. Soc. B Biol. Sci. 2003, 358, 1957–1972. [Google Scholar] [CrossRef] [Green Version]
  20. Lall, U.; Josset, L.; Russo, T. A snapshot of the world’s groundwater: Change and the unknown. Annu. Rev. Environ. Resour. 2020, 45, 171–194. [Google Scholar] [CrossRef]
  21. Council of the European Communities. Directive 2000/60/EC of the European Parliament and of the Council of 23 October 2000 establishing a framework for Community action in the field of water policy. Off. J. Eur. Communities 2000, 327, 1–72. [Google Scholar]
  22. Alexakis, D.E. Meta-Evaluation of Water Quality Indices. Application into Groundwater Resources. Water 2020, 12, 1890. [Google Scholar] [CrossRef]
  23. Kania, J.; Witczak, S.; Różański, K. Classification of groundwater quality based on variability of hydrogeochemical environment. In Climate Change and its Effects on Water Resources; Springer: Dordrecht, The Netherlands, 2011; pp. 247–257. [Google Scholar]
  24. Hosseinifard, S.J.; Aminiyan, M.M. Hydrochemical Characterization of Groundwater Quality for Drinking and Agricultural Purposes: A Case Study in Rafsanjan Plain, Iran. Water Qual. Expo. Health 2015, 7, 531–544. [Google Scholar] [CrossRef] [PubMed] [Green Version]
  25. Hussein, M.T. Hydrochemical evaluation of groundwater in the Blue Nile Basin, Eastern Sudan, using conventional and multivariate techniques. Hydrogeol. J. 2004, 12, 144–158. [Google Scholar] [CrossRef]
  26. Chen, J.; Huang, Q.; Lin, Y.; Fang, Y.; Qian, H.; Liu, R.; Ma, H. Hydrogeochemical Characteristics and Quality Assessment of Groundwater in an Irrigated Region, Northwest China. Water 2019, 11, 96. [Google Scholar] [CrossRef] [Green Version]
  27. Khan, M.R.; Hasan, F.; Islam, M.; Chowdhury, M.; Sadeak, S.; Amin, A.; Hossain, F.; Ahmed, K.M. Potential Impacts of Industrialization on Coastal Fresh Groundwater Resources in Bangladesh. Sustainability 2022, 14, 8704. [Google Scholar] [CrossRef]
  28. Aleem, M.; Shun, C.J.; Li, C.; Aslam, A.M.; Yang, W.; Nawaz, M.I.; Ahmed, W.S.; Buttar, N.A. Evaluation of Groundwater Quality in the Vicinity of Khurrianwala Industrial Zone, Pakistan. Water 2018, 10, 1321. [Google Scholar] [CrossRef] [Green Version]
  29. Singh, D.D.; Thind, P.S.; Sharma, M.; Sahoo, S.; John, S. Environmentally Sensitive Elements in Groundwater of an Industrial Town in India: Spatial Distribution and Human Health Risk. Water 2019, 11, 2350. [Google Scholar] [CrossRef] [Green Version]
  30. Meng, L.; Zhang, Q.; Liu, P.; He, H.; Xu, W. Influence of Agricultural Irrigation Activity on the Potential Risk of Groundwater Pollution: A Study with Drastic Method in a Semi-Arid Agricultural Region of China. Sustainability 2020, 12, 1954. [Google Scholar] [CrossRef] [Green Version]
  31. Slack, R.J.; Gronow, J.R.; Voulvoulis, N. Household hazardous waste in municipal landfills: Contaminants in leachate. Sci. Total Environ. 2005, 337, 119–137. [Google Scholar] [CrossRef]
  32. Baumann, T.; Fruhstorfer, P.; Klein, T.; Niessner, R. Colloid and heavy metal transport at landfill sites in direct contact with groundwater. Water Res. 2006, 40, 2776–2786. [Google Scholar] [CrossRef]
  33. Prechthai, T.; Parkpian, P.; Visvanathan, C. Assessment of heavy metal contamination and its mobilization from municipal solid waste open dumping site. J. Hazard. Mater. 2008, 156, 86–94. [Google Scholar] [CrossRef] [PubMed]
  34. Wdowczyk, A.; Szymańska-Pulikowska, A. How to Choose Pollution Indicators for Monitoring Landfill Leachates. Proceedings 2020, 51, 23. [Google Scholar]
  35. Adhikari, K.; Pal, S. Assessment of Pollution Potential of Soil and Groundwater in a Non-Engineered MSW Landfill Site. Intern. J. Environ. Sci. Dev. 2016, 7, 207–210. [Google Scholar] [CrossRef] [Green Version]
  36. Kasiński, S.; Dębowski, M.; Olkowska, M.; Rudnicki, M. Analysis of the Long-Term Mass Balance and Efficiency of Waste Recovery in a Municipal Waste Biodrying Plant. Energies 2021, 14, 7711. [Google Scholar] [CrossRef]
  37. Shao, L.M.; He, X.; Yang, N.; Fang, J.J.; Lü, F.; He, P.J. Biodrying of municipal solid waste under different ventilation modes: Drying efficiency and aqueous pollution. Waste Manag. Res. 2012, 30, 1272–1280. [Google Scholar] [CrossRef]
  38. Yuan, H.; Deng, L.; Chen, Y. Optimization of biodrying pretreatment of municipal solid waste and microbial fuel cell treatment of leachate. Biotechnol. Bioprocess Eng. 2014, 19, 668–675. [Google Scholar] [CrossRef]
  39. Rada, E.C.; Franzinelli, A.; Taiss, M.; Ragazzi, M.; Panaitescu, V.; Apostol, T. Lower heating value dynamics during municipal solid waste bio-drying. Environ. Technol. 2007, 28, 463–469. [Google Scholar] [CrossRef]
  40. Zhang, D.Q.; Zhang, H.; Wu, C.L.; Shao, L.M.; He, P.J. Evolution of heavy metals in municipal solid waste during bio-drying and implications of their subsequent transfer during combustion. Waste Manag. 2011, 31, 1790–1796. [Google Scholar] [CrossRef]
  41. Fudala-Książek, S.; Łuczkiewicz, A.; Kulbat, E.; Remiszewska-Skwarek, A. Characteristics of Liquid By-Products Generated at Municipal Solid Waste Plants (MSWP) in Terms of Treatment Method Choice. Annu. Set Environ. Prot. 2016, 18, 952–963. (In Polish) [Google Scholar]
  42. Teng, C.; Zhou, K.; Peng, C.; Chen, W. Characterization and treatment of landfill leachate: A review. Water Res. 2021, 203, 117525. [Google Scholar] [CrossRef]
  43. Vialkova, E.; Zemlyanova, M.; Vorotnikova, A.; Cherkashin, D.; Voronov, A.; Maksimov, L. The protection of urban areas from surface wastewater pollutions. MATEC Web Conf. 2017, 106, 07008. [Google Scholar] [CrossRef] [Green Version]
  44. Wang, H.; Nie, L.; Xu, Y.; Du, C.; Zhang, T.; Wang, Y. Effects of Highway-Related Pollutant on the Groundwater Quality of Turfy Swamps in the Changbai Mountain Area. Int. J. Environ. Res. Public Health 2018, 15, 1652. [Google Scholar] [CrossRef] [PubMed] [Green Version]
  45. Clymo, R.S. Ion exchange in Sphagnum and its relation to bog ecology. Ann. Bot. 1963, 27, 309–324. [Google Scholar] [CrossRef]
  46. Gorham, E.; Eisenreich, S.J.; Ford, J.; Santlemann, M.V. The chemistry of bog water. In Chemical Processes of Lakes; Stumm, W., Ed.; John Wiley and Sons: New York, NY, USA, 1985; pp. 339–362. ISBN 978-0471882619. [Google Scholar]
  47. Zhai, Y.; Han, Y.; Xia, X.; Li, X.; Lu, H.; Teng, Y.; Wang, J. Anthropogenic Organic Pollutants in Groundwater Increase Releases of Fe and Mn from Aquifer Sediments: Impacts of Pollution Degree, Mineral Content, and pH. Water 2021, 13, 1920. [Google Scholar] [CrossRef]
  48. Avila, D.S.; Puntel, R.L.; Aschner, M. Manganese in health and disease. Met Ions Life Sci. 2013, 13, 199–227. [Google Scholar]
Figure 1. The layout of the process line of the Municipal Waste Disposal Plant (ZUOK) in Olsztyn; source: ZUOK internal materials.
Energies 15 09467 g001
Figure 2. The wastewater system at the municipal waste disposal plant (ZUOK) in Olsztyn; source: maps.google.pl (accessed on 13 December 2022).
Energies 15 09467 g002
Figure 3. Characteristics of the basic physical parameters of industrial wastewater generated on the ZUOK site in Olsztyn between December 2015 and December 2021. The red line indicates the permissible values as set out in the integrated permit.
Energies 15 09467 g003
Figure 4. A change in the ammonium nitrogen concentration in industrial wastewater versus the amount of waste treated and the amount of wastewater generated. Data for the period between December 2015 and December 2021.
Energies 15 09467 g004
Figure 5. The heavy metal content in the industrial wastewater generated on the ZUOK site in Olsztyn between December 2015 and December 2021. The red line indicates the permissible values as set out in the integrated permit.
Energies 15 09467 g005
Figure 6. The contents of other chemical parameters in the industrial wastewater generated on the ZUOK site in Olsztyn between December 2015 and December 2021. The red line indicates the permissible values as set out in the integrated permit.
Energies 15 09467 g006
Figure 7. Characteristics of precipitation wastewater from the ZUOK site in Olsztyn between October 2017–October 2021. The red line indicates the permissible values as set out in the integrated permit.
Energies 15 09467 g007
Figure 8. The average monthly ammonium nitrogen concentration in the ZUOK industrial wastewater between December 2015 and December 2021.
Energies 15 09467 g008
Figure 9. Graphical and tabular representation of the correlation between electrolytic conductance and the groundwater ion concentration at the ZUOK in Olsztyn between September 2015 and March 2020. Roman numerals I–V indicate the quality class levels of the groundwater.
Energies 15 09467 g009
Table 1. Technological conditions for the bio-drying process.
Phase NumberAerationTemperatureDuration
16000 m³/h65 °C1 day
28000 m³/h60 °C4 days
38000 m³/h55 °C3 days
411,000 m³/h55 °C1 day
511,000 m³/h35 °C12 h
Table 2. Parameters of industrial wastewater specified in the integrated permit of the ZUOK.
CharacteristicValueUnit
pH6.5–9.5
BOD5≤1000mg O2/L
COD≤1700mg O2/L
Ammonium nitrogen≤200mg NNH4/L
Nitrites≤10mg NNO3/L
Total phosphorus≤20mg P/L
Chlorides≤1000mg/L
Sulphates≤500mg/L
Cadmium≤0.4mg Cd/L
Chrome (total)≤1mg Cr/L
Mercury≤0.06mg Hg/L
Table 3. A change in the physico-chemical characteristics of groundwater during the operation of the ZUOK in Olsztyn between September 2015 and March 2020.
NoParameterUnitP-1P-2P-3
September 2015December 2015May 2018September 2015December 2015May 2018March 2020September-2015December 2015May 2018March 2020
1Water levelm7.58.3-7.527.9--6.757.3--
2pHpH7.67.57.266.25.96.87.56.87.27.4
3Specific electrolytic conductivityµS/cm4634411707134196380670434454669498
4Total organic carbon (TOC)mg/L7.445.75.88.317.215.313.23.852.63.932.4
1Calciummg/L 72329 2656110 7810691.3
2Chloridesmg/L10.99.2212.42.7151514.13.1947
3Magnesiummg/L 7.549 3.58.314.2 7.58.66.7
4Sulphur (VI)mg/L21.95922311.311252916.1188627
1Nitratesmg/L6.211.1742.414.50.71.225.6373315
2Nitritesmg/L0.143<0.0660.01<0.02<0.066<0.01<0.010.0514<0.066<0.01<0.01
3Cadmiummg/L<0.0005<0.0002<0.0001<0.0005<0.00020.000330.0006<0.0005<0.0002<0.00010.0006
4Chromium (VI)mg/L<0.005<0.01<0.003<0.005<0.010.004<0.013<0.005<0.010.005<0.013
5Coppermg/L0.00513<0.0040.0730.0156<0.0040.0720.0250.00750.0040.046<0.019
6Ironmg/L 0.082.1 0.132.60.273 0.0150.250.581
7Leadmg/L<0.0050.0040.0053<0.005<0.0040.0028<0.006<0.005<0.0040.0017<0.006
8Manganesemg/L 0.380.25 1.98.72.54 0.0130.00970.015
9Mercurymg/L<0.0001<0.00010.00069<0.0001<0.00010.0013<0.00001<0.0001<0.00010.00022<0.0001
10Zincmg/L<0.02<0.0050.0470.06<0.0050.0770.024<0.020.0050.0460.023
1Total PAHmg/L<0.00008<0.000005<0.000010.00049<0.000005<0.00001<0.00001<0.00008<0.000005<0.00001<0.00001
2Hydrocarbons C6-C12/petrolmg/L <0.05<0.05 <0.050<0.05<0.050 <0.050<0.05<0.050
3Mineral oil indexmg/L0.0410.45<0.10.041<0.10<0.1<0.10.086<0.10<0.12.3
Description:
Class I Class II Class III Class IV Class V
Table 4. The results of the r-Pearson analysis of the correlation between the change in the parameters of industrial wastewater generated during the municipal waste bio-drying process and the weather data at the municipal waste disposal plant (ZUOK) in Olsztyn between December 2015 and December 2021.
Wastewater
Characteristics
Wastewater CharacteristicsDaily DataMonthly Data
pHTemperatureTotal Daily
Precipitation
Average Air TemperatureTotal Monthly PrecipitationAverage Air Temperature
pH-0.234−0.1590.2400.1590.190
Temperature0.234-−0.0080.2970.4630.395
Ammonium nitrogen−0.074−0.1340.1720.2850.0350.282
Publisher’s Note: MDPI stays neutral with regard to jurisdictional claims in published maps and institutional affiliations.

