Article

Dynamic Process Modeling of Topside Systems for Evaluating Power Consumption and Possibilities of Using Wind Power

1
Department of Geoscience and Petroleum, Norwegian University of Science and Technology, 7031 Trondheim, Norway
2
Process Technology, Sintef Industry, 7465 Trondheim, Norway
*
Author to whom correspondence should be addressed.
These authors contributed to this work in the order of their names.
Energies 2022, 15(24), 9482; https://doi.org/10.3390/en15249482
Submission received: 7 November 2022 / Revised: 2 December 2022 / Accepted: 6 December 2022 / Published: 14 December 2022

Abstract

:
Norwegian offshore wind farms may be able to supply power to offshore oil and gas platforms in the near future thanks to the expeditious development of offshore wind technology. This would result in a reduction in CO2 emissions from oil and gas offshore installations, which are currently powered predominantly by gas turbines. The challenge with using wind power is that offshore oil and gas installations require a fairly constant and stable source of power, whereas wind power typically exhibits significant fluctuations over time. The purpose of this study is to perform a technical feasibility evaluation of using wind power to supply an offshore oil and gas installation on the basis of dynamic process simulations. Throughout the study, only the topside processing system is considered, since it is the most energy-intensive part of an oil and gas facility. An offshore field on the Norwegian Continental Shelf is used as a case study. The results indicate that, when the processing system operates in steady-state conditions, it cannot be powered solely by wind energy, and another power source is required to compensate for low wind power generation intervals. An alternative would be to store wind energy during periods of high generation (e.g., by producing hydrogen or ammonia) and use it during periods of low generation. Utilizing energy storage methods, wind energy can be continuously used for longer periods of time and provide a suitable constant power source for the studied case. Higher constant power can also be provided by increasing the efficiency of energy recovery and storage processes. Alternatively, these two technologies may be integrated with gas turbines if the required storage cannot be provided or higher power is required. It was estimated that the integration of wind energy could result in noticeable reductions in CO2 emissions for the case study. Additionally, according to the results, the production, storage, and reuse of hydrogen and ammonia on-site may be viable options for supplying power.

1. Introduction

Offshore oil and gas platforms are usually isolated systems consisting of many energy-consuming units with local power supplied by gas turbines that use natural gas or diesel [1]. Gas turbines can also be used to directly drive compressors and pumps. Platforms on the Norwegian Continental Shelf (NCS) usually consume from 10 megawatts (MW) to several hundred MW of energy [2]. In offshore facilities for oil and gas production, approximately 85% of carbon dioxide (CO2) emissions are currently derived from gas turbines [3]. New offshore platforms are expected to be placed in deeper water and further out to sea, which would result in considerably higher energy consumption per unit of produced hydrocarbon than that by current installations [2]. Furthermore, production usually becomes more energy-intensive, as oil becomes heavier over time, and recovery becomes more challenging, e.g., due to the implementation of enhanced oil recovery (EOR) techniques. Additionally, as the water cut (WC) and gas-oil ratio (GOR) increase, more energy is required to lift, transport, and process each unit of oil equivalent produced. The more power is consumed, the more CO2 is emitted. Therefore, the environmentally friendly and sustainable operation of offshore platforms is becoming an ever-greater challenge as the world moves towards a low-carbon future. Due to public and government pressure, companies operating old offshore installations in the North Sea and the Norwegian Sea have to reduce their carbon footprint [4] and are planning for the energy transition [5]. A 2020 goal of the European Union (EU) was to ensure that 20% of its gross final energy consumption would come from renewable sources, and by 2030, this share should rise to 32%. It would take an unprecedented transformation of the energy system for EU-27 to achieve the target of 32% renewable energy by 2030 [6].
There is increasing research being conducted on the energy system optimization of offshore oil and gas fields. The majority of researchers have proposed new methods to reduce energy consumption and save energy for offshore oil and gas fields. These methods include setting up a cogeneration system through waste-heat recovery, adjusting equipment parameters to determine the most cost-effective and (energy) efficient operation scheme, and integrating renewable energy with traditional power generation methods, which is the focus of this study. According to Yang et al. [7], there is an urgent need to redesign oil and gas fields by integrating traditional and renewable energies. A clean alternative to fossil-fuel-based gas turbines is required to reduce CO2 emissions, such as offshore wind power, power from the shore, or hydrogen-based gas turbine fuel. The majority of the new methods are prohibitively expensive, have stability issues, require a considerable amount of grid transmission capacity, or are not yet available. Thus, a new operational strategy is needed to best use the available resources within the constraints of new energy supply options [1].
Wind power is the main type of renewable energy that has been exploited on a large scale in recent years [8]. An offshore wind farm enables using wind resources to power near-offshore platforms. The technology is already commercially available, and the oil and gas industry has expressed interest in developing offshore wind power installations [9]. The integration of an offshore wind farm is comparable in terms of weight and space requirements to other alternatives for reducing emissions from offshore platforms [1], and an important part of the global energy transition is the usage of floating offshore wind farms. However, neither an offshore greenfield development project nor an operating brownfield project has yet included floating wind electrification in their development and design [10]. Europe has a total of 22 gigawatts (GW) of offshore wind installed, 77% of which is in the North Sea [11]. It is estimated that this capacity would reach 70 GW by 2030 and 112 GW by 2040, according to ENTSOE [12]. There are many studies on this topic from a variety of perspectives, such as economic and technical. Hu et al. [13] proposed a method for assessing the stability of wind power systems on isolated offshore oil platforms. On the basis of the simulation results, wind turbine generators can be added to conventional isolated power systems, such as the power systems of offshore oil platforms, which can reduce operational costs. Korpås et al. [14] investigated the feasibility of operating a wind farm with a capacity of 4 × 5 MW in parallel with a gas turbine. According to He [2] and Korpås [14], wind power plants must be appropriately sized for hybrid wind–gas power to be cost-effective. Mcdonagh et al. [15] developed a model to evaluate the economic efficiency of different scenarios for hydrogen production in offshore wind farms. Zhang et al. [16] studied offshore oil and gas fields powered simultaneously by wind turbines and gas turbines. However, their study focused only on the economics and environmental protection of the offshore platform energy system following the introduction of wind power. Xueqing et al. [17] investigated the combination of wind turbines and gas turbines for offshore oil and gas fields, and how to use the excess electricity to produce hydrogen. This study was primarily concerned with the mixing of hydrogen with natural gas at an onshore gas gate station. Svendsen [1] developed a new integrated energy system model for operational planning and simulation to reduce local CO2 emissions. An energy consumption mathematical model was proposed, as well as some factors that can affect the performance of an energy system were studied.
Despite the rapid investment in and studies on wind energy, its characteristic intermittency is inevitable and can lead to power curtailments. This problem can be alleviated with wind–hydrogen technology [18]. The production of green hydrogen and floating offshore wind have been identified as game changers. The combination of these two technologies can provide the opportunity to develop green and renewable energy in deeper waters and accelerate the energy transition.
This study presents a synergy analysis of offshore wind farms, energy storage, and gas turbines to power an offshore oil and gas installation. It also explores how these synergies could be beneficial to the environment. We describe opportunities and challenges associated with the electrification of an offshore platform by an offshore wind farm. For the specific case study, we (i) assess the feasibility of using wind energy to power the topside process of an oil and gas offshore field, (ii) estimate the amount of required energy storage and determine the feasibility of using hydrogen or ammonia as potential energy storage forms, (iii) determine if gas turbines would still be necessary to meet peak demand, (iv) determine the most relevant takeaways to design offshore wind-powered fields in order to maximize wind power utilization while reducing the cost and complexity of the project, and (v) study the impact of using wind power on the CO2 emissions of oil and gas offshore installations.
The paper is organized as follows: Section 2 presents the case study and describes topside processing system modeling. This is followed by a discussion of the power supply from the wind farm being considered either a variable or a constant parameter. The results are presented in Section 3. Section 4 contains the conclusions and plans for future work.

2. Materials and Methods

2.1. Case Study

The installation considered in this study belongs to an offshore oil field located in the Tampen region on the NCS. It is part of a larger network of installations and accounts for one of Norway’s largest emissions sources.
Instantaneous wind power values were provided on an hourly basis by SINTEF for January 2015, as shown in Figure 1. These power values were estimated using wind data collected in the NCS region in 2015 and assuming an imaginary wind farm with a peak power output of 88 MW [19] located in the Tampen area. This wind farm will be used in the future to power offshore oil and gas fields in the area and is, therefore, highly relevant to our study case. Figure 1 is the power generation profile that was used for the current study.

2.2. Dynamic Model of the Topside Processing System

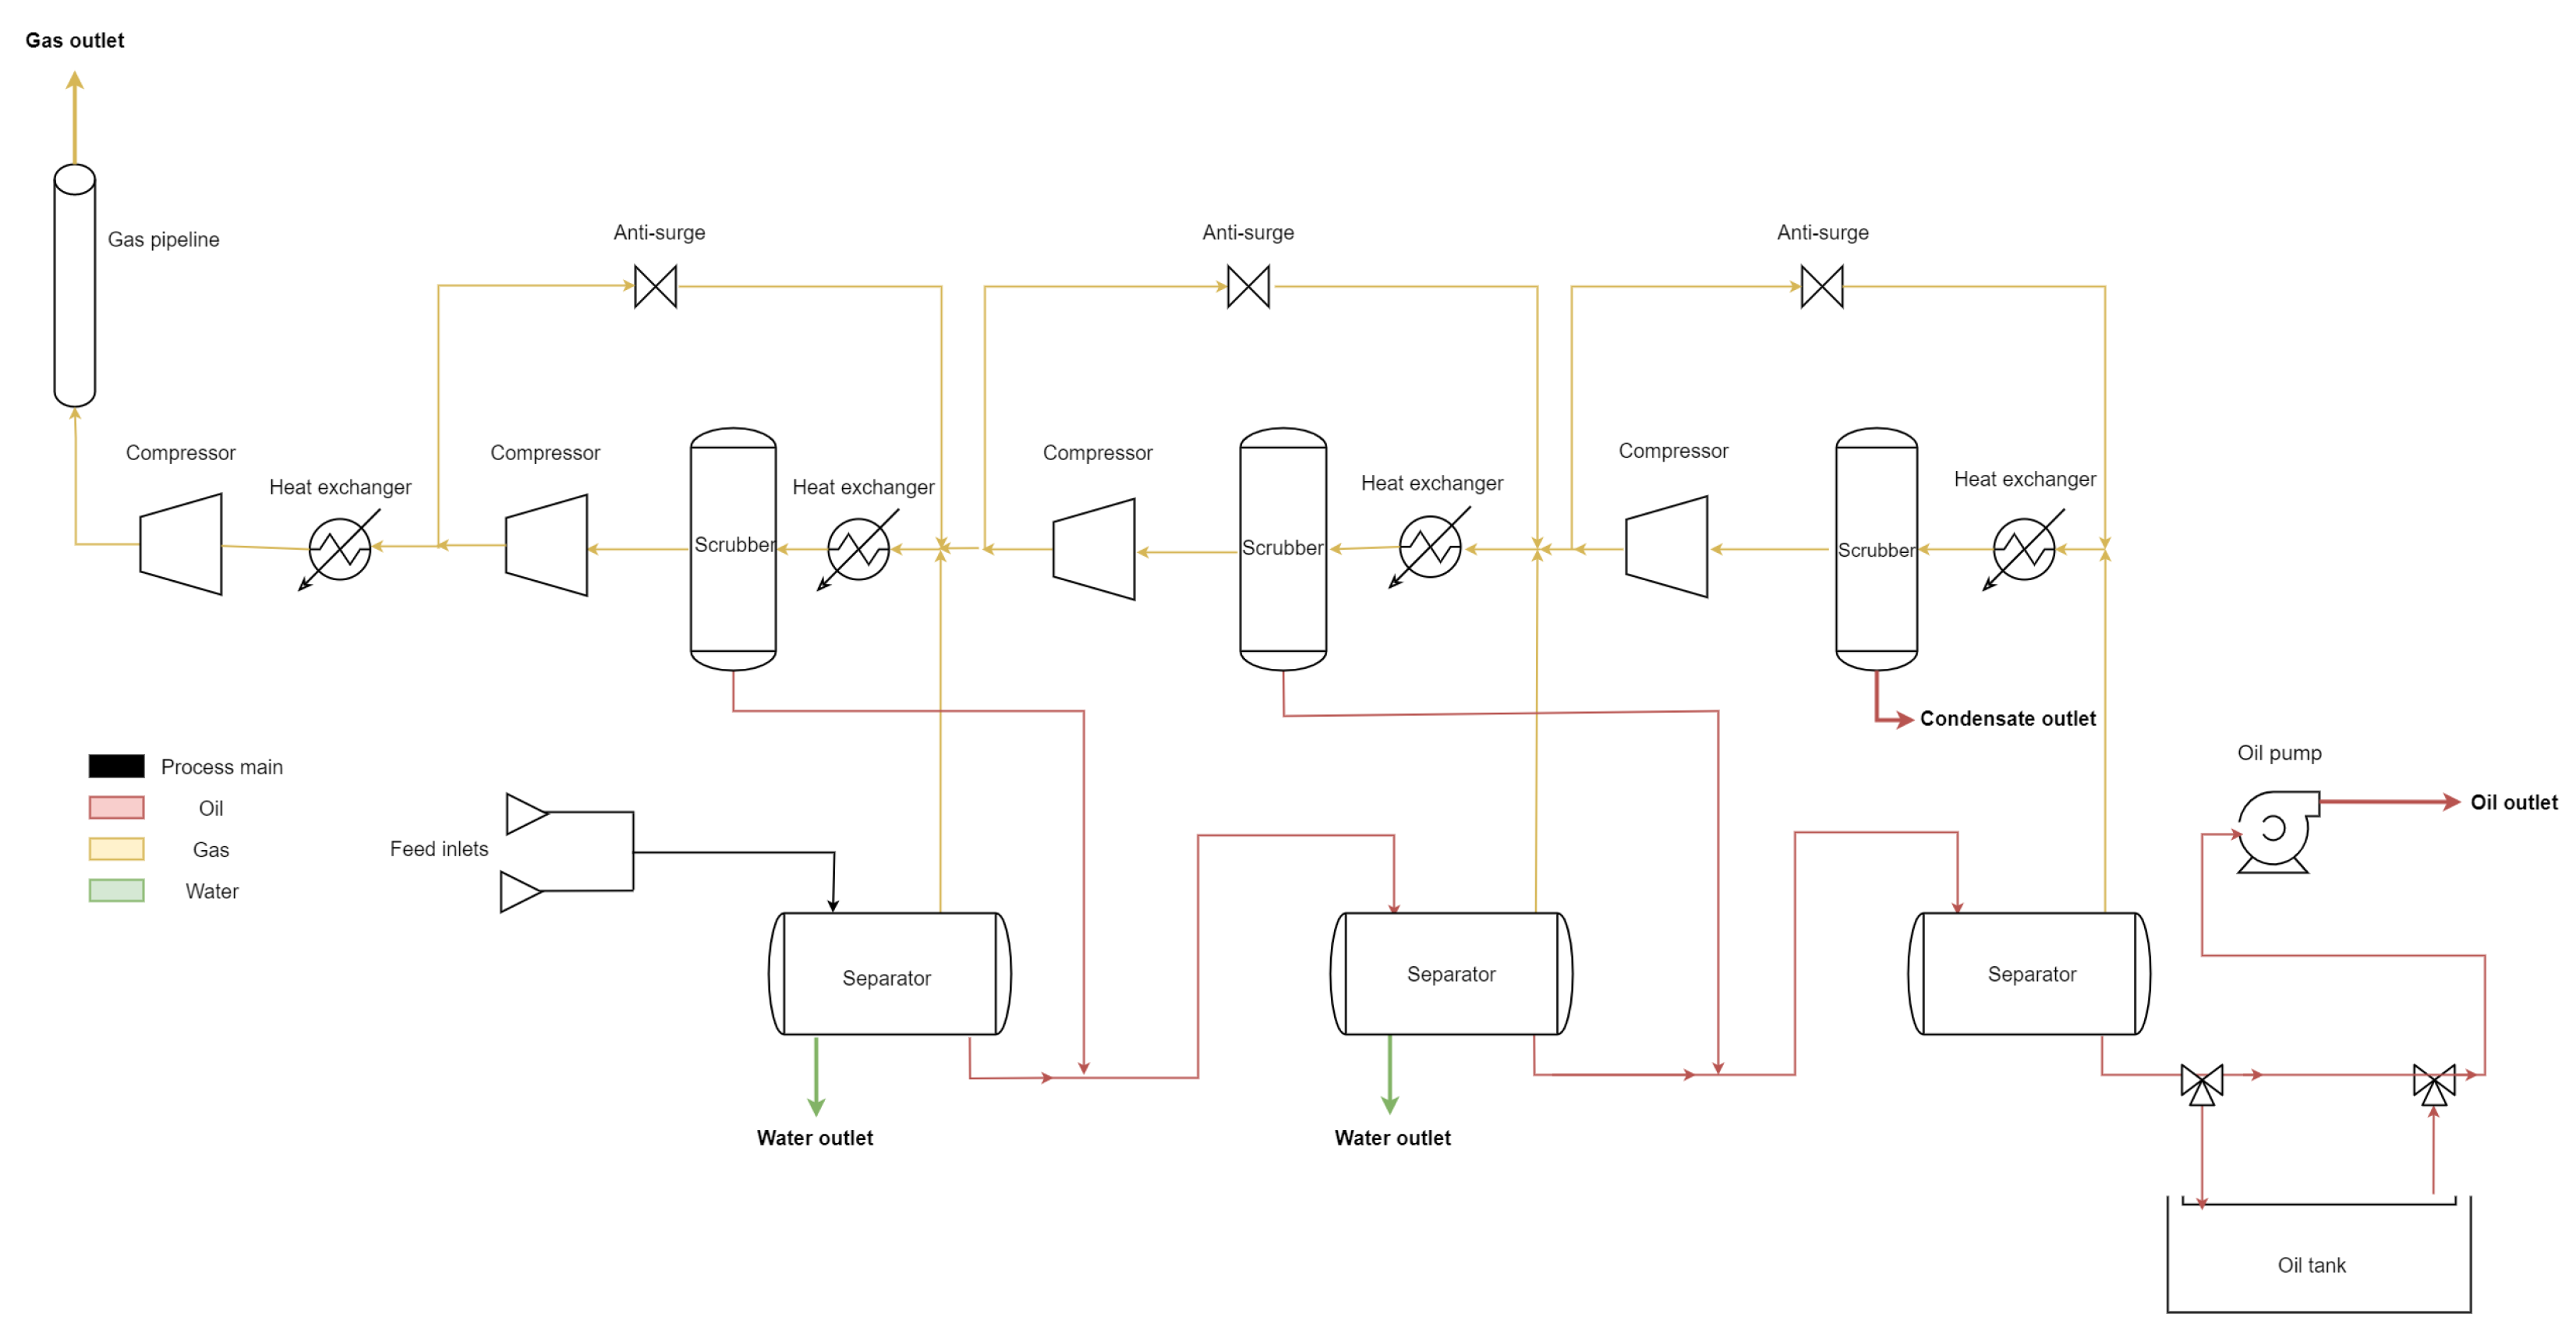
A model of the topside processing system was created using K-Spice SimExplorer Version 4.2.0.0, a dynamic process simulation tool. The employed simulator is a multipurpose dynamic process simulator used for the system design of oil and gas processing facilities from FEED phases to startup and during operations. The simplified process flow diagram of the model is shown in Figure 2. It consists of a typical three-stage gravity separation process to separate oil, gas, and water with compression with interstage cooling and gas scrubbing. Gas and oil export systems are included. In addition, an antisurge loop was designed for each stage to prevent the compressors from being overloaded or surging. Performance curves for the compressors were considered. Other systems such as oil stabilization, gas dehydration, and water treatment were not included because their energy usage is small compared with that of the rest. Each stage was operated at different pressure levels to induce separation. The separators had identical dimensions. Since the first two separators were three-phase separators, water, oil, and gas were separated, whereas the third one was a two-phase separator that only separated oil and gas. Table 1 presents the key properties of the model.
Once the processing system had been modelled, the next step was to extract the power consumption data. K-Spice provides values of power consumption data for each unit on the basis of the underlying working and efficiency curves for the equipment, and the actual working conditions (e.g., pressure and flow rate). The main power consumers are the four compressors and the oil pump. In order to create an overall consumption profile for the model, the power consumption of all components must be combined.
The total inlet production rate of the process was varied in order to determine the variation in the total power consumption of the system. The total inlet production rate was varied within operationally feasible limits (e.g., values corresponding to plateau/peak production and abandonment). There was no change in the composition of the inlet fluid (therefore, the produced gas/oil ratio and water cut remained constant). The results are shown in Figure 3 and Table 2. The total power consumption ranged from 33.06 MW (this is equivalent to 641.4 × 10 3 kg/h production) to 6.37 MW (this is equivalent to 267.3 × 10 3 kg/h production). It is possible to operate the facility at a lower rate, but the power consumption remains the same, as shown in Figure 3 and Table 2. Assuming that the processing facility is powered only by fluctuating power sources, such as wind power, the production rate must be adjusted so that the power requirement of the process matches the available power from the wind power facility. This adjustment must occur over a period of hours, as opposed to the gradual changes in oil and gas fields experienced by offshore installations over months and years.
In the next section, the possibility of providing the required power for the system through wind energy is investigated. This case was addressed by examining two options. The first is to utilize the variable wind energy that is available at the present time (Section 2.3.1). The second is to store wind energy using energy storage methods to ensure a constant source of power (Section 2.3.2). This option includes two integrated methods: wind energy + energy storage and wind energy + energy storage + gas turbines. Each option is explained and discussed, and the results are provided in detail.

2.3. Power Supply from Wind Power

2.3.1. Method 1: Variable Wind Energy and Small Backups of Gas Turbines

In this case, power is primarily supplied by a wind farm facility that provides the power profile shown in Figure 1. Therefore, it is necessary to adjust the production rates entering the processing facilities (e.g., through chokes or control valves) to ensure that the amount of required power matches the amount of available power. Using a Python script and the data presented in Figure 1 and Figure 3, a power consumption profile was calculated for the processing facility as follows:
1.
When the power produced by the wind farm was greater than the maximal required power of the processing facility (33.06 MW), the power consumption was set to this maximal value, leaving the extra available power unused.
2.
When the available wind power was within the required power range of the processing facility (between 33.06 and 6.37 MW), the power consumption of the processing facility was set to the value of the available wind power.
3.
When the available wind power was below the minimum power threshold of the processing facility (6.37 MW), the power consumption was set to this value. Thus, the available wind power could not meet the requirements of the system, and a production stop was also not considered as an option. An alternative power supply was assumed to maintain the minimum required power.

2.3.2. Power Supply Derived from the Integration of Wind Energy, Energy Storage, and Gas Turbines

The purpose of this section is to evaluate the ability of the wind farm to provide constant power to the system over the long term when coupled with energy storage. The system works in the following manner: First, a constant power value is set (required by the processing facilities). When the power generated by the wind farm exceeds this value, energy is stored (e.g., by generating and storing hydrogen in the subsurface). When the power generated by the wind farm is below the constant power value, the stored energy is used (e.g., by passing hydrogen and oxygen through a fuel cell). Numerical optimization was formulated and solved to study and design the system, i.e., determine the required size of the energy storage and the constant power supply that could be provided. The optimization is expressed mathematically as follows:
max P c s . t . d s i d t = S E i × η s R E i / η r S E i = P w , i P c + s 1 R E i = P c P w , i + s 2 P w , i + R E i / η r S E i × η s P c P c P w , i = s 1 s 2 s 1 , s 2 0 i [ 0 , N ]
Details of the optimization variables:
Pc and Pw represent the provided constant power and the available wind power, respectively. The calculated Pc was assumed to match the system’s power consumption. Afterwards, a back-calculation was performed to determine the corresponding production rate. i indicates the number of the data point, and N indicates the total number of data points. There were two rates for storing and recovering energy, SE and RE. An indicator of storage size requirement is s, whereas s1 and s2 are slack variables. η s and η r are the storing and recovery efficiency, respectively.
It is critical to ensure that the initial levels of assumed energy storage are consistent with the wind farm power profile. As an example, if the energy storage is initially empty, and at the initial time, the wind farm power is not sufficient to meet the requirements, then the operation would not be feasible. Two alternatives were evaluated:

Method 2: Wind Energy and Energy Storage

It was assumed that the energy storage was fully charged at the beginning of the study. A computational loop was implemented together with the optimization described above to perform this study. The goal of the loop is to determine the minimal initial storage required, and the goal of the optimization is to determine the constant power value that can be provided given the initial energy storage value. The first step is to set a constant initial storage value for the loop. Then, an optimization is performed to determine the maximal value of constant power that can be provided. At any point during the optimization process, if the storage energy becomes negative, the optimization routine stops and returns to the external loop where the guess value for the initial energy storage is increased. The process continues until the stored energy remains positive throughout the entire month, and the optimization objective is reached.

Method 3: Wind Energy, Energy Storage, and Gas Turbines

This method considers that, for periods when the energy storage becomes negative, a gas turbine is used to provide the power deficit. This alternative was modeled as follows. The optimization is initiated when the power generated by the wind farm exceeds the set constant value required by the processing facilities. If the storage energy value becomes negative at any point in time, the optimization horizon is then split to exclude the periods with negative storage. The process is repeated as many times as necessary. It is assumed that the gas turbines would be used to provide power during the excluded periods. Using this method is beneficial when we do not have access to large energy storage.

2.4. Energy Storage Alternatives: Hydrogen and Ammonia

In order to ensure the steady-state operation of topside processing systems when powered by wind sources, auxiliary power systems such as energy storage may be necessary. In this study, hydrogen and ammonia were considered as energy storage methods.
There are a number of advantages of storing energy in the hydrogen form, such as its ability to produce large quantities of energy without pollution over a long period of time, and the ability to be flexibly stored and used on demand. Hydrogen is also an excellent energy carrier because of its high level of energy per unit mass, 123.2–148.7 megajoules (MJ) for 1 kg of hydrogen production [20].
There are some disadvantages associated with it as well, including its energy-intensive and costly storage, and safety concerns due to its high flammability. Accordingly, the latest industry efforts involve more safely and efficiently storing hydrogen. Using ammonia as a chemical storage medium instead of hydrogen addresses some of the issues regarding storage and safety [21]. Ammonia is explored as a complementary future energy vector with applications in specific cases [22]. Although ammonia has a lower energy per unit mass than hydrogen, 18.8 MJ/kg [23], it has a higher energy per unit volume. Thus, it would require less storage space in the same storage condition. However, producing ammonia is a challenging process. Some of the production technologies consume a considerable amount of energy, which is typically derived from fossil fuels, meaning more CO2 being released into the atmosphere. Others, such as the reverse fuel cell and button-sized version of the reverse fuel cell are slow processes that cannot be performed on demand in real-time [21,24], or like the Hober Bosch system [25], has comparatively low efficiency. Then, the cycle of storing and harnessing energy in ammonia is unable to cope with rapid changes in supply and demand, which maintains hydrogen as an appealing alternative for matching daily or hourly fluctuations in supply and demand [21].

3. Results and Discussion

3.1. Method 1: Variable Wind Energy and Small Backups of Gas Turbines

Figure 4 shows the value of power consumed by the processing facility and the power produced by the wind farm in time, on an hourly basis for a period of one month. There was a considerable number of hours during which the available wind power either exceeded the maximal required value or did not reach the minimum required value. This indicates that the amount of power provided fluctuated significantly and that the power supply was very unreliable.
The profile of power consumed by the processing facility was employed to calculate the production rate profile. This was performed by doing a piece-wise linear interpolation on the data points presented in Table 2. The results are plotted in Figure 5. It illustrates the close relationship between changes in power consumption and the production rate.
While the obtained results suggest that it may be possible to produce the field in a fluctuating manner in order to adapt to the power constraints, it may not be technically feasible to implement a sudden change from maximal to minimal power. The processing system usually requires considerable time to adjust to new operating conditions and settings due to its inertia (such as large separation volumes) and technical constraints associated with the rotating equipment. It may require the process to be shut down/restarted. As an example, the model presented here was used to determine how long it would take to adapt the processing system to new operating conditions. It took at least 20 min for the system to stabilize after a 10% change in production rate. Even if such changes can be incorporated into the processing system, a fixed export amount is desired. To accomplish this, differently-sized oil tanks and pressure changes in gas pipelines are needed. This is the focus of future work and is not addressed in this paper. Due to this, the next method explores an alternative, which involves using an auxiliary system (energy storage) to ensure a stable and constant power supply for the processing system. Additionally, it can be used to maximize the use of wind energy.

CO2 Emissions of Method 1

According to Figure 4, the level of wind penetration was 74% (550 h out of 744 h). Wind penetration in this context refers to the ratio of the time during which wind farms provide energy to the total time of production. When wind power is not available, we are supposed to use alternative energy sources such as gas turbines to supply the minimum required power. Assuming that each cubic meter of production emits 0.05 tons of CO2 when power is generated by gas turbines [3] and a production of 267.3 × 10 3 kg/h, it can be estimated that, for the studied month, CO2 emissions are approximately 3476 tons. During this month, the total CO2 emissions would be 25,233 tons if all the required power was generated by gas turbines. Then, the reduction is approximately 21,757 tons. To compare this result with other methods that produce different amounts of accumulated production, we divided the reduction by the accumulated production of each method. Accordingly, it was equivalent to a reduction of 0.058 tons of CO2 per 1 ton of production.

3.2. Method 2: Wind Energy and Energy Storage

By following the procedure outlined earlier in method 2, Figure 6 illustrates the power profile of a wind farm over time and the value of constant power obtained through optimization. The wind farm and energy storage systems can provide a constant power supply of 19 MW during a month. Additionally, the output of optimization indicates that 2000 MWh of initial energy storage is required in order to achieve this result. According to Figure 7, the maximal required energy storage is approximately 3500 MWh over the course of a month. This result is based on 40% and 50% recovery and storing efficiencies, respectively. Higher power can be provided at higher efficiencies, as it is shown in Figure 8. Accordingly, the size of the energy storage required varies with the recovery and storing efficiency values used.

3.2.1. CO2 Emissions of Method 2

Since this method does not require the use of gas turbines, there are no CO2 emissions associated with the production process. This is a noticeable achievement. Compared with using gas turbines over a month, this represents a reduction of 0.67 tons of CO2 per 1 ton of production.
In addition, the amount of natural gas available for export increases at this time due to no natural gas being fired for electricity.

3.2.2. Sensitivity Analysis

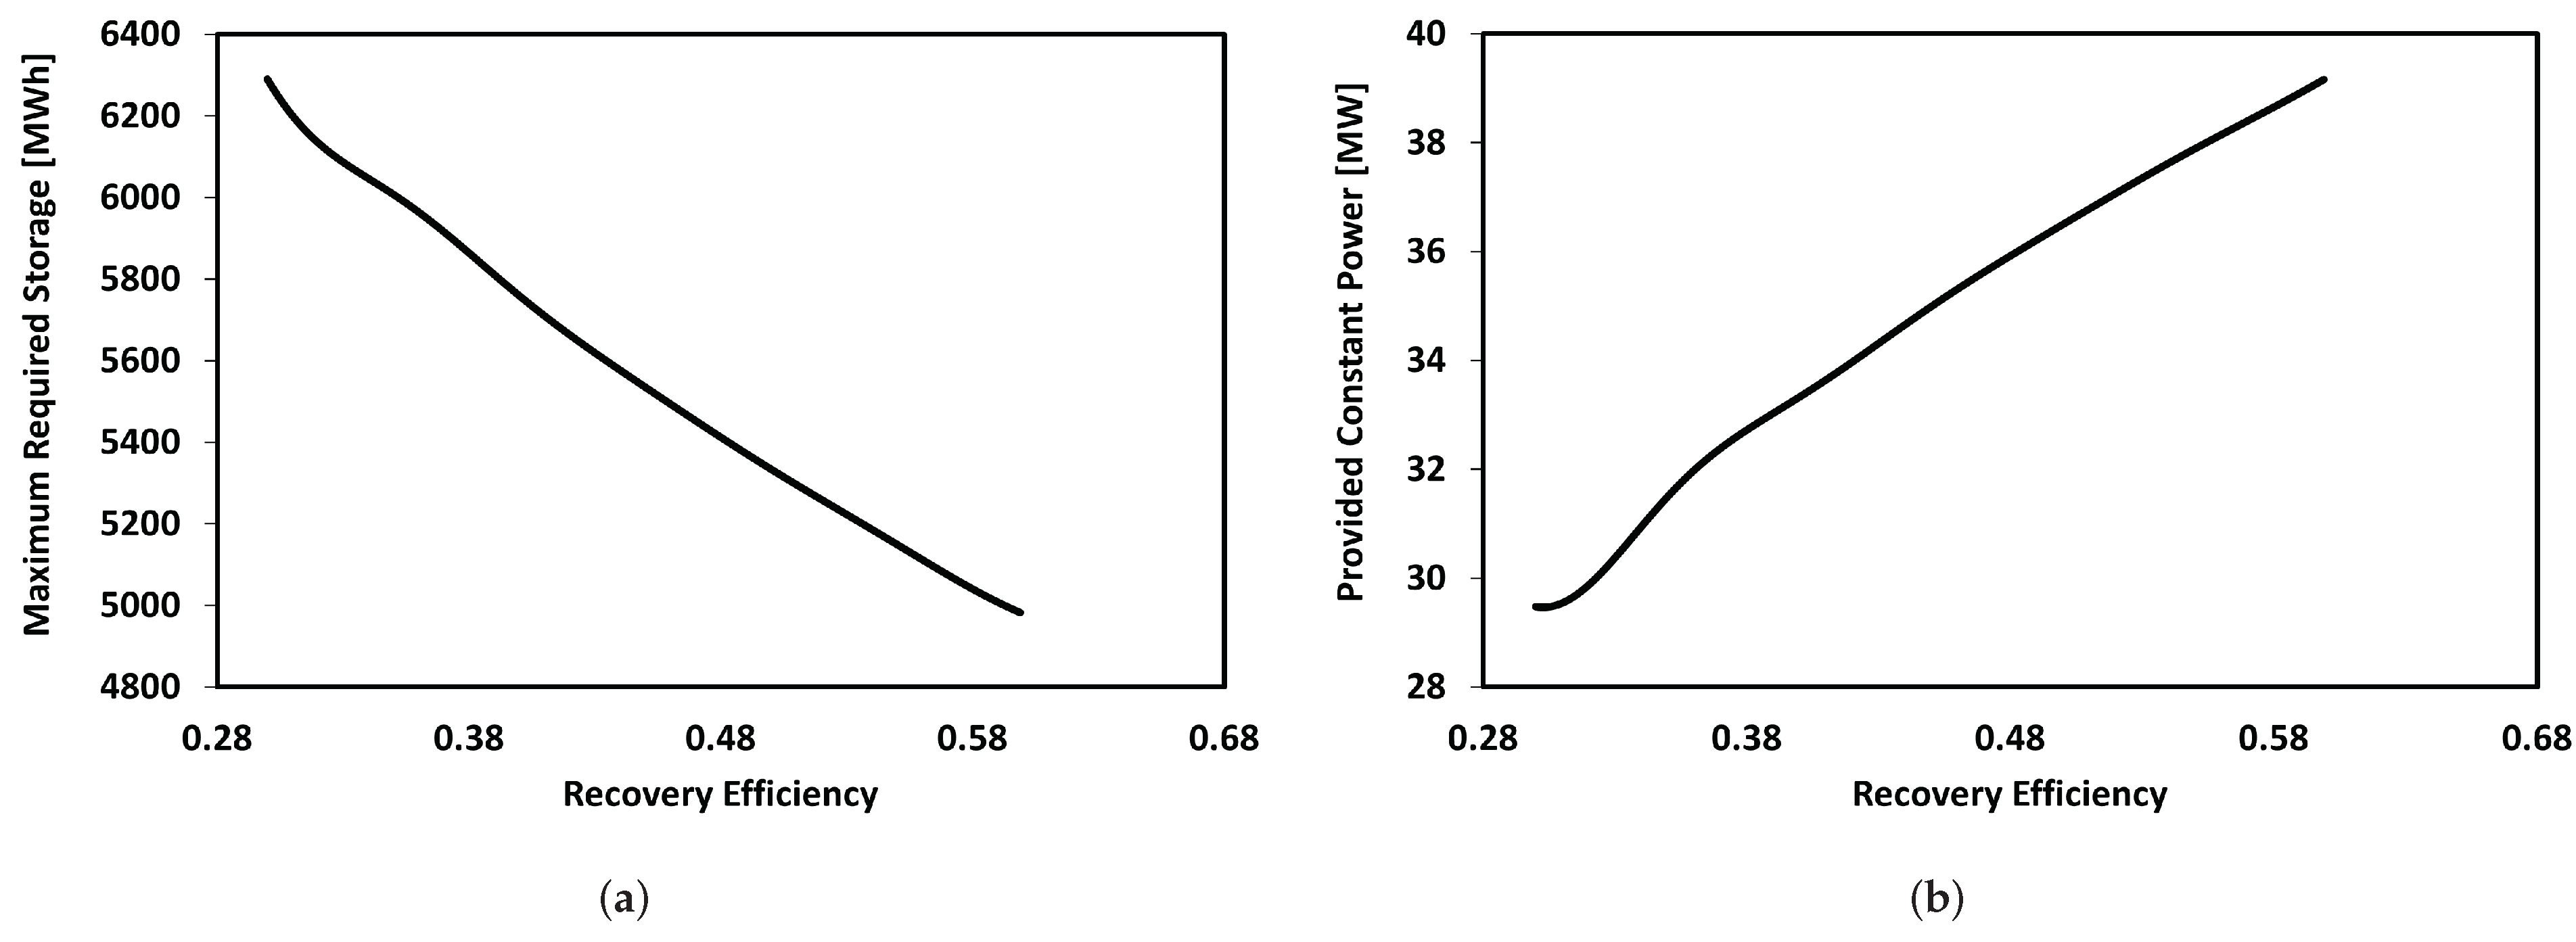
Sensitivity analysis was performed on the effects of recovery efficiency, η r , on the maximal storage required and the constant power provided. The initial storage was not taken into account in the sensitivity analysis since we were only interested in analyzing the effects of efficiencies while keeping the other parameters unchanged. Figure 9a illustrates the relationship between the maximal storage requirement and the recovery efficiency. The results show that increasing the recovery efficiency reduces the amount of required storage because stored power can be recovered more effectively; then, a larger storage capacity is not required. On the other hand, the opposite is true for constant power. The constant power provided is increased by increasing the recovery efficiency since more recovered power is available, Figure 9b.
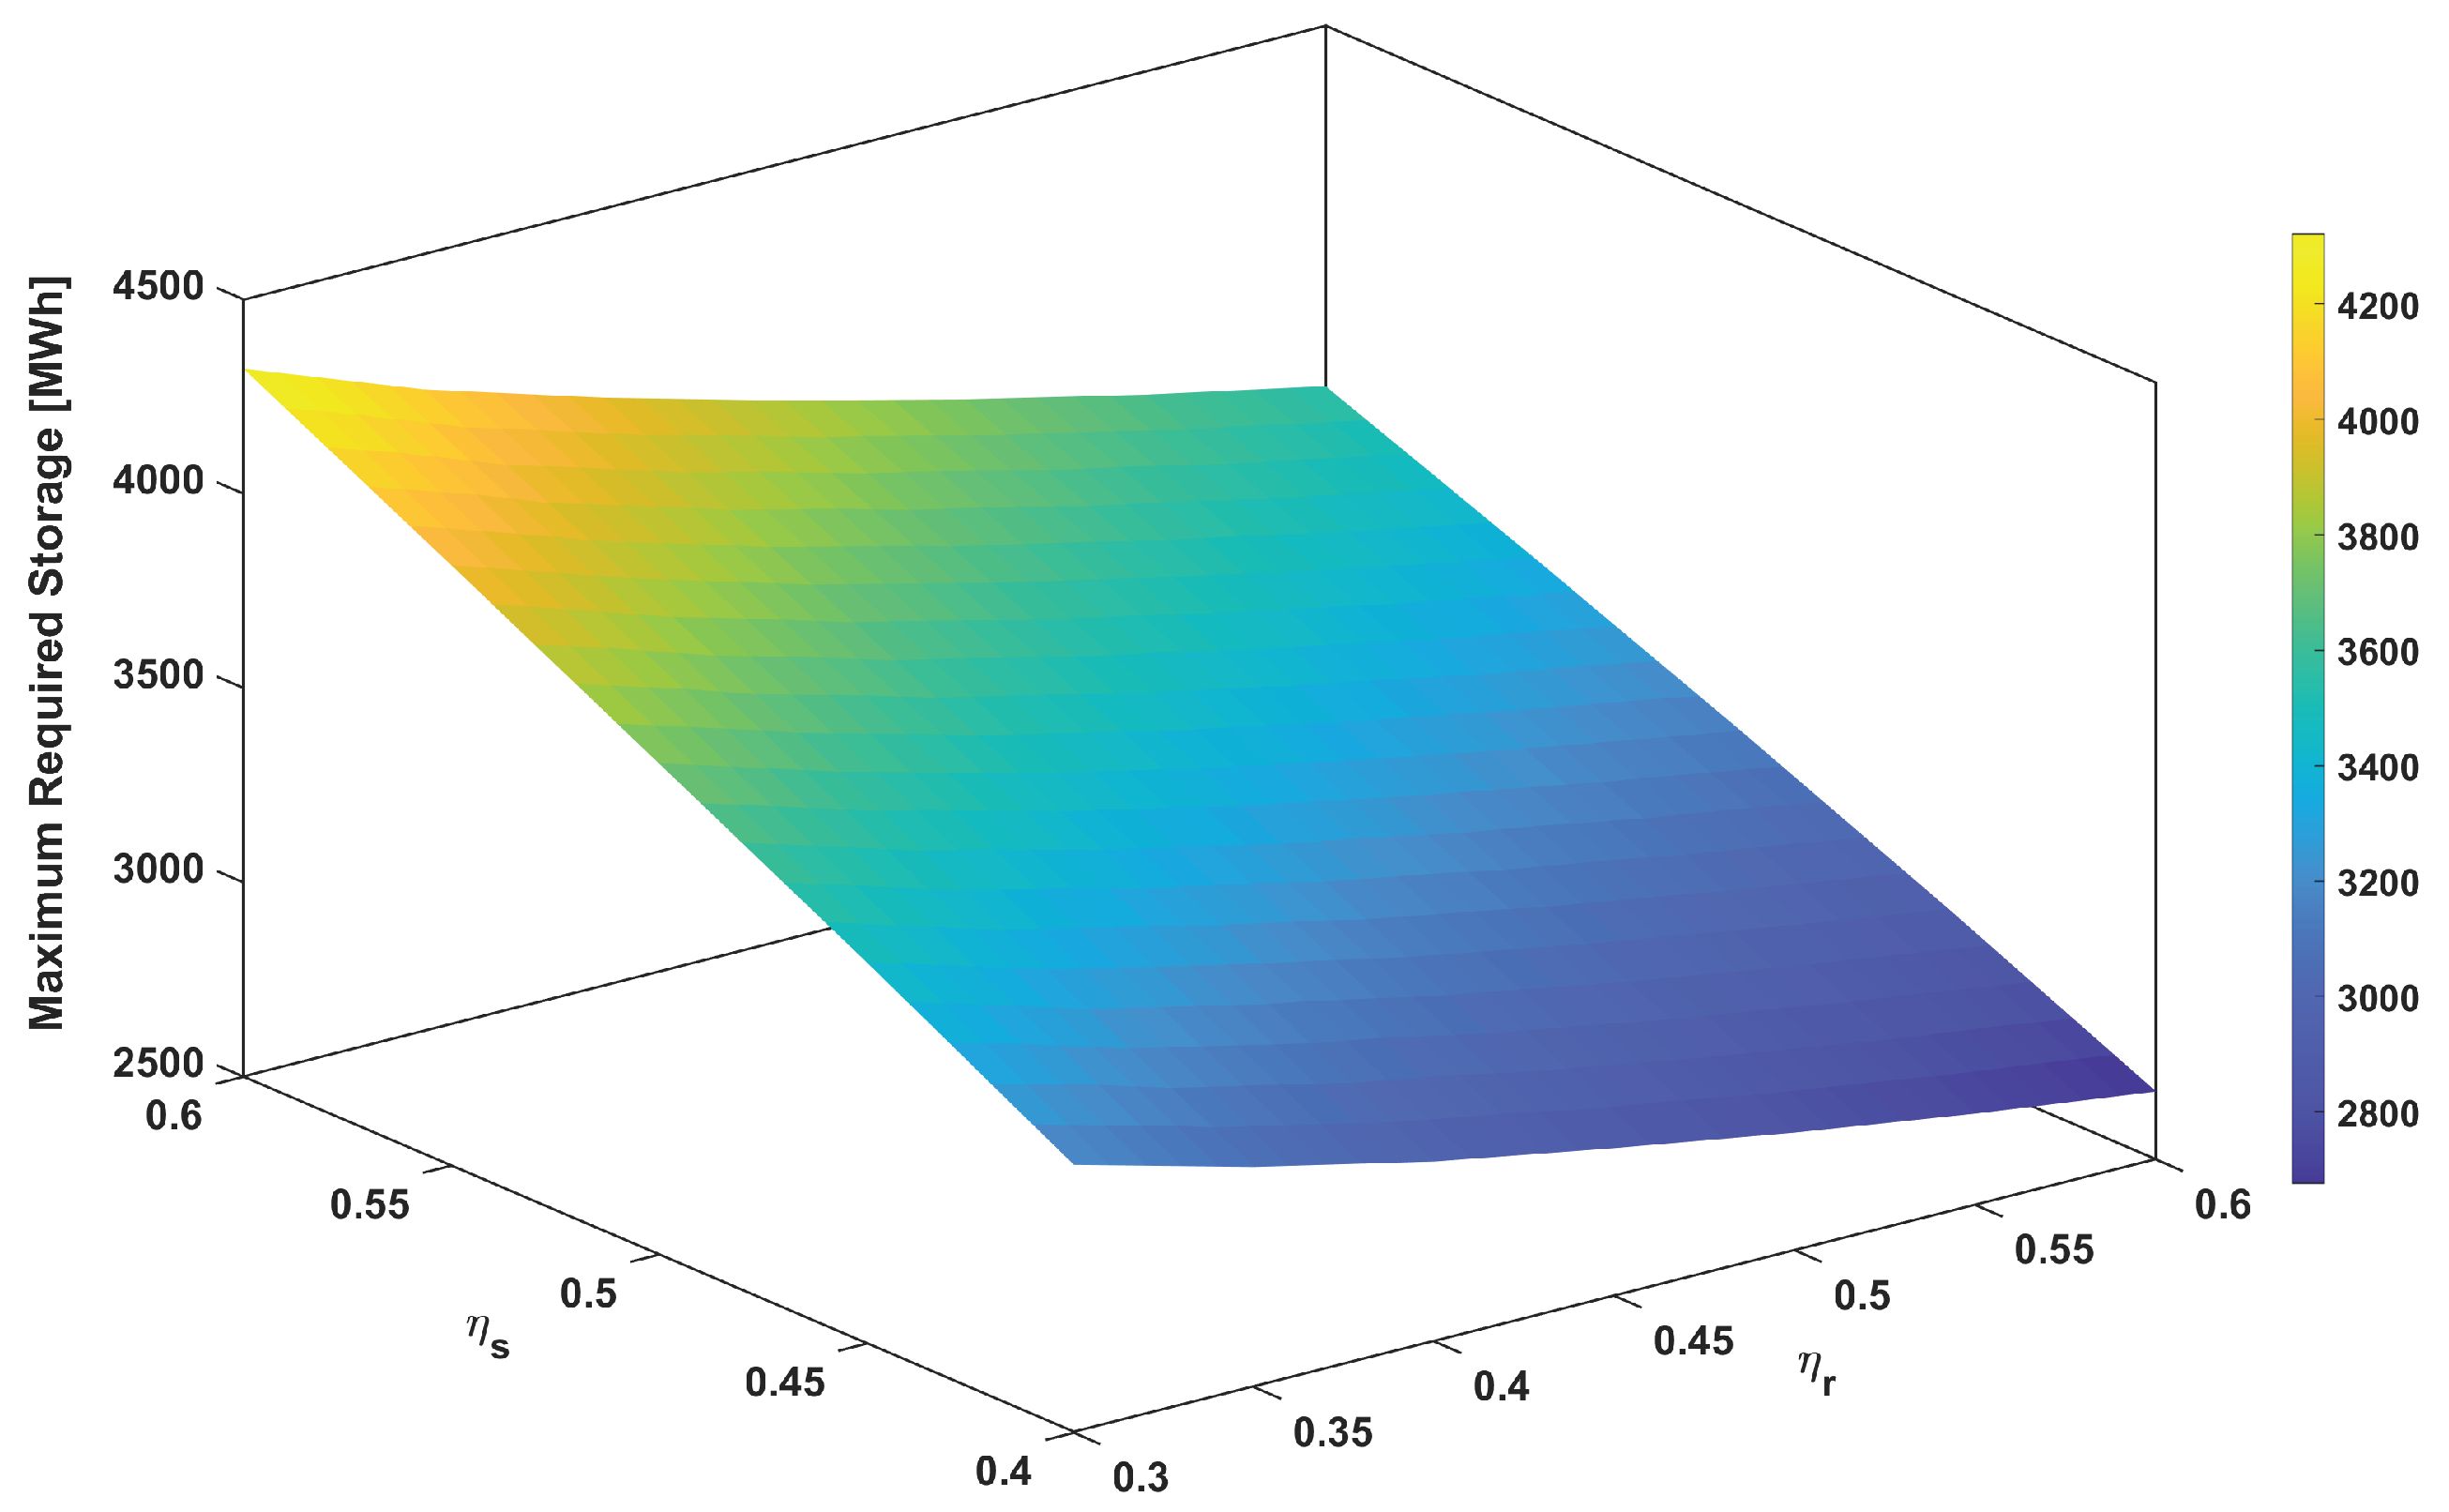
Then, the sensitivity of two parameters, the provided constant power, and the maximal required storage, was also assessed with both efficiency values, η s and η r , as shown in Figure 10 and Figure 11. Both efficiency values and the constant provided power are positively correlated. The result is as expected: higher efficiency values achieved in the storage and recovery of power can lead to higher power output. However, by increasing the recovery efficiency and decreasing the storing efficiency, the maximal storage requirement can be reduced. In other words, the size of the storage is reduced if we are able to use most of the stored power (higher recovery efficiency) or if we are not able to store as much power (lower storing efficiency).
More efficient storing and recovery can, therefore, lead to two different effects: an increase in the amount of power provided and an increase in costs due to the larger storage requirement. Hence, it is necessary to consider this clear trade-off during the planning phase.

3.2.3. Discussion about Energy Storage for Method 2

The results of this section indicate that the use of auxiliary power systems, such as energy storage systems, is necessary. Hydrogen specific energy is 123.2–148.7 megajoules (MJ) for 1 kg of hydrogen production [20]. It is equivalent to 0.034–0.041 MWh/kg. Therefore, considering the results of this alternative, in which an energy storage capacity of 3500 MWh was required, the storage of 85.3–103 tons of hydrogen is required. If the hydrogen is stored in an underground reservoir with a temperature of 80 C and a pressure of 250 bara, hydrogen has a density of 17 kg/m 3 . Hence, it is estimated that we need approximately an average underground storage volume of 5540 m 3 . This is not an unreasonable volume when compared against the volumes of conventional oil and gas reservoirs and also for hydrogen storage [26,27]. Although its feasibility should be further investigated.
Furthermore, in the same storage condition, ammonia with an energy content of 18.8 MJ/kg [23] and a density of 145.5 kg/m 3 a temperature of 80 C and a pressure of 250 bara would require approximately 4630 m 3 underground storage space to store the same amount of power.
A thorough study should be conducted in this area to determine which storage form is more effective. Nevertheless, on the basis of the required storage amount, we can roughly conclude that both forms are likely feasible.

3.3. Method 3: Wind Energy, Energy Storage and Gas Turbines

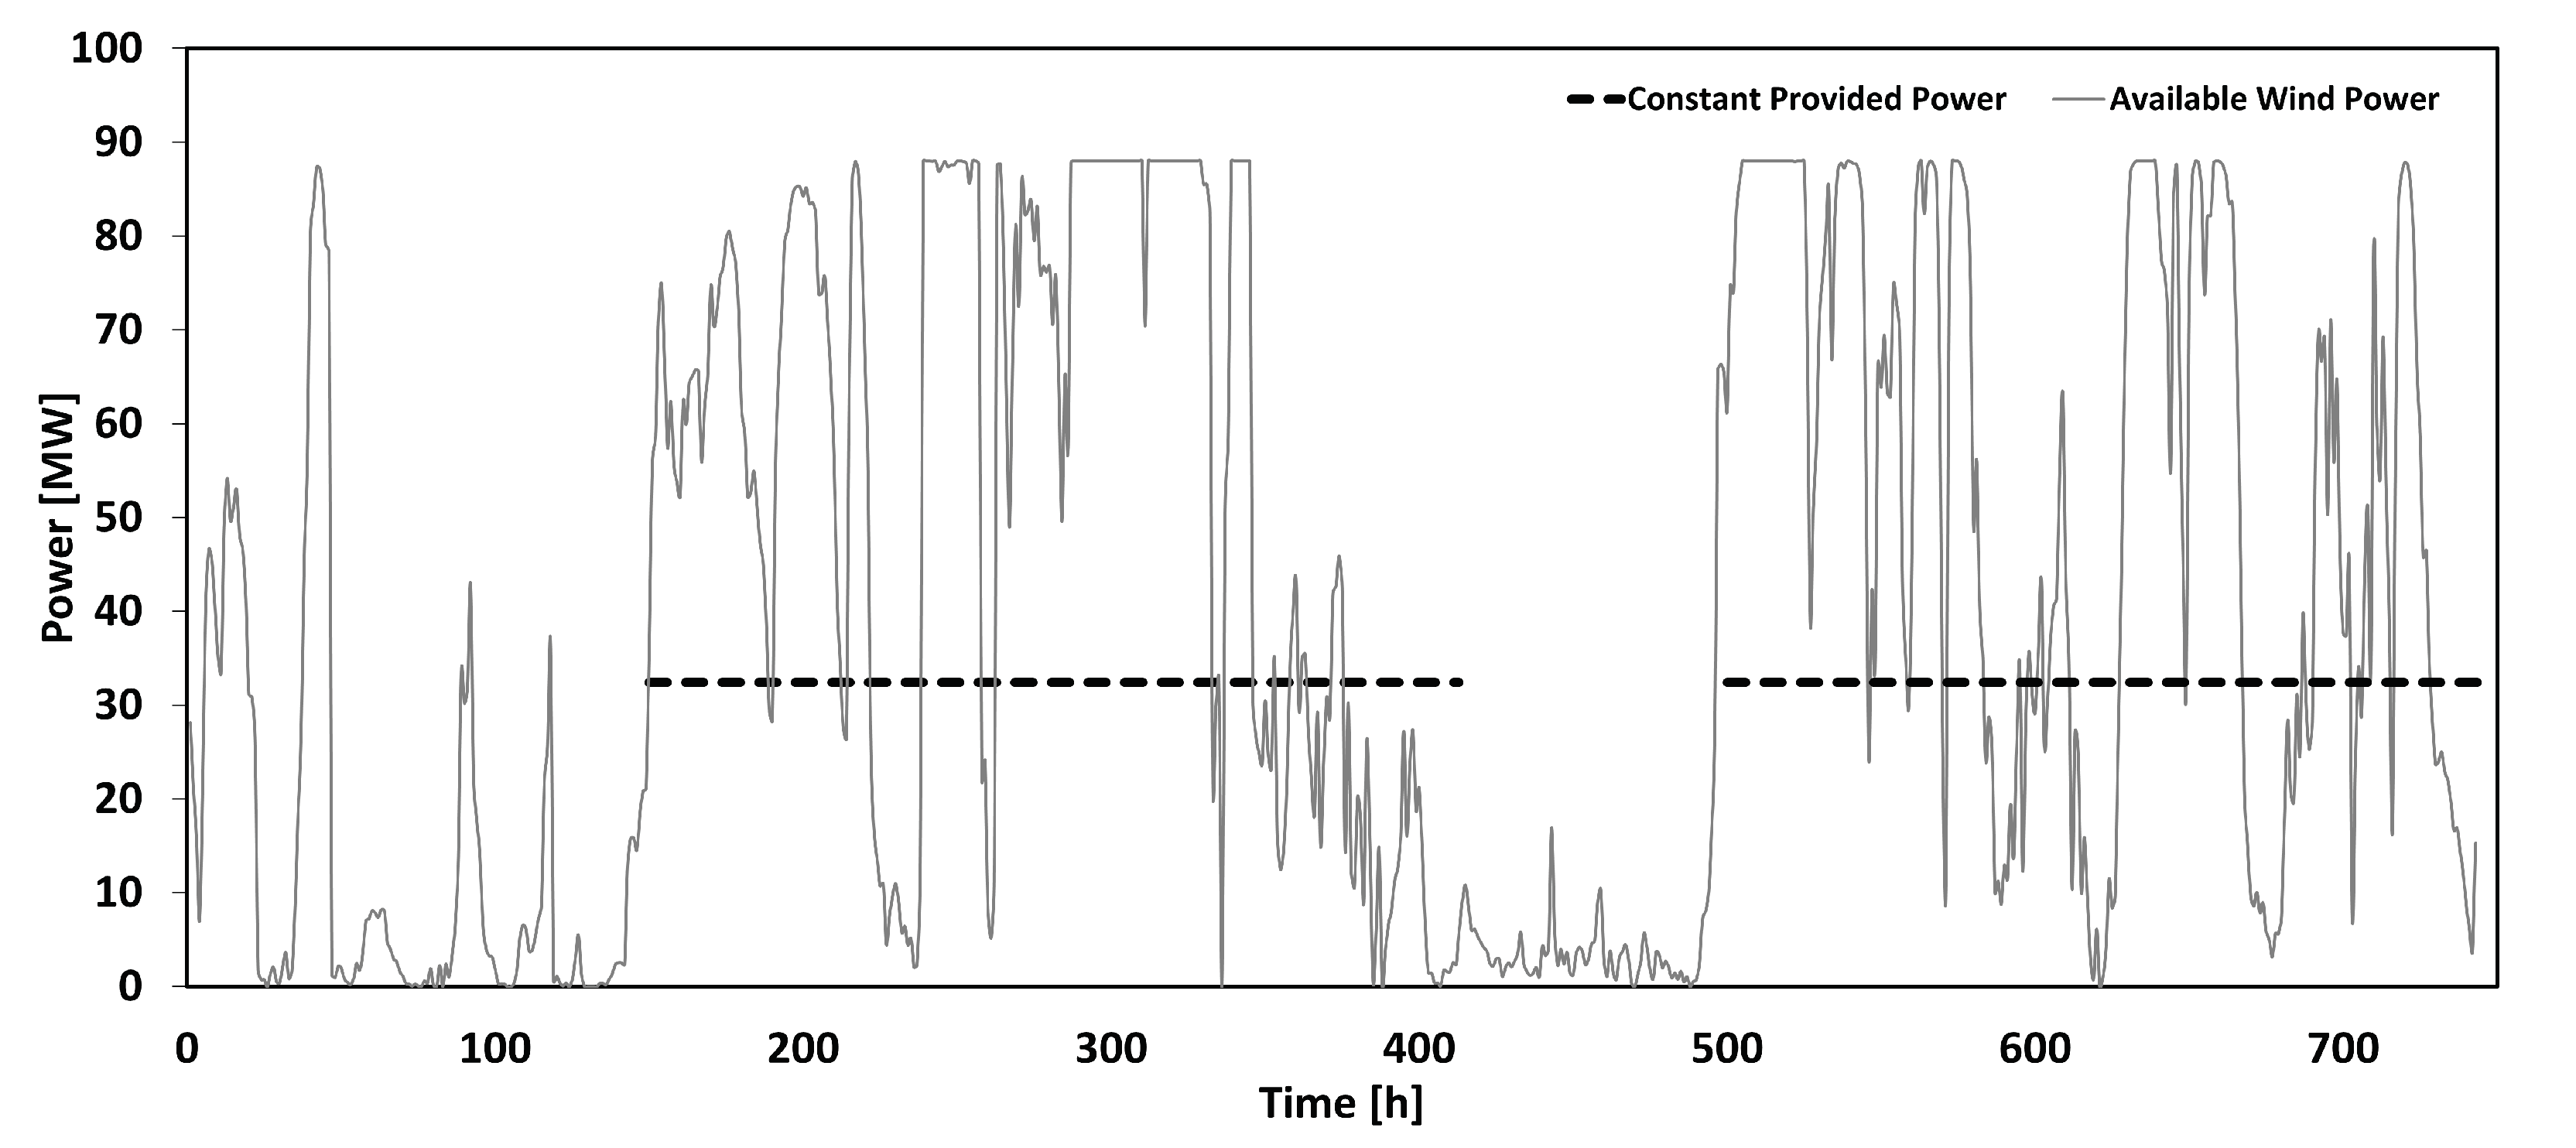
For this method, optimization should be performed at times only when the wind power exceeds the constant power value. Consequently, the first 150 h of power shortage given in Figure 1 were neglected and assumed that only gas turbines were operated in this time window. There is another gap interval after tracing the storage value when there is insufficient storage (from time 413 to time 500). Therefore, the optimization process was repeated twice in order to determine the most optimal amount of power that can be supplied. An approximately equal amount of provided power was sought for both intervals in the optimization. As a result, there are two intervals of 263 h (from time 150 to time 413) and 244 h (from time 500 to time 744), providing 32.4 MW, respectively, as shown in Figure 12. Furthermore, this value is equivalent to productions of 638.4 × 10 3 kg/h. Gas turbines can be used as an alternative to the two gaps, which are shown in Figure 12, from time 0 to time 150 and from time 413 to time 500.

3.3.1. CO2 Emissions of Method 3

In comparison to the use of gas turbines, a stable production of 638.4 × 10 3 kg/h powered entirely by wind power over 507 h would result in a reduction of 21,638 tons of CO2 emissions. Therefore, by using this method, CO2 emissions can be reduced by 0.045 tons of CO2 per 1 ton of production.

3.3.2. Discussion about Energy Storage for Method 3

According to Figure 13, the second method requires 1850 MWh of energy storage. On the basis of the same values as those employed in Section 3.2.3, it is estimated that 45–54.4 tons of hydrogen must be stored. Accordingly, the second method requires approximately 2950 m 3 of underground storage on average, which is less than half the amount required by the first method (5540 m 3 ).
With respect to the ammonia, in the same storage condition and with an energy content of 18.8 MJ/kg [23] and a density of 145.5 kg/m 3 , approximately 2450 m 3 underground storage volumes would be required to store the same amount of power in this method. There is a significant decrease in the amount of ammonia storage required by this method compared to the first method (4630 m 3 ).

3.4. Results Summary

Table 3 summarizes the assumptions and results of these there methods. In order to determine which method is most suitable for the specific case study, a feasibility study must be conducted. It may be necessary to sacrifice some CO2 emissions if providing the required storage is not feasible on the basis of the used method. Criteria such as the maximal energy storage requirement, the feasibility of providing a gas turbine, the maximal emissions allowed, and the economics of the project should be taken into consideration. Furthermore, there is more variation in wind energy over a longer period of time, such as a season or a year. Therefore, additional storage may be required or less power may be provided. In the future, a real-life field case over a longer period will be examined.

4. Conclusions

This paper studied using a variable power supply (a wind farm) to supply power to offshore facilities for oil and gas processing. Several cases are considered. We investigated strategies for operating wind-powered oil and gas topside facilities over the course of a month.
It might not be technically feasible to produce the field in a fluctuating manner to adapt to power variations from wind power sources. As new operating conditions and settings are introduced, the processing system usually takes some time to adapt. Therefore, according to the analysis of power output, it is necessary to integrate wind energy with other alternatives, such as energy storage and gas turbines in order to provide a constant power supply to the processing system.
With the use of energy storage methods, it is possible to use wind energy continuously for the whole month and to provide a 19 MW constant source of power for the case under study. While this method requires the storage of energy at the beginning, zero CO2 emissions of production were achieved with this optimal level of power usage. Further investigations were done to determine whether hydrogen and ammonia could be utilized for the required storage. The calculation indicates that 5540 and 4630 m 3 of volume are required for hydrogen and ammonia storage, respectively, which is a comparable amount (although smaller) to existing oil and gas reservoirs worldwide.
If the required amount of energy storage cannot be provided or the power provided is insufficient, a combination of wind energy, energy storage, and gas turbines can be used. Then, it is possible to use wind energy continuously for two intervals of 263 and 244 h and to provide a 32.4 MW constant source of power for the case under study. By this, a significant reduction in CO2 emissions could be also achieved. As a result, it is necessary to store less amounts of hydrogen and ammonia, 2950 and 2450 m 3 , respectively. However, a full-capacity gas turbine is required for this option, which is a disadvantage.
The results of the sensitivity analysis indicate that a higher constant provided power can be achieved by improving both recovery and storing efficiency. However, it is important to consider both the size and the cost of the required energy storage system. This trade-off should be studied from an economic point of view.
The purpose of this study was to provide a theoretical model of wind power integration into offshore platforms. There are still several operational and economical considerations that should be taken into account to design a workable technical solution for integrating wind farms with offshore platforms. It may be possible to reduce the required size of the energy storage by analyzing the sensitivity of oil tank levels and gas pipe pressure due to the high cost of energy storage. Therefore, an investigation into the effects of oil tank level and gas pipe pressure can be undertaken in the following work.

Author Contributions

The authors, L.E., M.S., H.S. and A.H.Q. contributed to this work in the order of their names. All authors have read and agreed to the published version of the manuscript.

Funding

This publication was produced with support from the LowEmission Research Centre [28], performed under the Norwegian research program PETROSENTER. The authors acknowledge the industry partners in LowEmission for their contributions and the Research Council of Norway (grant no. 296207).

Data Availability Statement

Estimated wind power production based on historical wind measurements from Gullfaks C as reported on https://seklima.met.no/.

Acknowledgments

The authors acknowledge the industry partners in LowEmission [28] for their contributions.

Conflicts of Interest

The authors declare no conflict of interest.

Nomenclature

η r Recovery energy efficiency
η s Storing energy efficiency
C O 2 Carbon dioxide
E O R Enhanced oil recovery
G O R Gas/oil ratio
G W Gigawatt
M J Megajoules
M W Megawatt
N C S Norwegian Continental Shelf
P c Constant power, [MW]
P w Available wind power, [MW]
R E Recovering energy rare, [MWh]
sRequired size of energy storage, [MWh]
S E Storing energy rate, [MWh]
V R E Variable renewable electricity
W C Water cut

References

  1. Svendsen, H.G. Optimised operation of low-emission offshore oil and gas platform integrated energy systems. arXiv 2022, arXiv:2202.05072. [Google Scholar]
  2. He, W.; Jacobsen, G.; Anderson, T.; Olsen, F.; Hanson, T.D.; Korpås, M.; Toftevaag, T.; Eek, J.; Uhlen, K.; Johansson, E. The potential of integrating wind power with offshore oil and gas platforms. Wind Eng. 2010, 34, 125–137. [Google Scholar] [CrossRef]
  3. Eyni, L.; Stanko, M.; Schümann, H. Methods for early-phase planning of offshore fields considering environmental performance. Energy 2022, 256, 124495. [Google Scholar] [CrossRef]
  4. Santibanez-Borda, E.; Korre, A.; Nie, Z.; Durucan, S. A multi-objective optimisation model to reduce greenhouse gas emissions and costs in offshore natural gas upstream chains. J. Clean. Prod. 2021, 297, 126625. [Google Scholar] [CrossRef]
  5. Shojaeddini, E.; Naimoli, S.; Ladislaw, S.; Bazilian, M. Oil and gas company strategies regarding the energy transition. Prog. Energy 2019, 1, 012001. [Google Scholar] [CrossRef]
  6. The European Parliament; The Council of the European Union. Directive (EU) 2018/2001 of the European Parliament and of the Council of 11 December 2018 on the promotion of the use of energy from renewable sources. Off. J. Eur. Union 2018, 5. [Google Scholar]
  7. Yang, X.; Liu, N.; Zhang, P.; Guo, Z.; Ma, C.; Hu, P.; Zhang, X. The current state of marine renewable energy policy in China. Mar. Policy 2019, 100, 334–341. [Google Scholar] [CrossRef]
  8. International Energy Agency. Offshore Wind Outlook. World Energy Outlook Special Report. 2019. Available online: https://www.iea.org/ (accessed on 1 December 2022).
  9. Mäkitie, T.; Normann, H.E.; Thune, T.M.; Gonzalez, J.S. The green flings: Norwegian oil and gas industry’s engagement in offshore wind power. Energy Policy 2019, 127, 269–279. [Google Scholar] [CrossRef]
  10. McLaurin, D.; Paulin, M.; Peng, C.; Yadlapati, R. The Use of Offshore Wind to Reduce Greenhouse Gas Emissions in Offshore Hydrocarbon Production-A Case Study. In Proceedings of the Offshore Technology Conference, Houston, TX, USA, 16–19 August 2021. [Google Scholar]
  11. McKenna, R.; D’Andrea, M.; González, M.G. Analysing long-term opportunities for offshore energy system integration in the Danish North Sea. Adv. Appl. Energy 2021, 4, 100067. [Google Scholar] [CrossRef]
  12. Regional Investment Plan 2020 Northern Seas. Available online: https://www.entsoe.eu/ (accessed on 1 December 2022).
  13. Hu, D.; Zhao, X.; Cai, X.; Wang, J. Impact of wind power on stability of offshore platform power systems. In Proceedings of the 2008 Third International Conference on Electric Utility Deregulation and Restructuring and Power Technologies, Nanjing, China, 6–9 April 2008; pp. 1688–1692. [Google Scholar]
  14. Korpås, M.; Warland, L.; He, W.; Tande, J.O.G. A case-study on offshore wind power supply to oil and gas rigs. Energy Procedia 2012, 24, 18–26. [Google Scholar] [CrossRef] [Green Version]
  15. McDonagh, S.; Ahmed, S.; Desmond, C.; Murphy, J.D. Hydrogen from offshore wind: Investor perspective on the profitability of a hybrid system including for curtailment. Appl. Energy 2020, 265, 114732. [Google Scholar] [CrossRef]
  16. Zhang, Q.; Zhang, H.; Yan, Y.; Yan, J.; He, J.; Li, Z.; Shang, W.; Liang, Y. Sustainable and clean oilfield development: How access to wind power can make offshore platforms more sustainable with production stability. J. Clean. Prod. 2021, 294, 126225. [Google Scholar] [CrossRef]
  17. Zou, X.; Qiu, R.; Yuan, M.; Liao, Q.; Yan, Y.; Liang, Y.; Zhang, H. Sustainable offshore oil and gas fields development: Techno-economic feasibility analysis of wind–hydrogen–natural gas nexus. Energy Rep. 2021, 7, 4470–4482. [Google Scholar] [CrossRef]
  18. Wang, B.; Zhou, M.; Xin, B.; Zhao, X.; Watada, J. Analysis of operation cost and wind curtailment using multi-objective unit commitment with battery energy storage. Energy 2019, 178, 101–114. [Google Scholar] [CrossRef]
  19. Hywind Tampen: The World’s First Renewable Power for Offshore Oil and Gas. Available online: https://www.equinor.com/energy/hywind-tampen/ (accessed on 1 December 2022).
  20. Younas, M.; Shafique, S.; Hafeez, A.; Javed, F.; Rehman, F. An overview of hydrogen production: Current status, potential, and challenges. Fuel 2022, 316, 123317. [Google Scholar] [CrossRef]
  21. Service, R.F. Ammonia—A Renewable Fuel Made from Sun, Air, And Water—Could Power the Globe without Carbon. Available online: https://www.science.org/content/article/ammonia-renewable-fuel-made-sun-air-and-water-could-power-globe-without-carbon (accessed on 12 July 2018).
  22. El kadi, J.; Collin Smith, L.T.M. H2 and NH3—The Perfect Marriage in a Carbon-Free Society. Available online: https://www.thechemicalengineer.com/features/h2-and-nh3-the-perfect-marriage-in-a-carbon-free-society/ (accessed on 28 May 2020).
  23. Valera-Medina, A.; Xiao, H.; Owen-Jones, M.; David, W.I.; Bowen, P. Ammonia for power. Prog. Energy Combust. Sci. 2018, 69, 63–102. [Google Scholar] [CrossRef]
  24. MacFarlane, D.R.; Cherepanov, P.V.; Choi, J.; Suryanto, B.H.; Hodgetts, R.Y.; Bakker, J.M.; Vallana, F.F.M.; Simonov, A.N. A Roadmap to the Ammonia Economy. Joule 2020, 13, 1186–1205. [Google Scholar] [CrossRef]
  25. Smith, C.; Hill, A.K.; Torrente-Murciano, L. Current and future role of Haber–Bosch ammonia in a carbon-free energy landscape. Energy Environ. Sci. 2020, 13, 331–344. [Google Scholar] [CrossRef]
  26. Lysyy, M.; Fernø, M.; Ersland, G. Seasonal hydrogen storage in a depleted oil and gas field. Int. J. Hydrogen Energy 2021, 46, 25160–25174. [Google Scholar] [CrossRef]
  27. Craig, A.; Newman, S.; Stephenson, P.; Evans, C.; Yancazos, S.; Barber, S. Hydrogen Storage Potential of Depleted Oil and Gas Fields in Western Australia. APPEA J. 2022, 62, 185–195. [Google Scholar] [CrossRef]
  28. LowEmission 2019–2026. Available online: https://www.sintef.no/projectweb/lowemission/ (accessed on 1 December 2022).
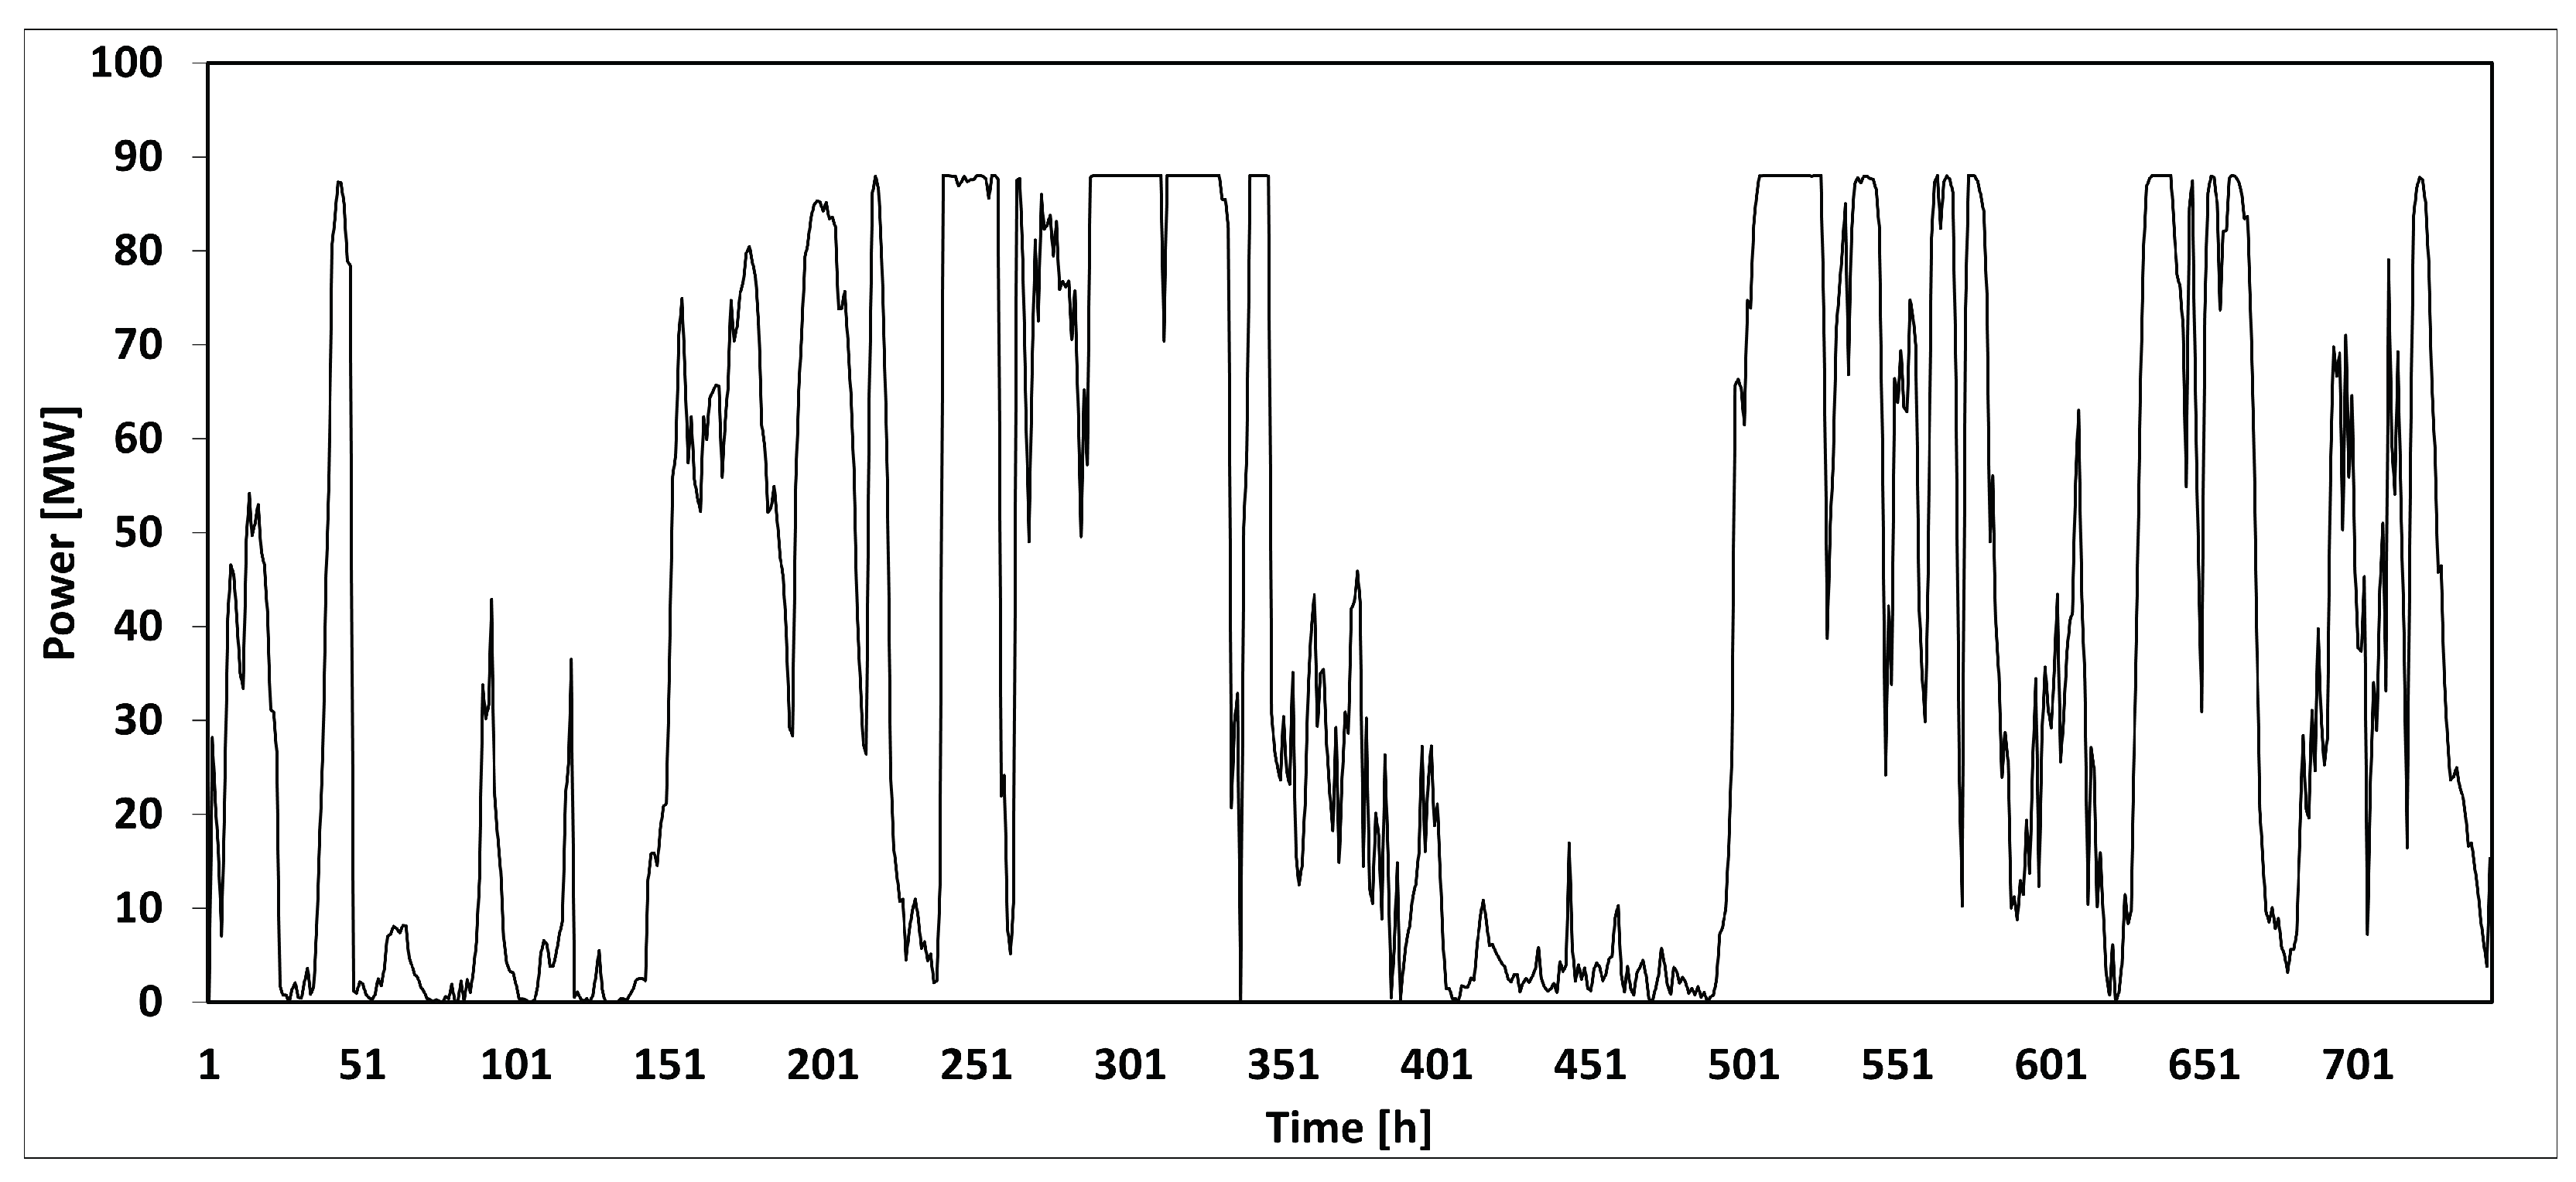
Figure 1. Wind power time series data during January 2015.
Energies 15 09482 g001
Figure 2. Process flow diagram of the topside processing system.
Energies 15 09482 g002
Figure 3. Total power consumption versus total production.
Energies 15 09482 g003
Figure 4. The model’s power consumption time series data together with the available wind power.
Energies 15 09482 g004
Figure 5. The production rate time series data together with the power consumption of the model.
Energies 15 09482 g005
Figure 6. Constant power supply from wind power.
Energies 15 09482 g006
Figure 7. Power storage versus time.
Energies 15 09482 g007
Figure 8. Constant power supply from wind power for different efficiencies.
Energies 15 09482 g008
Figure 9. Sensitivity analysis of energy storage size and constant power with recovery efficiency, η r . (a) Maximum required storage. (b) Provided constant power.
Energies 15 09482 g009
Figure 10. Sensitivity analysis of the maximal required storage to both storing, η s and recovery efficiency, η r .
Energies 15 09482 g010
Figure 11. Sensitivity analysis of the provided constant power to both storing, η s and recovery efficiency, η r .
Energies 15 09482 g011
Figure 12. Constant power supply from wind power.
Energies 15 09482 g012
Figure 13. The power storage versus time.
Energies 15 09482 g013
Table 1. Key properties of the model.
Inlet temperature ( C)40
Inlet pressure (bara)55
Outlet oil pressure (bara)50
Outlet Gas Pressure (bara)200
First-stage separator pressure (bara)25
First-stage separator temperature ( C)40
Second-stage separator pressure (bara)6
Second-stage separator temperature ( C)30
Third-stage separator pressure (bara)1.59
Third-stage separator temperature ( C)15
Total mass flow rate (kg/h)534,500
Table 2. Total production rate and power consumption of the model.
Total Production Rate (10 3 kg/h)Power Consumption (MW)
2106.37
2456.37
267.36.37
320.78.71
374.210.54
427.612.44
481.114.93
534.518.80
588.024.91
641.433.06
Table 3. Key results of the methods.
Method 1Method 2Method 3
Energy storage requirementNOYESYES
Gas turbines requirementYESNOYES
Initial storage requirementNOYESNO
Wind penetration [%]7410068
Provided power [MW][6.37:33.06]1932.4
Maximal required energy storage [MWh]035001850
Required hydrogen storage [MWh]055402950
Required ammonia storage [MWh]046302450
Emissions of CO2YESNOYES
Emission intensity reduction [ t C O 2 t ]0.0580.0670.045
Accumulated production [t]3.76 × 10 5 3.99 × 10 5 4.75 × 10 5
Publisher’s Note: MDPI stays neutral with regard to jurisdictional claims in published maps and institutional affiliations.