Abstract
This paper concerns the application of the gamma radiation absorption method in the measurements of dispersed phase velocity in two-phase flows: liquid–gas flow in a horizontal pipeline and liquid–solid particles in a vertical pipe. Radiometric sets containing two linear 241Am gamma radiation sources and two NaI(Tl) scintillation detectors were used in the research. Due to the stochastic nature of the signals obtained from the scintillation probes, statistical methods were used for their analysis. The linear average velocity of the dispersed phase transportation was calculated using the phase of the cross-spectral density function of the signals registered by the scintillation detectors. It is shown that in the presented cases, the phase method can be more accurate than the most commonly used classical cross-correlation one.
1. Introduction
Multiphase liquid–gas, liquid–solid particle, and gas–solid phase flows are often transported by pipelines in such industry sectors as chemistry, mining, and agri-food industries, as well as energy and environmental engineering [1,2,3]. For example, in the mining industry, two-phase mixtures such as liquid–gas, liquid particulate matter, or liquid I–liquid II ones are transported via pipelines. The analysis and control of such flows require the application of dedicated measurement techniques and devices [1,4,5,6]. To measure the parameters of the two-phase flows in both open channels and pipelines, radioisotope methods have been used for many years [7,8,9,10,11]. Due to the non-invasive measurement and relatively high accuracy of it, the absorption method using closed sources of radiation is particularly useful for testing two-phase flows in pipelines [12,13,14,15,16]. A significant problem limiting the taking of measurements with the use of radioactive sources is the compliance with strict legal regulations related to radiation protection.
Due to the stochastic nature of the signals obtained from the scintillation probes, statistical methods are used for their analysis. The best known one is the classic method of cross-correlation [17,18]. The other methods include a correlation analysis with the Hilbert transform [19], Hilbert–Huang transform [20], the method of the phase of cross-spectral density [21], differential and combined methods [18,22,23], and the methods using the conditional averaging of the signals [24].
The application of the phase method to measure the time delay of the random signals is known, and it has been described in the literature, e.g., [21,25,26]. This method was used to analyse the vibroacoustic signals [25,27,28,29,30], as well as the signals obtained in biological and medical research [31,32]. However, so far, it has not been used in radioisotope studies of two-phase flows. The works of the authors of this article are, therefore, pioneering in this field.
The present paper describes the application of the gamma absorption method for investigations of the liquid–gas and liquid–solid particles mixtures flows in pipelines, and it provides example measurement results of the velocity of dispersed components obtained using the spectral analysis of the recorded signals. This article is a revised and significantly extended version of the conference publications [33,34].
2. Gamma Absorption Method for Measuring the Velocity of Dispersed Phase
The principle of the application of gamma absorption to test the two-phase flows in pipelines is shown in Figure 1. Part (a) shows the transport of a gas by a liquid in a horizontal pipe, while part (b) shows the hydrotransport of a solid phase in a vertical pipeline. In both of the cases, the purpose of the measurements was to determine the transport velocity of the minority components, which were air bubbles and solid grains, respectively.
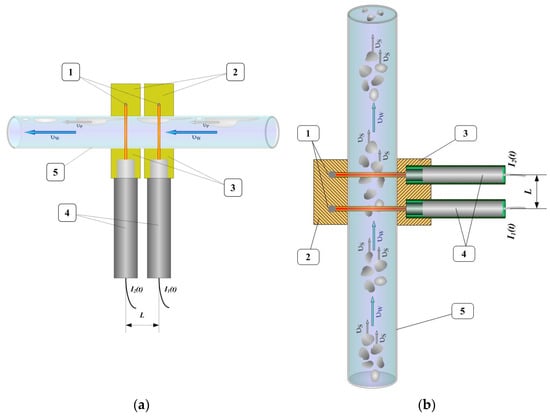
Figure 1.
Basic schema of measurement of gamma absorption of the following flows: (a) gas–liquid flow in a horizontal pipeline and (b) solid particles transported by a liquid in a vertical pipe; 1—sealed gamma-ray sources; 2—lead collimator of the source; 3—lead collimator of the scintillation probes; 4—scintillation probes; 5—pipeline.
A typical single-absorption setup consists of a closed radioactive source and a scintillation detector. The use of two such setups allows one to measure the velocity of the dispersed phase and possibly determine its concentration in the flowing mixture [19]. The sources used were placed at a specified distance from each other, L. The pipeline with the flowing medium was subjected to radiation by two parallel photon beams shaped by collimators. On the other side of the pipeline, mounted at the same distance from each other, were the detectors. At their outputs, counts I1(t) and I2(t) were obtained, depending on the intensity of the γ radiation passing through the pipe. The presence of a mixture in the measuring section causes the absorption and diffusion of photons, providing the stochastic signals x(t) and y(t). These signals which describe the instantaneous state of the stream in the examined sections.
For the flow to be determined, the transport time delay τ0 and the average velocity of the minority phase υS were determined based on the analysis of the measurement signals using the following relationship:
When it is transporting a water–air mixture, shown in Figure 1a, the velocity υS is equal to the velocity of the air bubbles, which are marked as υP. The velocity determined by Equation (1) is the average value of the cross-section of the pipeline that is covered by the width of the gamma ray beam that is emitted by the sources and at the time of measurement.
3. Measurement Stands
The article uses the measurement signals recorded at the test installations which were constructed at the AGH University of Science and Technology in Krakow and at the Wroclaw University of Environmental and Life Sciences. In the first one, liquid–gas flows (in this case water–air ones) were tested in a horizontal pipeline, with the flow rate ranging from 0.5 to 3.5 m/s. The pipeline measurement segment was made of a 4.5 m long plexiglass tube with an internal diameter of 30 mm. Radiation linear sources (241Am isotopes) and NaI(Tl) scintillation probes were located L = 97 mm apart on opposite sides of the tube. A general view of the measuring part of the laboratory stand is shown in Figure 2. A detailed description of the installation and measurement geometry is provided in [18,19]. Examples of the signals x(t) and y(t) registered during the BUB10 run (after centring and filtration) and their histograms are shown in Figure 3. The values on the vertical axis of the time distributions determine the number of counts achieved in 1 ms (1 kHz sampling rate). The time waveforms show the stochastic nature of the signals, and the histograms show their distributions, resembling normal distributions. Such symmetrical distributions indicate a properly set measurement geometry, which gives the method greatest sensitivity to the changes in the density of the flowing mixture at the selected energy of the gamma radiation sources. For filtering the signals, appropriately selected digital bandpass filters were used, which emphasise the useful components of the signals. The method of selecting the filter band and other methods of noise reduction are described in detail in [35].
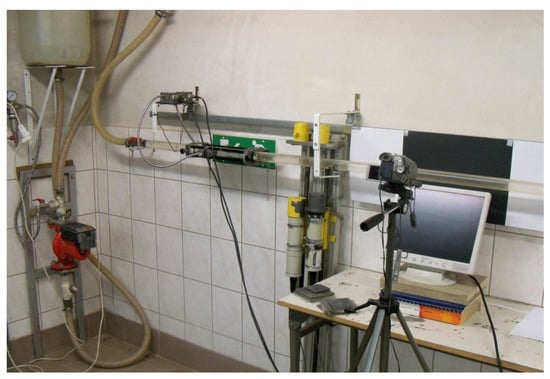
Figure 2.
View of the measuring part of the hydraulic installation for liquid–gas flow tests in a horizontal pipeline.
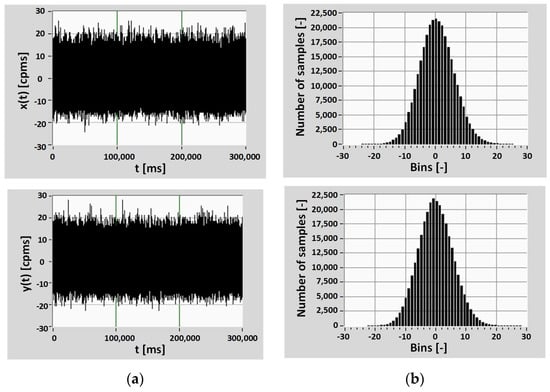
Figure 3.
Recorded signals (a) and their histograms (b) obtained in the experiment BUB10.
In turn, the liquid–solid flows test system in a vertical pipeline was designed to model the hydrotransport of oceanic nodules from the Pacific seabed [34,36]. The main part of it is a vertical pipe with a diameter of 160 mm. Radiometric sets (241Am linear sources + NaI(Tl) probes) were mounted on the measuring section of an acrylic glass pipe. The distance between detectors in each set was L = 90 mm. Figure 4 shows fragments of the installation with the absorption kit installed. A diagram and detailed description of the installation can be found in [36]. Due to the mechanical strength of the nodules, specially prepared ceramic grains with the same geometric parameters and density as natural polymetallic nodules were used in the experiments.
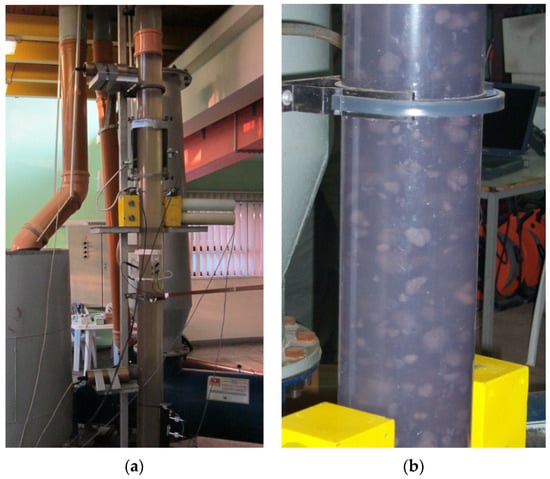
Figure 4.
Fragments of the installation for testing liquid–solid particles flow in a vertical pipe: (a) view of the measuring part of the laboratory stand; (b) pipe with the water–solids mixture [36].
Examples of signals recorded in the WRQ30 experiment (after centring and filtration) and the corresponding histograms are shown in Figure 5. The acquisition parameters were the same as in experiment BUB10, and there being a much smaller number of counts was due to the larger diameter of the pipe and higher absorption in the tested medium.
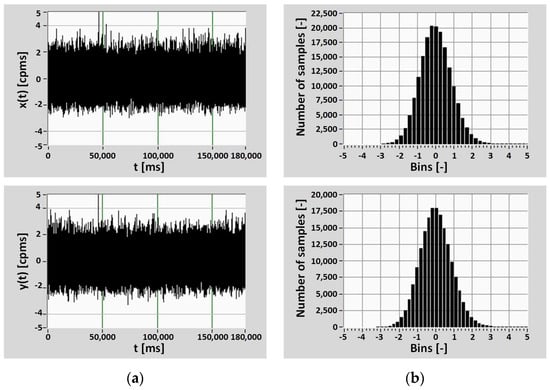
Figure 5.
Recorded signals (a) and their histograms (b) obtained in the experiment WRQ30.
To analyse the registered stochastic signals, which were usually pre-processed, statistical methods such as cross-correlation, phase, differential, conditional averaging ones and other methods could be used [17,18,19,20,21,22,23,24]. The most often used one is the cross-correlation function (CCF), which allows one to determine the transport delay based on the identification of the main maximum of the CCF [14]. In this case, of the radioisotope measurements, the pass-band filtering of the measured signals is necessary due to noise and interference [34].
4. Phase Method of Signals Analysis
For the signals x(t) and y(t) in the frequency domain, we may use the analysis of the cross-spectral density function (CSDF) Gxy(f). In practice, a one-sided CSDF for the frequency range 0 < f < ∞ can be appointed. This is a complex quantity, which is described as follows [37]:
Rxy(τ) is the cross-correlation function defined by the dependents [17,37]:
where T is the averaging time, and τ is the time delay.
The τ0 transportation delay time is designated by finding the position of the main maximum of the CCF.
The phase of the CSDF is related to the transport time delay τ0, as follows:
Analysing the CSDF phase allows one to determine the transport time delay for the selected harmonic or a specific frequency interval. In the latter case, a linear approximation of the selected range Φxy(f) can be used. The basic characteristics of the method are discussed in [21,25,37,38].
The CSDF phase estimation is performed most often using the Welch procedure for discrete signal samples taken at constant sampling intervals Δt. The collection of samples is divided into Nd segments, each with a length of N. When one is using the discrete Fourier transform for each segment, the CSDF values are obtained for useful discrete frequency fk values (k = 0…(N − 1)/2), and the frequency domain resolution is . The numerical procedures used to calculate the value of the arc tg function result in discontinuities in the CSDF phase and the need to use the so-called phase unwrapping. The transport time delay is estimated from the CSDF phase , which is smoothed using the segment averaging method (in the set of estimators determined for each data segment). The transport time delay is calculated using the formula [21]:
where m is the number of CSDF phase values and frequencies included in the calculation of the simple regression.
5. Example Results of Measurements
Figure 6 shows the fragments selected for analysis and obtained from experiments BUB10 (Figure 6a) and WRQ30 (Figure 6b), with the straight lines matched to a linear regression.
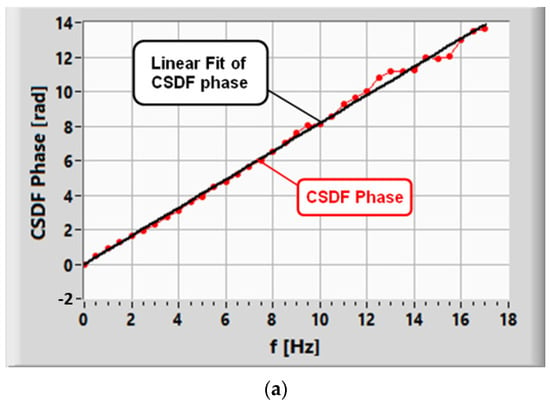
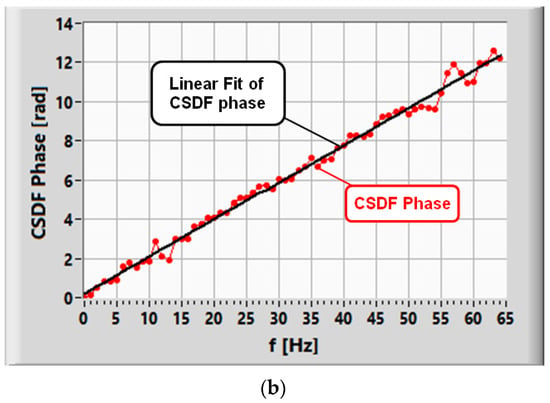
Figure 6.
The phase of the CSDF in the experiments (a) BUB10 and (b) WRQ30.
The behaviour of the estimator of the coherence function γxy(f), which is the normalised CSDF [37], can be used to select the appropriate frequency range for the linearisation of the characteristic . In practice, the square of this function module is used, which for all of the frequencies take values that are from 0 to 1:
where and are the autospectral density estimators for the x(t) and y(t) signals, respectively, which are smoothed in the segments, and is the smoothed CSDF estimator.
The criterion for selecting m can be the frequency range for which achieves significant values [38]. Figure 7 shows the waveforms of the coherence functions for the signals obtained in experiments BUB10 (7a) and WRQ30 (7b). The dotted lines in both of the figures indicate the limit of the one-sided confidence interval Eα which was determined for significance level α = 0.05 using the relationship [39]:
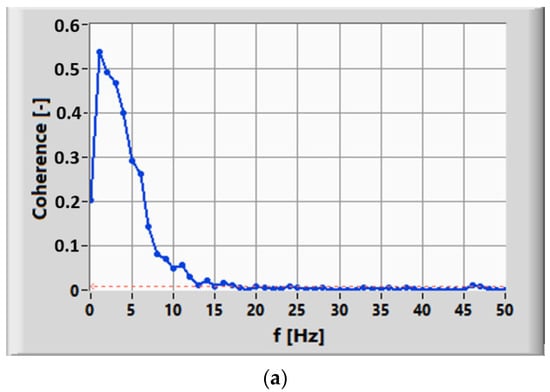
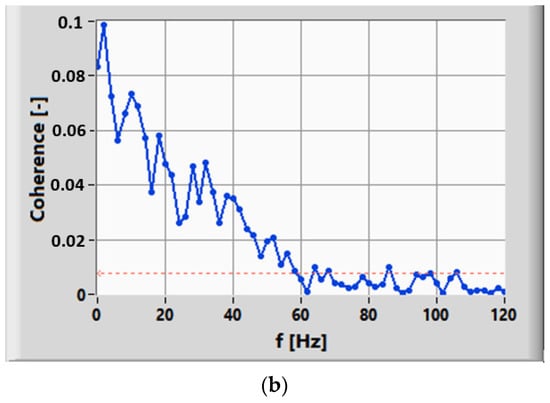
Figure 7.
The coherence function in the experiments (a) BUB10 and (b) WRQ30.
The standard uncertainty that is calculated by use phase CSDF is given by [21,38]:
The complex uncertainty uc(υS) of the measurement of the velocity of the dispersed phase (with negligible uncertainty of the measurement track) depends on the uncertainty of the uncorrelated values of L and τ0:
where the indices A and B represent the relevant uncertainties designated by the methods A and B, respectively [40,41].
For the analysis of the data obtained in the experiments, the presented phase method was used, and for comparison, the cross-correlation function was also used. Table 1 presents the velocity υS measurement results obtained for the CSDF phase and cross-correlation methods.

Table 1.
Summary of the test results.
The uncertainties U0.95(υS) given in the table are the expanded uncertainties calculated using the assumption of the resulting normal distribution uc(υS):
where kp—coverage factor (kp = 2 was assumed).
The measurements summarised in Table 1 for both the liquid–gas flow and the liquid–solids flow were selected from many experimental results based on the clearly occurring peak of the cross-correlation function between the analysed signals.
As it can be seen in Table 1, the results of the velocity measurement υS with both of the phase methods and with the use of CCF in individual experiments are practically the same. This confirms the convergence of the methods used. On the other hand, the values of the expanded uncertainty of velocity measurement for the phase method are several times smaller than they are for the cross-correlation method. This is due to the lower uncertainty values for the phase method.
6. Conclusions
The article discusses the use of the spectral density phase method to analyse the stochastic signals obtained using radioisotope measurements of two-phase liquid–gas flows in a horizontal pipeline and liquid–solid particles in a vertical pipeline. The analyses rely on the signals obtained from analysing the hydrotransport of the minority phase (air bubbles and ceramic models of ocean nodules) in the experimental setups. The purpose of the tests was to determine the average velocity of the minority phase in the analysed flows. The results of the measurements designated using the phase method were compared with those obtained for the comparative method of cross-correlation. In the former cases, the calculated uncertainties of the velocity measurements did not exceed 4% (phase method) and 9% (CCF) for the liquid–gas flow, and 1.5% (phase method) and 7% (CCF) for the liquid–solid particles flow, respectively. Furthermore, the cross-correlation method requires the filtering of the measurement signals with appropriate band filters, which is not necessary for the phase method. However, a difficulty in applying this method is the arbitrary choice of the analysis parameters related to the need to smooth the power spectral density estimators.
Author Contributions
Conceptualization, R.H.; Data curation, M.Z. and R.H.; Formal analysis, R.H.; Funding acquisition, R.H.; Investigation, R.H. and M.Z.; Methodology, R.H. and M.Z.; Project administration, R.H.; Resources, M.Z.; Software, R.H.; Supervision, R.H.; Validation, R.H., M.Z. and A.G.-J.; Visualization, M.Z. and R.H.; Writing—original draft, R.H.; Writing—review and editing, R.H.; Validation, R.H., M.Z. and A.G.-J. All authors have read and agreed to the published version of the manuscript.
Funding
This project is financed by the Minister of Education and Science of the Republic of Poland within the “Regional Initiative of Excellence” program for the years 2019–2023. Project number 027/RID/2018/19; amount granted 11 999 900 PLN.
Conflicts of Interest
The authors declare no conflict of interest.
References
- Dziubiński, M.; Prywer, J. Mechanics of Two-Phase Fluids; PWN: Warszawa, Poland, 2018. (In Polish) [Google Scholar]
- Falcone, G.; Hewitt, G.F.; Alimonti, C. Multiphase Flow Metering: Principles and Applications; Elsevier: Amsterdam, The Netherlands, 2009. [Google Scholar]
- Powell, R.L. Experimental techniques for multiphase flows. Phys. Fluids 2008, 20, 040605. [Google Scholar] [CrossRef]
- Soo, S.L. (Ed.) Instrumentation for Fluid-Particle Flow; Noyes Publications: Saddle River, NJ, USA, 1999. [Google Scholar]
- Tavoularis, S. Measurement in Fluid Mechanics; Cambridge University Press: Cambridge, UK, 2005. [Google Scholar]
- Yan, Y. Mass flow measurement of bulk solids in pneumatic pipelines. Meas. Sci. Technol. 1996, 7, 1687–1706. [Google Scholar] [CrossRef]
- Johansen, G.A.; Jackson, P. Radioisotope Gauges for Industrial Process Measurements; John Wiley & Sons: New York, NY, USA, 2004. [Google Scholar] [CrossRef]
- Roshani, G.H.; Nazemi, E.; Shama, F.A.; Imani, M.; Mohammadi, S. Designing a simple radiometric system to predict void fraction percentage independent of flow pattern using radial basis function. Metrol. Meas. Syst. 2018, 25, 347–358. [Google Scholar]
- Pant, H. Applications of the radiotracers in the industry: A review. Appl. Radiat. Isot. 2021, 182, 110076. [Google Scholar] [CrossRef]
- Mosorov, V. Improving the accuracy of single radioactive particle technique for flow velocity measurements. Flow Meas. Instrum. 2019, 66, 150–156. [Google Scholar] [CrossRef]
- Sattari, M.A.; Roshani, G.H.; Hanus, R.; Nazemi, E. Applicability of time-domain feature extraction methods and artificial intelligence in two-phase flow meters based on gamma-ray absorption technique. Measurement 2021, 168, 108474. [Google Scholar] [CrossRef]
- Roshani, M.; Phan, G.; Faraj, R.H.; Phan, N.-H.; Roshani, G.H.; Nazemi, B.; Corniani, E.; Nazemi, E. Proposing a gamma radiation based intelligent system for simultaneous analyzing and detecting type and amount of petroleum by-products. Nucl. Eng. Technol. 2020, 53, 1277–1283. [Google Scholar] [CrossRef]
- Krupička, J.; Matoušek, V. Gamma-ray-based measurement of concentration distribution in pipe flow of settling slurry: Vertical profiles and tomographic maps. J. Hydrol. Hydromech. 2014, 62, 126–132. [Google Scholar] [CrossRef]
- Dam, R.S.D.F.; Salgado, W.L.; Schirru, R.; Salgado, C.M. Application of radioactive particle tracking and an artificial neural network to calculating the flow rate in a two-phase (oil–water) stratified flow regime. Appl. Radiat. Isot. 2021, 180, 110061. [Google Scholar] [CrossRef]
- Alanazi, A.K.; Alizadeh, S.M.; Nurgalieva, K.S.; Nesic, S.; Guerrero, J.W.G.; Abo-Dief, H.M.; Eftekhari-Zadeh, E.; Nazemi, E.; Narozhnyy, I.M. Application of Neural Network and Time-Domain Feature Extraction Techniques for Determining Volumetric Percentages and the Type of Two Phase Flow Regimes Independent of Scale Layer Thickness. Appl. Sci. 2022, 12, 1336. [Google Scholar] [CrossRef]
- Salgado, W.; Dam, R.; Puertas, E.; Salgado, C.; Silva, A. Use of gamma radiation and artificial neural network techniques to monitor characteristics of polyduct transport of petroleum by-products. Appl. Radiat. Isot. 2022, 186, 110267. [Google Scholar] [CrossRef] [PubMed]
- Beck, M.S.; Pląskowski, A. Cross-Correlation Flowmeters; Adam Hilger: Bristol, UK, 1987. [Google Scholar]
- Hanus, R.; Zych, M.; Golijanek-Jędrzejczyk, A. Investigation of Liquid–Gas Flow in a Horizontal Pipeline Using Gamma-Ray Technique and Modified Cross-Correlation. Energies 2022, 15, 5848. [Google Scholar] [CrossRef]
- Hanus, R. Application of the Hilbert Transform to measurements of liquid–gas flow using gamma ray densitometry. Int. J. Multiph. Flow 2015, 72, 210–217. [Google Scholar] [CrossRef]
- Ding, H.; Huang, Z.; Song, Z.; Yan, Y. Hilbert–Huang transform based signal analysis for the characterization of gas–liquid two-phase flow. Flow Meas. Instrum. 2007, 18, 37–46. [Google Scholar] [CrossRef]
- Piersol, A. Time delay estimation using phase data. IEEE Trans. Acoust. Speech Signal Process. 1981, 29, 471–477. [Google Scholar] [CrossRef]
- Hanus, R.; Zych, M.; Petryka, L.; Świsulski, D. Time Delay Estimation in Two-Phase Flow Investigation Using the γ-Ray Attenuation Technique. Math. Probl. Eng. 2014, 2014, 475735. [Google Scholar] [CrossRef]
- Jacovitti, G.; Scarano, G. Discrete time techniques for time delay estimation. IEEE Trans. Signal Process. 1993, 41, 525–533. [Google Scholar] [CrossRef]
- Hanus, R.; Kowalczyk, A.; Szlachta, A.; Chorzępa, R. Application of conditional averaging to time delay estimation of random signals. Meas. Sci. Rev. 2018, 18, 130–137. [Google Scholar] [CrossRef]
- Bendat, J.S.; Piersol, A.G. Engineering Applications of Correlation and Spectral Analysis, 2nd ed.; Wiley: New York, NY, USA, 1993. [Google Scholar]
- Mosorov, V. Phase spectrum method for time delay estimation using twin-plane electrical capacitance tomography. Electron. Lett. 2006, 42, 630–632. [Google Scholar] [CrossRef]
- Ma, Y.; Gao, Y.; Cui, X.; Brennan, M.J.; Almeida, F.C.; Yang, J. Adaptive Phase Transform Method for Pipeline Leakage Detection. Sensors 2019, 19, 310. [Google Scholar] [CrossRef]
- Brennan, M.; Gao, Y.; Joseph, P. On the relationship between time and frequency domain methods in time delay estimation for leak detection in water distribution pipes. J. Sound Vib. 2007, 304, 213–223. [Google Scholar] [CrossRef]
- Faerman, V.; Avramchuk, V.; Voevodin, K.; Sidorov, I.; Kostyuchenko, E. Study of Generalized Phase Spectrum Time Delay Estimation Method for Source Positioning in Small Room Acoustic Environment. Sensors 2022, 22, 965. [Google Scholar] [CrossRef] [PubMed]
- Omologo, M.; Svaizer, P. Use of the crosspower-spectrum phase in acoustic event location. IEEE Trans. Speech Audio Process. 1997, 5, 288–292. [Google Scholar] [CrossRef]
- Müller, T.; Lauk, M.; Reinhard, M.; Hetzel, A.; Lücking, C.H.; Timmer, J. Estimation of Delay Times in Biological Systems. Ann. Biomed. Eng. 2003, 31, 1423–1439. [Google Scholar] [CrossRef] [PubMed]
- Lindemann, M.; Raethjen, J.; Timmer, J.; Deuschl, G.; Pfister, G. Delay estimation for cortico-peripheral relations. J. Neurosci. Methods 2001, 111, 127–139. [Google Scholar] [CrossRef]
- Hanus, R.; Zych, M.; Jaszczur, M.; Petryka, L.; Świsulski, D. Radioisotope measurements of the liquid-gas flow in the horizontal pipeline using phase method. EPJ WoC 2018, 180, 02032. [Google Scholar] [CrossRef][Green Version]
- Hanus, R.; Zych, M.; Petryka, L.; Mosorov, V.; Hanus, P. Application of the phase method in radioisotope measurements of the liquid–solid particles flow in the vertical pipeline. EPJ Web Conf. 2015, 92, 02020. [Google Scholar] [CrossRef]
- Zych, M.; Hanus, R.; Wilk, B.; Petryka, L.; Świsulski, D. Comparison of noise reduction methods in radiometric correlation measurements of two-phase liquid-gas flows. Measurement 2018, 129, 288–295. [Google Scholar] [CrossRef]
- Hanus, R.; Petryka, L.; Zych, M. Velocity measurement of the liquid–solid flow in a vertical pipeline using gamma-ray absorption and weighted cross-correlation. Flow Meas. Instrum. 2014, 40, 58–63. [Google Scholar] [CrossRef]
- Bendat, J.S.; Piersol, A.G. Random Data. In Analysis and Measurement Procedures, 4th ed.; Wiley: New York, NY, USA, 2010. [Google Scholar]
- Hanus, R.; Petryka, L.; Zych, M. Application of phase of the cross-power spectral density distribution to radioisotope measurement of two phase flows in pipelines. Pomiary Automatyka Kontrola 2012, 58, 236–239. (In Polish) [Google Scholar]
- Halliday, D.M.; Rosenberg, J.R.; Amjad, A.M.; Breeze, P.; Conway, B.A.; Farmer, S.F. A framework for the analysis of mixed time series/point process data. Prog. Biophys. Mol. Biol. 1995, 64, 237–278. [Google Scholar] [CrossRef] [PubMed]
- Joint Committee for Guides in Metrology (JCGM). Guide to the Expression of Uncertainty in Measurement; Joint Committee for Guides in Metrology (JCGM): Sèvres, French, 2008. [Google Scholar]
- The American Society of Mechanical Engineers. Guidelines for the Evaluation of Dimensional Measurement Uncertainty; ASME B89.7.3.2--2007 (R2011); American National Standards Institute (ANSI): New York, NY, USA, 2007. [Google Scholar]
Publisher’s Note: MDPI stays neutral with regard to jurisdictional claims in published maps and institutional affiliations. |
© 2022 by the authors. Licensee MDPI, Basel, Switzerland. This article is an open access article distributed under the terms and conditions of the Creative Commons Attribution (CC BY) license (https://creativecommons.org/licenses/by/4.0/).