Article

Design and Analysis of an Offshore Wind Power to Ammonia Production System in Nova Scotia

by
Carlo James Cunanan
1,2,
Carlos Andrés Elorza Casas
2,
Mitchell Yorke
2,
Michael Fowler
2 and
Xiao-Yu Wu
1,3,*
1
Greener Production Group, University of Waterloo, 200 University Avenue West, Waterloo, ON N2L 3G1, Canada
2
Department of Chemical Engineering, University of Waterloo, 200 University Avenue West, Waterloo, ON N2L 3G1, Canada
3
Department of Mechanical and Mechatronics Engineering, University of Waterloo, 200 University Avenue West, Waterloo, ON N2L 3G1, Canada
*
Author to whom correspondence should be addressed.
Energies 2022, 15(24), 9558; https://doi.org/10.3390/en15249558
Submission received: 17 November 2022 / Revised: 10 December 2022 / Accepted: 12 December 2022 / Published: 16 December 2022
(This article belongs to the Section A5: Hydrogen Energy)

Abstract

:
Green ammonia has potential as a zero-emissions energy vector in applications such as energy storage, transmission and distribution, and zero-emissions transportation. Renewable energy such as offshore wind energy has been proposed to power its production. This paper designed and analyzed an on-land small-scale power-to-ammonia (P2A) production system with a target nominal output of 15 tonnes of ammonia per day, which will use an 8 MW offshore turbine system off the coast of Nova Scotia, Canada as the main power source. The P2A system consists of a reverse osmosis system, a proton exchange membrane (PEM) electrolyser, a hydrogen storage tank, a nitrogen generator, a set of compressors and heat exchangers, an autothermal Haber-Bosch reactor, and an ammonia storage tank. The system uses an electrical grid as a back-up for when the wind energy is insufficient as the process assumes a steady state. Two scenarios were analyzed with Scenario 1 producing a steady state of 15 tonnes of ammonia per day, and Scenario 2 being one that switched production rates whenever wind speeds were low to 55% the nominal capacity. The results show that the grid connected P2A system has significant emissions for both scenarios, which is larger than the traditional fossil-fuel based ammonia production, when using the grid in provinces like Nova Scotia, even if it is just a back-up during low wind power generation. The levelized cost of ammonia (LCOA) was calculated to be at least 2323 CAD tonne−1 for both scenarios which is not cost competitive in this small production scale. Scaling up the whole system, reducing the reliance on the electricity grid, increasing service life, and decreasing windfarm costs could reduce the LCOA and make this P2A process more cost competitive.

1. Introduction

Ammonia is an essential part of the modern chemical industry, with a multitude of downstream uses including fertilizer, refrigerants, and chemical feedstock [1]. However, the current fossil fuel-based ammonia production directly accounts for almost 2% of global CO2 emissions, which makes it the top emitter among all the industrial chemical-synthesizing processes, even without accounting for the additional emissions associated with natural gas and coal extraction for ammonia production [2]. The production of hydrogen is the most carbon- and energy-intensive step is a state-of-the-art ammonia plant, which is usually from steam methane reforming and water-gas shift reactions. The hydrogen is then combined with nitrogen that is separated from air in a reactor at high temperatures of around 623 K to 773 K and pressures of around 150 to 300 bar [3] filled with catalysts that are often iron or ruthenium based [4]. This reaction is referred to as the Haber-Bosch process and is the source of most ammonia used today [5,6].
Recently, the industry has shown great interest in the field of green ammonia, which is produced in a way that is sustainable and carbon-free. For example, deals between Canadian companies such as Everwind and German companies such as Uniper and E.ON Hydrogen were signed which aim to transport 500,000 tonnes of green ammonia produced in Canada to Germany each year to fulfill Germany’s energy needs [7]. Green ammonia has a high potential as a clean energy vector for hydrogen [8,9], because ammonia contains 17.6 weight% of hydrogen, has a higher volumetric energy density than hydrogen, and can be used as a fuel directly or cracked back into hydrogen [9,10].
The Haber-Bosch process has been the main pathway to produce ammonia. However, there have been ammonia production methods that are alternatives to the thermochemical process. Producing ammonia include electrochemical methods and non-thermal plasma-assisted ammonia synthesis methods which can operate at lower temperatures and operating pressures than the Haber-Bosch [1]. However, since the other methods of producing ammonia are less mature, this report focuses on the thermochemical process. In the electrified Haber-Bosch process, the hydrogen can be made using electrolysis powered by renewable sources such as wind or solar to eliminate greenhouse gas (GHG) emissions [11]. The capacity factor is found to be a critical parameter to reduce the cost of electrified ammonia production [12]. Since offshore wind power has higher wind speed and capacity factors than onshore wind [13], we focus on the offshore wind power-to-ammonia (P2A) production in this paper. There are currently no offshore wind farms in Canada [13,14], but a large quantity of offshore resources are available [13].
The objective of this paper is to design and analyze a small-scale P2A system that will use offshore wind as the main power source. The targeted nominal output is 15 tonnes of ammonia per day. The P2A system is on land and connected to an 8 MW offshore turbine system (i.e., four 2 MW turbines) via submarine power cables. The P2A system consists of a reverse osmosis (RO) system, a proton exchange membrane (PEM) electrolyser, a hydrogen storage tank, a nitrogen generator, a set of compressors and heat exchangers, an autothermal Haber-Bosch reactor, and an ammonia storage tank. The P2A system also uses the electrical grid as backup when the wind energy is insufficient to power a steady state production. We used historic wind data from Sable Island, Nova Scotia for the design, and a technical, environmental, and economic analysis was performed.
The rest of this paper is organized as follows. Section 2 provides a literature review on analyses done on methods of ammonia production that reduce carbon emissions. Section 3 details the P2A design and the methodologies for the system. Section 4 discusses the performance, the emissions, and the economics of the P2A system. Lastly, Section 5 describes the resulting conclusions and recommendations.

2. Literature Review

Several papers have reported wind powered P2A green ammonia production systems. Wang et al. [15] performed a comprehensive techno-economic analysis for green offshore ammonia plants and determined the minimum achievable levelized cost for various wind profiles, plant capacities, distances to shore and water depths. They found that it is costly when the offshore wind turbine locations are too far from the mainland if the ammonia plant is built on land. With their setup, they found that a proposed green offshore ammonia plant setup is significantly more cost-effective than having an onshore ammonia plant and that cost reductions of 50% can be achieved in comparison to the onshore plant if wind turbine distances are further than 2000 km from the shore. They predicted that with expected cost reductions in offshore wind turbines the system can become more cost-competitive to land based green ammonia plants. Morgan et al. [16] summarized and analyzed how offshore wind can be converted into liquid ammonia using an electrolyser, air separation and an ammonia reactor. They found that the minimum levelized cost of ammonia (LCOA) for an offshore wind powered facility in the Gulf of Maine is about 580 USD per metric ton and that it was most sensitive to wind speed, cost of wind power, the cost of manufacturing synthesis gases and the lifetime of the system. Salmon et al. [17] provided a techno-economic analysis of offshore green ammonia production using offshore turbines, solar panels, and offshore plants. They presented the first global heat map for ammonia production which considers ocean production, land availability restrictions, and transport to major demand centers. They claimed that producing some of the ammonia in the ocean can result in cost savings because cost competition for land may limit onshore capacity in the best locations. Jain et al. [12] conducted an analysis on the potential economic risks and benefits of using electrified ammonia production in the food, energy, and trade sectors, and found that if there is a drop in the levelized cost of ammonia to $225/tonne then even the least-profitable energy storage sector can make profits. Lu et al. [18] discussed the telecoupling of wind power-based ammonia for electric vehicles and hydrogen fuel cell vehicles compared with EV transportation systems. The results showed that the transition to ammonia-based fuels can reduce non-renewable energy consumption and greenhouse gas emissions but the demand for energy sources (defined as a total amount of a specific kind of energy for production) and biotic endpoint impacts increase. Verleysen et al. [19] conducted an optimization of an ammonia synthesis plant powered by wind turbines considering operational uncertainties with a methodology that measures production and robustness. Using Aspen Plus and a multi-objective optimization approach they found that the most productive design is most sensitive to wind speed measurement error and temperature fluctuation in the ammonia reactor while the most robust design is only most sensitive to the temperature variation in the ammonia reactor.
Solar powered or combined wind and solar powered green ammonia production systems were also studied. Fasihi et al. [20] investigated the global potential for green ammonia production using hybrid photovoltaic (PV)-wind power plants utilizing a cost-optimization method and hourly weather data with 0.45° × 0.45° spatial resolution. They predicted that by 2030 onsite renewable electricity-based ammonia could be generated for a cost range of 345–420 euros per tonne, competitive with the decade-average price of ammonia of around 300–350 euros per tonne. Pawar et al. [21] investigated India’s potential for green ammonia using onshore wind and solar energy sources. They found that the energy source potential for solar was over six times more than that for wind in India. Both wind and solar powered systems fail to be cost-competitive with the conventional fossil fuel-based ammonia production methods, but a carbon tax of 224–335 euros per tonne of CO2 could make solar powered systems cost competitive. Ozturk et al. [22] analyzed an integrated system for ammonia production using solar energy with electrolytic hydrogen in Istanbul, Turkey, and found that the maximum energy and exergy efficiencies for their specific system at the minimum solar radiation intensity are 26.08% and 30.17%, respectively. However, the efficiencies drop with an increase of solar radiation intensity due to low energy and exergy output. Armijo et al. [23] performed a techno-economic study to produce hydrogen and ammonia using combined solar and wind energy from four locations within Chile and Argentina. They found that the hybridization of wind and solar can reduce costs of production of hydrogen and ammonia significantly—with the gains from hybridization in ammonia production substantially larger. This is because the hybridization reduces the power variability which positively impacts ammonia synthesis because the reactor works best with low variability. They estimated that the near-term cost for green ammonia could be below 500 USD/tonne. Palys et al. [24] reviewed the possibilities for renewable ammonia production with electrolytic hydrogen and some challenges such as solar and wind’s intermittent availability and the lack of research in dynamic modeling and optimization.
There are also alternative attempts of producing cleaner ammonia such as using biomass and carbon capture. Zhang et al. [25] performed a techno-economic comparison between P2A and biomass to ammonia processes and found that P2A with a solid oxide electrolyser achieves the highest system efficiency of over 74%, followed by the conventional methods (methane to ammonia) of a ~61% efficiency and biomass to ammonia of a 44% efficiency. While P2A using a solid oxide electrolyser is currently not economically feasible, it can be competitive with a payback time of less than 5 years with drops in cost in electrolyser stacks [25]. In addition, although it is feasible to eliminate carbon emissions within a P2A plant in a certain region (e.g., the Antwerp-Rotterdam-Rhine-Ruhr Area [26]), it may still be difficult to eliminate total life-cycle emissions from the grid if the grid electricity is used to power the P2A process. Khademi et al. [27] modelled an ammonia production process derived from steam reforming of biomass-derived glycerol in a thermal-integrated intensified process. This intensified process can reduce capital cost by removing certain equipment (e.g., desulphurizer, steam reformer, water gas-shift converter, and condenser), simultaneously produce ammonia and synthesis gas, provide auto-thermality in the reactors, mitigate environmental pollution because it emits no flue gas, and use the greenhouse gas as a feedstock for methane tri-reforming [27]. A cradle-to-gate environmental assessment of conventional and greener hydrogen production methods to produce ammonia was performed using the ReCIPe impact assessment method, and results show that natural gas-based ammonia synthesis integrated with chemical looping hydrogen production gives the highest reduction in global warming potential in comparison to electrolysis methods [28]. Furthermore, unless carbon-free electricity is used, electrolytic hydrogen production for ammonia synthesis could result in significant overall emissions to air, water, and soil [28].
Although there have been many papers regarding ammonia production using various types of green energy and alternatives, previous literature specifically on using offshore wind and combining it with ammonia production has been few. There have been broad generalized papers that describe offshore wind on a global scale such as the one with Wang et al. [15] and Salmon. et al. [17]. Additionally, there have been papers that are relevant to specific locations such as regarding the Gulf of Maine written by Morgan et al. [16]. This paper is similar to the one written by Morgan et al. [16] as it focuses on a specific location however in a different region. Results will contribute to the scientific community by analyzing the potential costs, emissions, and performance of a P2A system on the coast of Nova Scotia. We also conducted analysis on how varying production modes can affect the overall cost and emissions of the P2A system.

3. P2A System Design: Component Sizes and Operation Strategies

3.1. Electricity Input

The small-scale P2A system was designed to be powered by an 8 MW offshore wind farm that consists of four 2 MW wind turbines and backed up by electrical grid to maintain steady output. Hourly wind data from the year 2020 from a weather station on Sable Island, Nova Scotia was used for the simulations [29]. This wind recorded from a land station on Sable Island was assumed to be identical to wind offshore. We assumed the wind farm is located around 50 km off the shore, the same as that in reference [30] to determine the costing estimates (the average distance from the shore is 47 km [31]). The wind farm was assumed to be supported by a monopile structure with an average water depth of 34 m which is similar to characteristics in the North Atlantic [30]. The electricity from the wind farm will be transmitted to the onshore P2A system using high voltage submarine power cables. Submarine power cables were chosen as they are the usual type of cable used for offshore wind. The backup electricity grid in the province of Nova Scotia will be used when the energy from the wind farm is insufficient.
Weather data is available for Sable Island and due to its distance from the shore, it is expected to resemble realistic wind speeds for offshore wind power. The historic wind data used in this report contains 2782 h of continuous hourly wind speed profile from the year 2020. For the hours without the historic wind speed data, values were replaced with the average wind speed over the 2782 h. The power generation for the four 2 MW wind turbines were determined based on the wind speed, using a typical power curve [32] with an additional 7% power losses to account for the imperfectly head-on landing of the wind to the turbines and other potential unaccounted losses in the wind turbine system.
The offshore windfarm was costed using a relationship of 4077 USD/kW that was retrieved from a National Renewable Energy Laboratory (NREL) report [30]. Since the windfarm was 8 MW, the total cost in CAD was estimated to be 42 million CAD. However, to adjust the price from 2019 to 2021, the Chemical Engineering Plant Cost Index (CEPCI) was used. This resulted in the cost estimation to be around 46.5 million CAD. This price includes the decommissioning of the windfarm and the cables and other miscellaneous electrical generation equipment, as well as other contingencies and fees regarding construction. This relationship was based off 6.1 MW offshore turbines that had a windfarm of around 100 wind turbines. It was assumed that the offshore wind turbine cost estimates used in this report is directly comparable to the ones used in the NREL report [30] although real costs may be slightly more expensive due to economies of scale.

3.2. P2A Components

The P2A system was placed on shore for the system. An offshore P2A system that transports ammonia by ship or by pipe to the land can also be a viable consideration. Despite the advantages such as low ammonia shipping costs, low electrical losses, not taking up land space onshore, and potential refuel locations for ammonia-powered marine ships [15], offshore P2A systems on an offshore platform have significant economic complexities for an accurate analysis. For example, the cost of building these offshore platforms are usually confidential but were estimated to be around 100–500 million USD [17] which is a significantly large range. The logistics and costs of operating and maintenance of offshore P2A systems are difficult to estimated. In addition, repurposing existing oil rigs could have a variable cost depending on the types of processing equipment on the rigs. Therefore, an onshore plant was chosen to have a more accurate capital expenditure (CAPEX) estimation.
A simplified flow diagram of the P2A system is shown in Figure 1. The system consists of an RO system, a PEM electrolyser, compressors, nitrogen generator using pressure swing adsorption (PSA), autothermal Haber-Bosch reactor, separator, and storage. The components were sized based off the basis of 15 tonnes of ammonia per day using public vendor details and process analysis techniques as discussed in the following sections.

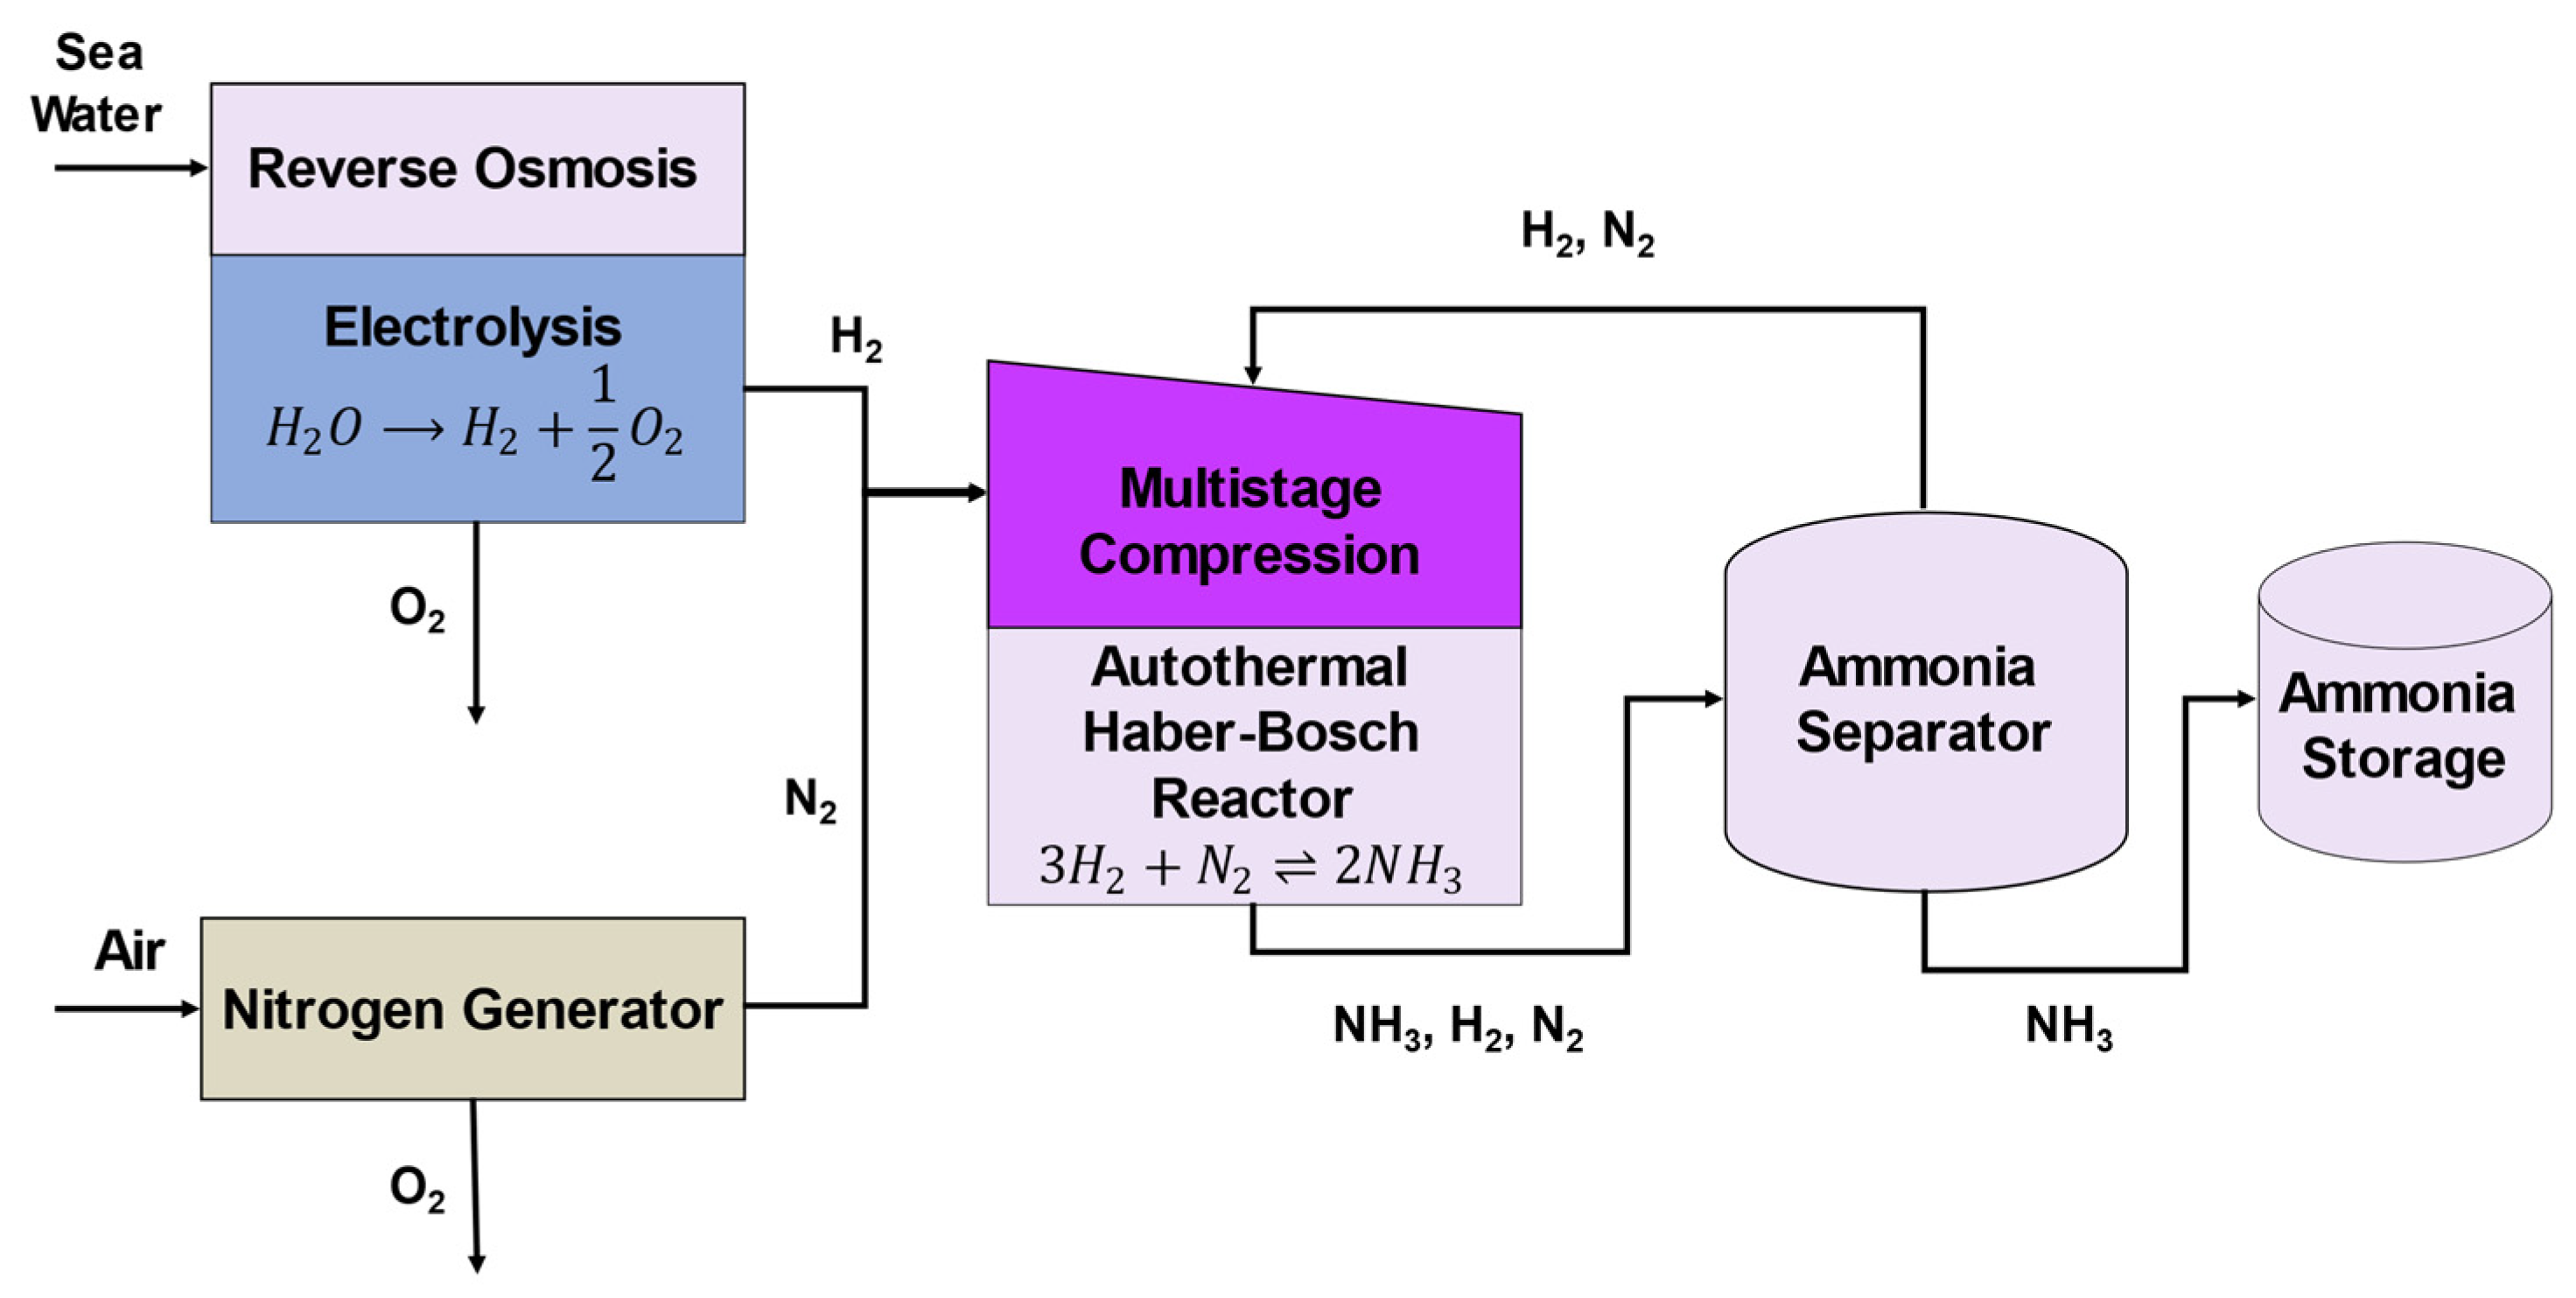
3.2.1. RO and Electrolyzer

The RO and electrolyser subsystem have inputs of seawater and electricity and outputs oxygen and hydrogen. Seawater will be inputted into the RO system which will remove salt and impurities so that it is suitable for use in the electrolysis. The PEM electrolyser uses electrical power to convert water into hydrogen and oxygen.
The sizing of the subsystem was based on 15,000 kg of ammonia per day. The electrolyser was sized first and the RO system second. Using overall mass balances and assuming an 97% overall conversion in the ammonia reactor (details in Section 3.2.4), the amount of hydrogen required for that basis would be about 2743 kg day−1 from an electrolyser that can output around 1271.5 Nm3 h−1 of hydrogen. A company by the name of Nel with the electrolyser model M2000 met this requirement with a possible volumetric hydrogen output of 2000 Nm3 h−1 [33]. Nel was chosen over other vendors as that had the most available specifications. According to the product specifications, the electrolyser unit would result in average power consumption of around 4.5 kWh/Nm3 of hydrogen [33]. This means that about 5.7 MW of power would be required for each ton of ammonia. With a safety factor of about 20%, the power that the electrolyser was sized to handle was 6.86 MW. The capital cost of the electrolyser was estimated using an article that stated the cost of an electrolyser stack as around 400 USD/kW [34] and using a power of 7 MW. With the assumption that 50% of the total cost of the electrolyser goes to the stack, the calculated capital cost of the electrolyser was estimated to be around 7.2 million CAD.
With the electrolyser information above, it was calculated that about 27,417 kg day−1 of processed water would be required in the RO system which is about 7128 gallons per day. A 10,000 gallon per day capacity RO system by ForeverPure [35] was selected for this report. With a 26% recovery rate, the amount of seawater inputted into the reverse osmosis system was about 105,000 kg of water per day [35]. The power consumed on the RO system was based off a consumption of around 3 kWh m−3 of water [36] which is typical for many seawater RO systems. The cost of the RO system was taken to be 23,056 CAD which was an average of three RO systems that have similar capacities [37,38,39].
A hydrogen storage tank will be placed at the end of the subsystem. The hydrogen storage will have a holdup time of about 15 min. The size of the storage tank will have a volume of around 12 m3 and will hold the hydrogen at 25 °C and 30 bar. Using Ulrich and Vasudevan methods [40], the cost of a stainless steel cylindrical hydrogen tank with a length of 6 m and a diameter of 2 m would be about 500,000 CAD.

3.2.2. Nitrogen Generation

The nitrogen generation subsystem will contain a PSA module and a dryer. PSA uses the concept of selective permeation that allows nitrogen to pass through while oxygen is adsorbed onto a membrane [41]. This membrane is then depressurized to let go of the oxygen. This process is required to separate the nitrogen component from the rest of the air (mainly oxygen). However, there are other methods such as cryogenic distillation and membrane filtration that were considered. PSA was chosen as the system as it provided the throughput required at a lower energy input. This subsystem will contain a set of compressors to get the nitrogen from a pressure of 10 bar to 30 bar which is required to match with the hydrogen that goes into the multi-stage compression subsystem that goes into the reactor. The flow through the system was designed to output 15 tonnes of nitrogen per day at a purity of 99.99%.
It was difficult to find literature or vendors that had prices for nitrogen generation. However, Sanchez and Martin [42] related the price of nitrogen production with the scale required for renewable ammonia production for a purity of 99.3%. Using their relationships, the investment required for a scale of around 15 tonnes of nitrogen feed per day was around 400,000 CAD. Accounting for the higher purity and design flows, it was estimated to cost 500,000 CAD for the entire nitrogen generation subsystem. This would include the compressors and the heat exchangers required for the process.

3.2.3. Multi-Stage Compression

The multi-stage compression subsystem is the process that compresses the mixtures of nitrogen and hydrogen to prepare it for the autothermal ammonia reactor. The multi-stage compression must take a feed of about 75 mol% hydrogen and 25 mol% nitrogen with a pressure of about 30 bar and a temperature of about 30 °C to produce an output of the same mixture at a pressure of about 86 bar and 325 °C. This would require two compressors with one intercooling stage. The centrifugal compressors were sized using ASPEN and resulted in a motor power of around 280 kW each which assumed a polytropic efficiency of 65% and a motor efficiency of 93% [43]. The cooling duty required from the intercooling stage would be around 110 kW. The estimated cost of the compressors using costing charts from Ulrich and Vasudevan [40] and the power consumptions above was about 2.1 million CAD each.

3.2.4. Ammonia Reactor

The ammonia reactor synthesizes ammonia by taking hydrogen and nitrogen as inputs. Modern Haber catalysts such as ruthenium and iron oxide operate at moderate conditions (380 °C and 86 bar), compared with the traditional Haber magnetite catalysts at 450 °C and 300 bar [44,45,46]. Iron oxide was selected as the catalyst due to its lower cost compared to ruthenium. A typical radial flow bed reactor was chosen, because it reduces pressure drop across the catalyst bed [3,46,47,48]. The reactor was designed according to main design specifications required, i.e., recycle rate and the size of the catalyst beds. Typical large-scale systems achieve up to 26% single-pass conversion and between 97–99% overall conversion with the recycle stream [44,45]. Yet, the small modular scale of our design is uncommon in the literature, so more conservative specifications, i.e., 20% single-pass conversion and 97% overall conversion with recycling were chosen. The conversion for the first bed is calculated by dividing the amount reacted in the first bed by the amount inputted into the first bed. The overall conversion is calculated by dividing the total amount that was reacted in both beds by the total amount of input to the two reactor beds. This is significant because there is an interstage quench stream which is inputted into the process in between the two beds.
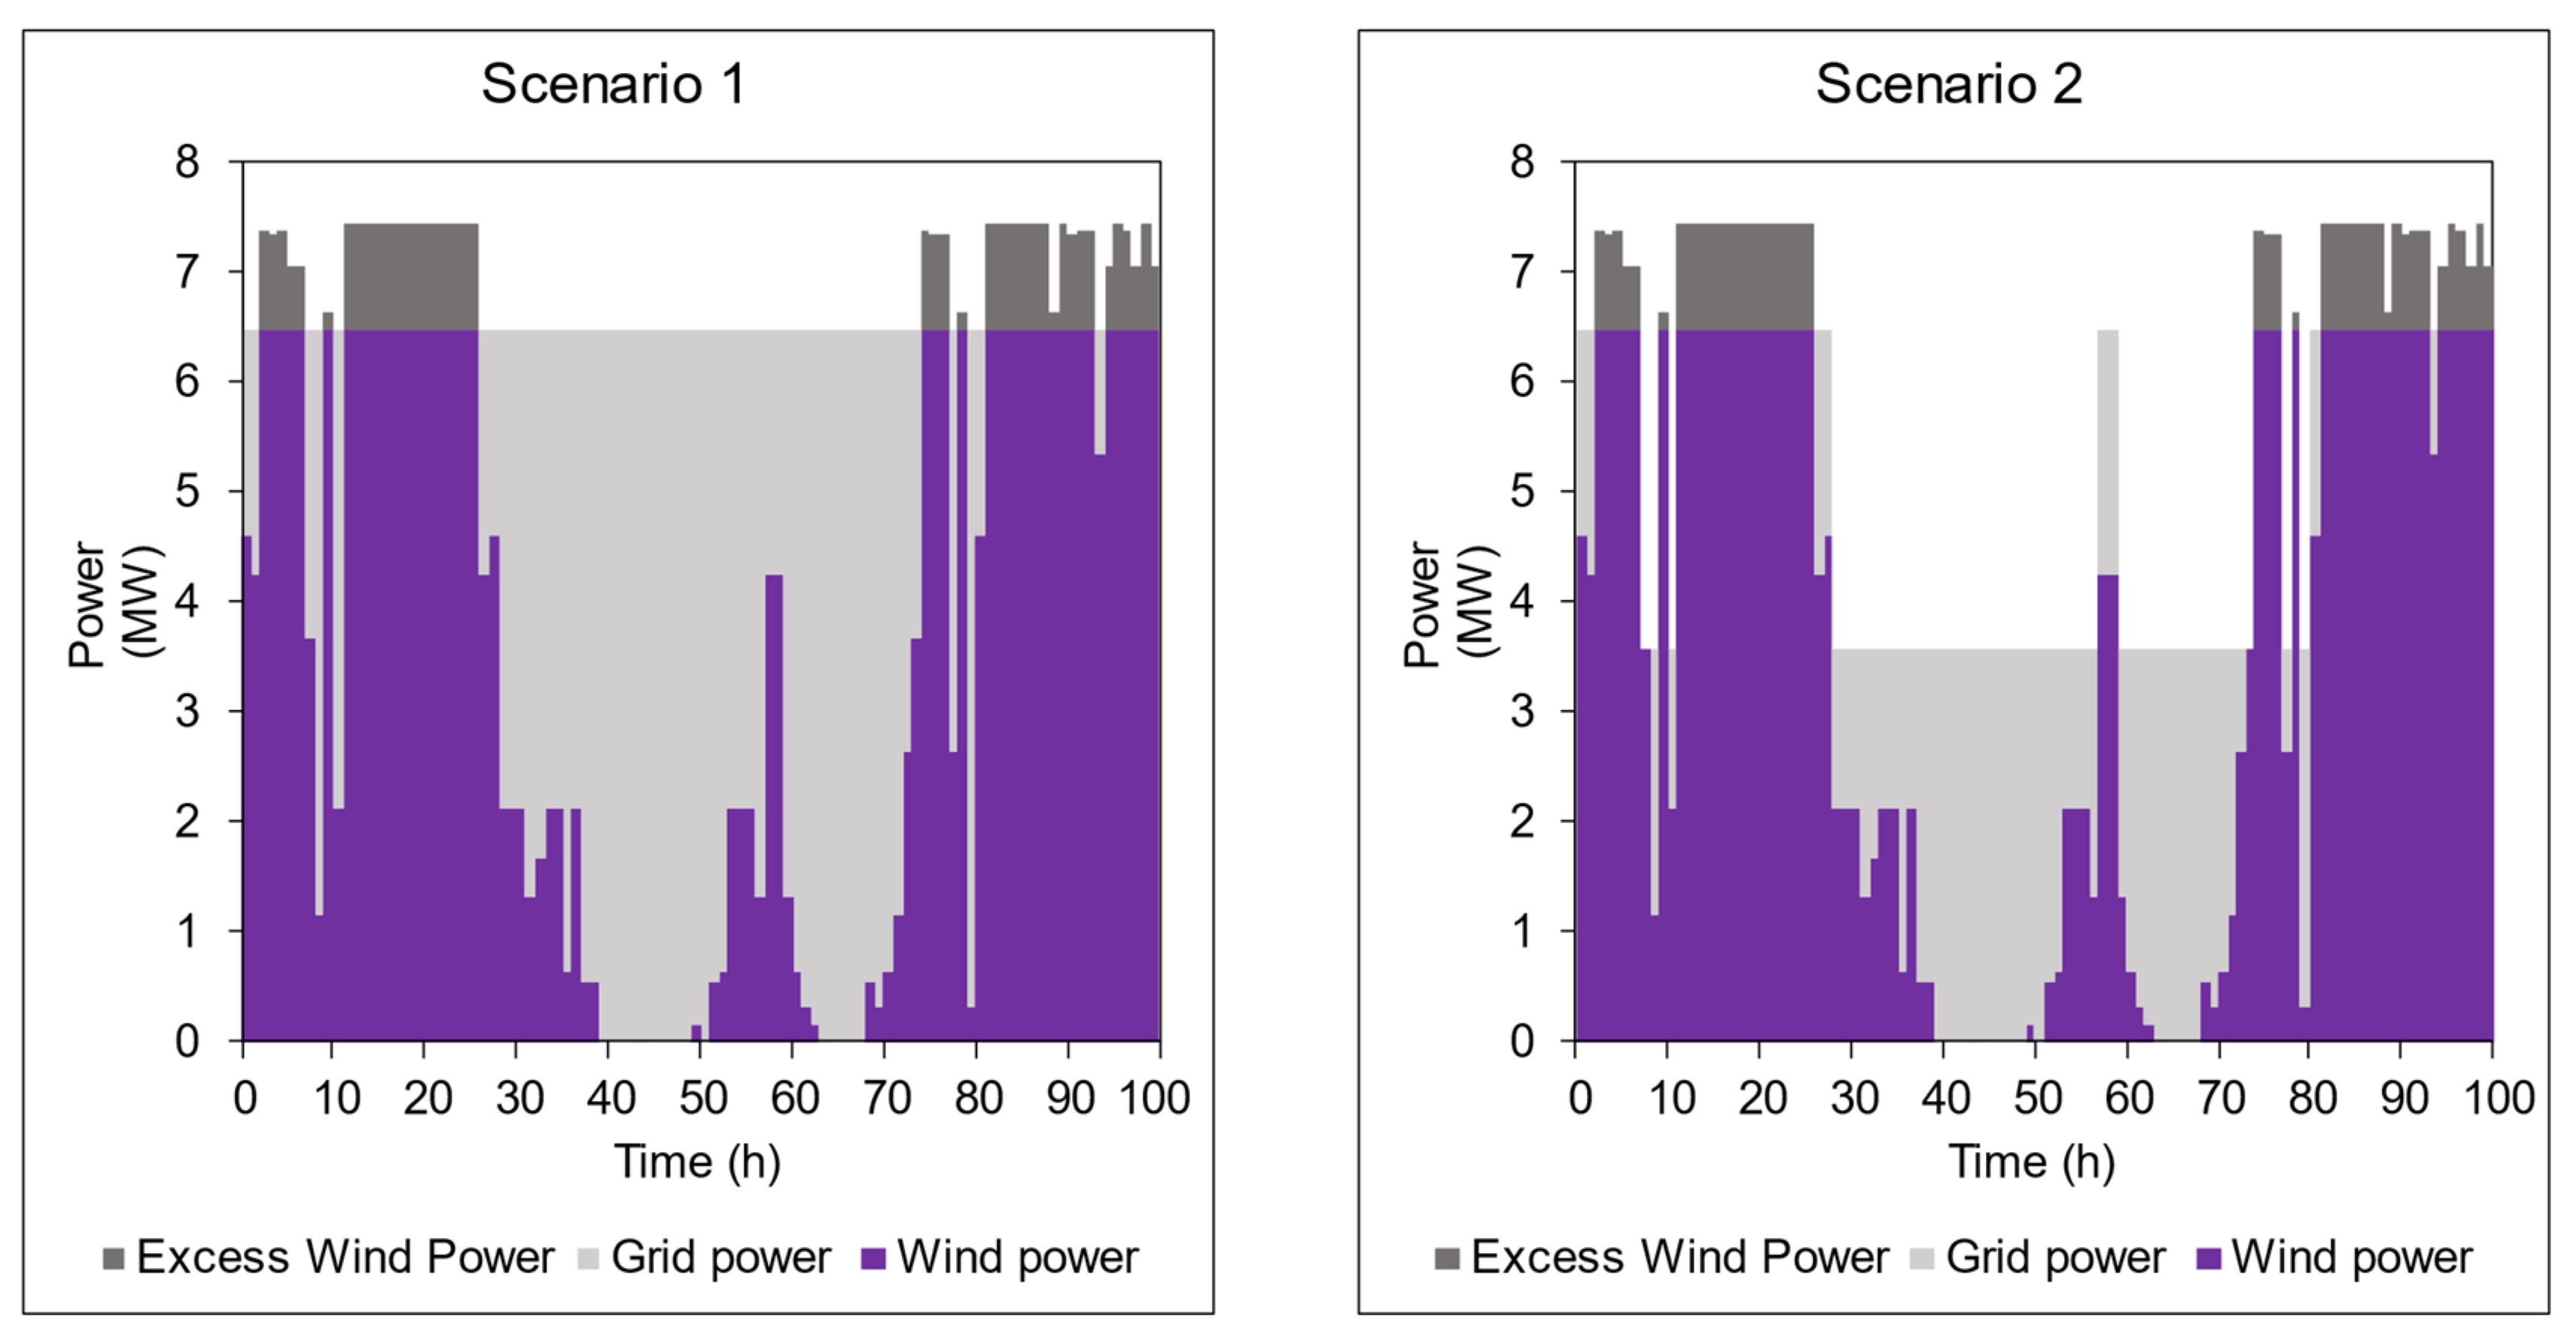
As the offshore wind power is intermittent [3], it is important to understand the operating flexibility of the process to function under different production rates. Once the reactor is sized and built, the bed size will not change but the production rates could change. The inlet flow rate of reactants can vary depending on the power available to produce hydrogen and nitrogen. The chosen configuration was based on the work by Iqbal Cheema et al. [
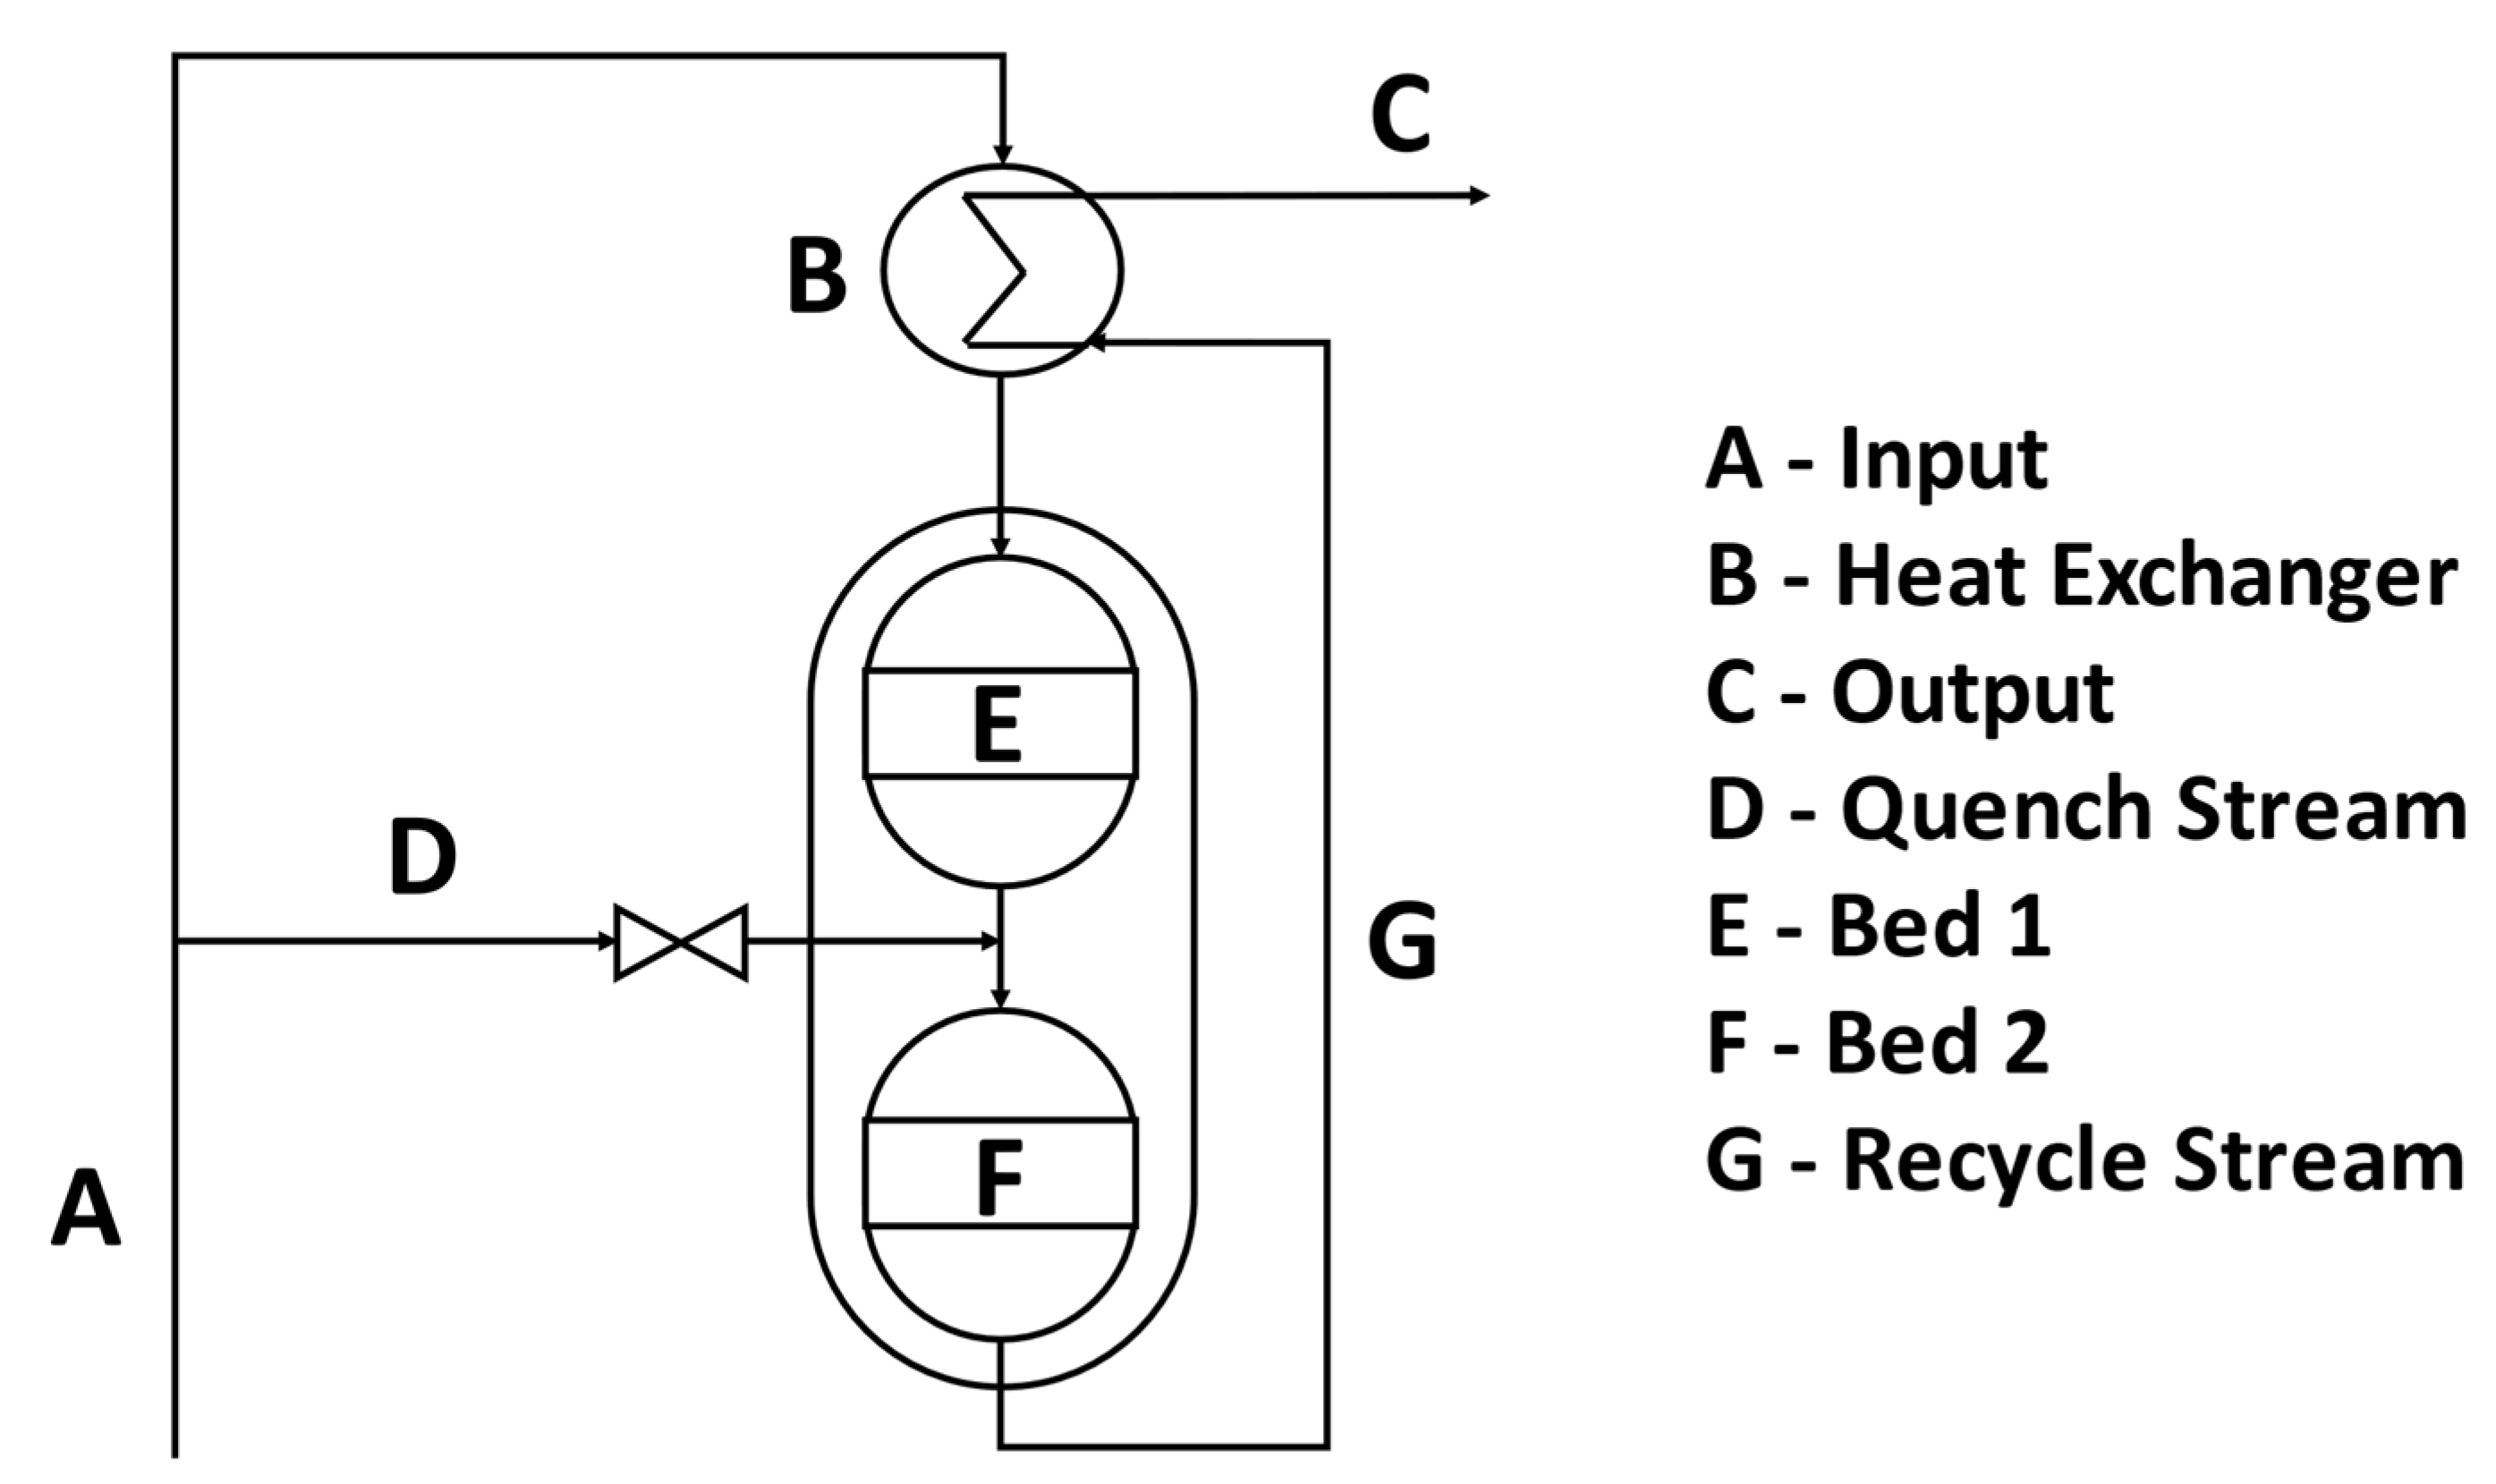
3] where they designed a multistage ammonia synthesis reactor that uses the heat generated in the exothermic reaction to heat the feed to the reactor and make the reaction self-sustaining. Following their work, the assumption was made that heat losses were negligible. Figure 2 is a process diagram of the ammonia reactor depicting the multiple catalyst beds and the interstage quench stream.
The designed output of the reactor is 15 tonnes ammonia per day. The maximum reactor temperature is 480 °C. The feed is a stoichiometric mixture at 325 °C and 86 bar. The reactor has two beds: the first one is 0.40 m3 and the second bed is 0.74 m3. The catalyst properties which were used in the sizing the reactor (i.e., rate constant, activation energy, etc.) were based on the industrial catalyst ZA-5 described by Liu et al. [46]. These parameters are summarized in Table 1. These parameters were used in Equations (5) and (6) which describe the reaction kinetics.
The reactor packed beds were modelled as ideal packed bed reactors with the following reaction: [3,46,49].
1 2 N 2 ( g ) + 3 2 H 2 ( g ) N H 3 ( g )
The mass and energy balances are:
d F i d m c a t = ν i r N H 3
i F i C ^ p , i ( T ) d T d m c a t = r N H 3 Δ H R ( T )
where F i is the molar flow rate of species i in mol s−1, m c a t is the catalyst weight in kg, r N H 3 is the rate of reaction mol kg−1 s−1, ν i is the stoichiometric coefficient, T is the temperature in ℃ or K, C ^ p , i is the specific heat capacity of species i in kJ mol−1 K−1 and Δ H R is the heat of reaction in kJ mol−1.
The reaction kinetics are modelled using the Temkin equation described by Equations (4)–(6) [3,46,49,50]; where k T is the rate constant in atm0.5 s−1; ρ c is the catalyst bulk density in kg m−3, K f is the equilibrium constant in atm−1, α is a parameter specific to the catalyst, dimensionless, k 0 is the pre-exponential factor in atm0.5 s−1, E a is the activation energy in kJ mol−1, and R is the ideal gas constant. The fugacity, f i , of each component is calculated using Equation (7), where y i and ϕ i are the mole fraction and fugacity coefficient of component i respectively and P is the pressure in atm. F A is not meant to be confused with the molar flowrates of a species but is a simplifying term to represent the large kinetic term in (5). For the selected catalyst size (2–3 mm), the rate of reaction can be taken without corrective factor and the pressure drop can be neglected [3].
r N H 3 = k T F A ( 0.0224 m 3   ( STP ) mol ) ρ c
F A = K f 2 f N 2 ( f H 2 3 f N H 3 2 ) α ( f N H 3 2 f H 2 3 ) 1 α
k T = k 0 exp ( E a R T )
f i = y i ϕ i P
Liu et al. [46] and Gillespie et al. [51] provide correlations for calculating the heat capacity of each reactive component, the Arrhenius parameters and the equilibrium constant. Panahandeh et al. [47] provides a correlation for computing the heat of reaction. Dyson et al. [50] provide correlations for calculating the fugacity coefficients. A summary of the correlations utilized by the modelling of the reactor can be found in Table 2 below:
The modeling Equations (2) and (3) were solved using MATLAB’s solver ode45. 
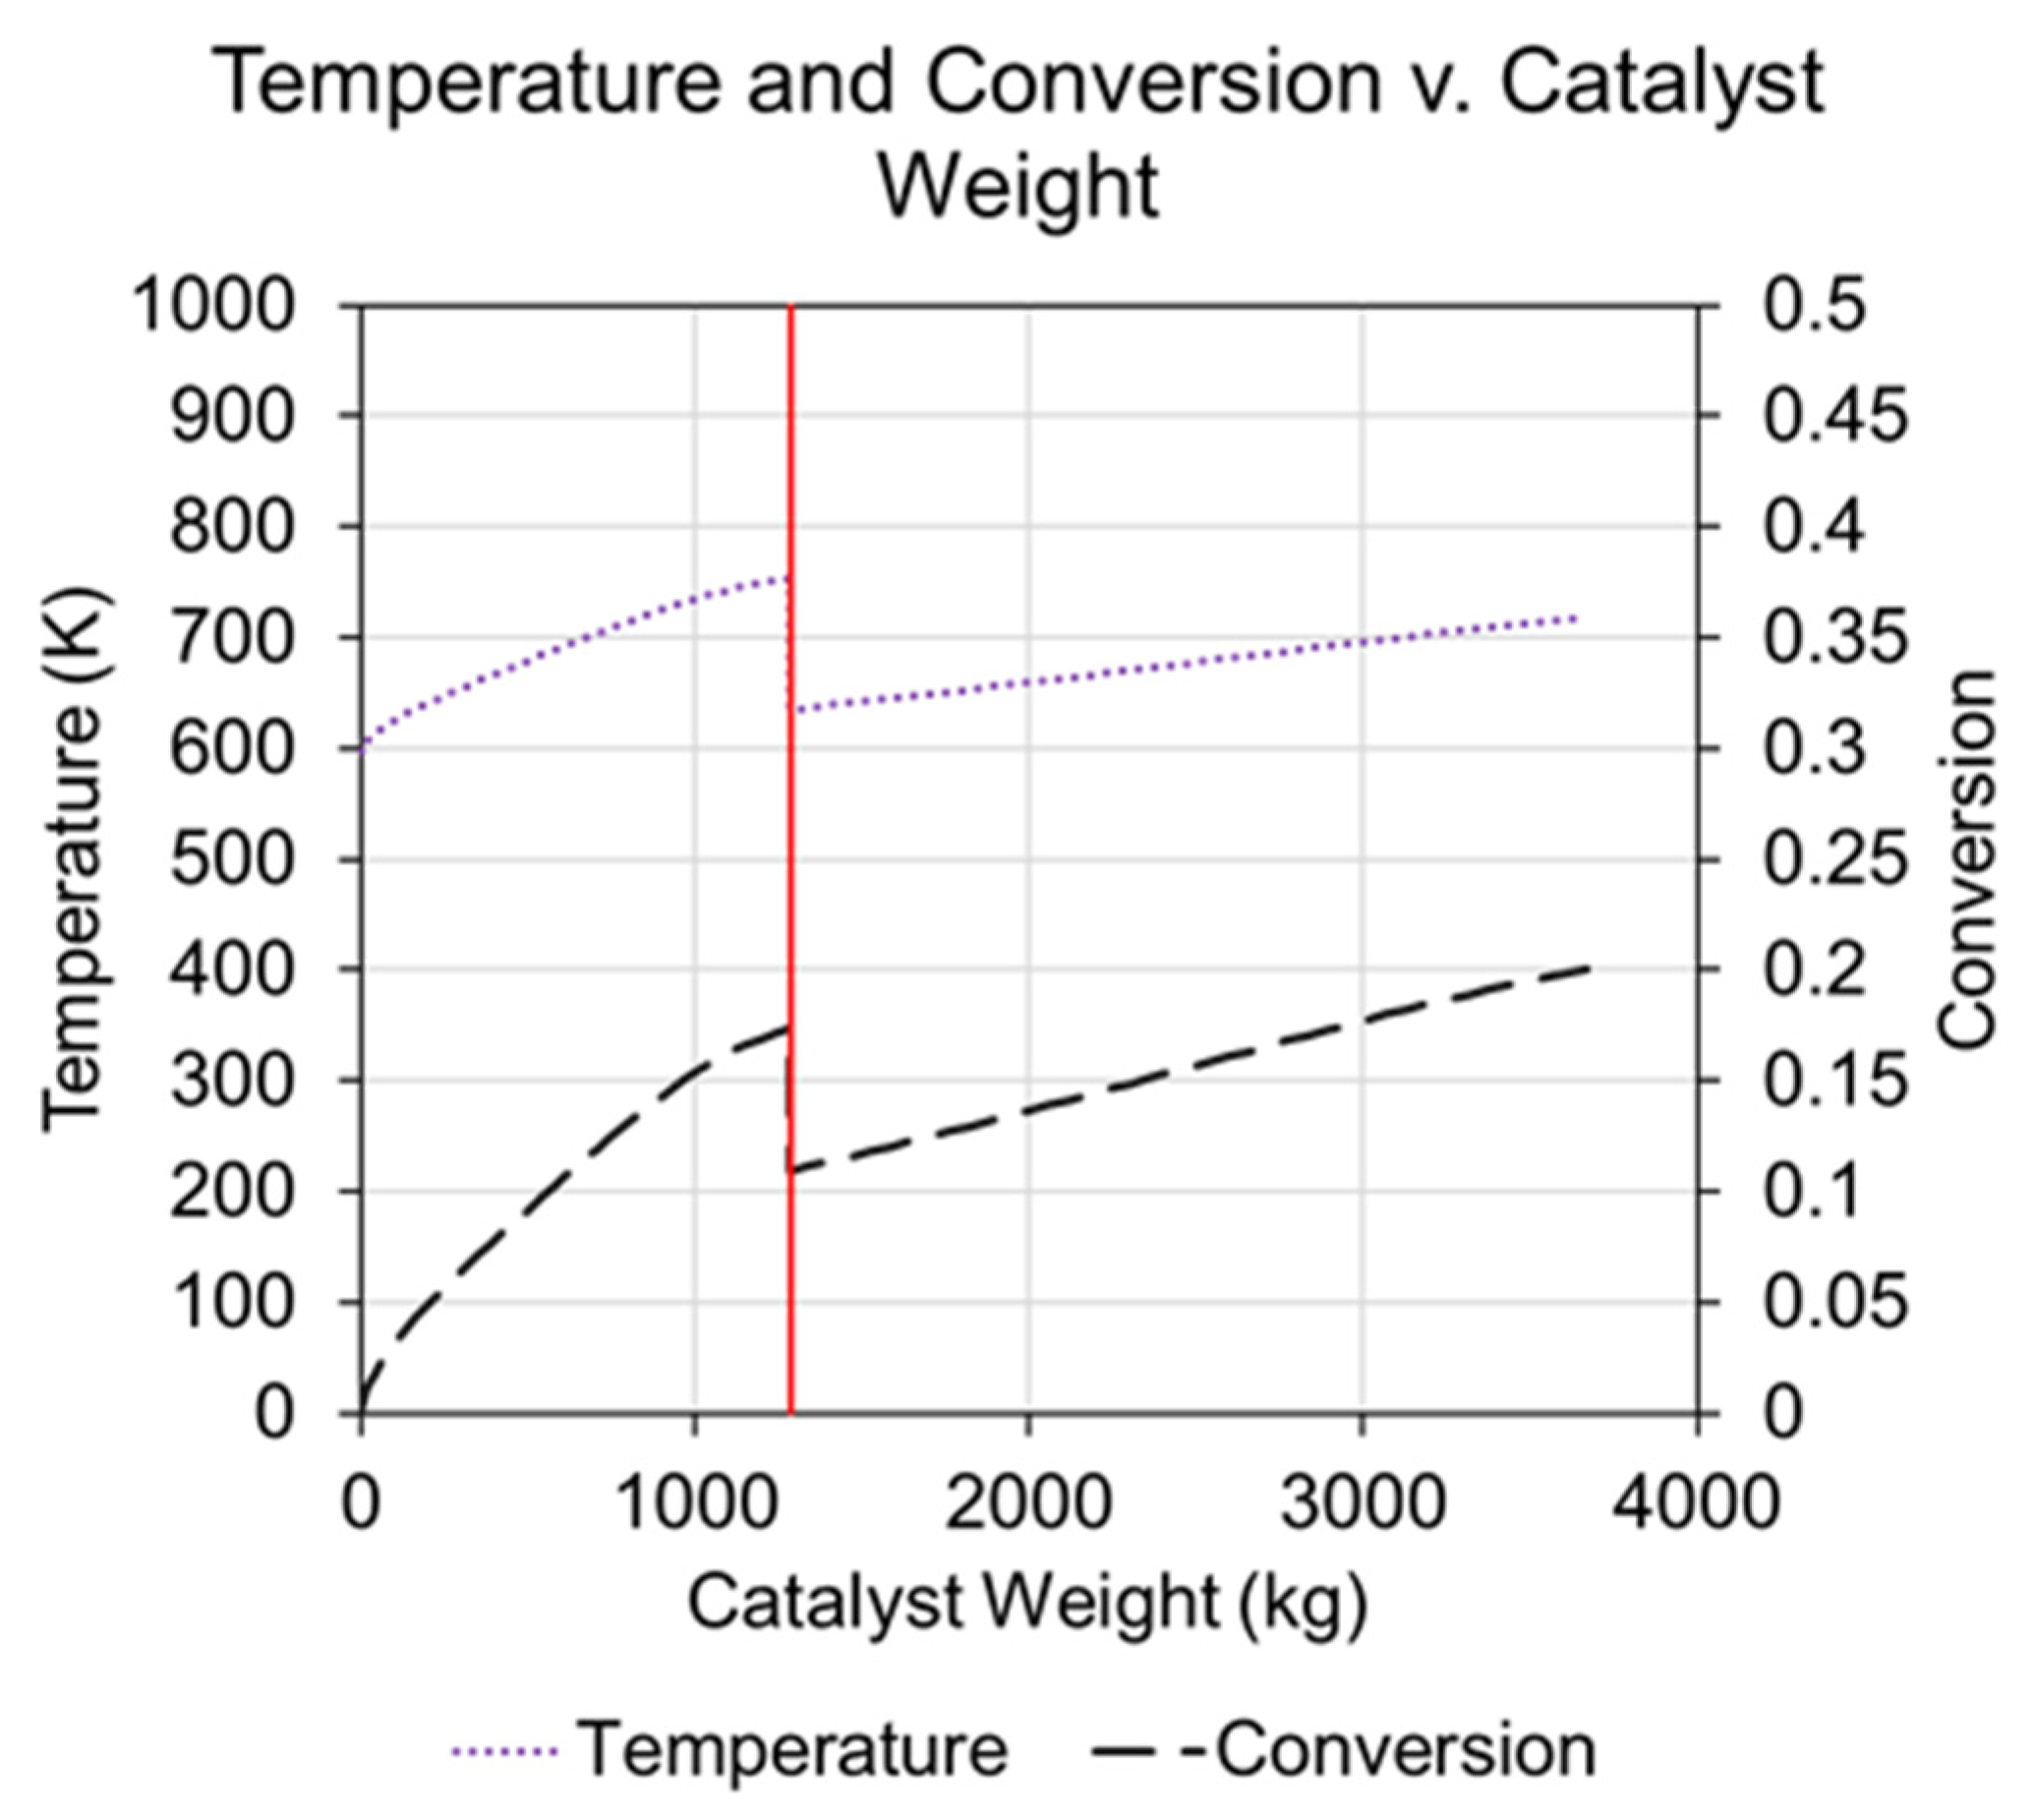
Figure 3 shows the nominal profile of temperature and conversion along the reactor beds. The nominal profile is based on a constant output of 15 tonnes of ammonia per day.
The ammonia reactor is an autothermal reactor. The heat generated by the reaction in both beds are used to preheat the feed through heat exchangers before bed 1 to sustain the overall reaction, and the system exhibits multiple steady states. 
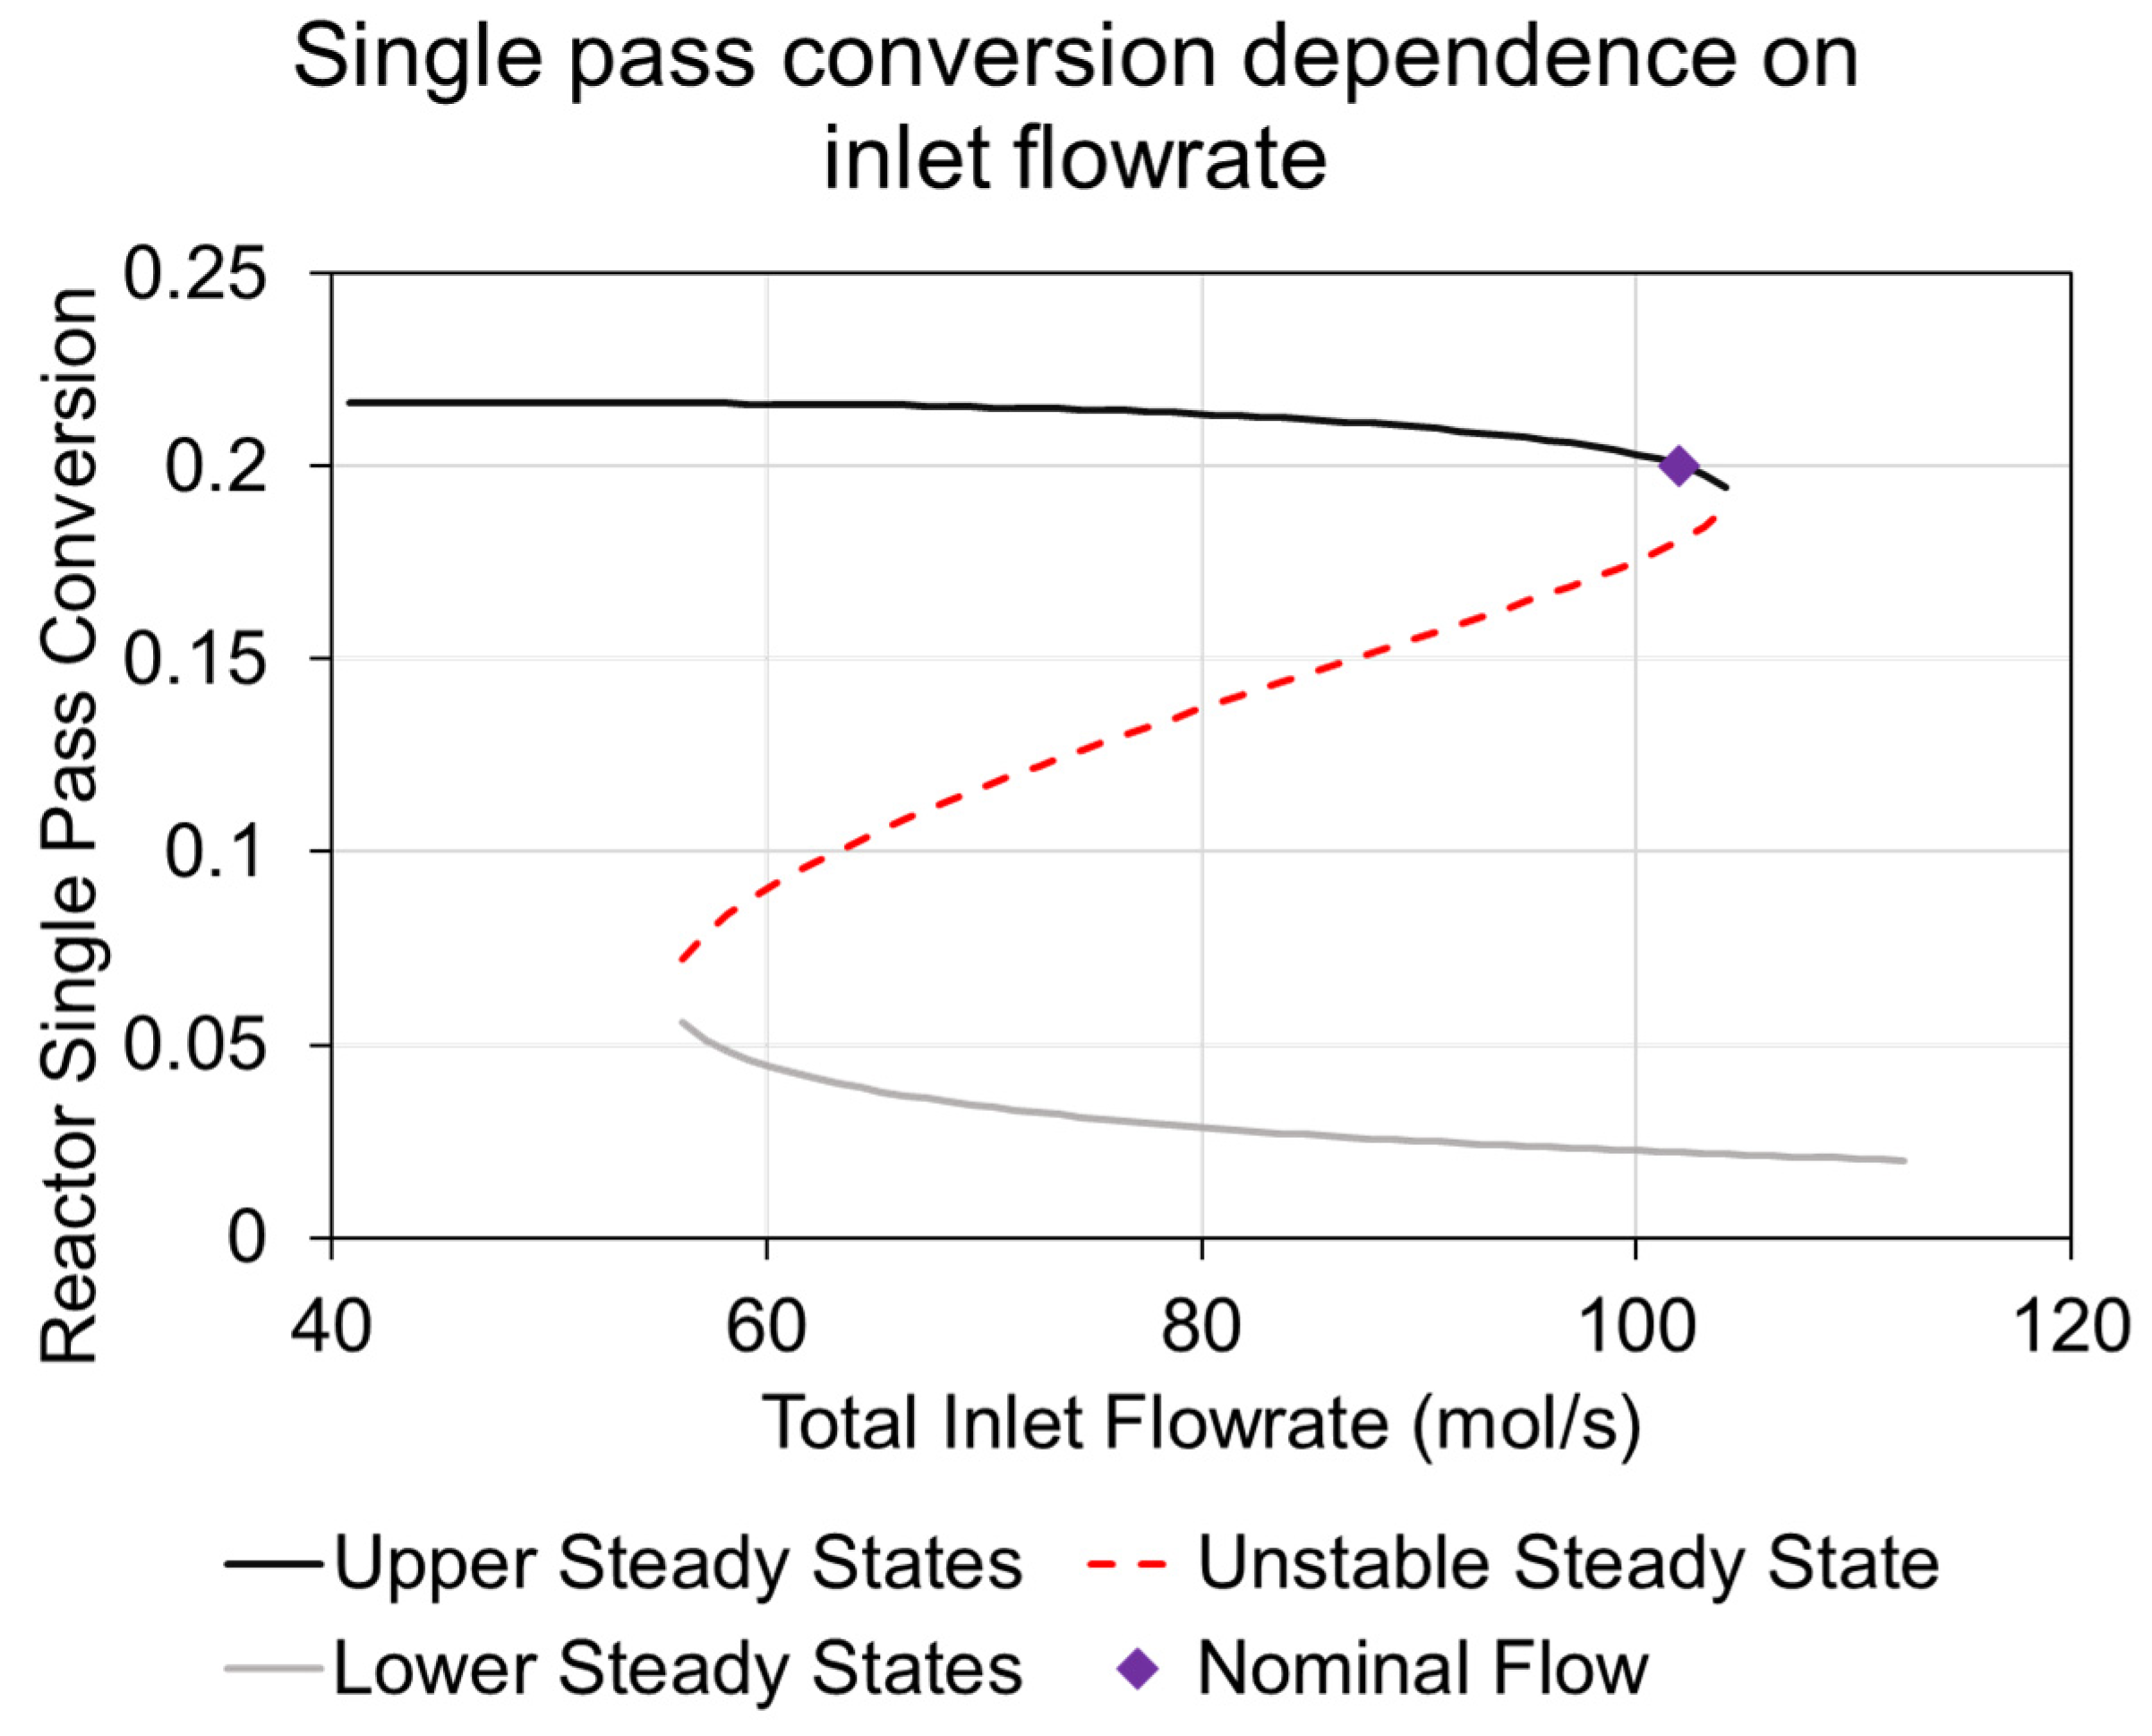
Figure 4 shows the dependence of conversion in the reactor on the inlet flow rate to the reactor, using the method by Iqbal Cheema et al. [3] for this autothermal reactor set-up. Firstly, the operating line of the beds was found by solving the ordinary differential Equations (2) and (3) at a given inlet T while flowrate is held constant. This will solve for the temperature at the reactor outlet at a given temperature at the inlet. Secondly, operating lines of the heat exchanger is obtained by using the effectiveness equation from Iqbal [3]. Then, one can find where the operating lines intersect, and each intersection represents one steady state. The upper and lower ones are considered stable. This process is repeated with different flowrates until a graph like Figure 4 is made where all the steady states are plotted at a range of flowrates.
When the flow rates are higher than the nominal design flow rate, there is not enough catalyst available to achieve high conversions. As a result, less heat is generated in the reactor, which results in a further decrease in conversion because there is not enough heat available to sustain the reaction. Thus, Figure 4 shows that the system drops to a lower steady state where conversion is very low and considered not viable for production. This means that it would not be possible to ramp-up production when there is excess wind power beyond the nominal operating point. The reactor is quite flexible for inlet flow rates below the nominal point. The system can remain at an upper steady state without causing a shutdown.
The lower production bound is then limited by other components in the P2A process. According to Nel, the M2000 PEM electrolysis systems can operate down to 10% of their maximum production capacity [52]. The lower operating bound of the compressors is usually limited by the surge boundary which is the minimum operable flow for a compressor. This depends on parameters such as the type of compressor, the shape of the impeller, the impeller speed, etc. [53]. This boundary is usually located 45 to 65% of the nominal flow rate, but this could also be varied by using variable speed compressors or compressor trains in parallel [53]. In this study, 55% was chosen as the lower production rate.
The ammonia reactor’s cost was analyzed by estimating the cost of two stainless steel process vessels and the catalyst required. The two stainless steel process vessels would hold the two beds. The first vessel would have a bed length of 1.519 m, a vessel radius of around 0.47 m, and a length of 1.719 m. The second vessel would have a bed length of 1.783 m, a vessel radius of around 0.56 m, and a length of 1.98 m. The cost of the vessels was estimated using the costing charts from Ulrich and Vasudevan [40] be around 340,000 CAD and 680,000 CAD each. The catalyst bed’s cost was estimated to be around 1.8 euros per kilogram of catalyst [45] and there was in total about 3700 kg of catalyst within the two beds combined. This would mean that it would cost about 9500 CAD. Summing it all up, the ammonia reactor is expected to cost around 1 million CAD.

3.2.5. Ammonia Separation and Storage

A flash distillation separator unit is used to isolate the ammonia from the remnants of hydrogen and nitrogen. The vessel selected would have a diameter of around 0.5 m and a height of around 2.5 m. This would be made of stainless steel as well to prevent hydrogen cracking. Using the Ulrich and Vasudevan costing charts [40], and the dimensions above, the cost of the ammonia flash distillation vessel was estimated to be around 166,400 CAD.
Regarding storage, the ammonia will be stored in five different carbon-steel vessels to have a one-week holdup time at a pressure of 14 bar and a temperature of 30 °C. This would result in a total volume required of around 175 m3 of ammonia to hold 105 tonnes of ammonia. The diameter of these storage units would be 3 m and the length would be around 8 m. The splitting into five different storage units was done with respect to Canadian ammonia safety laws [54] which state that each tank must hold less than 25,000 gallon capacity. Each storage tank was estimated to cost around 400,000 CAD using the Ulrich and Vasudevan costing charts [40].

3.2.6. Other Miscellaneous Items

Some other costs not mentioned in the previous sections include three heat exchangers in the process, and the water pumps [55] before the RO system and a water tank [56] that holds processed water. This is due to the relatively small amount of CAPEX they contribute. The costs of the heat exchangers were obtained using the Ulrich and Vasudevan methods [40] while the others used vendors. The heat exchangers were estimated to cost around 130,000 CAD. For safety factors the estimate was increased to 150,000 CAD. The water pumps and water tank was estimated to be around 4000 CAD. The costs of these items are summarized below in Table 3:

3.3. System Operation Strategy

To mitigate the impact of low wind speeds and to avoid constant process shutdowns, a few solutions were considered: Adding a large buffer to store the feed (i.e., hydrogen and nitrogen) to the ammonia reactor, adding a large battery to store energy as a back-up power source, using the grid as back-up power source.
The required hydrogen for a 24 h operation (i.e., 15 tonnes ammonia per day) is 2736 kg. If the hydrogen is stored at 80 bar which is relatively close to the required hydrogen pressure for the Haber-Bosch and 30 °C, a 427 m3 storage tank is required for a 24 hold up, which would be the single largest process unit in this design. Additional safety measures are needed to be considered with storing bulk amounts of pressurized hydrogen. Moreover, there are significant efficiency losses in pressurizing hydrogen to low enough volumes, especially when storing to very high pressures like 700 bar which is the usual storage pressure [5]. Iqbal Cheema [3] claims that storing reactant in bulk for over a day can be up to 3 times more expensive than storing ammonia. Therefore, storing large quantities of buffer reactants is not considered in our design although there is a small amount of hydrogen storage in the design before the ammonia synthesis.
Meanwhile, if the P2A system is backed up with batteries, it would occupy even larger space than pressurized hydrogen because batteries have lower volumetric energy density. In the P2A system, it was approximated that 6.5 MW of power are needed which is detailed in Section 3.4. Thus, a 5 h back-up system will need batteries with a capacity of 32.5 MWh. That is comparable to some of the largest grid battery systems such as the Deltro Energy Battery Energy Storage System (BESS) in Ontario which has a capacity of 53 MWh [57]. The investment required for such a BESS would be significant.
In addition, the energy storage, either the buffer feedstock or batteries in the P2A system requires additional wind turbines beyond those required for the nominal operation. As wind turbines are the biggest capital expense in the P2A system, additional wind turbines would make the system less economically feasible. Based on the wind data, a single wind turbine produces an average of 0.80 MW, 40% of the rated capacity. This means that at least than nine turbines are required to produce enough reactants to have an average production of 15 tonnes ammonia per day (total power consumption of the P2A system is 6.48 MW), and the storage capacity would need to be at least 50 h produced to overcome the long periods of time with low wind speeds, resulting in significant CAPEX investment. Therefore, using the electrical grid as a back-up power source when the wind power generation is low is a more economically viable solution. Hence, the P2A system in this paper considers a solution using an offshore wind farm as the main power with the grid as a back-up. Note that a small buffer would still be necessary for the dynamic transitions between production rates, but it was not considered in-depth in this paper.

3.4. Energy Consumption

The energy consumption per unit mass of ammonia produced in the system was assumed to be constant for each piece of equipment at a given basis of 15 tonnes of ammonia per day (for Scenario 2, the energy consumption proportions remained the same but were scaled down). It was assumed that the process always operates near steady-state, and that the dynamics can be ignored. The energy consumption for components such as compressors was determined from Aspen Plus simulations. Vendors and journal articles provide nominal energy data for components such as electrolysers [52] and reverse osmosis [36]. For example, the power consumption of the electrolyser was determined using the number of 4.5 kWh/Nm3 of hydrogen produced from the vendor [33]. This number was then multiplied by how much hydrogen is used per tonne of ammonia. Rouwenhorst et al. [45] provide energy consumption data for PSA systems in their Supplementary Information. Gordonnat and Hunt [58] provide a rough estimate of 3% power losses per 1000 km for undersea cables. The total energy consumption was estimated to be around 37.4 GJ per metric ton of ammonia for plant which is comparable to Morgan’s value of 41.76 GJ per metric ton of ammonia [59]. Table 4 below shows the energy consumption for each of the ammonia plant’s components.

3.5. Methodology for Economic Calculations

3.5.1. Cost Estimation

The capital expenditures (CAPEX) and operational expenditures (OPEX) were based upon three methods of retrieving costs: The Ulrich–Vasudevan method [40], scientific journal articles, and vendors. These were based on the reactor sizes that were calculated by specifying the system as performed in the previous sections. The results are meant to provide approximate estimates, but it must be considered that it is often difficult to get the costs to a very high accuracy as there are many variations and difficulties in pricing of design [40]. This is often due to confidentiality and the fact that there are often no duplicates of the same design. This paper used a Chemical Engineering Plant Cost Index of 677.1 from April 2021 [60]. The conversion factor from USD to CAD was assumed to be 1.28. The conversion factor from euros to CAD was taken to be 1.42.
The analysis to get the capital costs for each of the equipment is described in Section 3.1 and Section 3.2. The ammonia plant capital costs were then multiplied by 18% for contingency and fee, 30% for the greenfield fee, and 15% for the additional working capital required to complete the project. The windfarm’s contingencies were assumed to be already added into the windfarm capital costs as the NREL has included it into their calculations already for their windfarm cost [30]. The contingency and fee are added to the ammonia plant to consider the installation costs and permits. The greenfield fee is the consideration of the cost of starting up a building in a new location. The components that make up the CAPEX are summarized in Table 5 below. These would be the same in both Scenarios 1 and 2.
The OPEX was determined by summing up the wind farm’s operational costs, the ammonia plant’s operational cost, and the cost of grid used. This paper assumes that both scenarios had the same OPEX for the windfarm and the ammonia plant’s operational cost.
The wind farm’s operational cost was retrieved by using an estimate from the NREL [30] that stated that the OPEX was 158.72 CAD/kW/year. This resulted that the wind farm would have an operational cost of approximately 1.6 million CAD per year.
The ammonia plant’s cost was retrieved by taking 10% of the subtotal of the CAPEX of the ammonia plant. 6% is accounted for maintenance, taxes, rent, and environmental fees, while the other 4% is allocated for the supervision and labour. This means that approximately 1.6 million CAD OPEX per year is required for the ammonia plant.
The grid cost was calculated by multiplying the averaged Nova Scotian grid electricity cost of 0.156 CAD/kWh [61] by the total energy that was used in both scenarios 1 and 2 which are further described in Section 4.2.

3.5.2. Levelized Cost

To analyze the economics of the design, a levelized costing formula to determine the levelized cost of energy from the United States Department of Energy was used [62]. However, in this paper, instead of energy, the mass of ammonia produced was analyzed. This resulted in an equation for the LCOA as:
L C O A = t = 0 n C t ( 1 + r ) t t = 0 n A t ( 1 + r ) t
In the equation, n is the service life of the system, [year], Ct is the expenditures in year t, [$], r is the discount rate, [dimensionless], assumed to be 5.29%, which was the discount rate used by the NREL for an offshore wind project [30], At is the mass of ammonia produced in year t, [tonnes], and t is the number of years since the initialization of the system [years]. The discount rate used was assumed to be valid for the green ammonia plant as well.
The capital expenditures were all taken to be invested at year 0. The assumed service life of the system was 25 years. This is around the average expected lifespan of a wind turbine [63]. The operating costs were added to each year starting at year 1 to year 25. The revenue from excess wind was added as a revenue (or as a ‘negative cost’) each year, sold at the average price of Nova Scotia’s grid electricity.

4. Results and Discussions

4.1. Wind Power Generation

Figure 5 shows the historic wind speed data and the corresponding power generated for a selected time interval of around 100 h for the four turbines. The entire set of data can be found in the Supplementary Information. Even for an offshore location with high wind power potential, like Sable Island, the variable wind speed leads to unstable power outputs. For example, there are long periods of time, up to 50 h, where barely any wind power is produced. In Figure 5 there is an example of this between 30 and 70 h where there was barely any wind energy produced.

4.2. Grid Connection Scenarios

As the wind power output varies significantly, two grid-connection scenarios were studied to minimize the system shutdowns. The P2A system size (summarized previously in the methodology) is fixed for both scenarios. In Scenario 1, the ammonia production is held constant at the nominal value, while in Scenario 2, the production rate switches between the nominal rate and a fixed lower production rate when wind power is low. The lower production rate is set to be the minimal production rate to maintain auto-thermal operation of the ammonia production (i.e., 55% of the nominal production rate as shown in Section 3.2.4) whenever the wind power generation was below 60% of the nominal power required. Scenario 2 aims to maximize wind power utilization and reduce the emissions and costs associated with the grid electricity consumption, while maintaining the operation within operating limits and avoiding system shutdowns. In addition, it was assumed that any excess wind power could be sold at the average grid electricity price. About 1580 MWh of wind each year was sold to the grid in both scenarios. This is small relative to the 28,032 MWh of wind energy that is used to produce ammonia.
Figure 6 shows the grid power consumption for both scenarios at the same time interval shown in Figure 5. There is around a 57.6% reduction in the grid power usage when the system switches between operating modes. Table 6 shows a comparison of the power consumption between the two production scenarios. Scenario 2 significantly decreases the average share of total power required from the grid but leads to a decrease in the average production rate which is concerning from an economical perspective. This is because Scenario 2 would then have a higher calculated LCOA as shown in Table 6 (later described in Section 4.4.3).

4.3. Emissions

In this paper we only considered the operational GHG emissions during ammonia production. The emissions of the process will depend on the grid mix when the electrical grid is used as the backup power for the P2A system. This is because the electricity grid that is used to backup the power for the electrolysis may be produced using fossil fuels which would indirectly produce GHG emissions. The GHG emissions for the P2A system were analyzed using grid intensity factors in Nova Scotia and compare with those from conventional ammonia plants. The grid’s carbon intensity is 680 g of CO2-eq/kWh for the province of Nova Scotia [64]. The results in Figure 7 showed that the GHG emissions was around 3.56 kg of CO2-eq per 1 kg of ammonia for Scenario 1. This is significantly higher than the conventional ammonia plant in Canada which has a carbon dioxide emission rate of around 1.07 kg of CO2-eq per 1 kg of ammonia [65]. This is also higher than the global conventional ammonia plant emissions which is around 2.14 kg of CO2-eq per 1 kg of ammonia [65]. On the other hand, Scenario 2 have an emission of around 2.13 kg of CO2-eq per kg of ammonia which is slightly less than global conventional production.
To reach the level where the GHG emissions from the P2A system in Scenario 1 is equal to the conventional Canadian production, the grid’s carbon intensity must be reduced by 70% from Nova Scotia’s average value. Yet, in Scenario 2, the grid’s carbon intensity needs to be reduced by around 50% to reach the same conventional Canadian ammonia production levels. This means that it is important to consider the carbon intensity of the electricity for a grid connected P2A process. Lower the emissions of the electricity grid or having a reliable form of energy storage for intermittent renewables are critical for low-carbon P2A production.

4.4. Economics

The economics was analyzed with the concept of levelized costing using Equation (8) as prescribed in the methodology

4.4.1. Capital Costs

The total CAPEX of the P2A system would be around 72 million CAD including the contingencies, and the percentage breakdown is shown in Figure 8 and summarized in Table 5. The offshore wind farm covers the most, i.e., 64.5%, of the total capital cost at about 46.5 million CAD. The largest contributions to the cost of the ammonia plant are the electrolyser and multi-stage compressors which would cost about 7.2 million and 4.2 million, respectively, before the additional contingencies.

4.4.2. Operational Costs

The OPEX for the P2A system changes for each scenario. The OPEX would be around 7.7 million CAD and 5.1 million CAD per year for Scenario 1 and 2, respectively. The difference between the two scenarios is the amount of grid energy that they each use. Scenario 2 has a 58% lower grid energy usage which results in a much lower OPEX per year. Figure 9 summarizes the OPEX results for each scenario. It shows that the ammonia plant and windfarm OPEX are estimated to be the same for both scenarios, but the grid electricity makes a big difference for the operational conditions.

4.4.3. Levelized Cost of Ammonia

The LCOA was determined to be around 2323 CAD/tonne for Scenario 1 and 2613 CAD/tonne for Scenario 2. This is significantly larger than the decade-average price of ammonia which is around 426–500 CAD/tonne [20]. This paper’s specific design does not result in price competitive ammonia. However, adjustments to the design and costs of the design could make it more price competitive. Scaling up may provide reductions in the LCOA. This is due to economies of scale which lowers production rate costs as more is ammonia is produced [42].
The price distribution across its lifetime can be shown Figure 10.
The total lifetime costs for Scenario 1 would be around 177 million CAD while Scenario 2 would be around 142 million CAD. However, the LCOA is larger for Scenario 2 because of the reduced ammonia production or lower capacity factor relative to Scenario 1.
The levelized cost also considered the amount of excess wind sold back to the grid. However, the value was very small as it averaged to be around 231,000 CAD a year. The total net lifetime costs would be around 174 million and 138 million if one were to consider the excess wind sold back to the grid.
For Scenario 1, it is shown that the OPEX take up about 59% of total lifetime costs while the other 41% is taken up by the CAPEX. It is also shown that Scenario 1 has about 35% of the lifetime costs going to paying the electrical grid. The use of the electricity grid takes up the largest portion of the lifetime costs. For Scenario 2, the OPEX and CAPEX contribute to 49% and 51% of the total lifetime costs, respectively. Instead of the use of the electricity grid, the windfarm takes up most of the lifetime costs. This is because of the reduced grid usage.
A sensitivity analyses was also conducted by seeing how increasing and decreasing certain parameters by 20% would change the LCOA. The parameters chosen were service life, discount rate, windfarm cost, ammonia plant cost, and the cost of electricity from the grid. Figure 11 shows bar graphs on how each parameter’s change affects the LCOA.
Figure 11 displays that changes in the cost of the windfarm cost would result in the largest difference in the LCOA. By decreasing the windfarm cost by 20%, the LCOA can decrease by around 8–10%. Another major consideration for LCOA reductions would be to increase service life of the design from 25 years to 30 years. This would result in a 7–10% lower LCOA. Lastly, Scenario 2 seems to be more sensitive to the changes than Scenario 1 except for the sensitivity regarding the grid cost of electricity. A change in the grid cost of electricity would pose smaller changes in Scenario 2.

5. Conclusions and Recommendations

This paper designed and analyzed a conceptual P2A system powered by a small-scale wind turbine system off the coast of Nova Scotia with grid integration. We compared the operational GHG emissions and LCOA for two different grid connection scenarios for the P2A system.
To use intermittent renewables such as wind or solar power, it is critical to consider the reliable outputs of the P2A system by using energy storage or connecting the electrical grid. However, it is found that using the carbon-intense grid in provinces like Nova Scotia, even if it is just a back-up during low wind power generation, has very significant emissions, often larger than the traditional methods to synthesize ammonia. Therefore, reducing the grid’s carbon intensities by switching to stable low-carbon energy sources such as nuclear and hydro is recommended to reduce GHG emissions in the P2A process.
It was found that the P2A system in this study provides a LCOA of approximately 2323 CAD/tonne for Scenario 1 and 2613 CAD/tonne for Scenario 2. Both are significantly higher than the decade-average price of ammonia of around 426–500 CAD per tonne. The biggest effect on the LCOA was the price of the windfarm. However, scaling up the process may also provide benefits to the costs due to economies of scale. With the development and maturing of technologies, such as electrolysers and offshore wind, increasing the service life, and reducing the reliance on the electricity grid, the P2A cost may come down in the future.
For future studies, power generation technologies different from wind should be considered and or combined with it. Other low emission technologies such as nuclear and hydro could be potential solutions to producing clean ammonia. Furthermore, for future modelling of this system, considering a full dynamic model of the process that can capture the full dynamic effect of changing between operating modes would be beneficial. In addition to the dynamic modelling, a reactor design that considers heat losses within the modelling would be required for a real-life design. This would all be beneficial for the design of controllers and equipment that would be required in a final design. To add on, in this paper, it was not considered what would happen to the ammonia once it reached mainland. Future studies should consider how this type of system will connect to the supply chain and if additional transportation methods are needed. There should also be greater research on the costs of floating wind and offshore ammonia plant platforms. Lastly, the safety implications of having large quantities of ammonia as energy storage should be addressed in a country’s standards and policy as ammonia production accelerates. Although wind power is not a reliable power source for this system, the process still has significant potential to become a viable method to produce ammonia if other energy sources are used and design adjustments are made that significantly reduce the costs.

Supplementary Materials

The following supporting information can be downloaded at: https://www.mdpi.com/article/10.3390/en15249558/s1.

Author Contributions

Conceptualization, C.J.C., C.A.E.C., M.Y., M.F. and X.-Y.W.; methodology, C.J.C., C.A.E.C. and M.Y.; formal analysis, C.J.C., C.A.E.C. and M.Y. investigation, C.J.C., C.A.E.C. and M.Y.; writing—original draft preparation, C.J.C., C.A.E.C. and M.Y. writing—review and editing, C.J.C., C.A.E.C., M.Y., M.F. and X.-Y.W.; supervision, M.F. and X.-Y.W.; funding acquisition, M.F. and X.-Y.W. All authors have read and agreed to the published version of the manuscript.

Funding

This work was supported by the Departments of Mechanical and Mechatronics Engineering and Chemical Engineering at the University of Waterloo. We acknowledge the support of the Natural Sciences and Engineering Research Council of Canada (NSERC), [funding reference number RGPIN-2021-02453 and RGPIN-2020-04149], and the Waterloo Interdisciplinary Trailblazer Fund (90578). M.F. was supported by the Canada Research Chair Tier I—Zero-Emission Vehicles and Hydrogen Energy Systems, Grant number 950-232215. C.J.C. was supported by the Deans Entrance Award of the Faculty of Engineering.

Data Availability Statement

The data presented in this study are available in the article and the Supplementary Material.

Acknowledgments

Special thanks to the Chemical Engineering department at the University of Waterloo and the capstone course instructors Jason Grove and Lena Ahmadi for helping in the early stages of this project.

Conflicts of Interest

The authors declare no conflict of interest.

Nomenclature

VariableDescription
C ^ p , i Specific heat capacity, J mol−1 K−1
E a Activation energy, J mol−1
f i Fugacity, atm
F i Molar flow rate, mol s−1
K f Fugacity equilibrium constant, atm−1
k 0 Arrhenius pre-exponential factor, atm0.5 s−1
k T Reaction rate constant, atm0.5 s−1
m c a t Catalyst mass, kg
P Pressure, bar or atm
r N H 3 Catalyst mass-based rate of reaction, mol s−1 kg−1
T Temperature, °C or K
V Reactor Volume, m3
y i Mole fraction in the gas phase
Δ H R ( T ) Heat of reaction, J mol−1

References

  1. Ghavam, S.; Vahdati, M.; Wilson, I.A.G.; Styring, P. Sustainable Ammonia Production Processes. Front. Energy Res. 2021, 9, 580808. [Google Scholar] [CrossRef]
  2. Ammonia: Zero-Carbon Fertiliser, Fuel and Energy Store; Royal Society: London, UK, 2020; ISBN 978-1-78252-448-9.
  3. Iqbal Cheema, I.; Krewer, U. Operating envelope of Haber–Bosch process design for power-to-ammonia. RSC Adv. 2018, 8, 34926–34936. [Google Scholar] [CrossRef] [Green Version]
  4. Humphreys, J.; Lan, R.; Tao, S. Development and Recent Progress on Ammonia Synthesis Catalysts for Haber–Bosch Process. Adv. Energy Sustain. Res. 2021, 2, 2000043. [Google Scholar] [CrossRef]
  5. Smith, C.; Hill, A.K.; Torrente-Murciano, L. Current and future role of Haber–Bosch ammonia in a carbon-free energy landscape. Energy Environ. Sci. 2020, 13, 331–344. [Google Scholar] [CrossRef]
  6. Yüzbaşıoğlu, A.E.; Tatarhan, A.H.; Gezerman, A.O. Decarbonization in ammonia production, new technological methods in industrial scale ammonia production and critical evaluations. Heliyon 2021, 7, e08257. [Google Scholar] [CrossRef]
  7. EverWind Secures Offtake from Key German Partner|Uniper. Available online: https://www.uniper.energy/news/everwind-secures-offtake-from-key-german-partner-uniper-for-canadas-first-green-hydrogen-hub-in-nova-scotia (accessed on 15 November 2022).
  8. Lan, R.; Tao, S. Ammonia as a Suitable Fuel for Fuel Cells. Front. Energy Res. 2014, 2, 35. [Google Scholar] [CrossRef] [Green Version]
  9. Salmon, N.; Bañares-Alcántara, R. Green ammonia as a spatial energy vector: A review. Sustain. Energy Fuels 2021, 5, 2814–2839. [Google Scholar] [CrossRef]
  10. Cunanan, C.; Tran, M.-K.; Lee, Y.; Kwok, S.; Leung, V.; Fowler, M. A Review of Heavy-Duty Vehicle Powertrain Technologies: Diesel Engine Vehicles, Battery Electric Vehicles, and Hydrogen Fuel Cell Electric Vehicles. Clean Technol. 2021, 3, 474–489. [Google Scholar] [CrossRef]
  11. Kakoulaki, G.; Kougias, I.; Taylor, N.; Dolci, F.; Moya, J.; Jäger-Waldau, A. Green hydrogen in Europe—A regional assessment: Substituting existing production with electrolysis powered by renewables. Energy Convers. Manag. 2021, 228, 113649. [Google Scholar] [CrossRef]
  12. Jain, M.; Muthalathu, R.; Wu, X.-Y. Electrified ammonia production as a commodity and energy storage medium to connect the food, energy, and trade sectors. iScience 2022, 25, 104724. [Google Scholar] [CrossRef]
  13. Dong, C.; Huang, G.; Cheng, G. Offshore wind can power Canada. Energy 2021, 236, 121422. [Google Scholar] [CrossRef]
  14. Canada, N.R. Offshore Renewable Energy Regulations Initiative. Available online: https://www.nrcan.gc.ca/transparency/acts-and-regulations/forward-regulatory-plan/offshore-renewable-energy-regulations-initiative/23042 (accessed on 14 September 2022).
  15. Wang, H.; Daoutidis, P.; Zhang, Q. Harnessing the Wind Power of the Ocean with Green Offshore Ammonia. ACS Sustain. Chem. Eng. 2021, 9, 14605–14617. [Google Scholar] [CrossRef]
  16. Morgan, E.R.; Manwell, J.F.; McGowan, J.G. Sustainable Ammonia Production from U.S. Offshore Wind Farms: A Techno-Economic Review. ACS Sustain. Chem. Eng. 2017, 5, 9554–9567. [Google Scholar] [CrossRef]
  17. Salmon, N.; Bañares-Alcántara, R. A global, spatially granular techno-economic analysis of offshore green ammonia production. J. Clean. Prod. 2022, 367, 133045. [Google Scholar] [CrossRef]
  18. Lu, H.; Lin, B.-L.; Campbell, D.E.; Wang, Y.; Duan, W.; Han, T.; Wang, J.; Ren, H. Australia-Japan telecoupling of wind power-based green ammonia for passenger transportation: Efficiency, impacts, and sustainability. Renew. Sustain. Energy Rev. 2022, 168, 112884. [Google Scholar] [CrossRef]
  19. Verleysen, K.; Coppitters, D.; Parente, A.; De Paepe, W.; Contino, F. How can power-to-ammonia be robust? Optimization of an ammonia synthesis plant powered by a wind turbine considering operational uncertainties. Fuel 2020, 266, 117049. [Google Scholar] [CrossRef]
  20. Fasihi, M.; Weiss, R.; Savolainen, J.; Breyer, C. Global potential of green ammonia based on hybrid PV-wind power plants. Appl. Energy 2021, 294, 116170. [Google Scholar] [CrossRef]
  21. Pawar, N.D.; Heinrichs, H.U.; Winkler, C.; Heuser, P.-M.; Ryberg, S.D.; Robinius, M.; Stolten, D. Potential of green ammonia production in India. Int. J. Hydrogen Energy 2021, 46, 27247–27267. [Google Scholar] [CrossRef]
  22. Ozturk, M.; Dincer, I. An integrated system for ammonia production from renewable hydrogen: A case study. Int. J. Hydrogen Energy 2021, 46, 5918–5925. [Google Scholar] [CrossRef]
  23. Armijo, J.; Philibert, C. Flexible production of green hydrogen and ammonia from variable solar and wind energy: Case study of Chile and Argentina. Int. J. Hydrogen Energy 2020, 45, 1541–1558. [Google Scholar] [CrossRef]
  24. Palys, M.J.; Wang, H.; Zhang, Q.; Daoutidis, P. Renewable ammonia for sustainable energy and agriculture: Vision and systems engineering opportunities. Curr. Opin. Chem. Eng. 2021, 31, 100667. [Google Scholar] [CrossRef]
  25. Zhang, H.; Wang, L.; Van herle, J.; Maréchal, F.; Desideri, U. Techno-economic comparison of green ammonia production processes. Appl. Energy 2020, 259, 114135. [Google Scholar] [CrossRef]
  26. Ausfelder, F.; van de Beek, F.; Bhardwaj, R.; Graf, F.; Meinke-Hubeny, F.; Lodewijks, P.; Müller, S.A.; Rijkers, M.; Perez Sanchez, D.; Ruf, J. Infrastructure Challenges Caused by Industrial Transformation to Achieve Greenhouse Gas Neutrality. Ammonia Production in the Antwerp-Rotterdam-Rhine-Ruhr Area. Chem. Ing. Tech. 2021, 93, 373–389. [Google Scholar] [CrossRef]
  27. Khademi, M.H.; Lotfi-Varnoosfaderani, M. Sustainable ammonia production from steam reforming of biomass-derived glycerol in a heat-integrated intensified process: Modeling and feasibility study. J. Clean. Prod. 2021, 324, 129241. [Google Scholar] [CrossRef]
  28. Chisalita, D.-A.; Petrescu, L.; Cormos, C.-C. Environmental evaluation of european ammonia production considering various hydrogen supply chains. Renew. Sustain. Energy Rev. 2020, 130, 109964. [Google Scholar] [CrossRef]
  29. Hourly Data Report for 2020—Climate—Environment and Climate Change Canada. Available online: https://climate.weather.gc.ca/climate_data/hourly_data_e.html?hlyRange=2017-10-29%7C2022-03-15&dlyRange=2017-10-29%7C2022-03-15&mlyRange=%7C&StationID=54639&Prov=NS&urlExtension=_e.html&searchType=stnName&optLimit=yearRange&StartYear=1840&EndYear=2022&selRowPerPage=25&Line=2&searchMethod=contains&Month=1&Day=1&txtStationName=sable+island&timeframe=1&Year=2021 (accessed on 16 March 2022).
  30. Stehly, T.; Beiter, P.; Duffy, P. 2019 Cost of Wind Energy Review. National Renewable Energy Laboratory. 2020. Available online: https://www.nrel.gov/docs/fy21osti/78471.pdf (accessed on 6 February 2022).
  31. Data Show Big Gains for Offshore Wind. Available online: https://www.nrel.gov/news/program/2020/2019-offshore-wind-data.html (accessed on 14 September 2022).
  32. JSW J82—Manufacturers and turbines—Online access—The Wind Power. Available online: https://www.thewindpower.net/turbine_en_678_jsw_j82.php (accessed on 7 April 2022).
  33. PEM Electrolyser. Available online: https://nelhydrogen.com/product/m-series-3/ (accessed on 14 December 2021).
  34. Green Hydrogen Cost Reduction: Scaling Up Electrolysers to Meet the 1.5C Climate Goal; International Renewable Energy Agency: Abu Dhabi, United Arab Emirates, 2020; p. 106.
  35. SWRO-7GPM-10KGPD-45KTDS-CNT Containerized Seawater Reverse Osmosis Desalination System, 10085 GPD/38 M3/day. Available online: https://www.ForeverPurePlace.com/product-p/swro-7gpm-10kgpd-45ktds-cnt.htm (accessed on 14 December 2021).
  36. Bartels, C.R.; Andes, K. Consideration of energy savings in SWRO. Desalination Water Treat. 2013, 51, 717–725. [Google Scholar] [CrossRef]
  37. 10,000 GPD (6.9gpm) Commercial Reverse Osmosis Water System. Available online: https://www.raindanceh2ostore.com/store/p401/10000GPD_Commercial_Reverse_Osmosis_System.html (accessed on 12 April 2022).
  38. EPRO Industrial|Commercial Reverse Osmosis System 10,000 GPD EPRO 10,000. Available online: https://www.cleanwaterstore.com/epro-industrial/commercial-reverse-osmosis-system-10000-gpd-epro-10000.html (accessed on 12 April 2022).
  39. Industrial Reverse Osmosis System 10,000 gpd. Available online: https://www.filterwater.com/p-441-industrial-reverse-osmosis-system-10000-gpd.aspx (accessed on 12 April 2022).
  40. Ulrich, G.D.; Vasudevan, P.T. Chemical Engineering Process Design and Economics: A Practical Guide, 2nd ed.; Process Publishing: Durham, UK, 2004; ISBN 0-9708768-2-3. [Google Scholar]
  41. Ivanova, S.; Lewis, R. Producing Nitrogen via Pressure Swing Adsorption. Chem. Eng. Prog. 2012, 108, 38–42. [Google Scholar]
  42. Sánchez, A.; Martín, M. Scale up and scale down issues of renewable ammonia plants: Towards modular design. Sustain. Prod. Consum. 2018, 16, 176–192. [Google Scholar] [CrossRef]
  43. Towler, G.P.; Sinnott, R.K. Chemical Engineering Design: Principles, Practice, and Economics of Plant and Process Design, 2nd ed.; Butterworth-Heinemann: Boston, MA, USA, 2013; ISBN 978-0-08-096659-5. [Google Scholar]
  44. Brown, D.E.; Edmonds, T.; Joyner, R.W.; McCarroll, J.J.; Tennison, S.R. The Genesis and Development of the Commercial BP Doubly Promoted Catalyst for Ammonia Synthesis. Catal. Lett. 2014, 144, 545–552. [Google Scholar] [CrossRef]
  45. Rouwenhorst, K.H.R.; Van der Ham, A.G.J.; Lefferts, L. Beyond Haber-Bosch: The renaissance of the Claude process. Int. J. Hydrogen Energy 2021, 46, 21566–21579. [Google Scholar] [CrossRef]
  46. Liu, H. Ammonia Synthesis Catalysts: Innovation and Practice; Chemical Industry Press: Beijing, China; World Scientific: Hackensack, NJ, USA, 2013; ISBN 978-981-4355-77-3. [Google Scholar]
  47. Panahandeh, M.R.; Fathikaljahi, J.; Taheri, M. Steady-State Modeling and Simulation of an Axial-Radial Ammonia Synthesis Reactor. Chem. Eng. Technol. 2003, 26, 666–671. [Google Scholar] [CrossRef]
  48. Lloyd, L. Ammonia and Methanol Synthesis. In Handbook of Industrial Catalysts; Fundamental and Applied Catalysis; Springer US: Boston, MA, USA, 2011; pp. 397–437. ISBN 978-0-387-24682-6. [Google Scholar]
  49. Dashti, A.; Khorsand, K.; Marvast, M.A.; Kakavand, M. Modeling and Simulation of Ammonia Synthesis Reactor. Pet. Coal 2006, 48, 15–23. [Google Scholar]
  50. Dyson, D.C.; Simon, J.M. Kinetic Expression with Diffusion Correction for Ammonia Synthesis on Industrial Catalyst. Ind. Eng. Chem. Fund. 1968, 7, 605–610. [Google Scholar] [CrossRef]
  51. Gillespie, L.J.; Beattie, J.A. The Thermodynamic Treatment of Chemical Equilibria in Systems Composed of Real Gases. I. An Approximate Equation for the Mass Action Function Applied to the Existing Data on the Haber Equilibrium. Phys. Rev. 1930, 36, 743–753. [Google Scholar] [CrossRef]
  52. Containerized PEM Electrolyser. Available online: https://nelhydrogen.com/product/m-series-containerized/ (accessed on 23 November 2021).
  53. Lüdtke, K.H. Process Centrifugal Compressors; Springer: Berlin/Heidelberg, Gemany, 2004; ISBN 978-3-642-07330-4. [Google Scholar]
  54. Railway Safety Act: Anhydrous Ammonia Bulk Storage Regulations; Canada; 2015; p. 9. Available online: https://laws-lois.justice.gc.ca/eng/regulations/C.R.C.,_c._1146/ (accessed on 13 December 2021).
  55. Flojet Versijet High Pressure Pump, 12V, 6GPM, 50 psi—AERO Specialties. Available online: https://www.aerospecialties.com/aviation-ground-support-equipment-gse-products/parts-spares-and-supplies/potable-water-carts-parts-spares-and-supplies/pumpsengines-potable-water-carts-parts-spares-and-supplies/flojet-pump-50psi/ (accessed on 14 December 2021).
  56. 2000 Gallon Vertical Liquid Storage Tank 2000VT|Tank Depot. Available online: https://www.tank-depot.com/productdetails.aspx?part=CRMI-2000VT (accessed on 12 April 2022).
  57. Battery Energy Storage 6 Sites, 13 MW (53MWh). Available online: https://www.stantec.com/en/projects/canada-projects/b/battery-energy-storage-6-sites (accessed on 8 April 2022).
  58. Gordonnat, J.; Hunt, J. Subsea cable key challenges of an intercontinental power link: Case study of Australia–Singapore interconnector. Energy Transit 2020, 4, 169–188. [Google Scholar] [CrossRef]
  59. Morgan, E.R. Techno-Economic Feasibility Study of Ammonia Plants Powered by Offshore Wind. Ph.D. Thesis, University of Massachusetts Amherst, Amherst, MA, USA. Available online: https://www.proquest.com/docview/1323774328/abstract/F1615FD50DD44C5FPQ/1 (accessed on 1 November 2021).
  60. Plant Cost Index Archives. Chemical Engineering. Available online: https://www.chemengonline.com/site/plant-cost-index/ (accessed on 9 September 2022).
  61. CER—Nova Scotia. Available online: https://www.cer-rec.gc.ca/en/data-analysis/energy-commodities/electricity/report/canadian-residential-electricity-bill/nova-scotia.html (accessed on 2 November 2022).
  62. Levelized Cost of Energy (LCOE). US Department of Energy|Office of Indian Energy. Available online: https://www.energy.gov/sites/prod/files/2015/08/f25/LCOE.pdf (accessed on 10 September 2022).
  63. Pakenham, B.; Ermakova, A.; Mehmanparast, A. A Review of Life Extension Strategies for Offshore Wind Farms Using Techno-Economic Assessments. Energies 2021, 14, 1936. [Google Scholar] [CrossRef]
  64. Emission Factors and Reference Values. 8 June 2022. Available online: https://www.canada.ca/en/environment-climate-change/services/climate-change/pricing-pollution-how-it-will-work/output-based-pricing-system/federal-greenhouse-gas-offset-system/emission-factors-reference-values.html (accessed on 10 September 2022).
  65. Canadian Ammonia Producers Benchmarking Energy Efficiency and Carbon Dioxide Emissions; Natural Resources Canada: Ottawa, ON, Canada, 2008; Available online: https://publications.gc.ca/collections/collection_2009/nrcan/M144-155-2007E.pdf (accessed on 10 April 2022).
Figure 1. Process Flow Diagram for the Power to Ammonia (P2A) Production System.
Energies 15 09558 g001
Figure 2. Schematic diagram of the ammonia synthesis step, depicting the multiple stages and interstage quench stream for cooling.
Energies 15 09558 g002
Figure 3. Temperature and conversion profiles along the reactor beds. The red vertical line shows where the quenching takes place.
Energies 15 09558 g003
Figure 4. Single pass conversion dependence on the reactor inlet flow rate with the upper and lower steady states displayed. The chart also displays the nominal flow.
Energies 15 09558 g004
Figure 5. Wind speed and wind power change with time on the Sable Island in a 100 h duration.
Energies 15 09558 g005
Figure 6. Sample of power usage distribution for Scenario 1 and Scenario 2 during the same 100 h duration in Figure 5.
Energies 15 09558 g006
Figure 7. Greenhouse gas emissions from the P2A system’s two scenarios.
Energies 15 09558 g007
Figure 8. CAPEX distribution for the P2A system.
Energies 15 09558 g008
Figure 9. Annual OPEX of the P2A system for Scenarios 1 and 2.
Energies 15 09558 g009
Figure 10. Lifetime expenditure distribution of the P2A System.
Energies 15 09558 g010
Figure 11. Sensitivity analyses of Scenario 1 and Scenario 2′s LCOAs.
Energies 15 09558 g011
Table 1. Ammonia Synthesis Catalyst parameters.
ItemValueSource
α in kinetic equation0.5Liu et al. [46]
Activation Energy of reverse reaction “E” (kJmol−1)1.59 × 10²
Pre-exponent factor “k0” (MPa0.5s−1)4.973 × 10¹²
Table 2. Summary of Correlations used in Modelling the Synthesis Reactor.
ItemValueSource
C H 2   [ c a l m o l   K ] with T (K) and P(atm) 1.986847 + 4.66 + 0.7 10 3 T      + ( 2 ( 0.1975 ) 1.986847 T 2      + 12 ( 0.0504 10 4 ) T 4 ) P Gillespie et al. [51]
C N 2   [ k J m o l   K ] with T (K) and P(MPa) ( 7.371 0.145 × 10 2 T + 0.144 × 10 5 T 2 + 0.00661 P N 2 0.755 × 10 5 T P N 2 ) × 4.184 Liu et al. [46]
C N H 3   [ k J m o l   K ] with T (K) and P(MPa)If T > 500 K
( 9.330 0.299 10 2 T + 0.876 10 5 T 2 + 0.0945 P N H 3 + 0.119         10 3 T P N H 3 ) 4.184
If T < 500 K
( 56.853 0.2646 T + 0.3565 10 3 T 2 + 0.0988 P N H 3 + 0.117 10 2 P N H 3 2 2.168 10 2 T P N H 3 ) 4.184
Liu et al. [46]
ϕ H 2 e x p { e ( 3.8402 T 0.125 + 0.541 ) P e ( 0.1268 T 0.5 15 , 980 ) P 2 + 300 [ e ( 0.011901 T 5.941 ) ] ( e P / 300 1 ) } Dyson et al. [50]
ϕ N 2 0.93431737 + 0.3101804 × 10 3 T + 0.295896 × 10 3 P 0.2707279 × 10 6 T 2 + 0.4775207 × 10 6 P 2 Dyson et al. [50]
ϕ N H 3 0.1438996 + 0.2028538 × 10 2 T 0.4487672 × 10 3 P 0.1142945 × 10 5 T 2 + 0.2761216 × 10 6 P 2 Dyson et al. [50]
Δ H R ( T )   [ kcal kgmol NH 3 ] P [ 0.5426 + 840.609 / T + 4.5973 × 10 8 / T 3 ] 5.34685 T 2.525 × 10 4 / T 2 + 1.69167 × 10 6 T 3 9157.09 Pananandeh [47]
Table 3. Miscellaneous Items Capital Costs.
ItemNotesCost Estimate ($CAD)Source
Water Pumps4 pumps. 6 gallons per minute.$2000[55]
Water TankPlastic. 2000 gallon tank.$2000[56]
Cooling system between compressors (HX02)Double pipe. Area of 1.72 m2$19,518[40]
Heat Exchanger recycling heat in reactor (HX03)Double pipe. Area of 41.5 m2$78,071[40]
Cooling system at output of reactor (HX04)Double pipe. Area of 11.7 m2,$32,529[40]
Table 4. Power consumption of each component in P2A system.
DeviceEnergy Usage (GJ Tonne−1 NH3)ReferenceFraction of Total Energy Usage (%)
Reactor Feed Compressors3.24Aspen Plus Simulation8.65
Hydrogen Generation (electrolysis)32.97Vendor (Nel) 88.07
Nitrogen Compressor0.18Aspen Plus Simulation0.47
PSA0.92Rouwenhorst et al. [45]2.45
Reverse Osmosis0.02Bartels and Andes [36]0.05
Undersea Cable (100 km)0.12Gordonnat and Hunt [58]0.31
Total37.4 100
Table 5. CAPEX summary for the P2A system design.
ItemCapital Costs ($CAD)Source Used
Windfarm$46,569,844[30]
Ammonia Storage$2,000,000[40]
Multi-stage Compression$4,200,000[40]
Electrolyzer$7,168,000[34]
Hydrogen Storage$500,000[40]
Ammonia Reactor$1,026,000[40,45]
Nitrogen Generation$500,000[42]
Other (Water tank, heat exchangers)$344,056[40,55,56]
Subtotal$62,307,900
Working Capital (15% of ammonia plant cost)$2,360,708[43]
Contingency and Fee (18% of ammonia plant cost)$2,832,851[40]
Greenfield Fee (30% of ammonia plant cost)$4,721,417[40]
Total$72,222,876
Table 6. Production and power comparison for the two scenarios.
Scenario 1Scenario 2
Average Production Rate (tonnes NH3 day−1)1510.6
Average Wind Energy Usage (MWh tonne−1 NH3)5.127.23
Average Grid Energy Usage (MWh tonne−1 NH3)5.243.13
LCOA (CAD tonne−1 NH3)23232613
Publisher’s Note: MDPI stays neutral with regard to jurisdictional claims in published maps and institutional affiliations.

