1. Introduction
There are several countries in every continent that have biogas production among their national strategies for energy production. Many research works have aimed at the improvement and creation of new technologies that enable a greater production of biofuels as well as recycling and reusing waste in order to generate energy; these have become viable solutions for facing the problem of the elimination of waste [
1].
Anaerobic digestion is known as a biochemical process in which complex organic compounds are decomposed by anaerobic microorganisms in the absence of oxygen [
1]. It has been used in Western Europe since the 1980s and one hundred and ninety-five facilities using this process have been built as of 2010, with a total annual capacity of 5.9 million tons [
2].
The transformation of biodegradable matter from waste into methane gas has its origin in anaerobic digestion, which is the main process used for biosolid stabilization, the destruction of volatile solids and the production of stabilized biosolids [
3]. It is known that the performance and synergy of this process is strongly related to the characteristics of the substrates used [
4].
Biogas production can be a form of clean energy production in slaughterhouses [
5]—taking advantage of organic residues and waste from the slaughter of large and small livestock and poultry—carried out through the implementation of plants to achieve anaerobic digestion, which can be used as a renewable energy technology for the mitigation of environmental pollution [
6]. The wastewater and blood that are disposed of in the Guayaquil slaughterhouse are discharged into the Estero Salado river, causing a negative impact on this water body [
7,
8].
Some research has concluded that the utilization of slaughterhouse waste could result in unstable process performance and stress conditions for microbial communities due to the formation of potential inhibitory compounds. Others, to improve this performance, have paid special attention to the influence of operating parameters such as the organic load rate, the hydraulic retention time and the effect of temperature on the performance of the semi-continuous digestion process [
4].
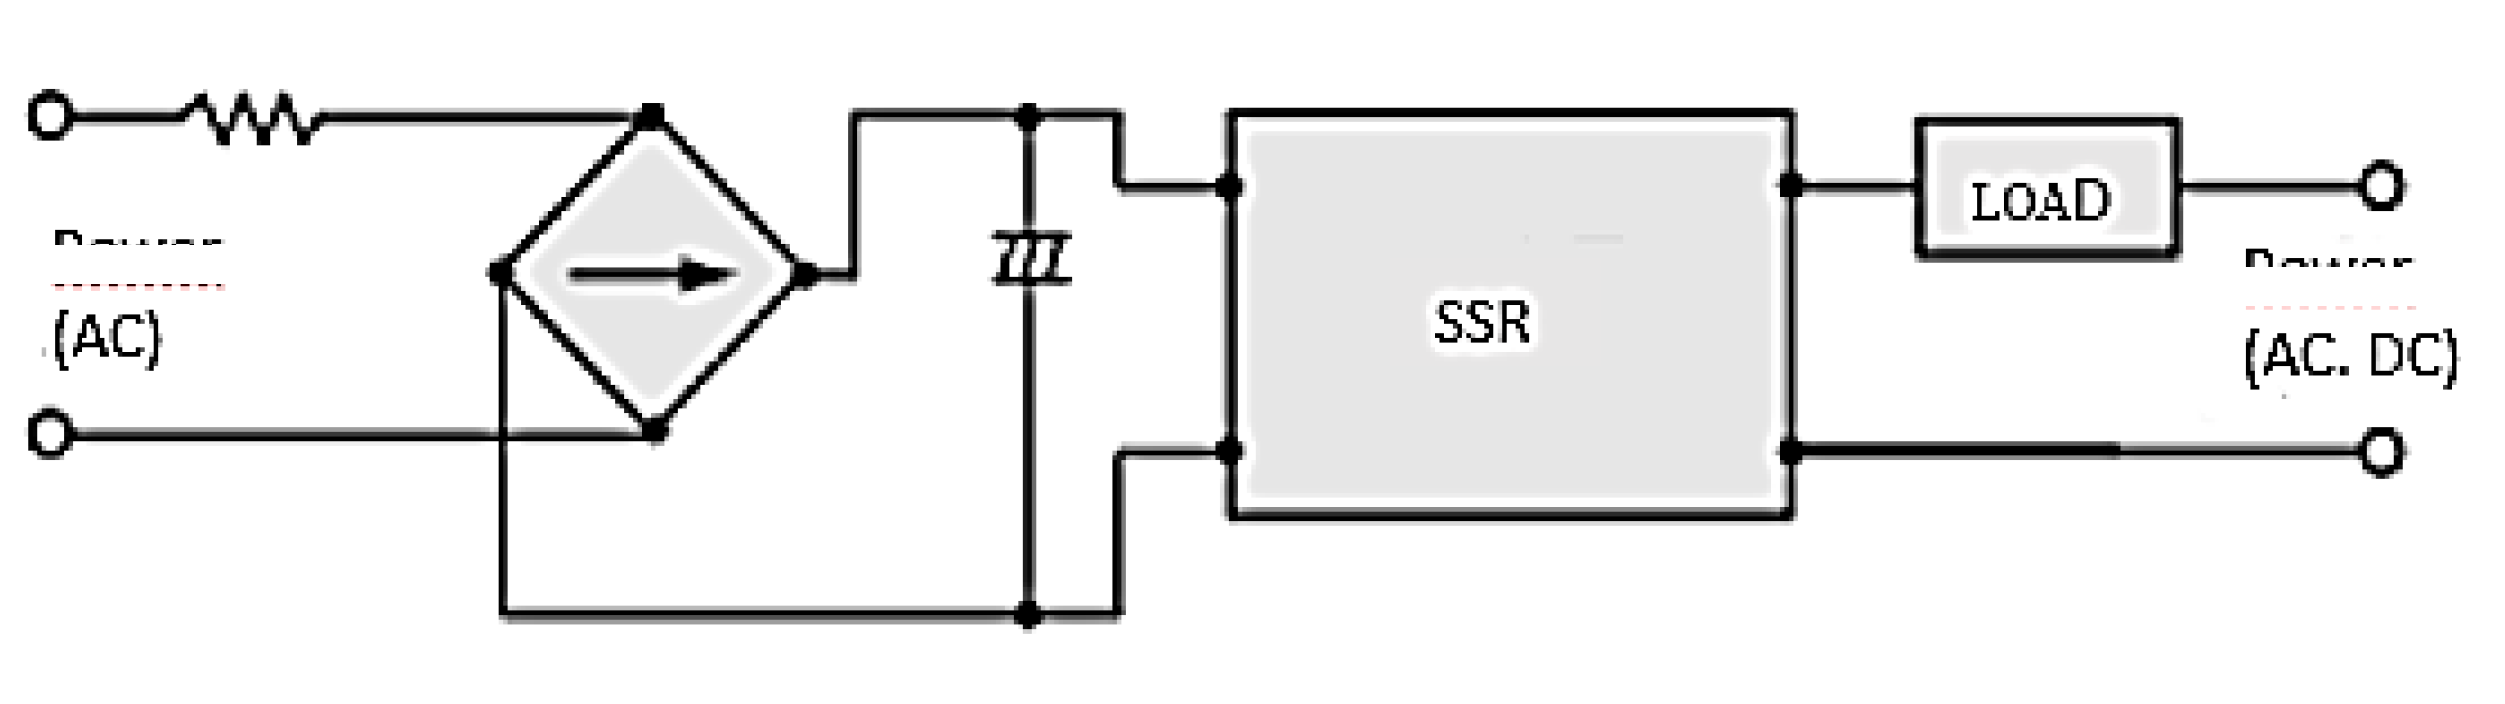
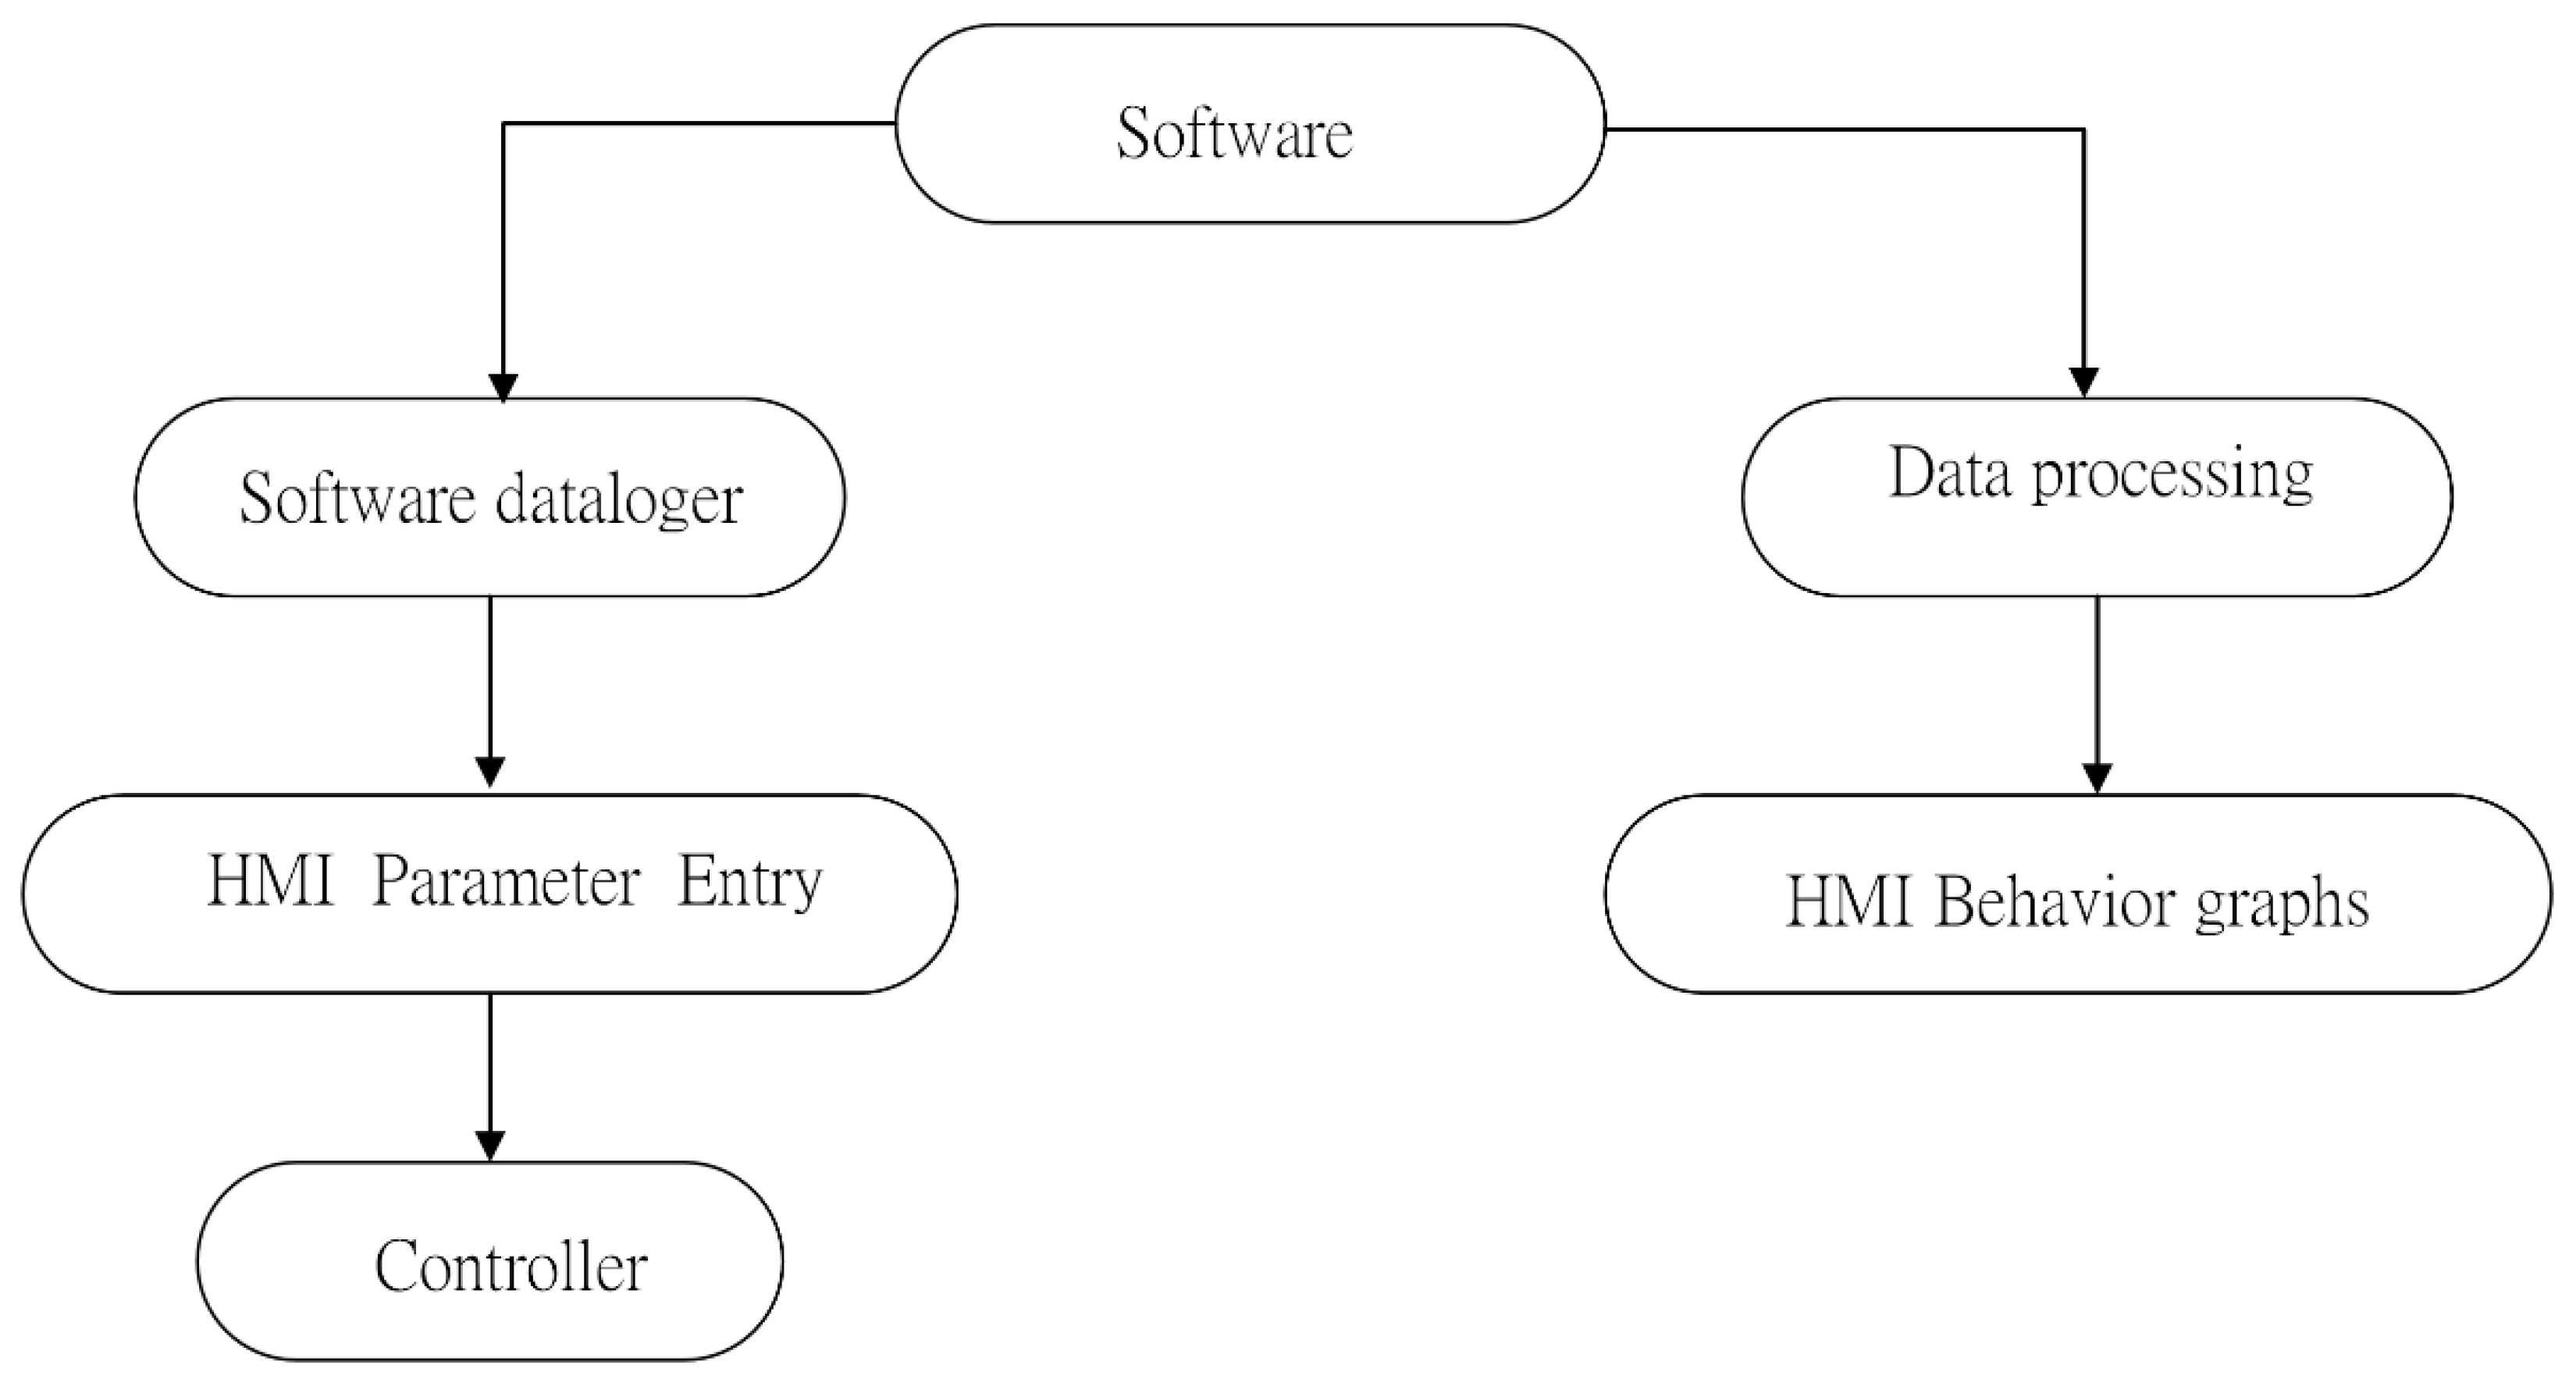
The objective of this study was to find the appropriate substrate composition when one of the substances used included a buffer solution. Two phases of experimentation were implemented: The second one was the “Modeling, implementation and automation of a micro plant of production of biogas from residual biomass” [
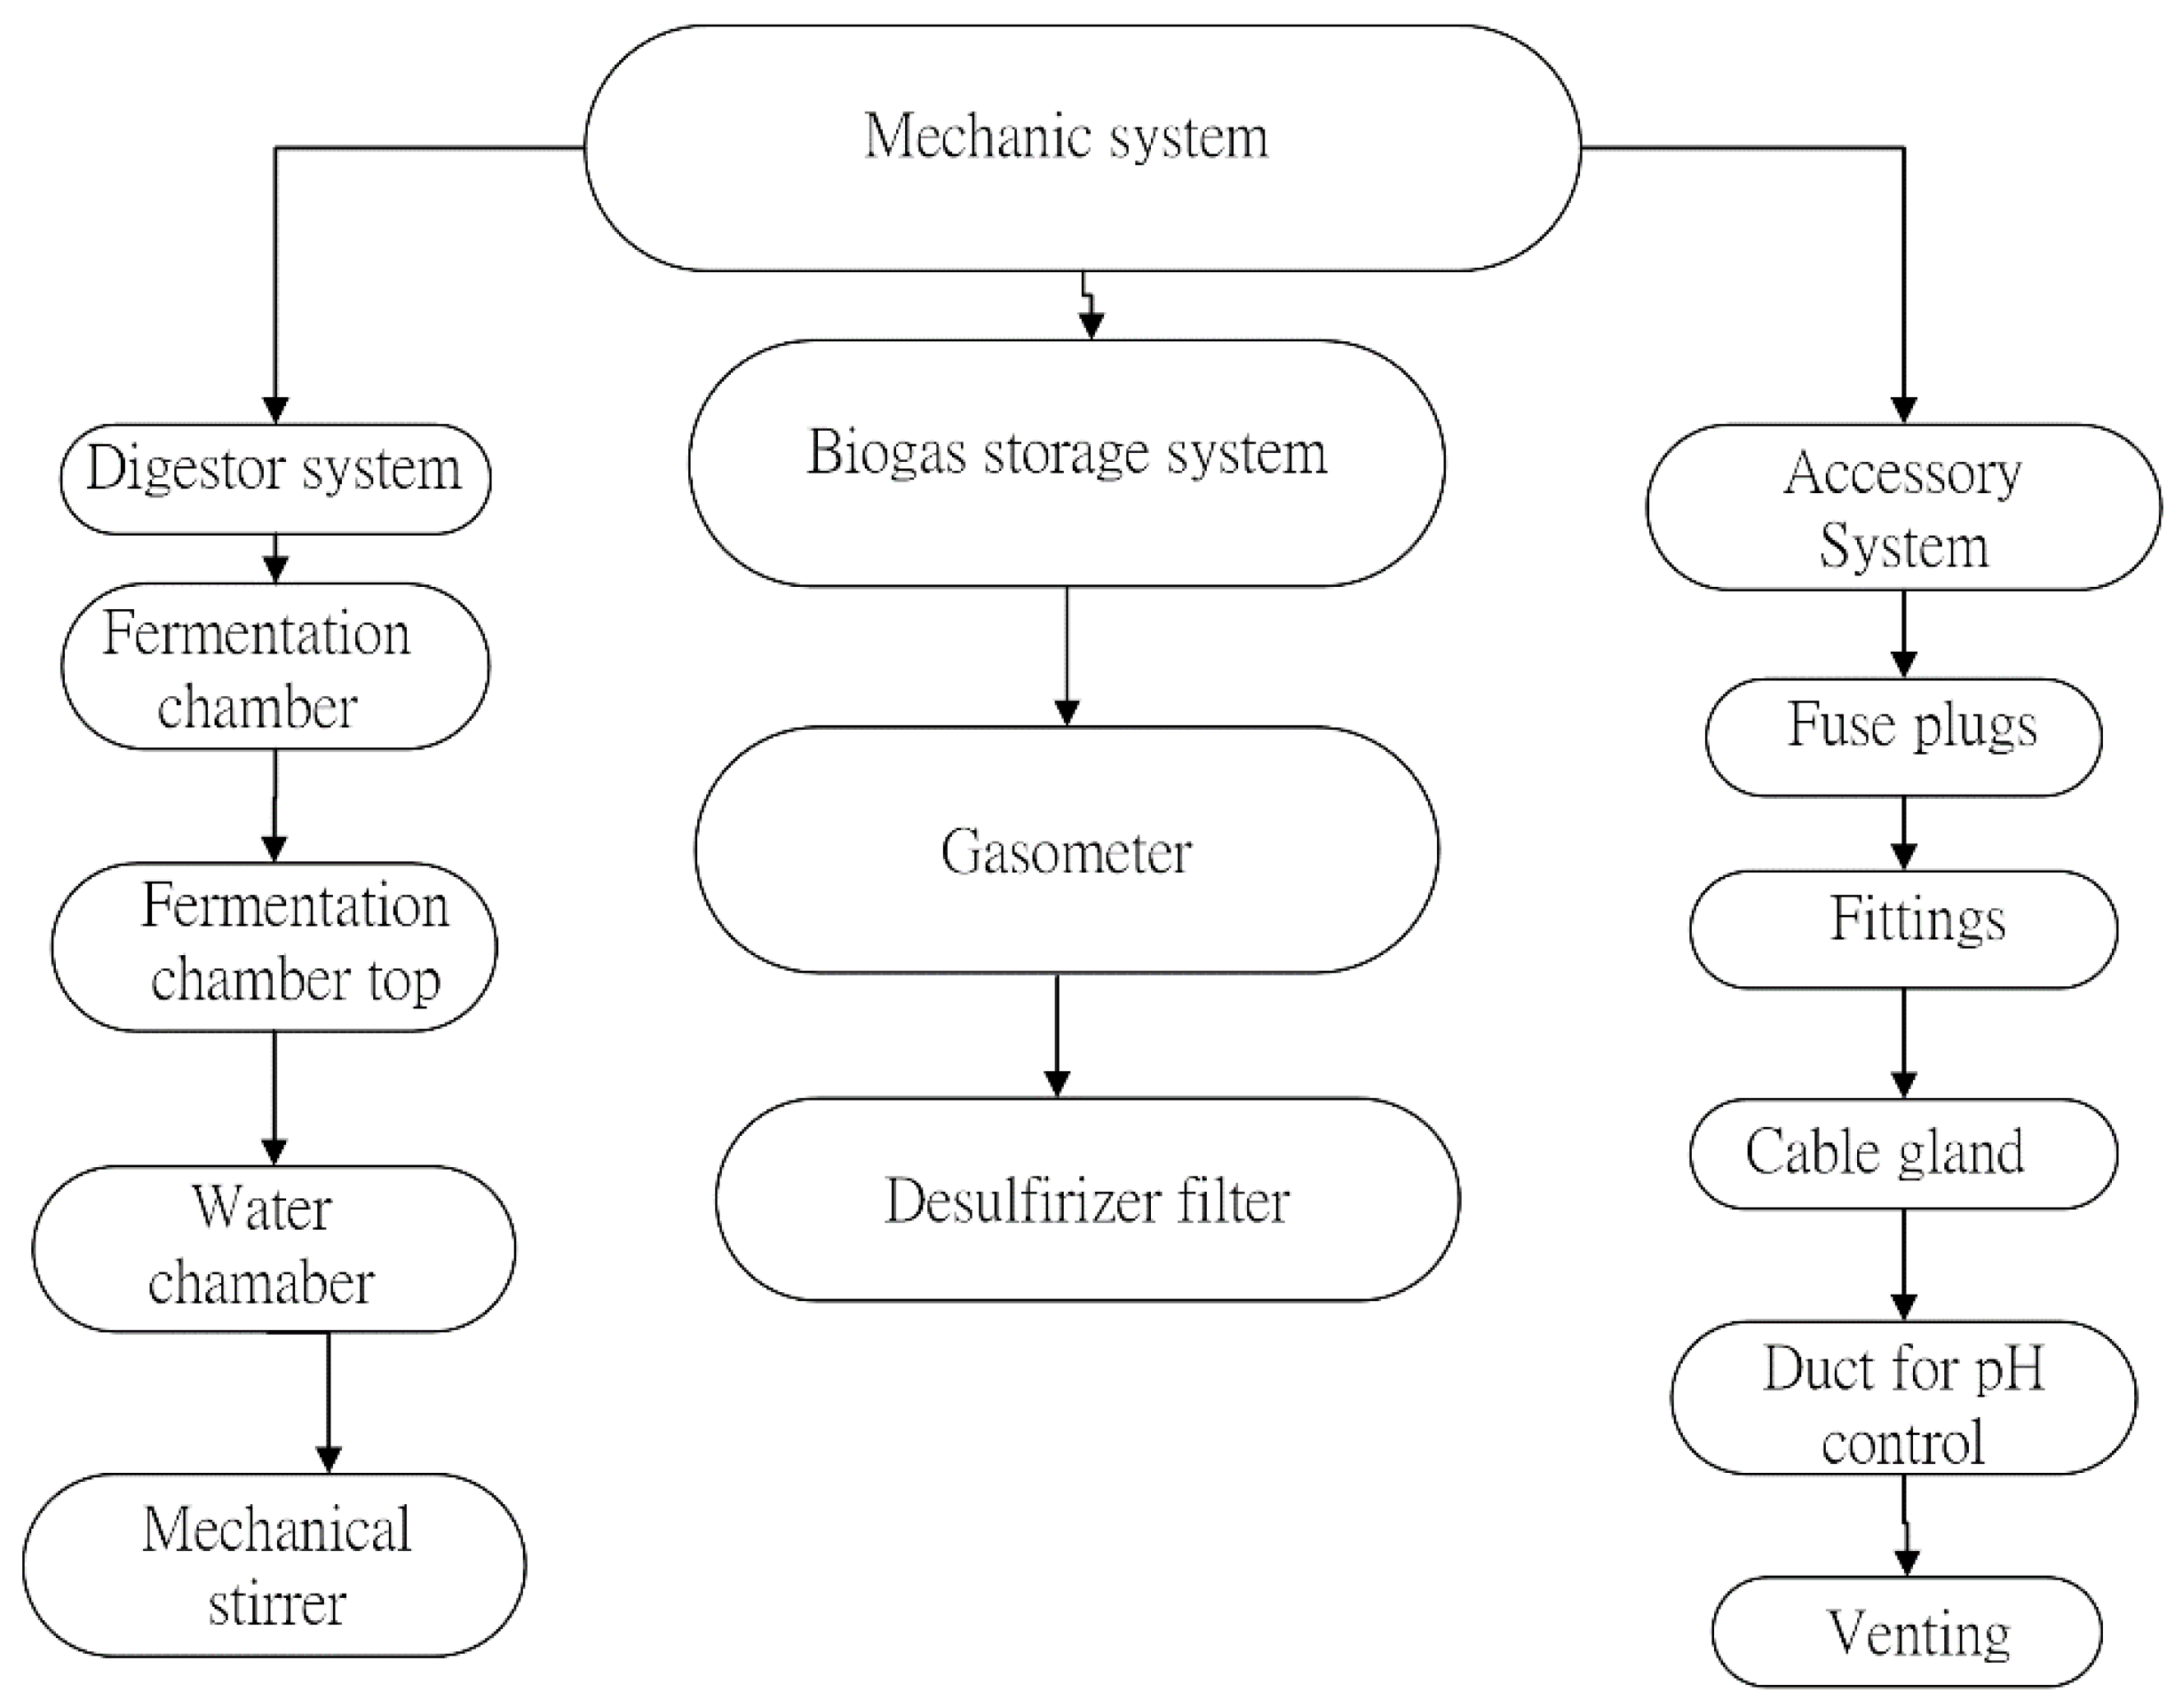
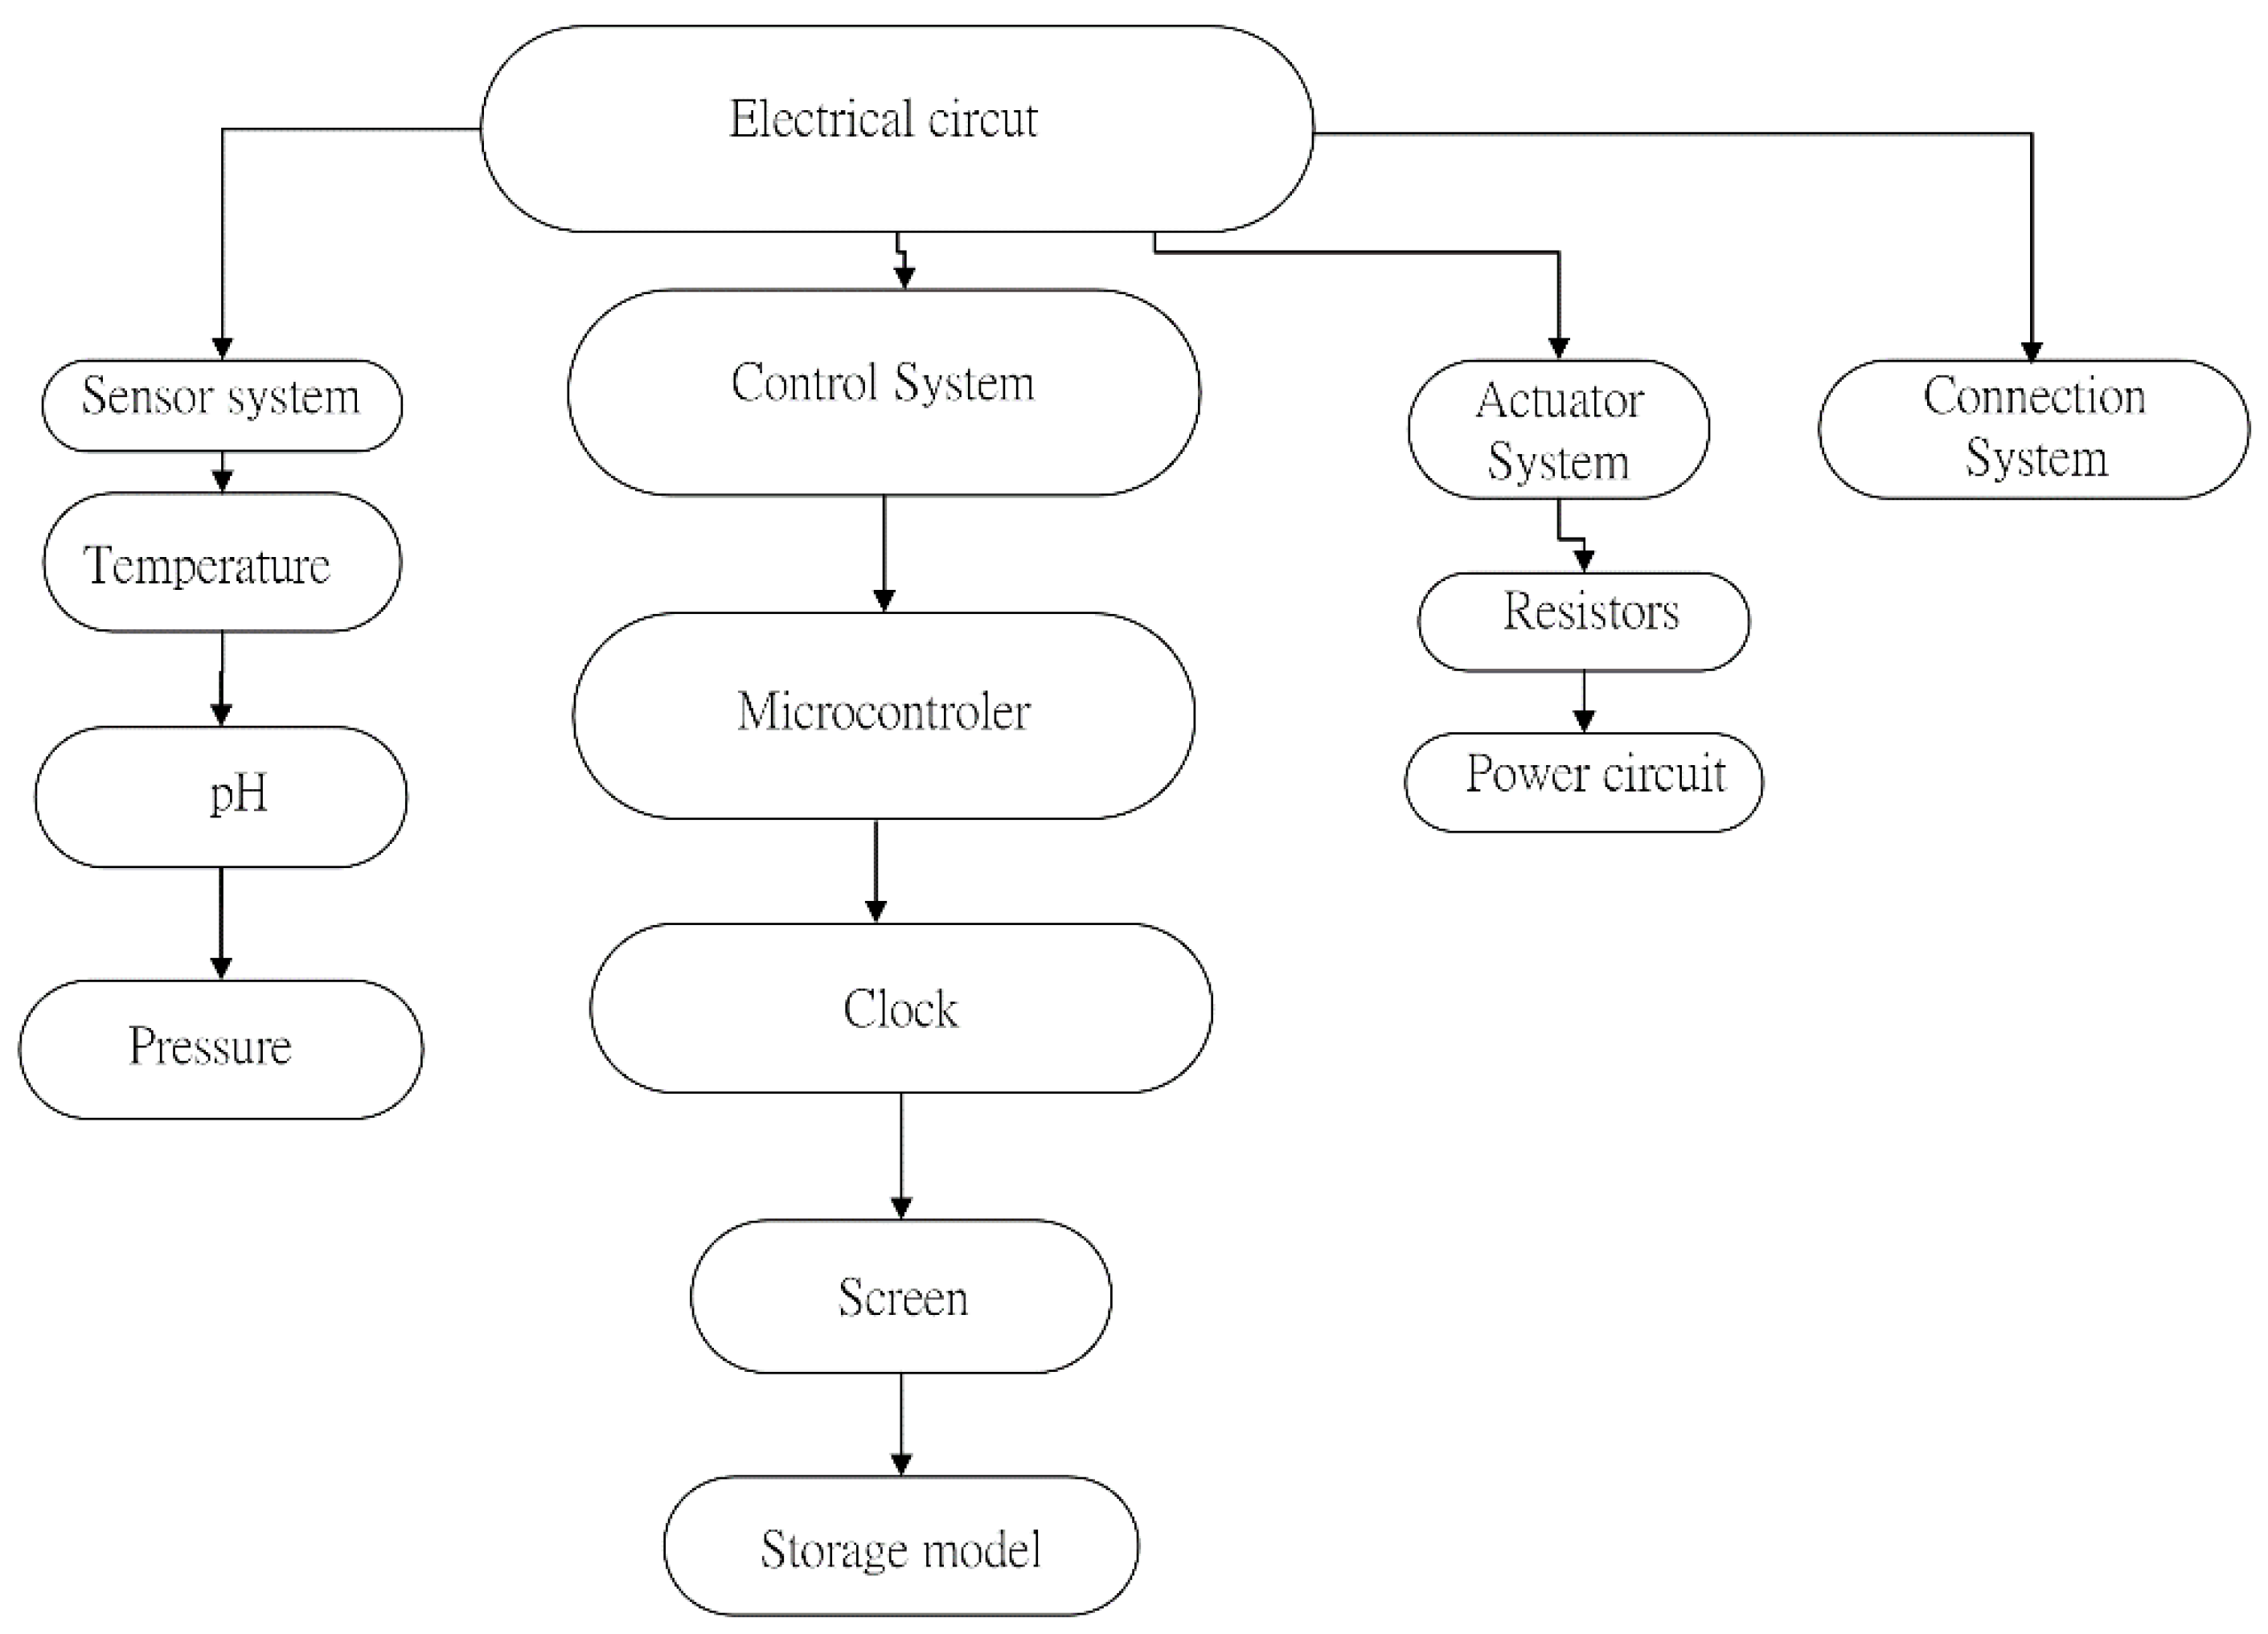
9], which in this paper was referred to as a microplant for biogas production. The first phase aimed to characterize the waste from the Guayaquil slaughterhouse, which allowed the identification of a characteristic curve of biogas production over time for each combination of waste studied. The objective of the second phase was to study the combination of waste that produced the most gas during the first phase in a microplant with a mechanical implementation and mechatronic system for the control [
10] of variables that intervene in the anaerobic digestion process, which allowed for the confirmation of the results found in the first phase of research—without the concerns that the non-control of process variables would cause—in such a way that they constituted a path for the industrialization of the waste treatment process in slaughterhouses, optimized by the use of the best combination of these residues.
The first phase, carried out at pilot-scale, was the “Characterization of organic waste from the Guayaquil slaughterhouse” [
11]. The piloting of the first phase is detailed below because the tests carried out were the starting point for larger scale microplant research.
By using the optimal combination of organic waste to ensure the development of methanogenic bacteria in the process of anaerobic digestion, it is possible to find out the best values of moisture (H), total solids (TS), volatile solids (VS), average time of biogas production and pH for optimal biogas production. The process temperature was maintained within the mesophilic range [
12].
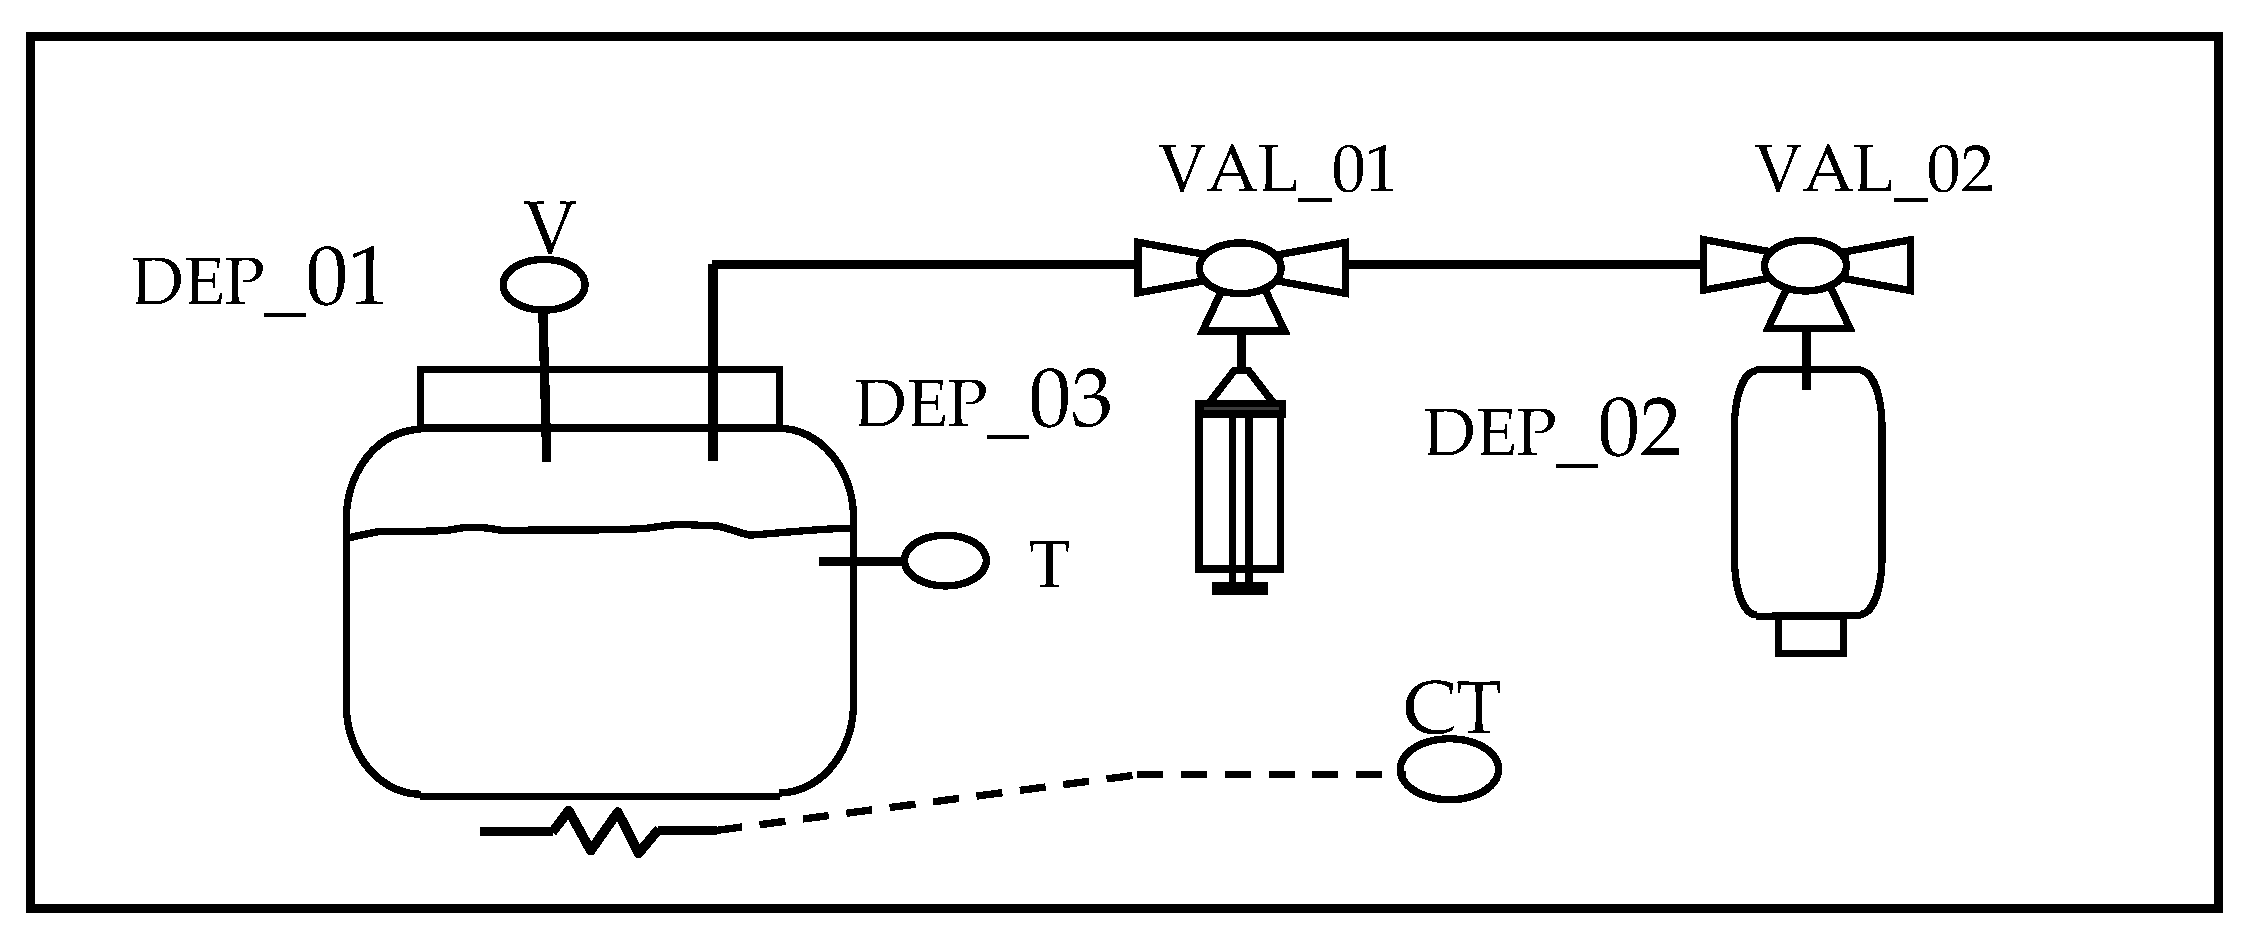
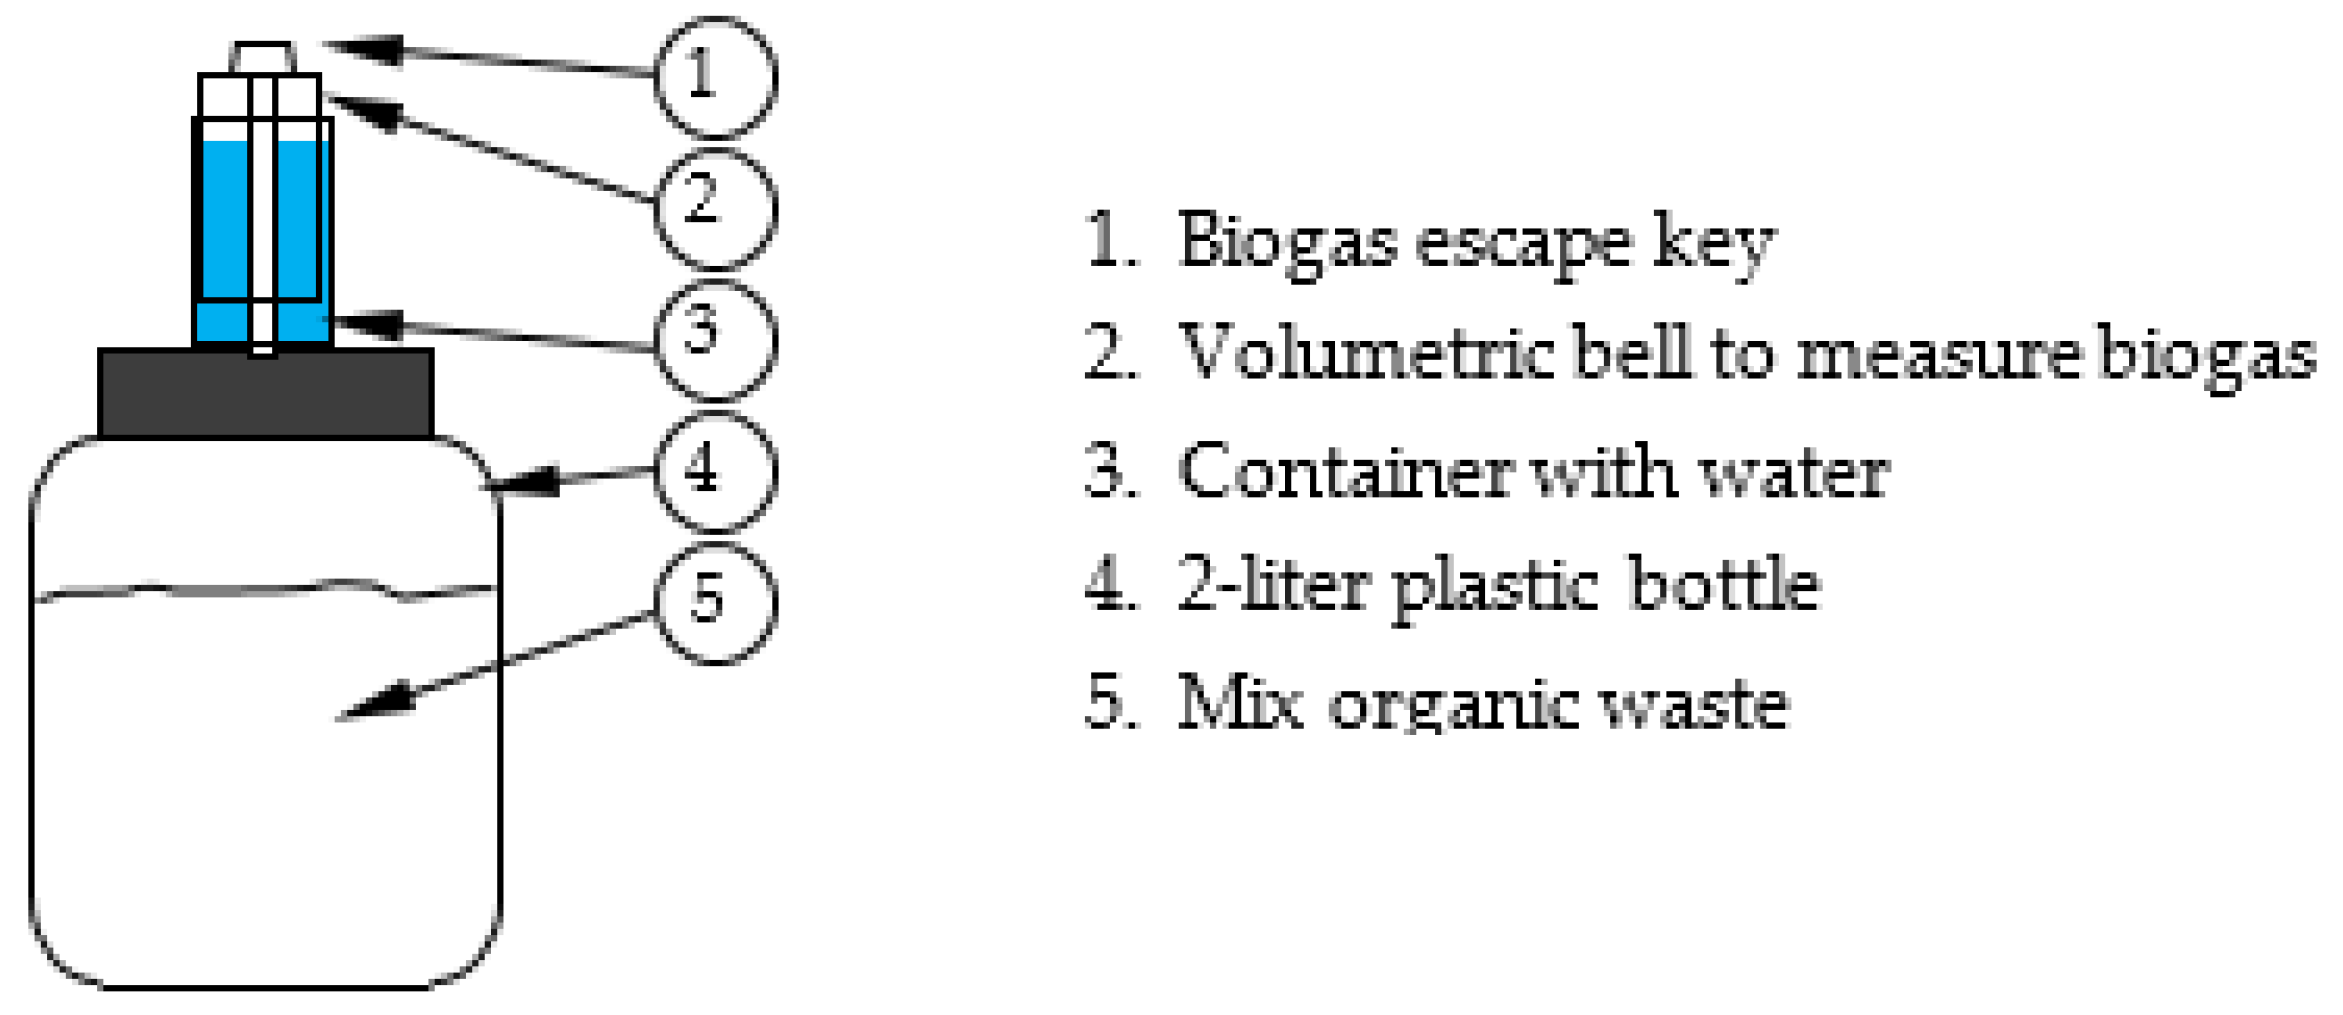
The substrate used in the six test-runs during this first phase varied according to the combination of wastes. The wastes were placed in a closed digester with discontinuous flow [
13], measuring the amount of biogas produced. As shown in
Figure 1, the system with the storage tank consisted of a 180 cm
3 plastic bottle that was left under vacuum. To transfer the biogas produced from the biodigester (DEP_01) to the storage tank (DEP_02), the valves were operated. The equipment called DEP_03 consisted of a 10 cm
3 syringe to help transfer the biogas to the tank when required.
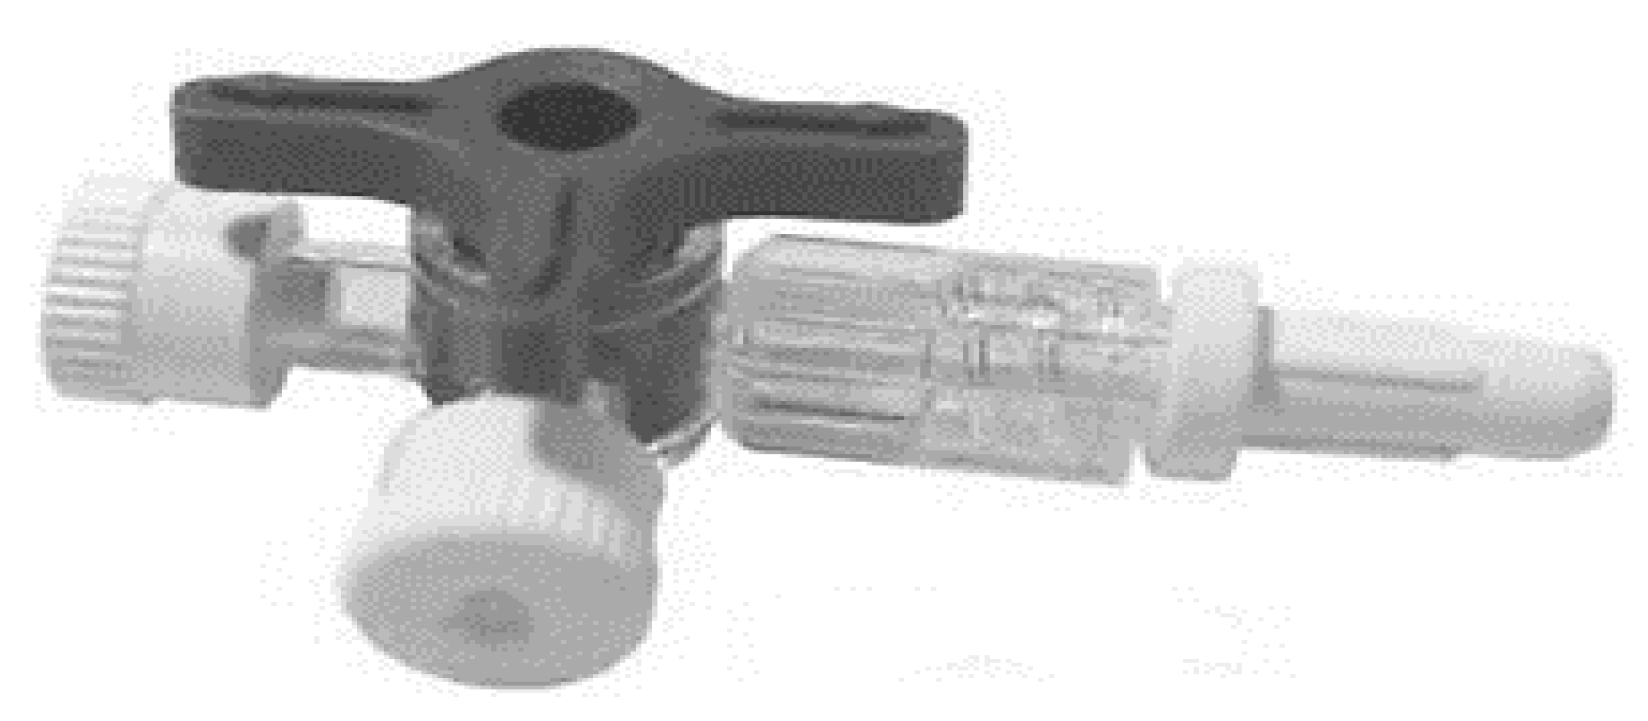
Figure 2 and
Figure 3 show the type of valve and the suitability of the biodigester for installation in the system, respectively [
11].
Residues and Conditions Imposed for Tests One to Six
Organic waste of animal origin, such as that from slaughterhouses (blood and others), can be used in methanogenic fermentation [
14].
Table 1 lists the amounts imposed on the substrate for each of the tests and
Table 2 relates the total values and percentage values of the solids and the humidity of the mixtures used. A temperature of 32 °C [
15] was maintained due to the use of a HANYOUNG process controller—model NX4 with an RTD as a transducer, an ON/OFF setting and a hysteresis of ±1 °C [
11].
Table 3 shows the characteristics of the residues used in the six tests. In Test 2 (P2)—blood, manure and water—it is important to note the differences between the C/N ratio of the cattle blood from both the Andean Plateau and the Plateau in comparison to the manure. These two regions are extensive high plains located between 2900 and 3900 m above sea level in the Central Andes.
Table 4 shows the parameters for the biogas production and the pH values of the mixture for all tests.
In all tests, the pH remained unrchanged at the beginning and end—except in Test 4, in which there was a variation of 1.1. The gas production in Test 2 (P2), which was the only one that used blood, exceeded the others by a percentage interval between 10.7 and 78.4. The duration in days was also higher in this test by a percentage interval of 0.32–0.5; gas production showed similar behavior, surpassing that of the remaining five tests by a percentage interval of 57.3–91.5. The pH of the Test 2 (P2) mixture was measured with a “Extech PH100 meter” instrument, manufactured by Teledyne FLIR, headquartered in Wilsonville, Oregon, USA.
In
Figure 4, the production, measured in days of biogas (cm
3), can be seen for the six tests (P1–P6). The equation of the trend line that relates to the gas production in the six tests carried out shows exponential gas growth over time.
The studies on anaerobic digestion that were consulted maintain that the convenient C/N ratio is between 20 and 30 and that the ideal value for the pH is 7. As such, it can be inferred that the C/N ratio of blood should not be recommended for this process [
16]. However, results such as those for the amount and days of biogas production are in contradiction with such an inference; as the relative humidity of the sample exceeded 80% [
17], there was good heat transfer from the incubator and the total-solids concentration level was adequate.
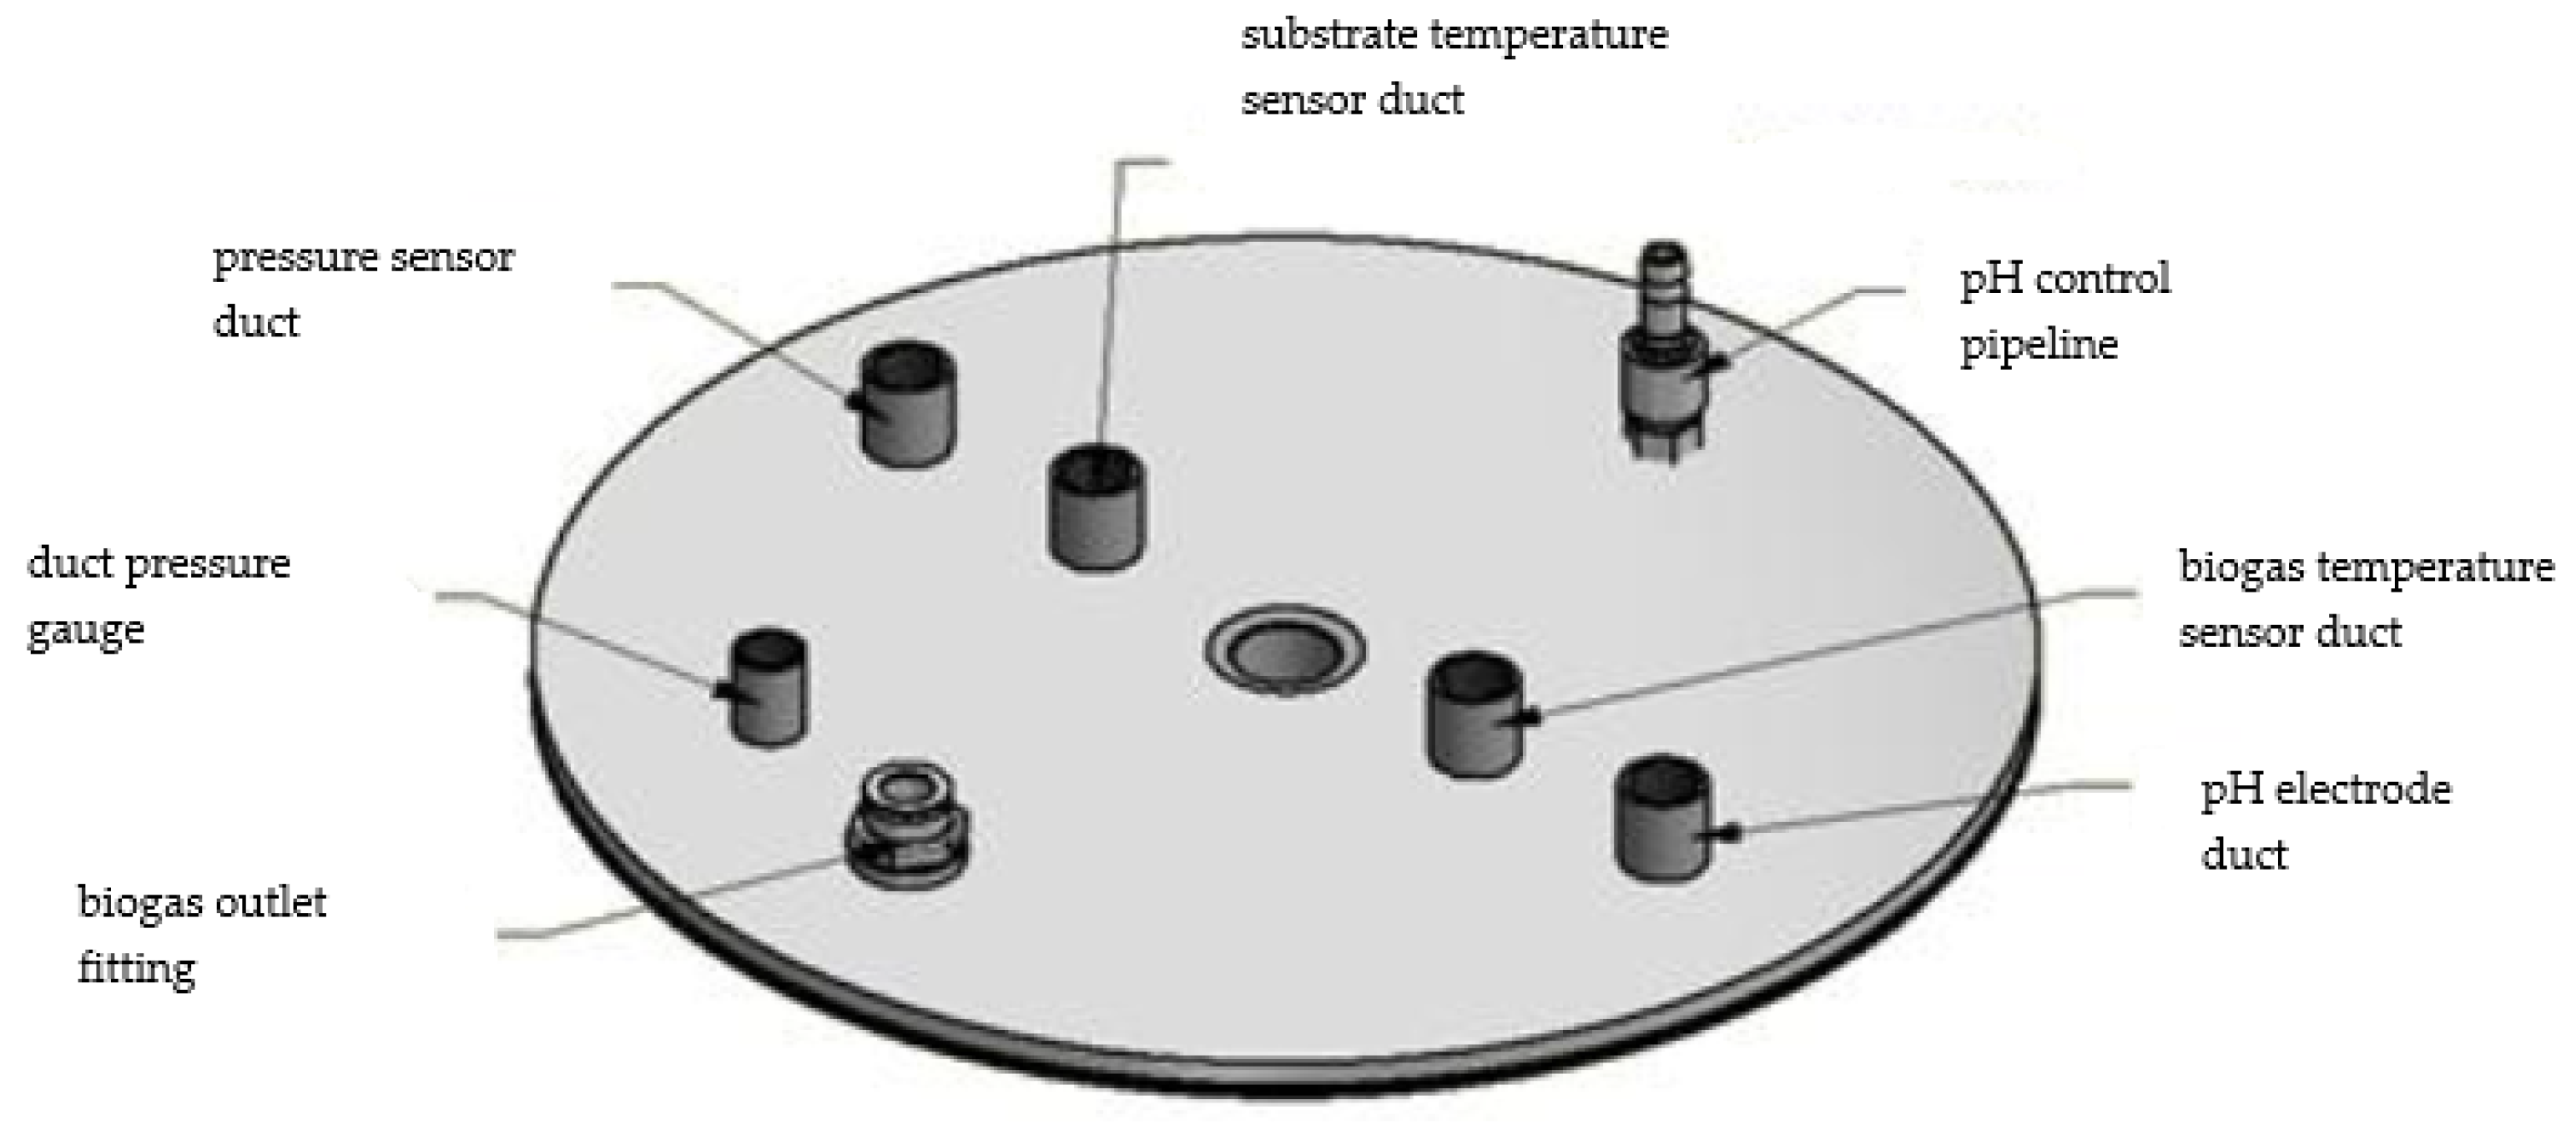
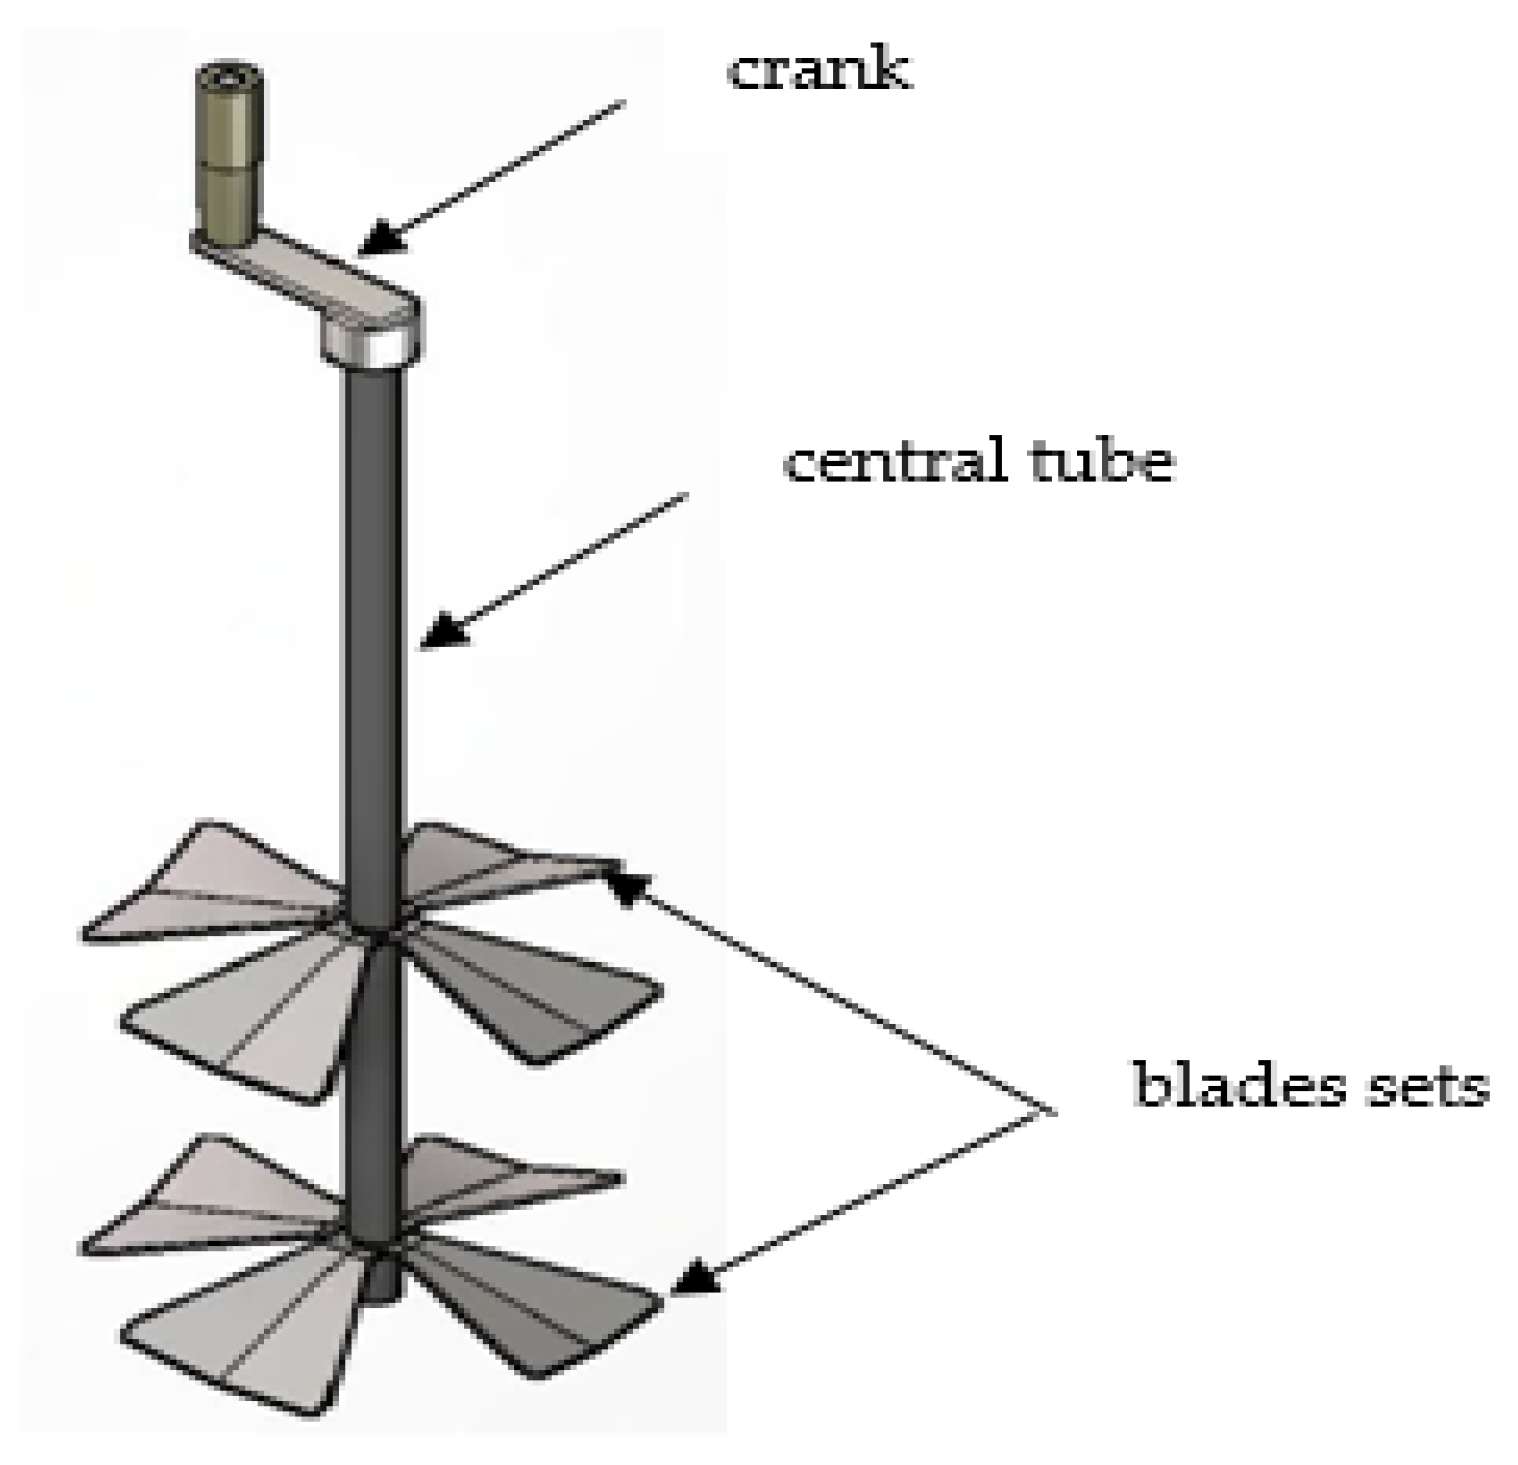
These results suggest that a deepening of this investigation is required, which is why a larger scale and better instrumented system was built to control the temperature of the substrates throughout the anaerobic process, which allowed us to obtain reliable data on the variables under study.
The experimentation provided data customized to Ecuadorian conditions. This way, Ecuadorian bio-energy laboratories were able to replace their more general data with data pertaining to the physical–chemical characteristics of waste from Ecuador.
4. Conclusions
The waste combinations used in the first phase of experimentation were different and the combination that produced the highest gas production was the one used in Test 2 (P2), with 50 g of total solids for manure, 50 g of total solids for blood and 1500 mL of water.
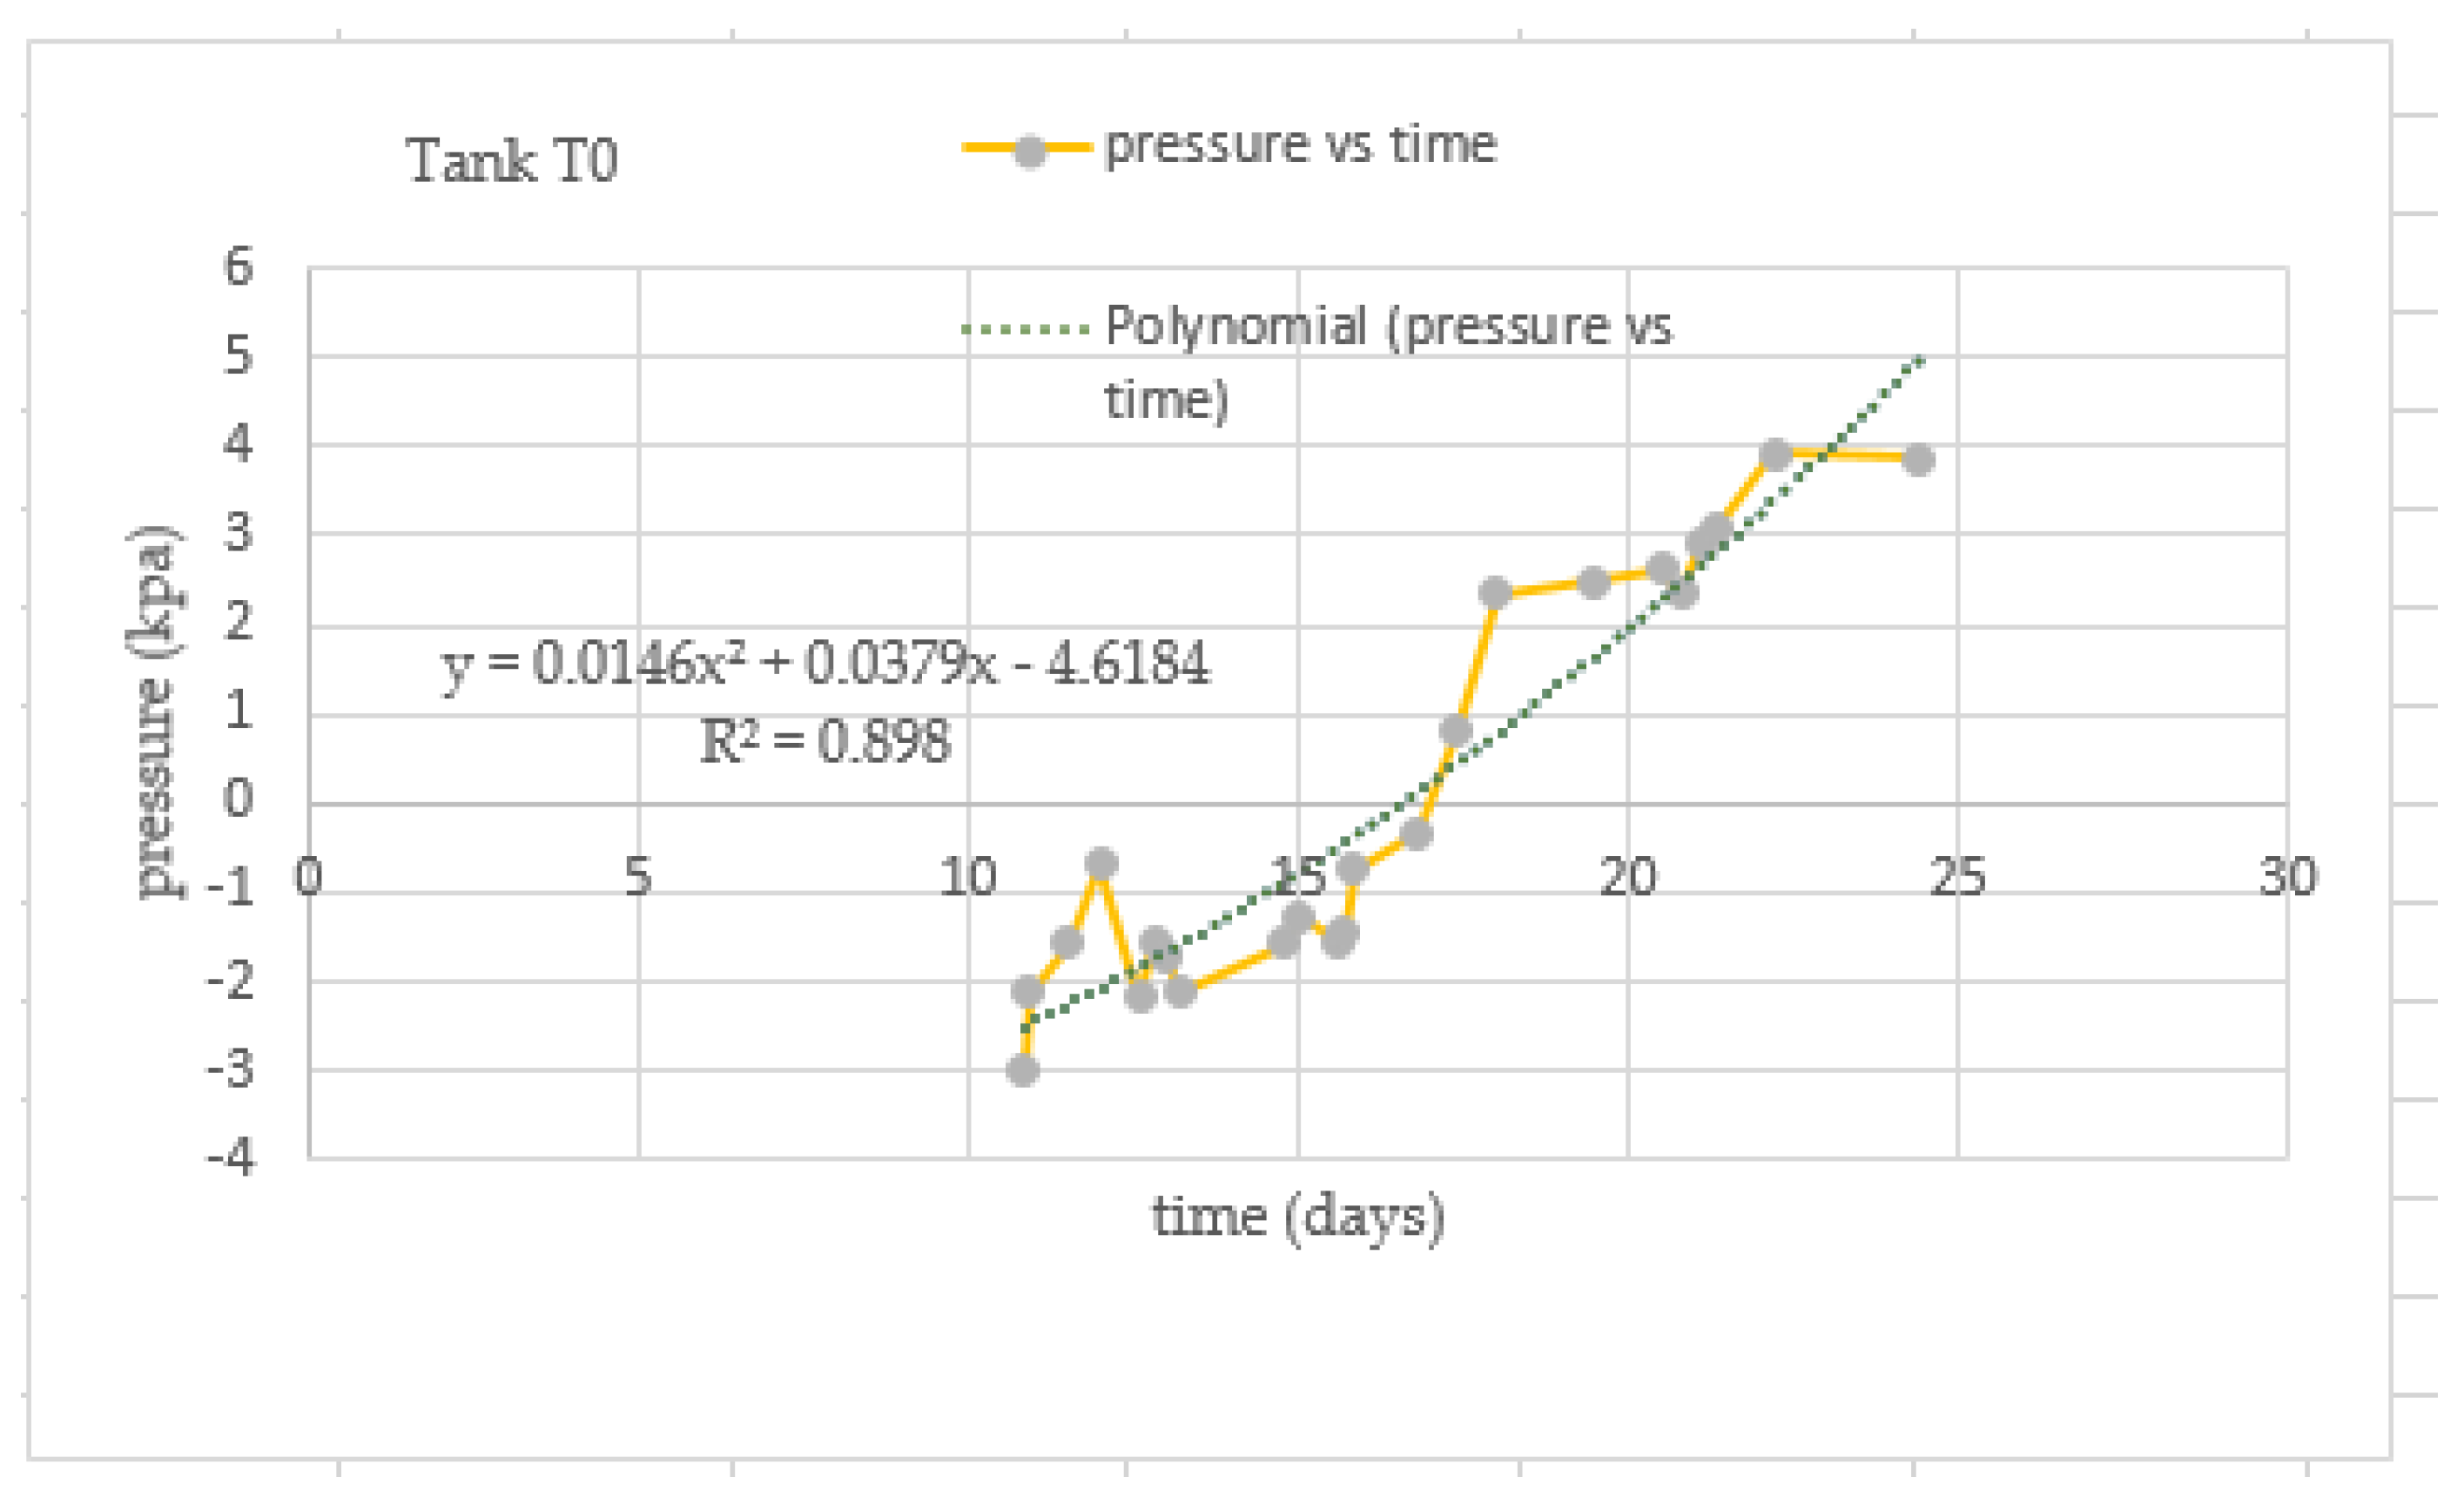
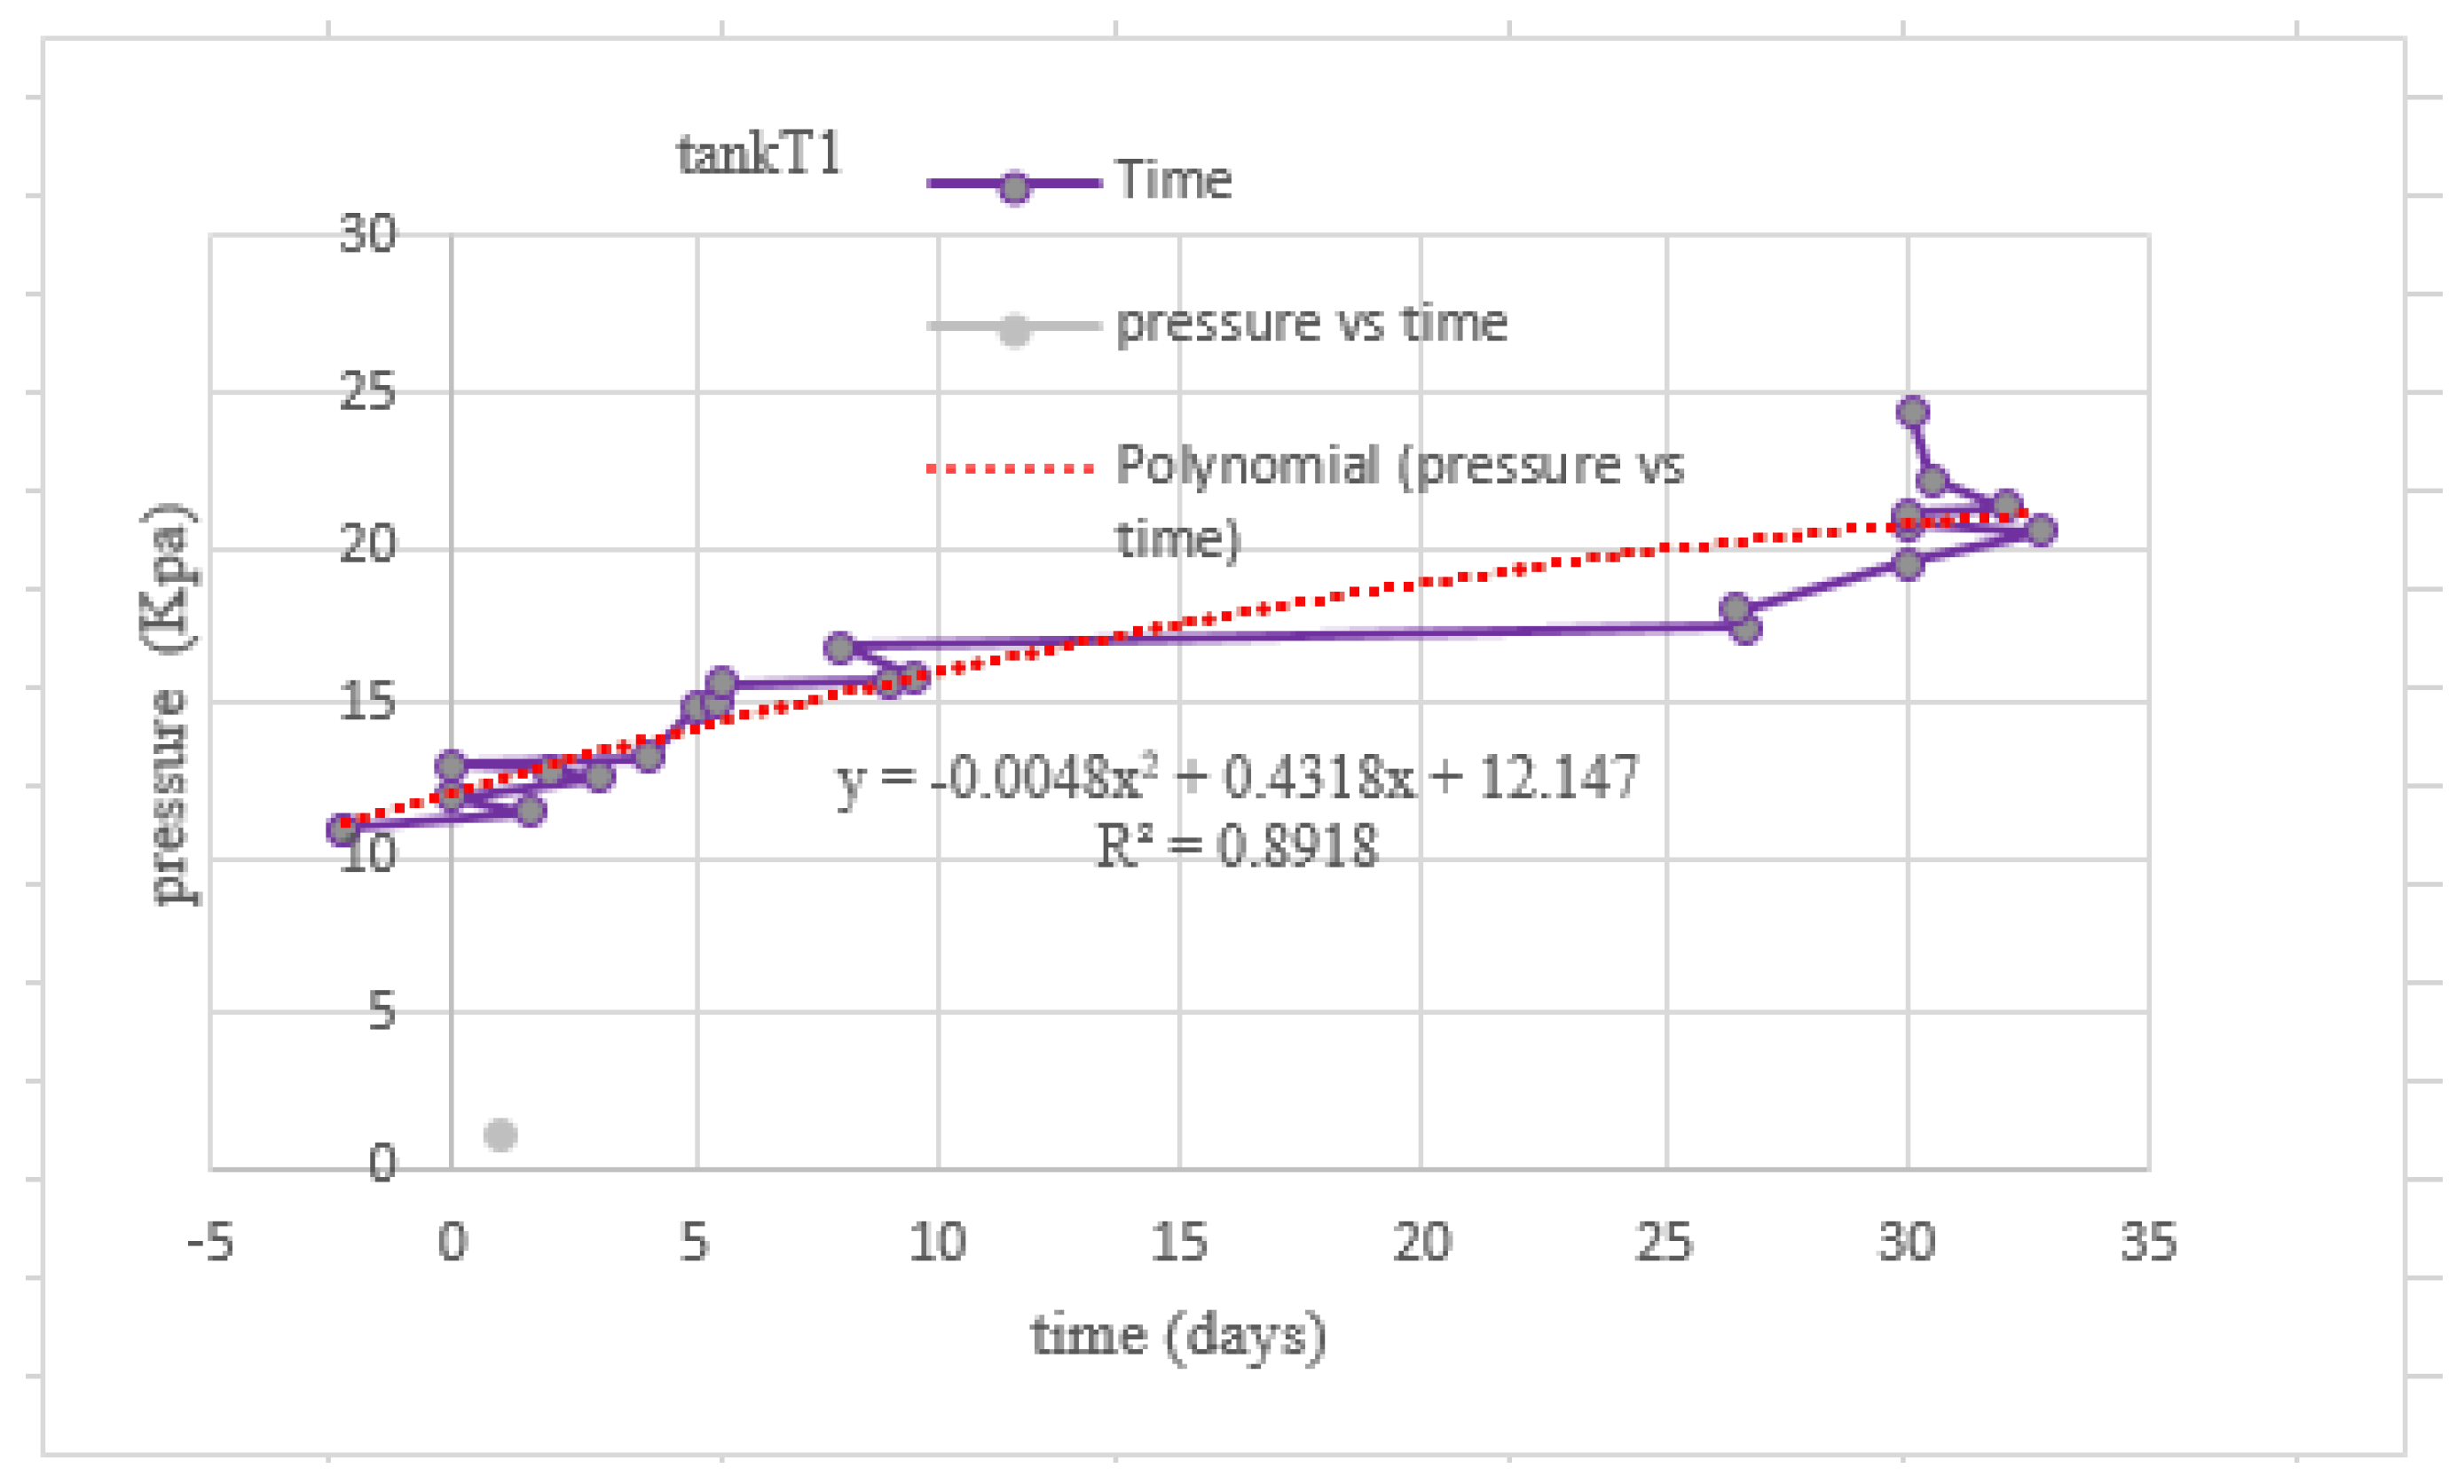
The graphs for biogas production during the first phase—the P1–P6 tests—and the gas pressure obtained in the microplant maintained the same trend, adjusting to a polynomial curve of degree two, which indicates the exponential growth of both over time.
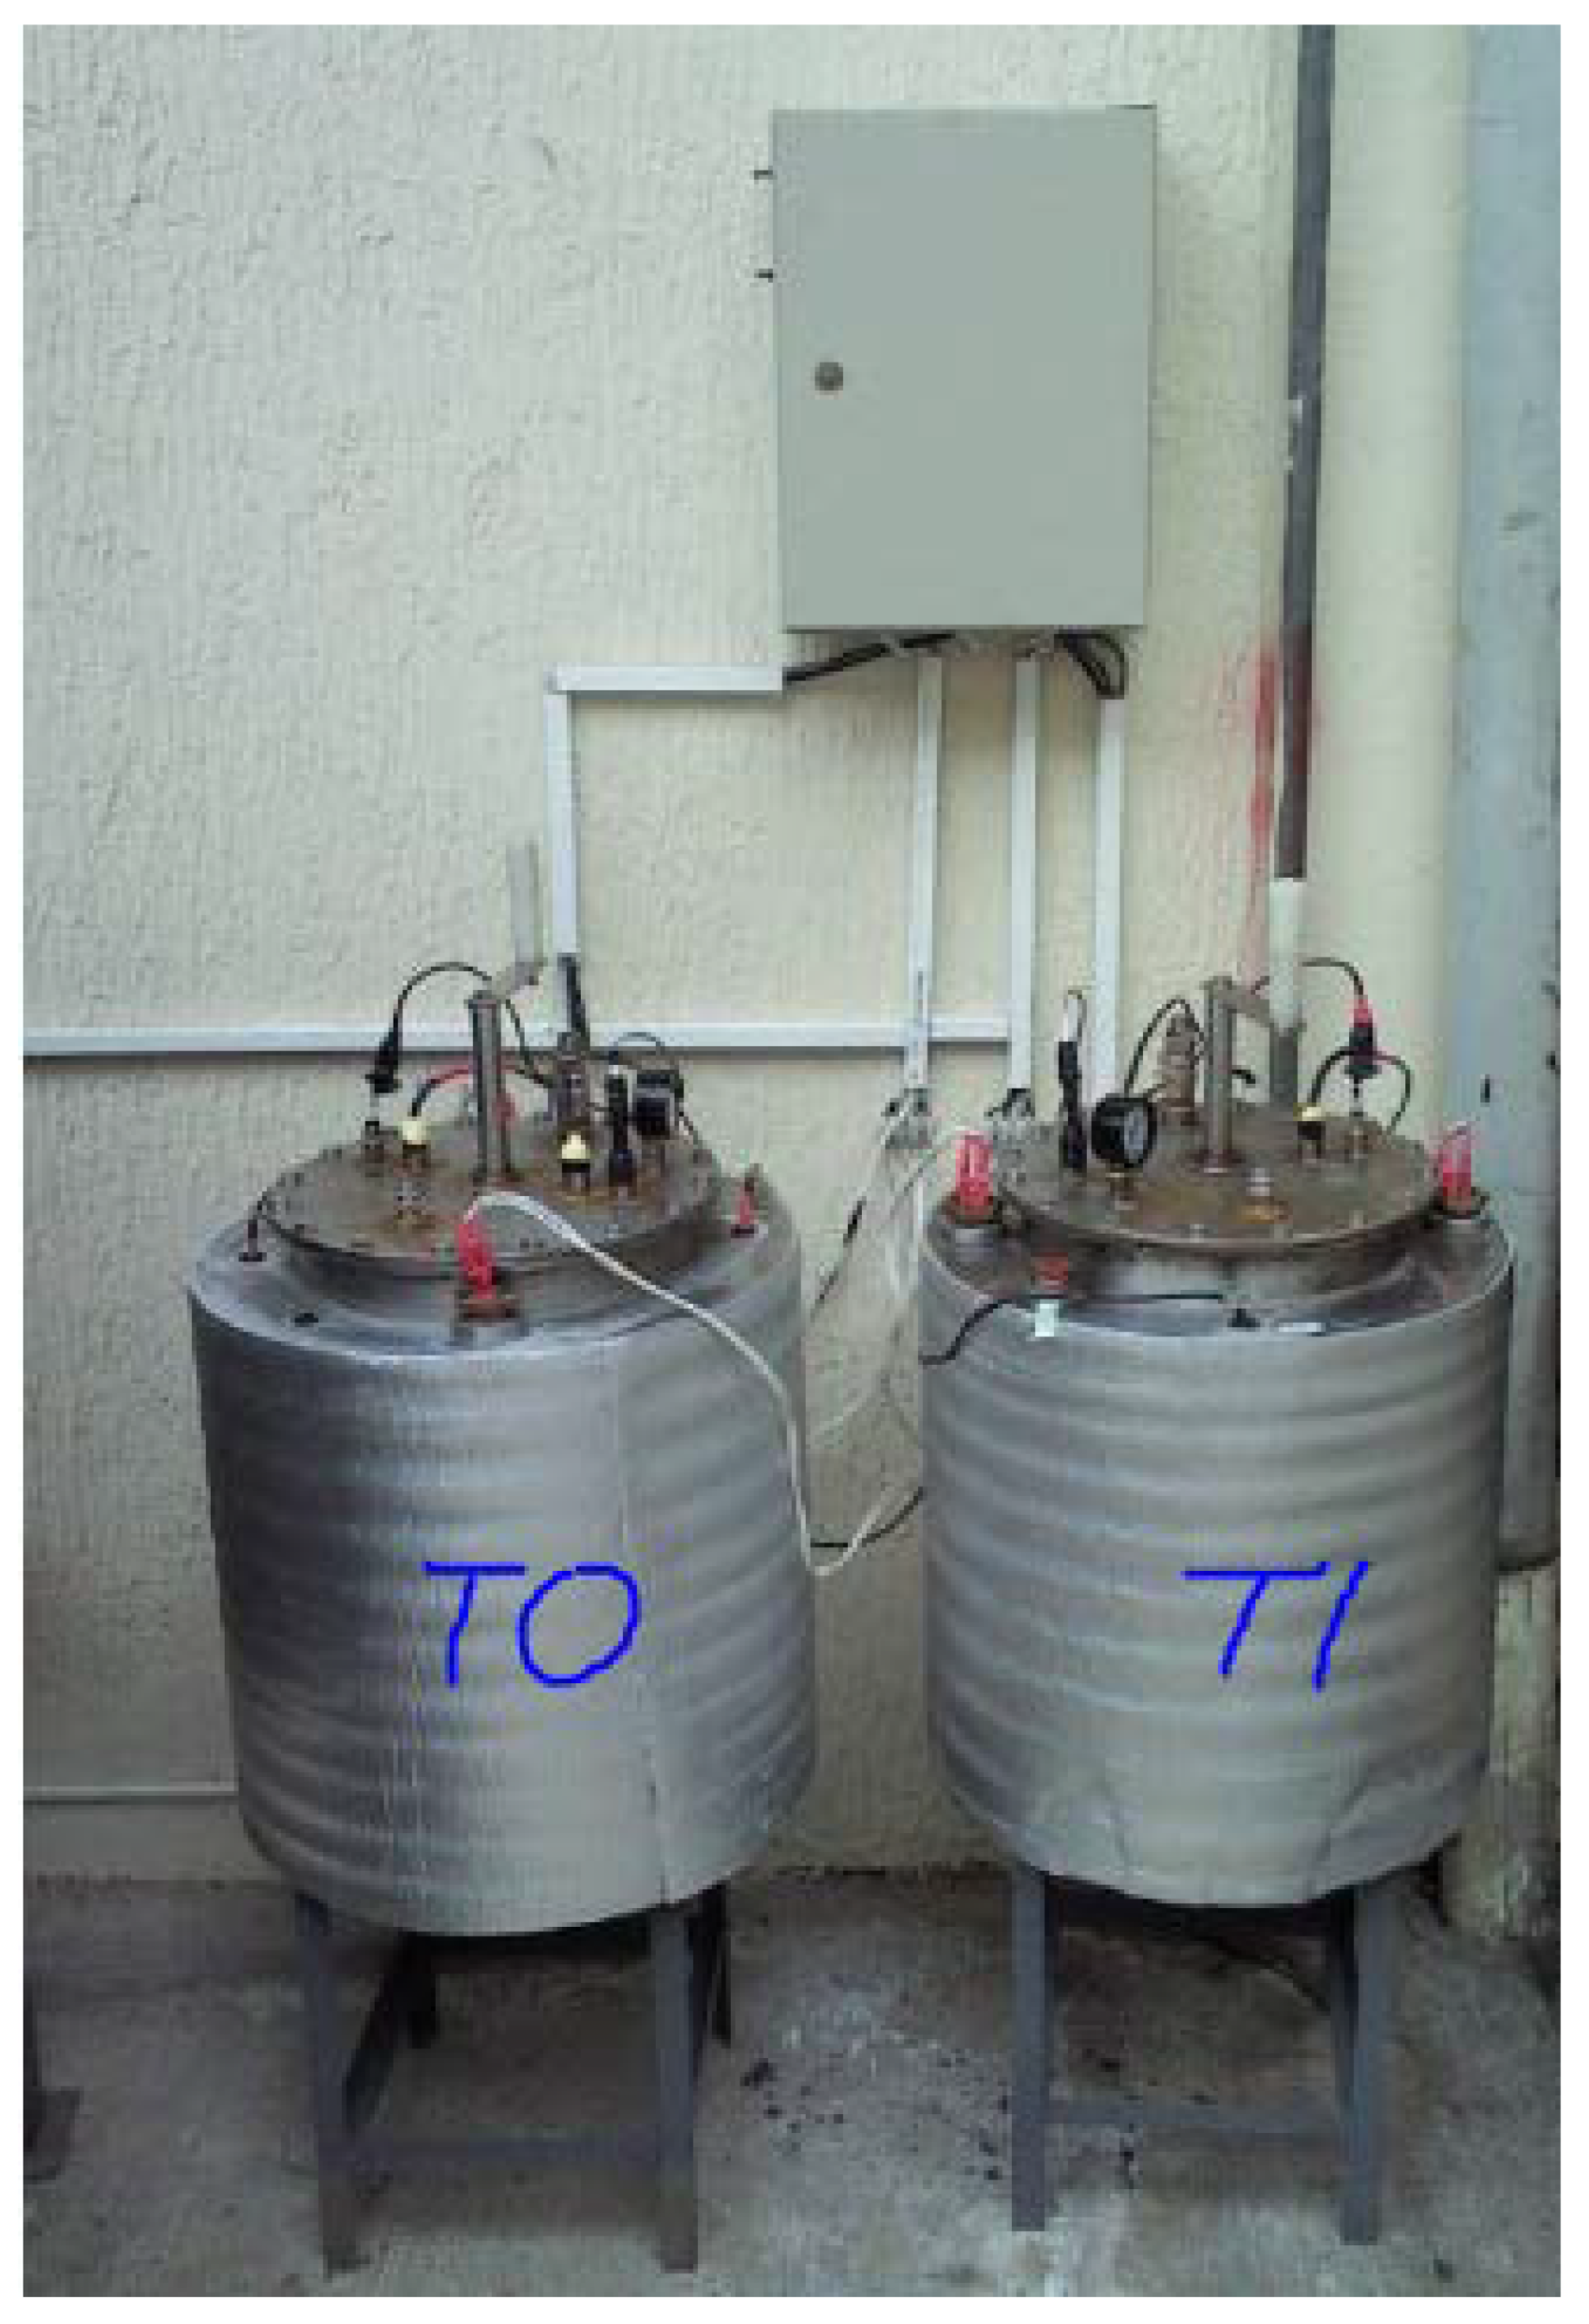
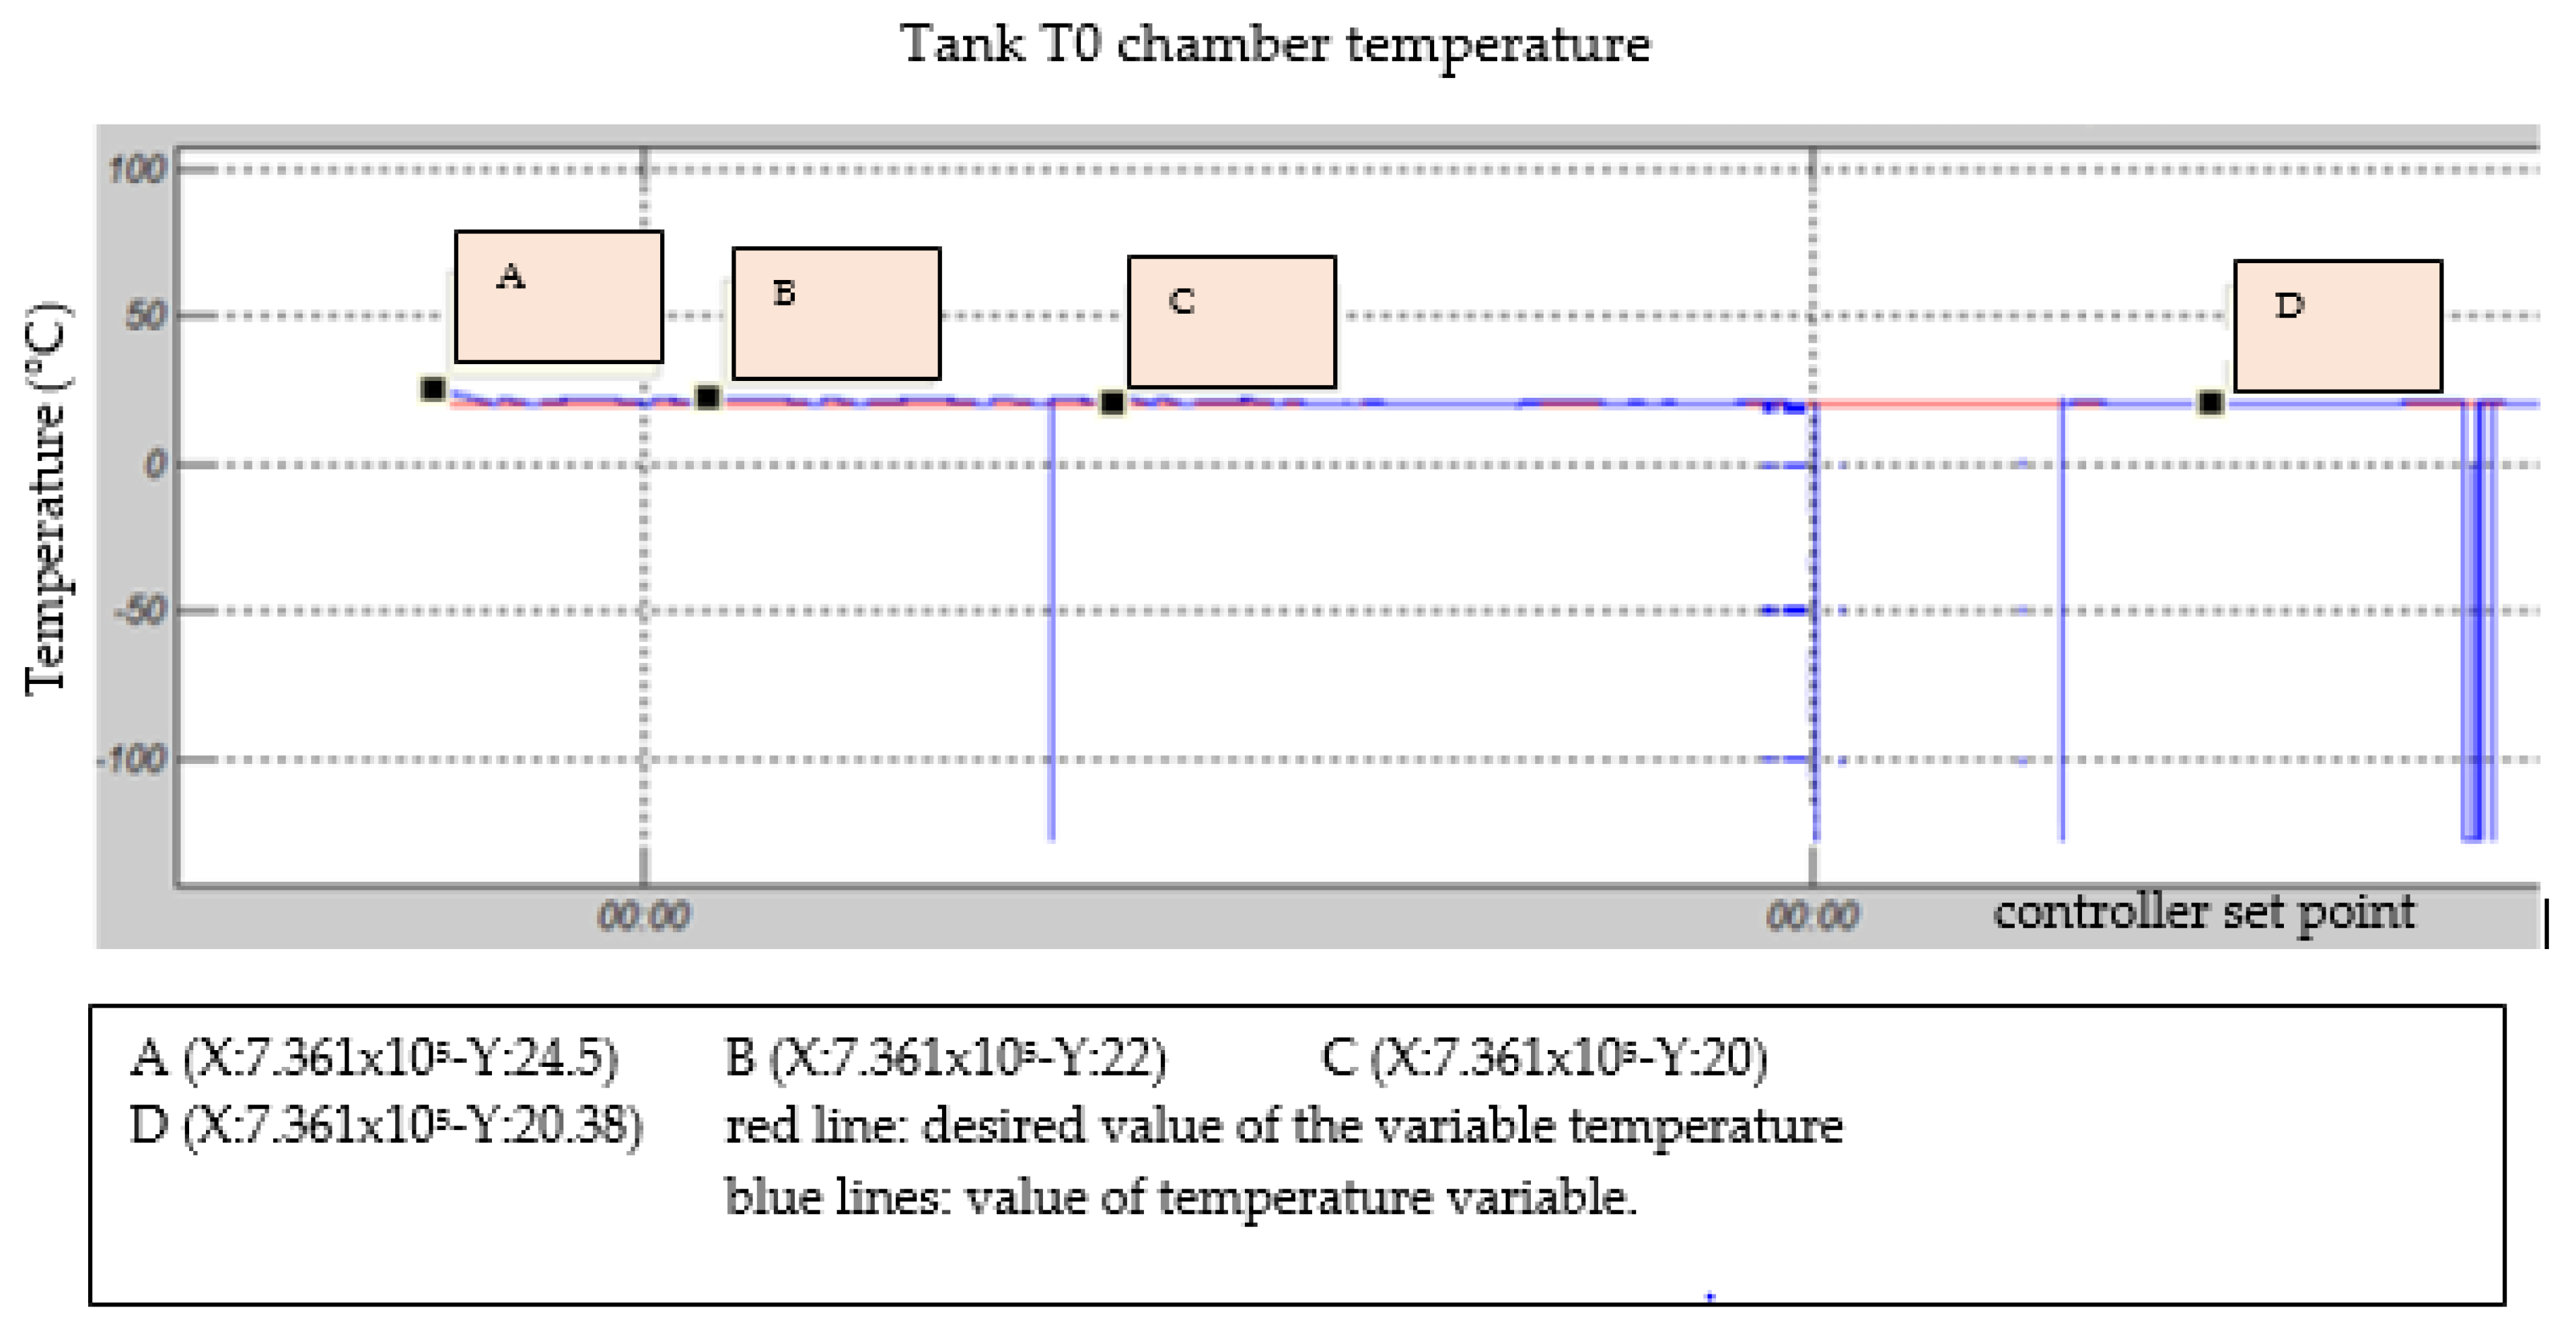
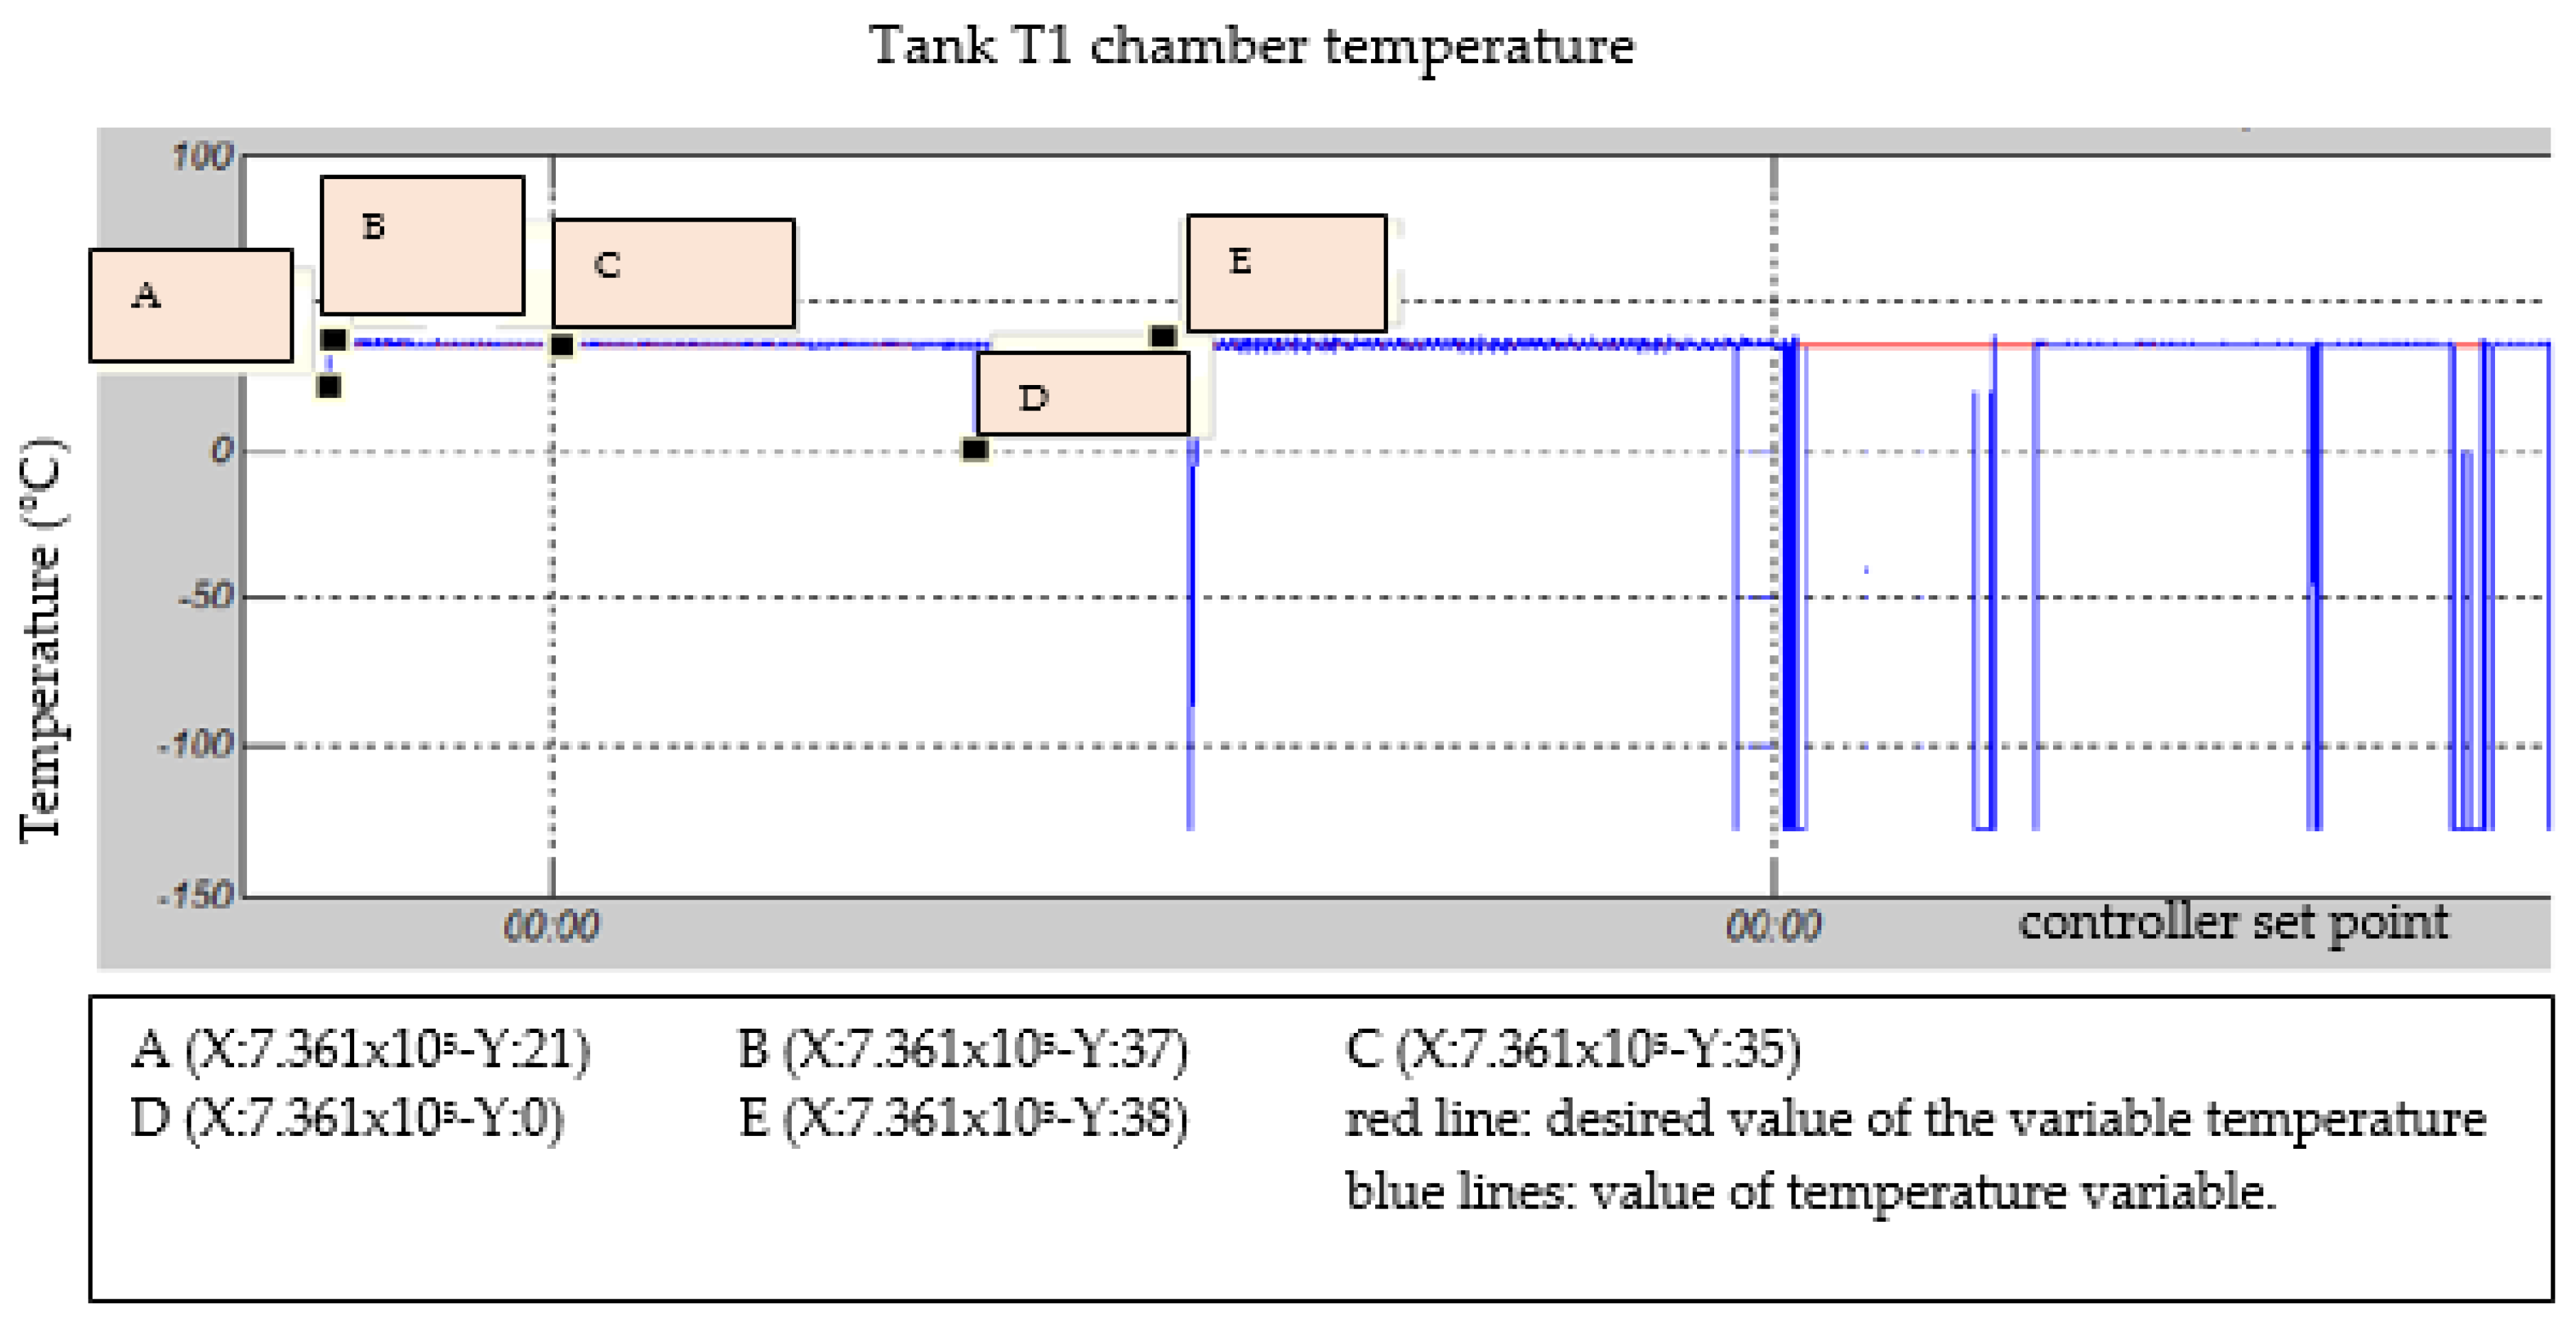
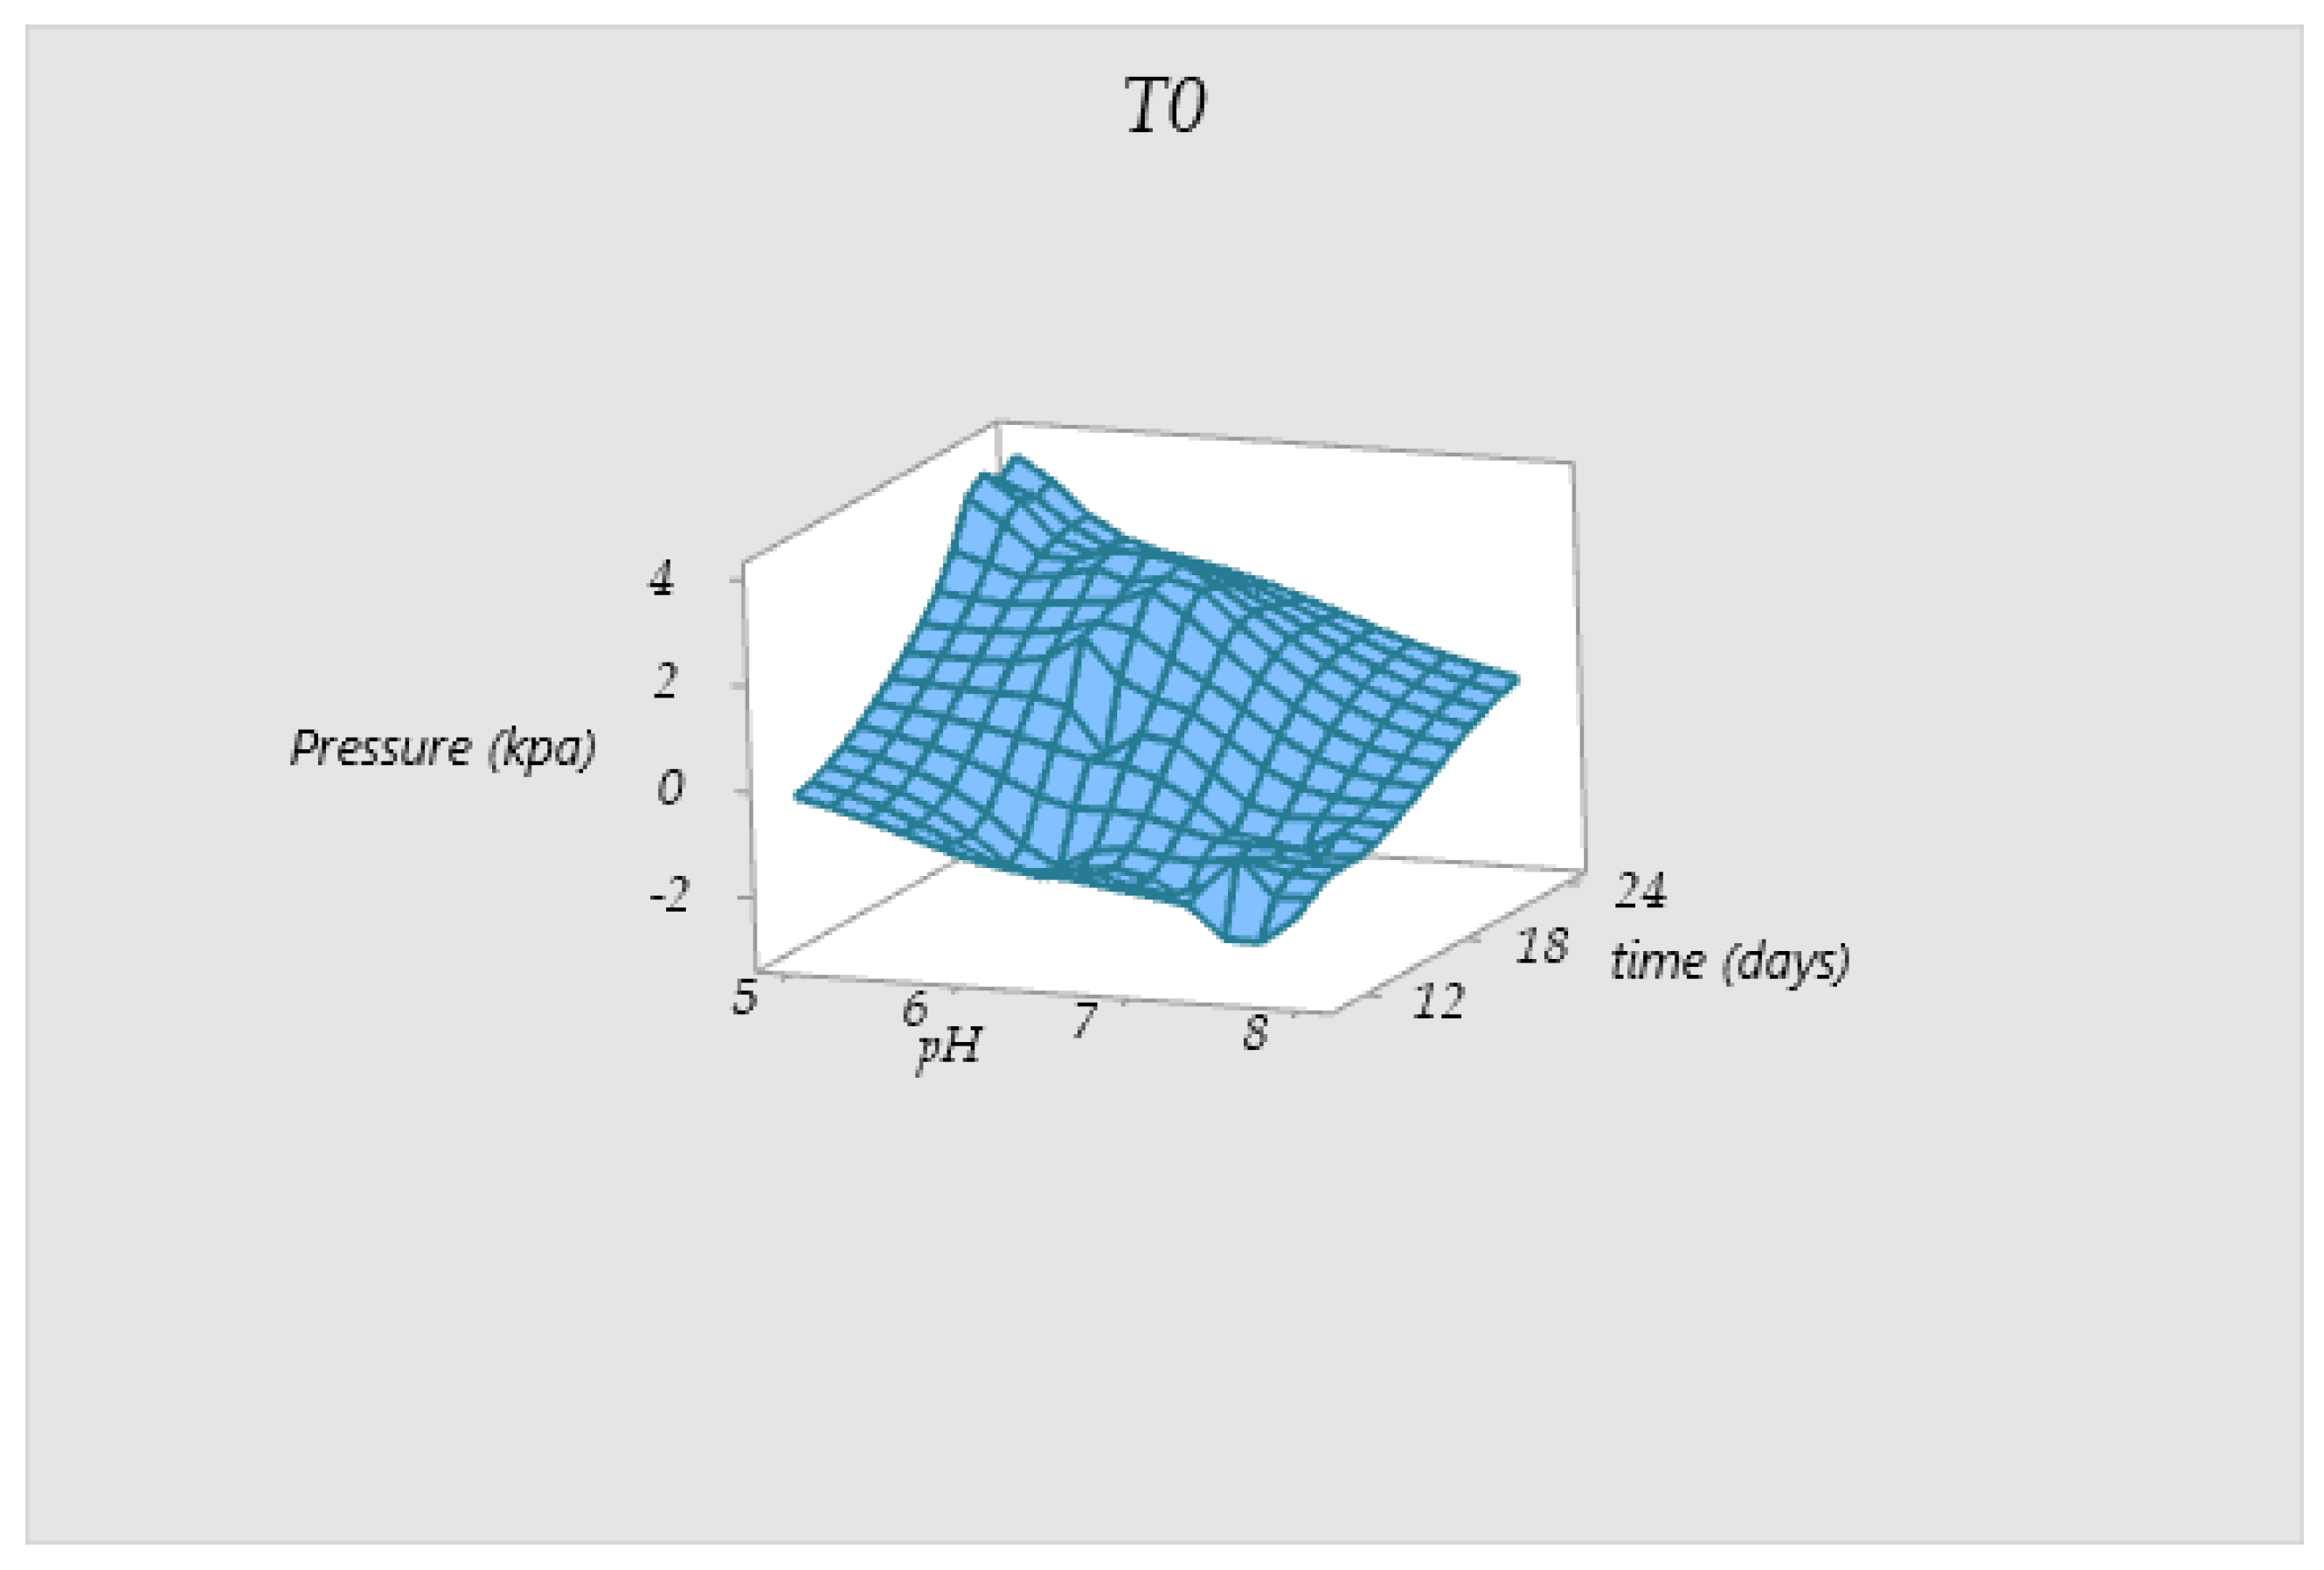
The gas pressure value in biodigester T1 exceeded the pressure value in biodigester T0 by 83%, because the temperature in the water chamber of biodigester T1 exceeded that of biodigester T0 by 36.84%, which shows the influence of the substrate temperature for biogas production.
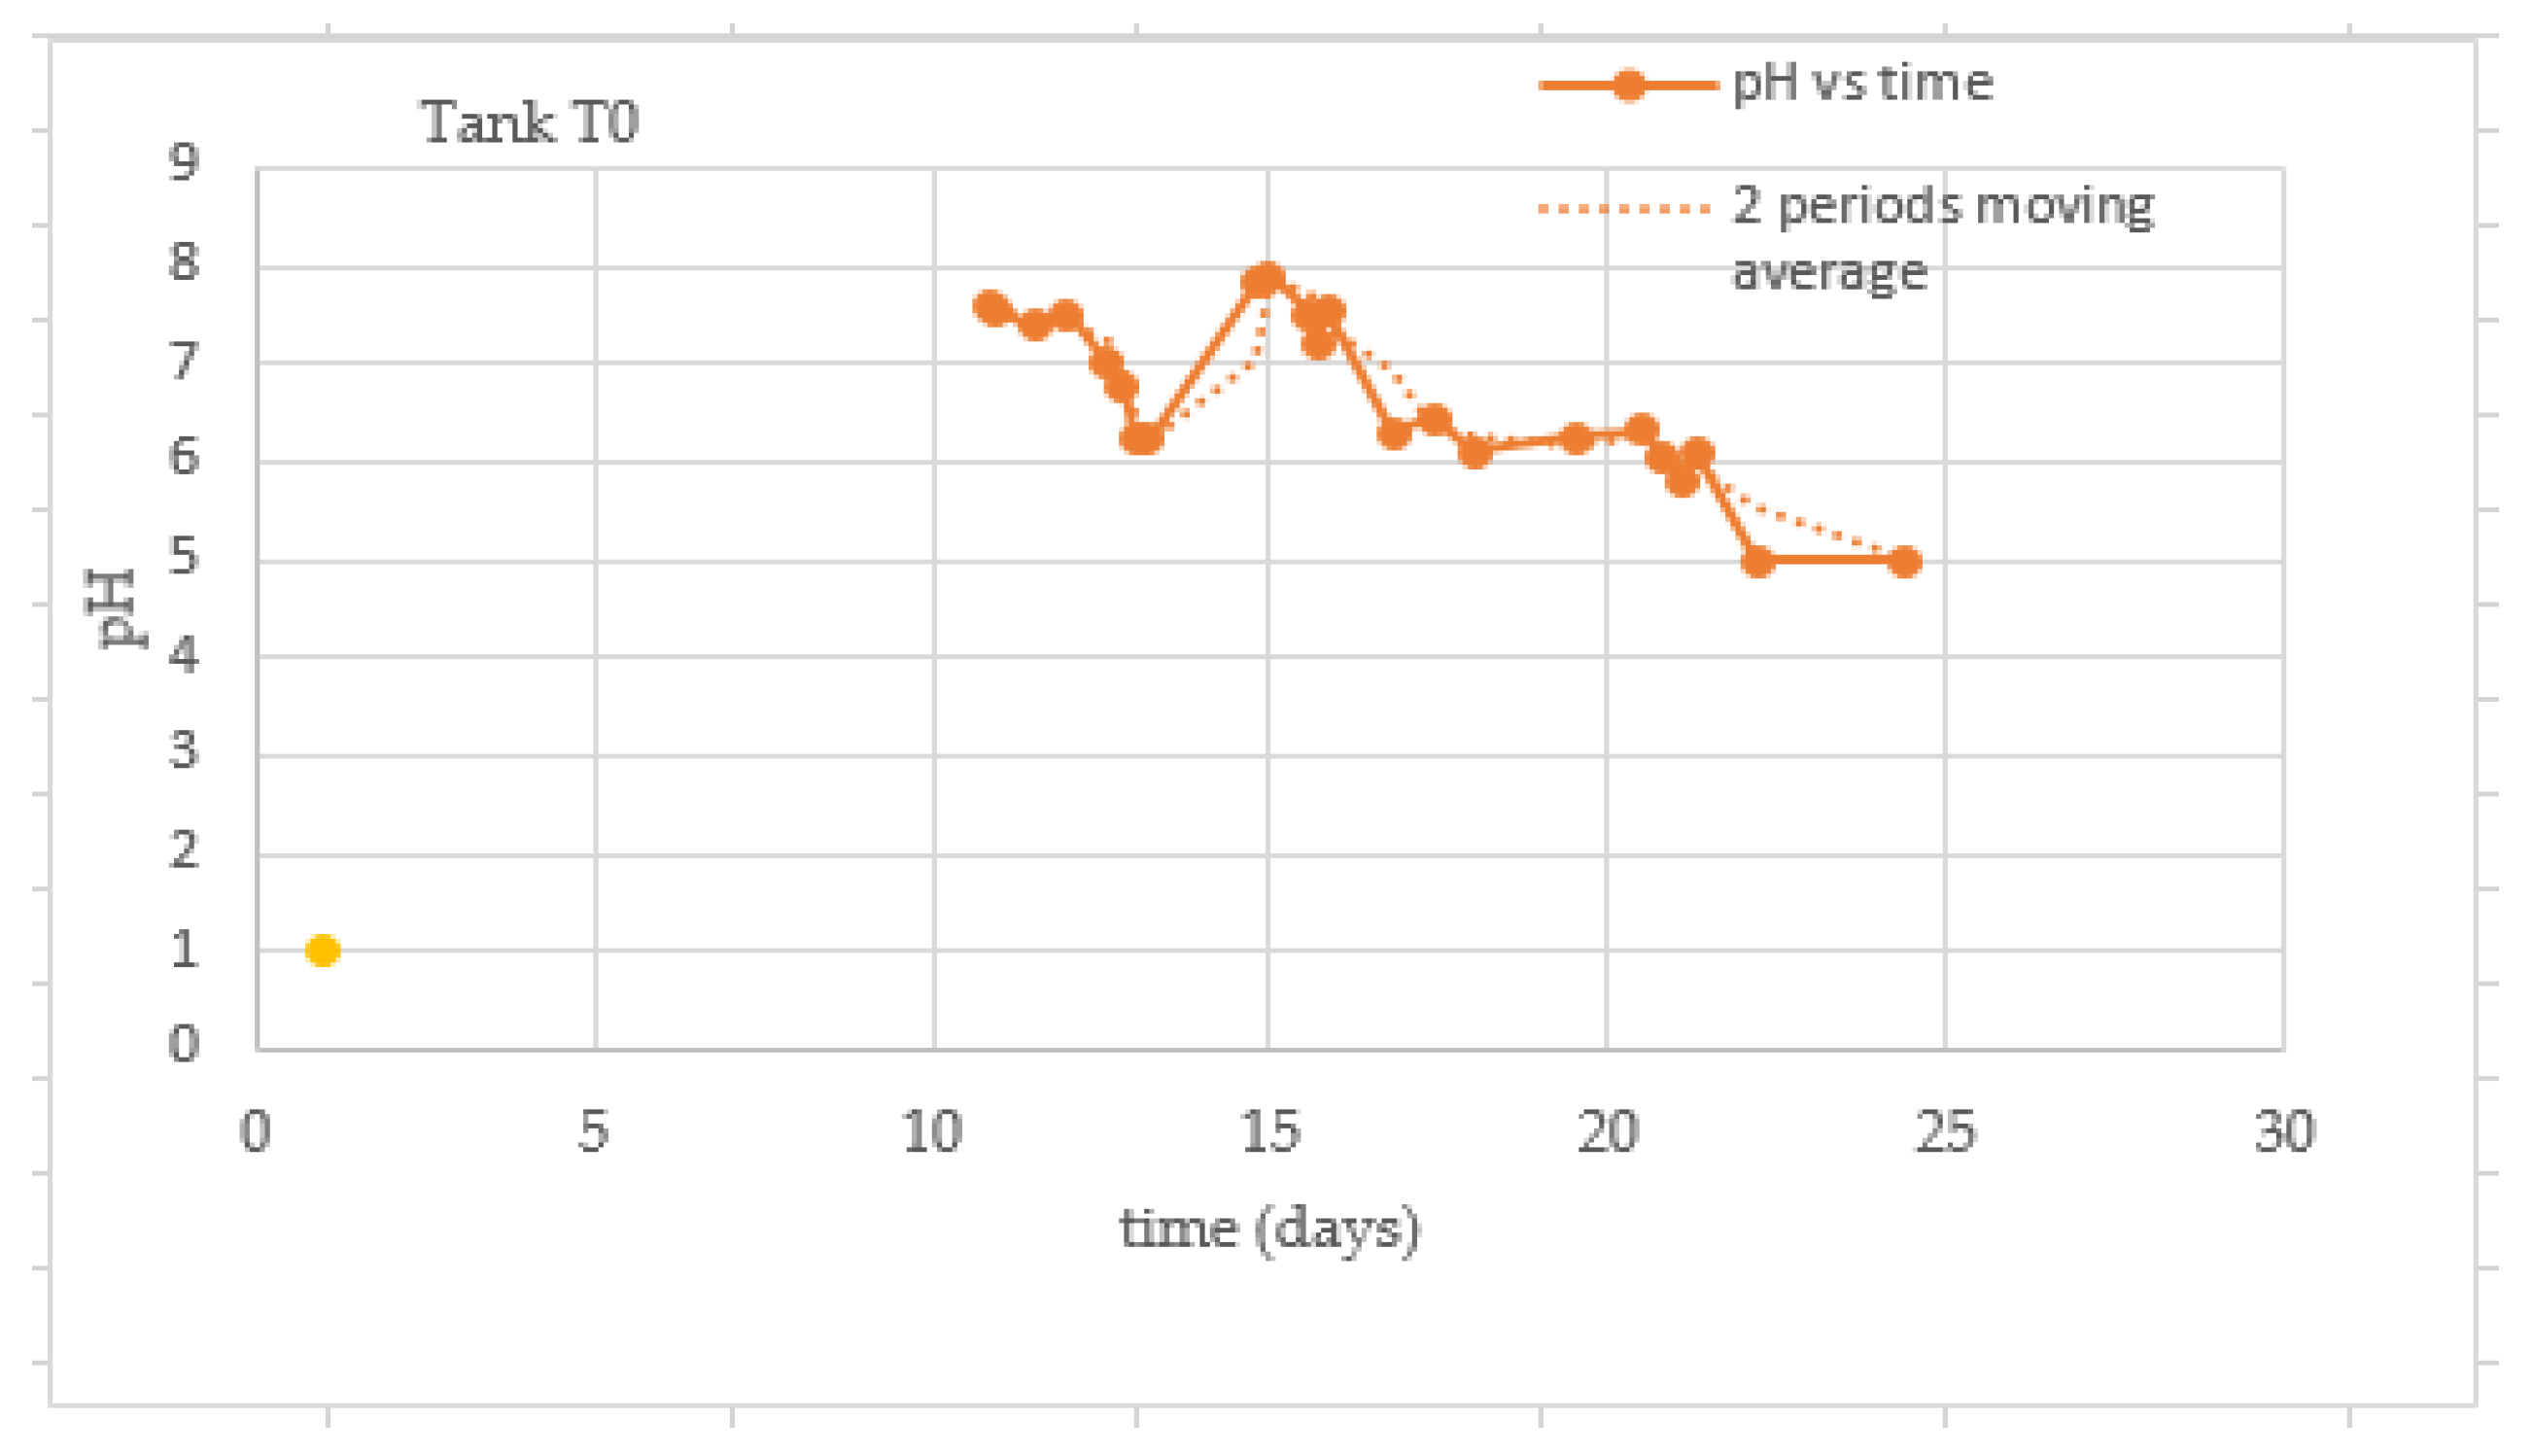
The trend lines of the pH vs. time graphs for both tanks showed the same behavior due to the buffer effect of the blood and showed an approximate non-harmonic oscillatory movement function.
The production of acidogenic bacteria in the T0 biodigester was much lower than that of the T1biodigester, since in this, the temperature of the experiment was kept constant at a value approximately 16 °C lower than the temperature in the T1 tank, which makes interrupted the process before the methanogenic phase.
There was a direct relationship between the average degradation time of organic matter of approximately 25 days and the high quality of the residue in the T1 biodigester and inverse in the T0 biodigester; the amount of gas-producing bacteria in the T1 was greater than in the T0, which means that the demand for food also was, and this resulted in a better quality of residue.
The low C/N ratio of the blood was compensated for by its buffer system—composed of bicarbonate, hemoglobin, proteins and phosphates—with small variations in pH, a longer life of methane gas-producing bacteria and a longer retention time.
5. Recommendations
Several experiments should be carried out with the same substrate and different constant working temperatures to find the optimal production temperature for methanogenic bacteria in the mesophilic range.
The concentrations of the components of the blood buffer system should be broken down through clinical biochemistry practices, which will reduce uncertainty in the results of biochemical studies of buffer solutions.
A system that separates the gas product of anaerobic digestion into portions should be implemented, in which each portion could be analyzed by a chromatograph at each stage.
An experiment that allows the identification of the behavior curve of the substrate digestion and the value of the constant temperature at which the anaerobic digestion is carried out should be designed.


