Article

Solar Radiation Components on a Horizontal Surface in a Tropical Coastal City of Salvador

by
Leonardo Rafael Teixeira Cotrim Gomes
1,*,
Edson Pereira Marques Filho
1,
Iuri Muniz Pepe
1,
Bruno Severino Mascarenhas
1,
Amauri Pereira de Oliveira
2 and
José Ricardo de A. França
3
1
Interdisciplinary Center for Energy and Environment, Federal University of Bahia, Salvador 40170-115, BA, Brazil
2
Department of Atmospheric Sciences, Institute of Astronomy, Geophysics and Atmospheric Sciences, University of São Paulo, São Paulo 05508-090, SP, Brazil
3
Institute of Geosciences, Federal University of Rio de Janeiro, Rio de Janeiro 21941-916, RJ, Brazil
*
Author to whom correspondence should be addressed.
Energies 2022, 15(3), 1058; https://doi.org/10.3390/en15031058
Submission received: 24 December 2021 / Revised: 19 January 2022 / Accepted: 26 January 2022 / Published: 31 January 2022
(This article belongs to the Section A2: Solar Energy and Photovoltaic Systems)

Abstract

:
Renewable energy must be prioritized by humankind, mainly if there is an expected increase of 50% in energy consumption by 2030 and climate change scenarios are also confirmed. Urban areas consume 70% of the available energy on the planet. Brazil, the largest country in South America, concentrates more than 85% of its population in urban areas, facing a challenge to increase the renewable power plants in its energy matrix. This work presents the solar radiation components behavior for the city of Salvador to contribute with initiatives for the use of solar energy resource. Firstly, a radiometric platform was implemented to obtain direct measurements of global ( E G )   and diffuse ( E D F )   components of incoming solar radiation at the surface. The knowledge of E D F is an important requirement to support photovoltaic system projects, and there is no information on direct measurements of this component in the State of Bahia. The diffuse radiation measurement device (DRMD) was designed and built for this purpose. The measurements of solar   radiation components performed in this research were submitted to a specific quality control, statistically analyzed and used to evaluate the performance of different empirical models to represent the behavior of E D F   in the tropical coastal city. The results demonstrate the potential to explore solar energy in the city of Salvador, with annual values of sunshine higher than 2200 h   year 1 and average daily intensities of E G   and E D F   equal to 18.7 MJm 2 day 1 and 7.35 MJm 2 day 1 ,   respectively. The analysis of the diurnal cycle shows that E G   in summer reaches a maximum of 4.2 MJm 2 h 1 and in the rainy season it reaches a minimum of 3.7 MJm 2 h 1 , both at noon, and in summer the E D F h is 35% of the E G h and it is 46% in the rainy season.

1. Introduction

Energy is one of the most important resources available on Earth and humankind is clearly dependent on it to survive [1]. The urban areas are responsible for spending about 70% of the total energy generated in the world. These regions require large water reservoirs in order to produce electricity and stock fresh water for their own consumption [2]. The increase in energy demand and the constant fossil fuel exploration contribute to an unsustainable global energy production level [3,4].
Up to 2030, it is expected that the energy demand will increase more than 50% throughout the world [5]. At first, the COVID-19 pandemic changed the global energy consumption pattern, since billions of people on the planet changed their way of working and living, since most people were forced to slow down or even stop their work activities in order to contain the spread of the virus [6]. On the other hand, when the economy kicked off a recovery status post-COVID-19 in the first year, a pretty quick energy consumption increase was observed in China and other high and middle-income countries [7].
In the last decades, the investment and development of alternative technologies to produce clean energy from renewable resources with lower environmental impacts than the traditional ones are obtaining greater attention [8]. According to the “Renewable Energy Policy Network for 21st Century Report” the interest in renewable energies increased in 2019 and the idea spread around the world in order to get net-zero emissions until 2050 [9]. Nowadays, the most promising and potentially feasible renewable resources are solar and wind power [10]. The photovoltaic systems’ (PV) implementation has been expanded at a rate of 40% considering the same previous period [11].
Brazil is the largest country in South America, with the 9th Gross Domestic Product (GDP) in the world, covering an area of 8.5 million square km with a population of over 210 million people [12]. Hydropower is the predominant energy resource installed considering the Brazilian energy matrix and it is responsible for 60% of the mix, while wind and solar power represent only 8.6% and 1%, respectively [13]. Considered as a renewable energy source, the hydropower plant causes some environmental impacts also, with large reservoirs’ construction and the maintenance of them, which contributes to increasing the methane and carbon dioxide emissions, directly affecting the biodiversity and the climate conditions [14,15,16].
The northeast of Brazil (NEB) is one of the most critical regions by the hydric viewpoint, with only 4% of freshwater reserves combined to endure prolonged periods of drought [17]. Future climate projections for NEB suggest a temperature increase and an accumulated precipitation decrease, which may significantly impact the reduction of water reserves, reducing the power generation capacity [18,19]. However, NEB has the highest annual averages of surface solar radiation observed in Brazil due to climatic conditions and its geographic location, which is between the Equator and 18.5° of latitude [20].
The research was performed at Salvador City, the capital of the Brazilian State of Bahia, located in the East of NEB, with an estimated population of 2.9 million, possessing 692.818   Km 2 of area, with the 10th Gross Domestic Product (GDP) of Brazil [12]. Originally inserted in the Atlantic Forest biome, the city topography is characterized by a huge geographical relief and low altitude, with a mix of urban and natural areas along the shore of the South Atlantic (SA) next to the “Todos os Santos” Bay (TSB).
The disorderly urban occupation of the metropolitan area of Salvador City resulted in the suppression of large areas of primary vegetation [21], and spends a considerable amount of energy, around 6.2 TWh per year [12,22]. The demand for electricity continues to grow and it is fundamental to expand the usage of renewable energy in order to reduce the dependence of the climate change and the consume expenditure, since the buildings are responsible for 30% of the world’s total consumption of this resource [23]. The Salvador City situation becomes worse during the summer, when the consumption of electricity increases due to the usage of air conditioner at offices, industries and homes [24,25,26].
Knowledge about solar components’ behavior in Salvador can help to decide which are the better parameters to design and install the PV panels [27].
Brazil still has a few radiometric stations performing measurements from components of the solar radiation balance, and many of them only have data on global radiation ( E G ) and sunshine ( S ) available. The knowledge levels of diffuse radiation E D F incidents on tilted surfaces represent an important requirement that provides support for applications in hydrological, architectural (thermal comfort), urban planning and micrometeorological studies, as well as projects of solar energy conversion, designs for solar collectors and determining the optimal tilt elevation angle and direction of photovoltaic panels in order to maximize the system performance [27,28,29]. Therefore, information of E D F   is limited and not available for the entire Brazilian territory [30]. The only available estimates of diffuse radiation for Bahia State and Salvador City were obtained from satellites [31]; thus, we have no information-related E D F   measurements collected directly by surface stations. The acquisition of E D F measures is not trivial, since they are reasonably expensive and with limited availability; therefore, many empirical correlations models have been developed for it as the most feasible alternative [32,33].
The evaluation of the solar radiation balance components has been performed over the last decades in Brazil. One of the first works to investigate the seasonal behavior of E G , E D F   and direct E D R   solar radiation components for all Brazilian territory, was realized by Pereira et al. (1996) using a radiative transfer model derived from satellite measurements, finding out a maximum of E G daily value bigger than 20   MJm 2 day 1 over the NEB during the winter [31]. Martins et al. (2012) used an updated version of the model proposed by Pereira et al. (1996) and demonstrated that the NEB shows average annual values of E G close to 23.4 MJm 2 day 1 in drought areas and 18.7 MJm 2 day 1   near to oriental NEB [34]. The results obtained by Pereira et al. (2017) in the Brazilian Solar Atlas (BS-Atlas) confirm that NEB has a high solar radiation power potential available, and the city has an incredible potential to generate electricity by solar energy resource according to Brazilian Solar Atlas (BS-Atlas), which estimates a value of 20.0 MJm 2 day 1 for the annual average of daily global radiation [20]. These estimates were generated by the BRASIL-SR model, and they were validated against the collected observational measurements provided by surface stations from National Meteorology Institute (INMET).
The hourly and seasonal evolution of the components of the solar radiation balance based on radiometric measurements collected in São Paulo City were investigated by Oliveira et al. (2002) [35]. The results acquired for E G in summer (rainy season) were 18.41 MJm 2 day 1 , 55% over the winter (dry season) results. At the same time, the E D F values obtained reach a maximum of 9.52 MJm 2 day 1 in summer and a minimum of 4.1 MJm 2 day 1 in winter, matching with the estimates obtained by Pereira et al. (1996) [26]. Oliveira et al. (2002) suggested that cloudy weather and atmospheric pollution produce a strong influence on the scattering of solar radiation and this hypothesis was confirmed by Codato et al. (2008) [36].
In a similar work, conducted in Rio de Janeiro City, Marques Filho et al. (2016) got a daily maximum value of E G equal to 23.89 MJm 2 day 1 in summer and 10.78 MJm 2 day 1 in winter, presenting superior values in comparison with the same analysis performed in Sao Paulo City, although the cities are part of the same latitude range. The E D F component reaches a maximum of 7.34 MJm 2 day 1 in summer, which is twice more than the values obtained in winter. In both works, the cloudiness and marine aerosols influence the components and balance of solar radiation on the surface [37].
The seasonal behavior of E G for Alagoas (NEB State) was presented by De Souza et al. (2016) [38]. Based on radiometric measurements collected in three different experimental sites, a new coefficient for the Angström–Prescott empirical model was proposed [39] that uses information of S to predict a seasonal evolution of E G and can be applied to monthly periods with no temporal dependence for successive values of radiation [40]. These models reach better estimates, but the adjusting coefficients get a high variability.
The main objective of this work is to describe the seasonal variation of daily and hourly values of incoming solar radiation components, mainly E G , E D F and E D I R , at the surface in Salvador City, using in situ measurements and empirical models, because Salvador has a large potential for solar radiation, which has not been fully documented and confirmed in the literature using in situ observations. Due to the lack of surface measurements of E D F , for the first time, a specific equipment, known as diffuse radiation measurement device (DRMD), was designed and built for this research, to perform direct measurements of E D F in the City of Salvador, and continues in operation at the Federal University of Bahia (UFBA), contributing to provide measurements of the diffuse component to the solar energy research field.
The present research covers the construction of a diffuse radiation measurement device, experimental data collection on the surface, quality controls of radiation measurements, statistical analysis and predictions of solar radiation components using predict models. The results found in this work give information about the behavior of radiation components, sunshine duration during the year and the seasons and climatic characterization of the city that can be used in a infinitude of analyses related to solar radiation and photovoltaic generation; in addition, the empirical models developed here performed very well, and they can be used to estimate the diffuse component of solar radiation in other regions throughout Brazil with similar climate and characteristics to Salvador City.

2. Materials and Methods

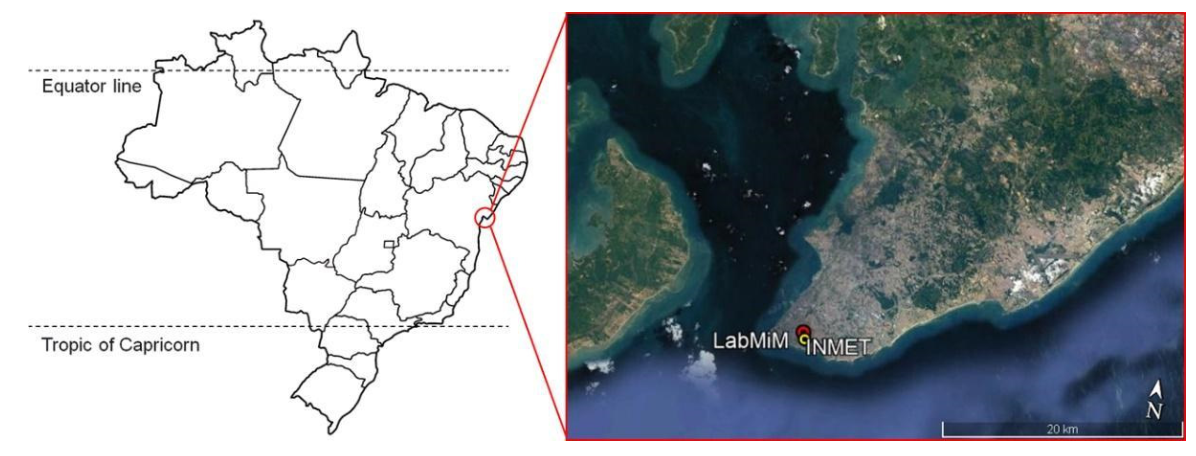
2.1. Site, Instrumental and Database

In this work, solar radiation components and standard meteorological measurements collected by INMET and Micrometeorology and Modeling Laboratory (LabMiM) located in Salvador City were used. The LabMiM is located in a suburban area, with buildings up to four floors, surrounded by medium-sized vegetation, installed on top of a 26 m high building of the Center for Energy and Environment (CIEnAm), within the Ondina Campus of Federal University of Bahia (UFBA). The INMET meteorological station is located in the parking area, which is predominantly vegetated, and follows the standards recommended by the World Meteorological Organization (WMO). The distance between the INMET and LabMiM stations is only 0.6 km, with a vertical elevation of 46 and 48 m above mean sea level (AMSL), respectively. For instance, the altitude correction was performed in thermodynamic variables at LabMiM, based on extrapolation of dry adiabatic lapse rate down to the surface.
The climate characteristics for Salvador City were evaluated based on daily and hourly data, collected from 2010 to 2019. The climate normal (1981–2010) was provided by INMET and confronted with the seasonal estimates obtained from the measurements collected during the last decade. The location of each station, the variables collected and the observational periods are shown in Figure 1 and Table 1.
The LabMiM instrumental set is systematically calibrated (every 6 months) and the maintenance is done weekly, with the objective to grant the proper functionality as well as to preserve the quality of the collected measurements.
In order to obtain directly measured data from the E D F component in Salvador City, we developed and manufactured a device named the diffuse radiation measuring device (DRMD) since 2018, based on Melo–Escobedo–Oliveira shadow-ring measuring method (MEO) presented by Dal Pai et al. (2016) [41]. Some design changes were implemented as follows: (i) latitude (ϕ) adjustable mechanism, with a range of 0 to 45°; (ii) completely assembled in structural aluminum, discarding the use of welds, with reduced weight and increased resistance to weathering corrosion, as well as the physical properties to provide mechanical strength; (iii) implementation of stainless steel threaded bar, bearings and shafts to support and perform horizontal movement of the pyranometer base; and (iv) use of a quick mechanism to turn the lever and lock the shadow ring. Figure 2 presents a 3D model and the manufactured device in operation.
All integrated values of global solar radiation at the horizontal surface are indicated by E X Y and expressed in megajoules per unit of area ( MJm 2   time   interval 1 ). The subscript X are   G , D F , D R and T , indicating E G , E D F , E D R and extraterrestrial radiation ( E T ) , respectively. The superscript Y are h and d indicating the time interval of integration of 1 h and one day, respectively.
In order to ensure the quality of the collected measurements, a visual inspection of each time series was performed to remove physical inconsistencies generated by the data acquisition system. Statistical criteria based on absolute values and confidence intervals were applied to remove spurious data [42].
The first step consisted in keeping the hourly radiation data. For daily data, months with less than 80% of measurements were discarded. After that, we kept 71.2% of the raw data. This step it is important to keep the analysis consistent, since sometimes the system can have a lack of communication between the sensor and the data logger and must be guaranteed that, for each measurement of E G related to E D F at the same time, because the analysis depends on the relationship between both solar radiation components.
Additionally, the quality control procedure that was used was based on some criteria proposed by Younes et al. (2005) and Journee et al. (2011), in order to exclude spurious data caused by some errors such as the following [43,44]: operation-related problems and errors; complete or partial shade-ring misalignment; dust, dew, water droplets, bird droppings, etc.; incorrect sensor levelling; shading caused by building structures; electric fields in the vicinity of cables; mechanical loading of cables; orientation and/or improper screening of the vertical sensors from ground-reflected radiation; and station shut-down.
After the first step the quality criteria of Equation (1) were applied. The criteria consist of keep the radiation components measurements where the elevation solar angle ( α ) > 2 ° , in this case, the total of the measures kept from the initial raw data was 69.5%.
α > 2 ° ,
A comparison was realized between the hourly global radiation ( E G h ) and theorical hourly extraterrestrial radiation ( E T h ), because the first must have lower values than ( E T h ). Equation (2) was used to perform these criteria, where K T h is the hourly clearness index. After this process, the total of the measures kept from the initial raw data was 68.3%.
K T h = E G h E T h < 1 ,
This step is similar to the previous steps. The main difference is the comparison of the hourly diffuse radiation E D F h with ( E T h ). In this case the quality control for E D F h is given by Equation (3). After the control the total of the measures kept from the initial raw data was 67.8%.
E D F h E T h < 0.8 ,
This last step of the quality control consists of comparing the hourly diffuse radiation E D F h against the hourly global radiation ( E G h ) . The test is derived from the relation E G h = E D I R h + E D F h , where E D I R h is the hourly direct radiation. After the step, the total of the measures kept from the initial raw data was 67.3%.
E D F h E G h < 1.0
The E T component was estimated analytically from the equations proposed by Iqbal (1983), considering the solar constant equal to 1.366 Wm 2 [45,46]. After quality control was applied, 67.3% of the radiometric measurements were considered valid.
To verify the consistency of the tests, the measurements of E G d collected by INMET were compared to those collected in the LabMiM (Figure 3), and the last one showed a greater control and data traceability than the first one due to the constant maintenance and verification of the measuring instruments. The behavior of E G d in both experimental sites is similar, with a linear fitting near to the identity function (0.98) and a high coefficient of determination (0.99). The smaller standard deviations of LabMiM (horizontal bars) show the representativeness of this dataset in comparison to INMET (vertical bars). The average block indicates that INMET underestimates E G only for values greater than 25   MJm 2 day 1 , which represent 13% of the measurements in the period. The scattering presented for INMET measurements when E G d assumes values between 6   MJm 2 day 1   and 10   MJm 2 day 1 , occurs for α < 5 ° , and it should be occasioned by obstacles around the sensor.
The measurements of E D F h collected in Salvador City only started in August of 2018 (Table 1) and, therefore, this sample time is not enough to statistically characterize the climatic condition observed. In this case, the alternative found was to use empirical models [32,33] to represent the behavior of E D F in the related city. In the next section, some empirical models of the E D F h   proposed by the literature will be discussed.

2.2. Diffuse Empirical Models

The accurate determination of the E D F values is an essential precondition in the construction of photovoltaic system design and to evaluate the performance of photovoltaic panels [47,48]. However, E D F measurements are difficult to obtain, and they are not part of the worldwide meteorological network. In this case, to estimate the hourly, daily and monthly E D F values in different locations on Earth, it has been proposed to use several empirical models [49]. Some existing empirical models represent the relationship between clearness index K T and diffuse fraction K D through the linear, polynomial, logarithmic or logistic sigmoidal functions that use one or more input parameters [32].
The pioneer Liu-Jordan (1960) work established a function based on values of K T to represent the behavior of K D , and to determine the intensity for E D F on a horizontal surface. The coefficient K T , defined as the ratio E G / E T , provides a measure of the effects of the local atmosphere on the incident solar radiation on the surface [50,51]. When K T 0 , the sky condition is defined as a cloudy sky with a high portion of E D F . On the other hand, in a clear sky condition, K T 1 and there is a large fraction of E T   the surface, with a predominance of E D R .
The E D F component is an important fraction of E G and a key variable in solar energy evaluation [52]. The coefficient K D , defined as the ratio of E D F / E G , has great importance in the assessment of the effective solar radiation collected by a surface [53,54]. When K D 0 , means that the fraction of E D R is predominant over the E D F . On the other hand, when K D 1 , a large fraction E D R is being prevented from reaching the surface, with the predominance of E D F .
The polynomials derived by linear regression fit were able to model the daily and monthly values of diffuse radiation satisfactorily [35]. The main advantage is how easy it is to obtain the input parameters [55]. Otherwise, the models are not applicable for all intervals of K T , and they do not represent the variability observed in the Liu-Jordan diagram.
The sigmoid logistic function is statistically more significant in comparison with other correlation models to represent the K D   as a function of K T , and it provides a physically reliable estimate for extreme values of the clearness index, though using fewer parameters than other tested models [56].
The Marques Filho et al. (2016) model (Marques Filho) proposed the following sigmoidal model to represent the behavior of the K T and K D radiation fraction observed in do Rio de Janeiro City [37]:
K D = 0.13 + 0.86 1 1 + e x p   6.29 + 12.26 K T   ,   0 K T 1.0
The main disadvantage of Marques Filho model is that it does not reproduce the observed variability of K D , which used K T as the only input parameter [37].
Since the K D has a direct relationship with the sky condition, to improve the accuracy of empirical models, it is necessary to evaluate other parameters that include effects of cloud (cloudiness and cloud type), traditional meteorological variables (air temperature, relative humidity and atmospheric pressure observed at the surface) and air pollution (concentration of particulate matter observed at the surface) [57].
The Ridley et al. (2010) model (Ridley) is a multiple predictor empirical model developed based on a sigmoidal function that represents better (low) variability of K T in relation with K D , mainly for Southern Hemisphere locations, which has been used as a universal predictor model for E D F , according to Equation (6) [58].
K D = 1 1 + e 5.38 + 6.63 K T h + 0.006 A S T 0.007 α + 1.75 K T d + 1.31 ψ
where K T h is the hourly clearness index, K T d is the daily clearness index, α is the apparent solar time ( A S T ) and the persistence of E G level ( ψ ) is used as predictors.
The Lemos et al. (2017) model (Lemos) was based on measurements of nine radiometric stations distributed throughout Brazilian territory, using the adjusted Ridley model in order to provide better estimates of E D F , according to Equation (7) [30].
K D = 1 1 + e 4.41 + 7.87 K T h 0.088 A S T 0.0049 α + 1.47 K T d + 1.10 ψ
In this work, the sigmoidal models proposed by Ridley et al. (2010) [58], Marques Filho et al. (2016) [37] and Lemos et al. (2017) [30] are evaluated to determine which model better represents the K D behavior in Salvador City.

2.3. Statistical Indicators

By evaluating the performance of the models when reproducing the values of E D F ,   we used a set of statistical indicators presented by Gueymard et al. (2014) and Funabashi (2016) [59,60].
The coefficient of determination ( R 2 ) is a statistical measure of how close the data are to the fitted regression line. In this measure, 0 indicates that the model does not explain the variability of the response data at all, while a value around and at 1 means the regression actually fits the observation [61,62].
R 2 = i = 1 n   p i p m o i o m i = 1 n   p i p m 2 o i o m 2 2
where p i and o i   are the predicted and observed values, respectively, while o m and p m represent the average values of o i and p i , respectively. Additionally, n denotes the entire test data amount.
Mean bias error/difference (MBE) captures the average bias in the prediction. The test of MBE provides information on the long-term performance of models studied. A positive MBE value gives the average amount of overestimation in the calculated values and vice versa. In general, a small MBE is desirable. It should be noted, however, that over-estimation of an individual observation will cancel out the underestimation in a separate observation [63].
M B E = 100 / o m i = 1 n     p i o i
The root mean square error (RMSE) denotes the root of the ratio of the square of the two norms of the error vector to the number of samples. RMSE provides information on the short-term performance of the models as it allows for a term-by-term comparison of the actual deviation between the calculated value and the measured value [64,65].
R M S E = 100 O m i = 1 n     p i o i 2 N 1 2
where N represents the number of observations.
The t s t a t i s t i c ( T S ) is considered a robust and great indicator used to rank the modeled results. When the ( T S ) value approaches zero, it means that the probability of significant difference between the analyzed values is lower [66,67]. To obtain the indicator there is a combination of MBE and RMSE. The t s t a t i s t i c is defined by the following:
T S = N 1 M B E 2 / R M S E 2 M B E 2 1 / 2
In order to compare and evaluate the models, particularly to determine which models are more accurate, the index of agreement ( d ) was developed to measure errors from prediction models and to promote the standardization of measurements. The parameter can be easily interpreted by making cross-comparisons for a variety of models. When d 1 , this indicates a great alignment between prediction and observational values; otherwise, when d 0 , there is a complete misalignment [68,69]. The index of agreement is calculated by the expression:
d = 1 i = 1 i = n     p i o i 2 i = 1 i = n     p i o m + o i o m 2

3. Results and Discussion
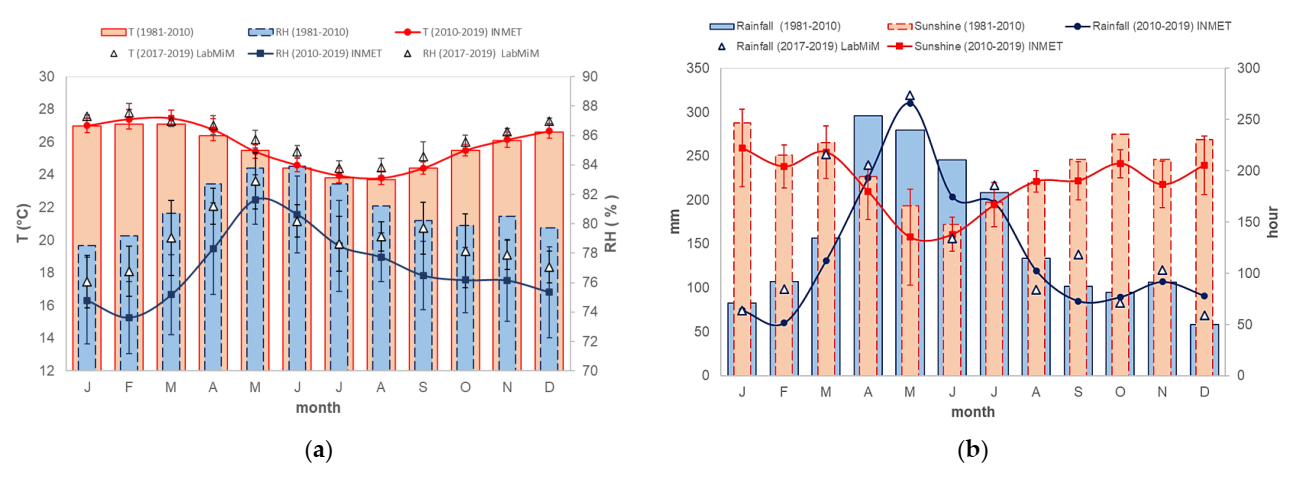
3.1. Climatology

According to Köppen–Geiger’s climate classification and climate normal estimates of the observations carried out for 30 years (1981–2010), the climate of Salvador City can be classified as Tropical Rainforest (Af) [70]. The annual amplitude of monthly average air temperature T 1981 2010 is small, with a minimum of 23.7 °C in August and a maximum of 27.1 °C in February and March (Figure 4a). The monthly average air relative humidity R H 1981 2010 is high throughout the year due to the vicinity of the South Atlantic (SA) ocean, with values higher than 78.5%.
The rainy season occurs between the months of April and July and explains 55% of the annual rainfall, which is equal to 1871 mm year−1 (Figure 4b). The minimum monthly accumulated rainfall occurs in December, with 58.1 mm   month 1 . The positions of the Intertropical Convergence Zone (ITCZ) and South Atlantic subtropical high (SASH), combined with positive anomalies of sea surface temperature (SST) and sea breeze circulation, are important factors to the maintenance of the rainfall regime in the eastern region of NEB [71,72,73].
The behavior of S 1981 2010 is according to the rainfall regime, with a minimum of 147.8 h month−1 in June (winter/rainy) and a maximum of 246.9 h month−1 in January (summer).
To evaluate the representativeness of microclimate characterized by observations performed in the period of 2010–2019 by INMET and 2017–2019 by LabMiM, the monthly evolution of T , R H , rainfall and S are compared with the climate normal.
In Figure 4a, it can be observed that the last years have been drier with summers that are slightly warmer, in comparison to the regular average climate. In both periods evaluated, the estimates of T 2010 2019 and T 2017 2019 fit with the regular climate.
The estimates of R H present a high variability, remaining under the values registered on regular climate. In recent years, the R H 2017 2019 was wetter, but it kept the estimates within the deviation bars.
The seasonal evolution of monthly accumulated rainfall in the period from 2010 to 2019 presents a similar behavior of regular climate, with values 9.5% less in the average annual accumulated rainfall (Figure 4b). For the period between 2017 and 2019, the variability of accumulated rainfall was higher than the others periods during the year, principally in March, when the accumulated was 60% higher than observed in the period between 2010 and 2017. The previous result of rainfall is in accordance with what was discussed to R H in Figure 4a.
The seasonal evolution of monthly accumulated rainfall in the period from 2010 to 2019 presents a similar behavior of regular climate, with values 9.5% less in the average annual accumulated (Figure 4b). For the period between 2017 and 2019, the variability of accumulated rainfall is higher than the other periods during the year, principally in March, when the accumulated was 60% higher than observed in the period between 2010 and 2017. The previous result of rainfall is in accordance with what was discussed to R H in Figure 4a.
The monthly average values of sunshine hours (Figure 4b) are minimum, between the months of April and July, matching with the rainy season and reaching a maximum level in summer (the driest season). Even by having a high concentration of water vapor in the atmosphere, the region has a great availability of sunlight between the months of September and March with values greater than 200   h / month 1 .
The observation performed for both periods (2010–2019 and 2017–2019) is in accordance with the regular average climate. The differences found, however, may be related to the recorded period and the use of the land INMET (vegetated area) and LabMiM (suburban area). The results found are also in accordance with the climate change predictions for the NEB, which show an increase in air temperature and a decrease in accumulated rainfall [18,19].

3.2. Evaluation of Empirical Models

As previously informed in this study, the sigmoidal empirical models proposed by Ridley et al. (2010) [58], Marques Filho et al. (2016) [37] and Lemos et al. (2017) [30] were applied to obtain E D F from K D for Salvador City. Ridley and Lemos are physically more consistent as they consider a total of five multiple predictors to represent K D behavior, which increases the accuracy of the estimated results [74,75]. On the other hand, Marques Filho developed a study for a coastal tropical region of Brazil with climate conditions similar to Salvador City. In order to verify what model better reproduces the behavior of K D h , we used the observational data of E G h and E D F h collected by LabMiM (Table 1).
The behavior of K D h estimates for Salvador reproduces the Liu-Jordan diagram, and all empirical models applied there are within the observational data range (Figure 5). Considering the multi-parameter of sigmoidal models, Ridley and Lemos best represent the observational variability, something that does not occur for Marques Filho due to the simplicity of this last model that only used K T h as an input parameter. At the same time, when the average error bars of the experimental data are compared, Lemos underestimates the values of K D h when K T h > 0.4 .
In order to evaluate the performance of the empirical models applied, the statistical indicators described in Section 2.2 are shown in Table 2. All evaluated models present R 2 close to 0.90, with the best result (performance) acquired by Ridley. The bias evaluation evidence that Ridley and Marques Filho overestimates the measures, with M B E equal to 4.05% and 8.22%, respectively, while Lemos measures in 6.13%, as discussed above (Figure 5).
Analyzing the R M S E results for the evaluated sigmoidal models, Ridley presents the lower value (22.15%), which is less than 3.51% and 2% of those obtained for Marques-Filho and Lemos, respectively.
In order to avoid an incorrect evaluation, based only on M B E and R M S E , and to confirm what is the best model according to statistical analyses, the T S statistical indicator was calculated. In this case, Ridley presents the lower value in comparison to Marques Filho and Lemos. Additionally, the estimates obtained from indicator d show that all evaluated models reach an expressive performance ( d > 0.98 ). Nevertheless, analysis of all indicators supports Ridley as the best overall ranking.
Although Lemos has been developed for Brazil, a large part of the experimental data used was collected in regions with distinct climate conditions and far from the coast, differently from Salvador City, which is located in a tropical latitude with a strong influence of marine sprays. These conditions are closer to those used by Ridley, which was developed for coastal cities of the Southern Hemisphere.

3.3. Solar Radiation Components

The seasonal evolution of the monthly average, collecting daily values of solar radiation components at the surface in Salvador City, is presented in Figure 6. The monthly average of E G d follows the pattern of variations of E T d , with a maximum equal to 23.21   MJm 2 day 1 in February and a minimum of 13.22   MJm 2 day 1 in June. Between the months of October and February, E G d presents a small variation with average values higher than 20.4   MJm 2 day 1 .
This result demonstrates a top potential season to explore solar energy in Salvador City since, in Brazil, the greater demand for energy occurs in summer [76,77]. In the rainy season, however, between April and June, the nebulosity increases (Figure 4b), and the values of E G d consequently decrease. In order to compare the seasonal solar radiation intensity in some locations of Brazil, the values of E G d to Salvador, Rio de Janeiro, São Paulo and Maceio City are presented in Table 3.
The minimum values presented in Table 3 are related to the rainy season (April–June) for Salvador and Maceió [30], while for São Paulo [35] and Rio de Janeiro [37] they are related to winter. Since the maximum values are presented in Table 3 and occur during summertime, in this period the electricity consumption trends change, and it has been registered in recent years that the demand peak in urban areas happens in the hours of maximum air temperature, between 13 h and 15 h, because of the use of air-conditioning [78]. In the rainy season, there is a considerable drop of E G d 14.83 ± 2.1   MJM 2 day 1 , with estimates 65% lesser than the observed in summer and near those of wintertime 14.98 ± 1.8   MJm 2 day 1 .
In order to verify the E G d values’ consistency, the model proposed by Angström–Prescott for solar radiation prediction was applied. In general, this model is used to obtain E G d a simple linear equation that uses S as the parameter, and coefficients a and b are estimated according to the ordinary regression approach [79]. The Angström–Prescott equation estimated for the city of Salvador is given by:
  E G d   E T d = 0.262 + 0.538 S S 0  
where a   and b are equal to 0.262 and 0.538, respectively, and where S and S 0 are the monthly average and maximum month average daily values of sunshine hours, respectively.
The Angström–Prescott model adjusted for Salvador City reproduces the annual variation of the monthly average of E G d with R M S E equal to 3.24% and its correlation coefficient R2 is equal to 99.6%. These results show that the estimates for E G d represent the climatic conditions observed before in the related city.
Additionally, to verify the representativeness of the solar radiation components to Salvador City, the estimates of the monthly average of E G d   and E D F d were compared to those presented in the BS-Atlas dataset [20].
The newest edition of BS-Atlas, released in 2017, was used for this purpose. The solar radiation components published by BS-Atlas were estimated by a BRASIL-SR model that used images collected by Satellite GOES, and it was validated by ground stations’ measurements from the SONDA Network project during the period defined between 1999 and 2015 [20]. In this work, the solar radiation components database is related to the coordinates (−13.00, −38.45) with a grid size of (10 × 10 km).
In comparison to BS-Atlas, E G d is overestimated, mainly between the spring and the beginning of summer, when R M S E is equal to 6.7% and R 2 is equal to 0.97. Nevertheless, E D F d is underestimated by BS-Atlas (Figure 7). The correlation coefficient for E D F d , between BS-Atlas and Ridley, is 0.92. The differences found of E D F d between these models may be related to the performance of radiative transfer model BRASIL-SR and conditions of maintenance of radiometric ground stations [80].
The diurnal evolution of monthly average E T h and E G h during summer and rainy season months are presented in Figure 6. Both variables show a well-defined diurnal cycle with a maximum peak at noon. In the summertime, the integrated value along the day of E T h and E G h is 27% and 46.0% higher in comparison to the values observed in the rainy season, respectively. During summer, the E D F h is 35% of the E G h , while this value in the rainy season is E D F h 46% higher than E G h . The vertical bars correspond to standard deviation.
The monthly variation of diurnal evolution E G h shows a great availability of solar energy incidents on the surface throughout the year, between 10 h and 15 h, except for the rainy season (Figure 6). In summer, we may observe E G h maximums up to 4.2 MJm 2 h 1 (February) and in rainy season a minimum of 3.7 MJm 2 h 1 , both at noon. The highest values of E G h in summer are a combination of astronomical factors and atmospheric conditions, since these are the driest months of the year. The longest and shortest days of sunshine hours occur in December (10.2 h) and July (9.1 h), respectively.

3.4. Salvador City Solar Energy Poential

This research provides substantial results regarding the behavior and information of the solar radiation components at Salvador City. In this section we present some comparisons between Salvador and other cities around the world.
The general pattern of E G for each place depends on geographic coordinates and is related with latitude, sky conditions, clouds, atmospheric aerosol and altitude, for example. Around the world, the solar radiation in general is higher in arid tropical and subtropical zones. Some countries such as South Africa, Australia, Mexico, Brazil and the United States are located in these zones [81]. Although these areas have greater potential for photovoltaic generation, some countries in Europe and Asia are included in the largest producers of energy through photovoltaic power plants [9]. Table 4 presents the solar PV global capacity from 10 different countries around the world and the theoretical potential for PV power [9,81].
Table 4 was adapted using information available from the Global Solar Atlas [81] and the REN21 Global Status Report [9]. Is important to remember that solar power generation depends on the type of cells and solar panel, time to solar exposition (sunshine hours), the seasons and other parameters.
In Table 4 is possible to see how the potential of solar generation in Brazil is poorly explored. In comparison with other countries, Brazil has the second largest theoretical potential and the third biggest evaluated area, using only 0.06% of PV equivalent area. If compare Brazil with Germany, which is one of the largest PV power generators of world, it is possible to see that the tropical country gets a theoretical potential that is 77.2% higher and evaluated area that is 24 times larger; however, the European country has seven times more PV capacity installed.
The collected measurements of solar radiation components performed by LabMiM sensors show that Salvador City has a measured potential for E G d equal to 18.65 MJm 2 day 1 , which is close to the theoretical average potential predicted to Brazil by the Global Solar atlas. The potential for E D F d for Salvador is equal to 7.35 MJm 2 day 1 , 28.7% less than the theoretical average potential predicted for the Netherlands by the Global Solar atlas, and still remembering that Salvador City has more than 2200 h of sunshine a year. In a hypothetical situation, photovoltaic panels could generate a significant amount of electricity in the city of Salvador, just considering the incidence of   E D F , and it would be higher than in many countries where the PV panels are pointed towards the sun.
Table 5 presents the values of E G d to some cities worldwide [82]. The cities chosen are spread around the world from five different continents, with different geographical coordinates and a ranking.

4. Conclusions

Nowadays, solar energy resource is the most promising resource available around the world. Brazil, especially where NEB is located, is a tropical zone with high effectiveness of solar radiation [20,31]. The radiation components balance was evaluated for Salvador City, which is the biggest and the most populous city in NEB, with a population of about three million people [12], who are using and consuming energy on a daily basis.
Salvador is climatologically classified as a Tropical Rainforest (Af) zone, where air temperature varies between 23.7 °C in winter (rainy) and 27.1 °C in summer, with relative humidity higher than 78.5%. The rainfall registers a minimum of 58.1 and a maximum of 1029 mm   month 1 in July (winter/rainy) and December (summer), respectively. The sunshine minimum terms are between the months of April and July and the maximum are between the months of September and March (over 200   h / month 1 ). These observations are according to the normal climate behavior.
Observational data powered by INMET and experimental data collected from LabMiM were used in order to evaluate the main radiation solar components. Since the E D F data were not available, it was necessary to design and build a diffuse radiation measuring device (DRMD), based on MEO (Melo–Escobedo–Oliveira shadow-ring measuring method). In addition, to perform the analysis, some empirical models were used and compared with the observational measurements and BS-Atlas.
In this work, sigmoidal models, such as the Ridley; Marques Filho, and Lemos models, were evaluated to determine which model better represents the K D behavior of Salvador City. After the statistical analysis, all models obtained good results ( R 2 close to 0.90). The Ridley and Marques Filho models overestimated the measures, with MBE equal to 4.05% and 8.22%, respectively. On the other hand, the Lemos MOD underestimated the measures by 6.13%. Ridley presents all statistical indicators better than the others (Table 2), with RMSE equal to 22.15%. Although the Lemos model was used in Brazilian territory, the Ridley model got better results for Salvador City, since it was built for coastal cities in the Southern Hemisphere.
The observational data values in comparison with BS-Atlas show that E G d is overestimated, mainly between the spring and the beginning of summer, with the R M S E equal to 6.7% and R 2 equal to 0.97. However, the E D F d is underestimated by BS-Atlas (Figure 6). The correlation coefficient for E D F d , between BS-Atlas and Ridley, is 0.92. The differences found of E D F d between these models are related to the performance of radiative transfer model BRASIL-SR and maintenance conditions of radiometric ground stations.
Salvador City has a well-defined diurnal cycle, reaching a maximum value of radiation at noon. During the summer, the E G h is predominant and E D F h reaches 35%, while in the rainy season, the E D F h increases and reaches 46% of E G h . The longest and shortest sunshine hours occur in December and July, with 10.2 and 9.1 h, respectively. In the summertime, a maximum of E G h goes up to 4.2 MJm 2 h 1 and it occurs in February, while the minimum of 3.7 MJm 2 h 1 occurs in the rainy season.
The research described the seasonal variation of daily and hourly values of incoming solar radiation components, mainly E G , E D F and E D I R , at the surface in Salvador City, using in situ measurements and empirical models, and they results confirm the that the city has a large potential for solar radiation if compared with countries and cities around the world.
The measured potential for E G d was equal to 18.65 MJm 2 day 1 , which is next to that predicted for Brazil by the Global Solar atlas. The quality and potential of solar radiation found for Salvador is great, until the values of E D F d of 7.35 MJm 2 day 1 can reach values of E G d for other countries available on the Global Solar map. Another advantage of the city is its annual values of sunshine higher than 2200 h   year 1 .
An objective comparison between Salvador and nine of the biggest cities in world shown that the Brazilian tropical city reached the third place on the list, regarding the E G d potential.
The design and construction of the diffuse radiation measurement device (DRMD) brought originality and novelty for the research, and it was fundamental to perform direct measurements of E D F . The device continues in operation at the Federal University of Bahia (UFBA), contributing to provide measurements of the diffuse component to the solar energy research field.
The present research covers the construction of a diffuse radiation measurement device, experimental data collection on the surface, quality controls of radiation measurements, statistical analysis and predictions of solar radiation components using predict models. The results found in this work give information about the behavior of radiation components, sunshine duration during the year and the seasons and climatic characterization of the city that can be used in a infinitude of analyses related to solar radiation and photovoltaic generation, in addition the empirical models developed here, which performed very well and t can be used to estimate the diffuse component of solar radiation in other regions throughout Brazil with similar climate and characteristics as Salvador City.

Author Contributions

Conceptualization, L.R.T.C.G., E.P.M.F. and A.P.d.O.; methodology, L.R.T.C.G. and E.P.M.F.; software, L.R.T.C.G., E.P.M.F. and B.S.M.; formal analysis, L.R.T.C.G., E.P.M.F. and B.S.M.; investigation, L.R.T.C.G., E.P.M.F. and I.M.P.; resources, L.R.T.C.G., E.P.M.F., I.M.P. and J.R.d.A.F.; data curation, L.R.T.C.G., E.P.M.F. and B.S.M.; writing—original draft preparation, L.R.T.C.G., E.P.M.F. and I.M.P.; writing—review and editing, A.P.d.O. and J.R.d.A.F.; supervision, E.P.M.F. and I.M.P.; project administration, L.R.T.C.G. All authors have read and agreed to the published version of the manuscript.

Funding

This research received no external funding.

Institutional Review Board Statement

Not applicable.

Informed Consent Statement

Not applicable.

Data Availability Statement

Not applicable.

Acknowledgments

The authors are grateful to the Fundação de Amparo à Pesquisa do Estado da Bahia (FAPESB Procs. Nº BOL 0456/2017 and APP 0038/2016), the Fundação de Amparo à Pesquisa do Estado do Rio de Janeiro (FAPERJ Proc. nº E26/111.620/2011) and the coordinators of Interdisciplinary Center for Energy and Environment (CIEnAm), DSc. Jailson Bittencourt de Andrade and DSc. Milton José Porsani, for the infrastructural support. Acknowledgement to the Instituto Nacional de Meteorologia (INMET) by the surface meteorological data.

Conflicts of Interest

The authors declare no conflict of interest.

Abbreviations

α Solar elevation angle
AfTropical Rainforest
ASTApparent solar time
BS-AtlasBrazilian Solar Atlas
d Index of agreement
DRMDDiffuse radiation measuring device
E G Global radiation
E G d Daily global radiation
E G h Hourly global radiation
E D F Diffuse radiation
E D F d Daily diffuse radiation
E D F h Hourly diffuse radiation
E D R Direct radiation
E T Extraterrestrial radiation
E T h Hourly extraterrestrial radiation
GDPGross Domestic Product
IBGEBrazilian Institute of Geography and Statistics
ITCZIntertropical Convergence Zone
LabMiMMicrometeorology and Modeling Laboratory
INMETNational Meteorology Institute
K D Diffuse fraction
K D h Hourly diffuse fraction
K D d Daily diffuse fraction
K T Clearness index
K T h Hourly clearness index
K T d Daily clearness index
MBEMean bias error/difference
MEOMelo–Escobedo–Oliveira shadow-ring measuring method
M J Mega Joule
N Number of observations
NEntire test data amount
NEBNortheast of Brazil
o i Observed values
o m Mean values of o i
p i Predicted values
p m Mean values of p i
PVPhotovoltaic systems
R 2 Coefficient of determination
S Sunshine E D F
SASHSouth Atlantic subtropical high
R H Relative humidity
RMSERoot mean square error
SASouth Atlantic
T Air temperature
T S t statistic
TSBTodos os Santos Bay
ΦLatitude
ψ Persistence of E G level
WWatt
TWTerawatt
WMOWorld Meteorological Organization

References

  1. Breyer, C.; Heinonen, S.; Ruotsalainen, J. New consciousness: A societal and energetic vision for rebalancing humankind within the limits of planet Earth. Technol. Forecast. Soc. Chang. 2017, 114, 7–15. [Google Scholar] [CrossRef]
  2. Chen, S.; Chen, B. Urban energy–water nexus: A network perspective. Appl. Energy 2016, 184, 905–914. [Google Scholar] [CrossRef]
  3. Lang, G. Urban energy futures: A comparative analysis. Eur. J. Futures Res 2018, 6, 19. [Google Scholar] [CrossRef]
  4. Oliveira, J.F.G.; Trindade, T.C.G. Sustainability Performance Evaluation of Renewable Energy Sources: The Case of Brazil. In World Energy Matrix, 1st ed.; Springer: Berlin/Heidelberg, Germany, 2018; pp. 1–17. [Google Scholar] [CrossRef]
  5. Sayigh, A. Solar and wind energy will supply more than 50% of world electricity by 2030. In Green Buildings and Renewable Energy, 1st ed.; Springer: Berlin/Heidelberg, Germany, 2020; pp. 385–399. [Google Scholar] [CrossRef]
  6. Strielkowski, W.; Firsova, I.; Lukashenko, I.; Raudeliūnienė, J.; Tvaronavičienė, M. Effective management of energy consumption during the COVID-19 pandemic: The role of ICT solutions. Energies 2021, 14, 893. [Google Scholar] [CrossRef]
  7. Wang, Q.; Zhang, F. What does the China’s economic recovery after COVID-19 pandemic mean for the economic growth and energy consumption of other countries? J. Clean. Prod. 2021, 295, 126265. [Google Scholar] [CrossRef]
  8. Ellabban, O.; Abu-Rub, H.; Blaabjerg, F. Renewable energy resources: Current status, future prospects and their enabling technology. Renew. Sustain. Energy Rev. 2014, 39, 748–764. [Google Scholar] [CrossRef]
  9. REN21. Renewables 2020—Global Status Report. Available online: https://www.ren21.net/wp-content/uploads/2019/05/gsr_2020_full_report_en.pdf (accessed on 25 January 2021).
  10. Mulder, F.M. Implications of diurnal and seasonal variations in renewable energy generation for large scale energy storage. J. Renew. Sustain. Energy 2014, 6, 033105. [Google Scholar] [CrossRef] [Green Version]
  11. Jäger-Waldau, A. PV Status Report 2019; Publications Office of the European Union: Luxembourg, 2019; pp. 7–94. [Google Scholar] [CrossRef]
  12. IBGE. Brazilian Institute of Geography and Statistics 2020. Projections and Related of the Population of Brazil and Federation Units. Available online: https://www.ibge.gov.br/apps/populacao/projecao/index.html (accessed on 20 June 2021).
  13. Barros, N.; Cole, J.J.; Tranvik, L.J.; Prairie, Y.T.; Bastviken, D.; Huszar, V.L.; Roland, F. Carbon emission from hydroelectric reservoirs linked to reservoir age and latitude. Nat. Geosci. 2011, 4, 593–596. [Google Scholar] [CrossRef]
  14. Fthenakis, V.; Kim, H.C. Land use and electricity generation: A life-cycle analysis. Renew. Sustain. Energy Rev. 2009, 13, 1465–1474. [Google Scholar] [CrossRef] [Green Version]
  15. Vörösmarty, C.J.; McIntyre, P.B.; Gessner, M.O.; Dudgeon, D.; Prusevich, A.; Green, P.; Davies, P.M. Global threats to human water security and river biodiversity. Nature 2010, 467, 555–561. [Google Scholar] [CrossRef]
  16. Ekhtiari, N.; Grossman-Clarke, S.; Koch, H.; Meira de Souza, W.; Donner, R.V.; Volkholz, J. Effects of the lake Sobradinho reservoir (Northeastern Brazil) on the regional climate. Climate 2017, 5, 50. [Google Scholar] [CrossRef]
  17. de Mattos Bicudo, C.E.; Tundisi, J.G.; Scheuenstuhl, M.C.B. Strategic analysis. In Waters of Brazil, 1st ed.; Springer: Berlin/Heidelberg, Germany, 2016. [Google Scholar] [CrossRef]
  18. Marengo, J.A.; Bernasconi, M. Regional differences in aridity/drought conditions over Northeast Brazil: Present state and future projections. Clim. Chang. 2015, 129, 103–115. [Google Scholar] [CrossRef]
  19. Marengo, J.A.; Torres, R.R.; Alves, L.M. Drought in Northeast Brazil—past, present, and future. Theor. Appl. Climatol. 2017, 129, 1189–1200. [Google Scholar] [CrossRef]
  20. Pereira, E.B.; Martins, F.R.; Gonçalves, A.R.; Costa, R.S.; Lima, F.J.L.; Rüther, R.; de Souza, J.G. Atlas Brasileiro de Energia Solar, 2nd ed.; Inpe: São José dos Campos, Brazil, 2017; ISBN 978-85-17-00089-8. [Google Scholar]
  21. Santos, R.; Andrade, T.; Branco, N.; Borja, P.; Pedrassoli, J.; Vale, T. Vegetation Cover and Surface Temperature in Urban Areas: An Analysis Using Remote Sensing in the City of Salvador, Bahia, Brazil. In Proceedings of the PLEA 2017—Passive Low Energy Architecture—Design to Thrive, Edinburg, Scotland, UK, 3–5 July 2017. [Google Scholar]
  22. SEI, Superintendência de Estudos Econômicos e Sociais da Bahia; Salvador; BA. Data Base. Available online: http://sim.sei.ba.gov.br/side/tv.wsp?tmp.codpai=sg14 (accessed on 1 December 2021).
  23. de Azevedo Dias, C.L.; Branco, D.A.C.; Arouca, M.C.; Legey, L.F.L. Performance estimation of photovoltaic technologies in Brazil. Renew. Energy 2017, 114, 367–375. [Google Scholar] [CrossRef]
  24. De Jong, P.; Sánchez, A.S.; Esquerre, K.; Kalid, R.D.A.; Torres, E.A. Solar and wind energy production in relation to the electricity load curve and hydroelectricity in the northeast region of Brazil. Renew. Sustain. Energy Rev. 2013, 23, 526–535. [Google Scholar] [CrossRef]
  25. Carvalho, M.M.Q.; La Rovere, E.L.; Gonçalves, A.C.M. Analysis of variables that influence electric energy consumption in commercial buildings in Brazil. Renew. Sustain. Energy Rev. 2010, 14, 3199–3205. [Google Scholar] [CrossRef]
  26. Silva, H.C.N.; Dutra, J.C.C.; Costa, J.A.P.; Ochoa, A.A.V.; Dos Santos, C.A.C.; Araújo, M.M.D. Modeling and simulation of cogeneration systems for buildings on a university campus in Northeast Brazil–A case study. Energy Convers. Manag. 2019, 186, 334–348. [Google Scholar] [CrossRef]
  27. Calabrò, E. An algorithm to determine the optimum tilt angle of a solar panel from global horizontal solar radiation. J. Renew. Energy 2013, 2013, 307547. [Google Scholar] [CrossRef] [Green Version]
  28. Souza, A.; Escobedo, J.F. Estimates of hourly diffuse radiation on tilted surfaces in Southeast of Brazil. Int. J. Renew. Energy Res. 2013, 3, 207–221. [Google Scholar] [CrossRef]
  29. Despotovic, M.; Nedic, V.; Despotovic, D.; Cvetanovic, S. Evaluation of empirical models for predicting monthly mean horizontal diffuse solar radiation. Renew. Sustain. Energy Rev. 2016, 56, 246–260. [Google Scholar] [CrossRef]
  30. Lemos, L.F.; Starke, A.R.; Boland, J.; Cardemil, J.M.; Machado, R.D.; Colle, S. Assessment of solar radiation components in Brazil using the BRL model. Renew. Energy 2017, 108, 569–580. [Google Scholar] [CrossRef]
  31. Pereira, E.B.; Abreu, S.L.; Stuhlmann, R.; Rieland, M.; Colle, S. Survey of the incident solar radiation in Brazil by use of Meteosat satellite data. Sol. Energy 1996, 57, 125–132. [Google Scholar] [CrossRef]
  32. Fan, J.; Wu, L.; Zhang, F.; Cai, H.; Ma, X.; Bai, H. Evaluation and development of empirical models for estimating daily and monthly mean daily diffuse horizontal solar radiation for different climatic regions of China. Renew. Sustain. Energy Rev. 2019, 105, 168–186. [Google Scholar] [CrossRef]
  33. Li, Z.; Xing, H.; Augenbroe, G. Criterion based selection of sky diffuse radiation models. Sustain. Cities Soc. 2019, 50, 101692. [Google Scholar] [CrossRef]
  34. Martins, F.R.; Abreu, S.L.; Pereira, E.B. Scenarios for solar thermal energy applications in Brazil. Energy Policy 2012, 48, 640–649. [Google Scholar] [CrossRef]
  35. Oliveira, A.P.; Escobedo, J.F.; Machado, A.J.; Soares, J. Correlation models of diffuse solar-radiation applied to the city of Sao Paulo, Brazil. Appl. Energy 2002, 71, 59–73. [Google Scholar] [CrossRef]
  36. Codato, G.; Oliveira, A.P.; Soares, J.; Escobedo, J.F.; Gomes, E.N.; Pai, A.D. Global and diffuse solar irradiances in urban and rural areas in southeast Brazil. Theor. Appl. Climatol. 2008, 93, 57–73. [Google Scholar] [CrossRef]
  37. Marques Filho, E.P.; Oliveira, A.P.; Vita, W.A.; Mesquita, F.L.; Codato, G.; Escobedo, J.F.; França, J.R.A. Global, diffuse and direct solar radiation at the surface in the city of Rio de Janeiro: Observational characterization and empirical modeling. Renew. Energy 2016, 91, 64–74. [Google Scholar] [CrossRef] [Green Version]
  38. De Souza, J.L.; Lyra, G.B.; Dos Santos, C.M.; Junior, R.A.F.; Tiba, C.; Lyra, G.B.; Lemes, M.A.M. Empirical models of daily and monthly global solar irradiation using sunshine duration for Alagoas State, Northeastern Brazil. Sustain. Energy Technol. Assess. 2016, 14, 35–45. [Google Scholar] [CrossRef]
  39. Angstrom, A. Solar and terrestrial radiation. Report to the international commission for solar research on actinometric investigations of solar and atmospheric radiation. Q. J. R. Meteorol. Soc. 1924, 50, 121–126. [Google Scholar] [CrossRef]
  40. Güçlü, Y.S.; Yeleğen, M.Ö.; Dabanlı, İ.; Şişman, E. Solar irradiation estimations and comparisons by ANFIS, Angström–Prescott and dependency models. Sol. Energy 2014, 109, 118–124. [Google Scholar] [CrossRef]
  41. Dal Pai, A.; Escobedo, J.F.; Dal Pai, E.; de Oliveira, A.P.; Soares, J.R.; Codato, G. MEO shadowring method for measuring diffuse solar irradiance: Corrections based on sky cover. Renew. Energy 2016, 99, 754–763. [Google Scholar] [CrossRef]
  42. Wilks, D.S. Statistical Methods in the Atmospheric Sciences an Introduction; Elsevier Science: Amsterdam, The Netherlands, 2006. [Google Scholar]
  43. Younes, S.; Claywell, R.; Muneer, T. Quality control of solar radiation data: Present status and proposed new approaches. Energy 2015, 30, 1533–1549. [Google Scholar] [CrossRef]
  44. Journée, M.; Bertrand, C. Quality control of solar radiation data within the RMIB solar measurements network. Sol. Energy 2011, 85, 72–86. [Google Scholar] [CrossRef]
  45. Iqbal, M. An Introduction to Solar Radiation, 1st ed.; Elsevier: Amsterdam, The Netherlands, 1983. [Google Scholar]
  46. Fröhlich, C.; Lean, J. The Sun’s total irradiance: Cycles, trends and related climate change uncertainties since 1976. Geophys. Res. Lett. 1998, 25, 4377–4380. [Google Scholar] [CrossRef]
  47. Zhen, Z.; Zengwei, Z.; Li, S.; Jun, W.; Wuchun, P.; Zhikang, L.; Yunhua, S. The effects of inclined angle modification and diffuse radiation on the sun-tracking photovoltaic system. IEEE J. Photovolt. 2017, 7, 1410–1415. [Google Scholar] [CrossRef]
  48. Abdel-Basset, M.; Hawash, H.; Chakrabortty, R.K.; Ryan, M. PV-Net: An innovative deep learning approach for efficient forecasting of short-term photovoltaic energy production. J. Clean. Prod. 2021, 303, 127037. [Google Scholar] [CrossRef]
  49. Khorasanizadeh, H.; Mohammadi, K.; Goudarzi, N. Prediction of horizontal diffuse solar radiation using clearness index based empirical models; A case study. Int. J. Hydrog. Energy 2016, 41, 21888–21898. [Google Scholar] [CrossRef]
  50. Liu, B.Y.; Jordan, R.C. The interrelationship and characteristic distribution of direct, diffuse and total solar radiation. Sol. Energy 1960, 4, 1–19. [Google Scholar] [CrossRef]
  51. Golovchenko, P.; Yusup, Y.; Juneng, L.; Tangang, F.T. Daily spectral ocean surface albedo (OSA) parameterization in case of clearness index (Kt) and phytoplankton variability in Malacca Strait. Estuar. Coast. Shelf Sci. 2020, 244, 106939. [Google Scholar] [CrossRef]
  52. Li, F.; Lin, Y.; Guo, J.; Wang, Y.; Mao, L.; Cui, Y.; Bai, Y. Novel models to estimate hourly diffuse radiation fraction for global radiation based on weather type classification. Renew. Energy 2020, 157, 1222–1232. [Google Scholar] [CrossRef]
  53. Jamil, B.; Akhtar, N. Estimation of diffuse solar radiation in humid-subtropical climatic region of India: Comparison of diffuse fraction and diffusion coefficient models. Energy 2017, 131, 149–164. [Google Scholar] [CrossRef]
  54. Scarpa, F.; Marchitto, A.; Tagliafico, L.A. Splitting the solar radiation in direct and diffuse components; Insights and constrains on the clearness-diffuse fraction representation. Int. J. Heat Technol. 2017, 35, 325–329. [Google Scholar] [CrossRef] [Green Version]
  55. Yang, L.; Cao, Q.; Yu, Y.; Liu, Y. Comparison of daily diffuse radiation models in regions of China without solar radiation measurement. Energy 2020, 191, 116571. [Google Scholar] [CrossRef]
  56. Ruiz-Arias, J.A.; Alsamamra, H.; Tovar-Pescador, J.; Pozo-Vázquez, D. Proposal of a regressive model for the hourly diffuse solar radiation under all sky conditions. Energy Convers. Manag. 2010, 51, 881–893. [Google Scholar] [CrossRef]
  57. Furlan, C.; De Oliveira, A.P.; Soares, J.; Codato, G.; Escobedo, J.F. The role of clouds in improving the regression model for hourly values of diffuse solar radiation. Appl. Energy 2012, 92, 240–254. [Google Scholar] [CrossRef]
  58. Ridley, B.; Boland, J.; Lauret, P. Modelling of diffuse solar fraction with multiple predictors. Renew. Energy 2010, 35, 478–483. [Google Scholar] [CrossRef]
  59. Gueymard, C.A. A review of validation methodologies and statistical performance indicators for modeled solar radiation data: Towards a better bankability of solar projects. Renew. Sustain. Energy Rev. 2014, 39, 1024–1034. [Google Scholar] [CrossRef]
  60. Funabashi, T. Integration of Distributed Energy Resources in Power Systems: Implementation, Operation and Control, 1st ed.; Academic Press-Elsevier: London, UK, 2016; pp. 50–110. [Google Scholar] [CrossRef]
  61. Roscher, S.; Hoffmann, R.; Ambacher, O. Determination of the graphene–graphite ratio of graphene powder by Raman 2D band symmetry analysis. Anal. Methods 2019, 11, 1224–1228. [Google Scholar] [CrossRef] [Green Version]
  62. Salisu, S.; Mustafa, M.W.; Mustapha, M.; Mohammed, O.O. Solar Radiation Forecasting in Nigeria based on Hybrid PSOANFIS and WT-ANFIS Approach. Int. J. Electr. Comput. Eng. 2019, 9, 31–41. [Google Scholar] [CrossRef]
  63. Ulgen, K.; Hepbasli, A. Diffuse solar radiation estimation models for Turkey’s big cities. Energy Convers. Manag. 2009, 50, 149–156. [Google Scholar] [CrossRef]
  64. Bessa, R.J.; Trindade, A.; Miranda, V. Spatial-temporal solar power forecasting for smart grids. IEEE Trans. Ind. Inform. 2014, 11, 232–241. [Google Scholar] [CrossRef]
  65. Mecibah, M.S.; Boukelia, T.E.; Tahtah, R.; Gairaa, K. Introducing the best model for estimation the monthly mean daily global solar radiation on a horizontal surface (Case study: Algeria). Renew. Sustain. Energy Rev. 2014, 36, 194–202. [Google Scholar] [CrossRef]
  66. Stone, R.J. A nonparametric statistical procedure for ranking the overall performance of solar radiation models at multiple locations. Energy 1994, 19, 765–769. [Google Scholar] [CrossRef]
  67. Saffaripour, M.H.; Mehrabian, M.A.; Bazargan, H. Predicting solar radiation fluxes for solar energy system applications. Int. J. Environ. Sci. Technol. 2013, 10, 761–768. [Google Scholar] [CrossRef] [Green Version]
  68. Willmott, C.J. On the validation of models. Phys. Geogr. 1981, 2, 184–194. [Google Scholar] [CrossRef]
  69. Willmott, C.J.; Robeson, S.M.; Matsuura, K. A refined index of model performance. Int. J. Climatol. 2012, 32, 2088–2094. [Google Scholar] [CrossRef]
  70. Peel, M.C.; Finlayson, B.L.; McMahon, T.A. Updated world map of the Köppen-Geiger climate classification. Hydrol. Earth Syst. Sci. 2007, 11, 1633–1644. [Google Scholar] [CrossRef] [Green Version]
  71. Rao, V.B.; Hada, K.; Herdies, D.L. On the severe drought of 1993 in north-east Brazil. Int. J. Climatol. 1995, 15, 697–704. [Google Scholar] [CrossRef]
  72. Chaves, R.R.; Cavalcanti, I.F.A. Atmospheric circulation features associated with rainfall variability over southern Northeast Brazil. Mon. Weather Rev. 2001, 129, 2614–2626. [Google Scholar] [CrossRef] [Green Version]
  73. Sun, X.; Cook, K.H.; Vizy, E.K. The South Atlantic subtropical high: Climatology and interannual variability. J. Clim. 2017, 30, 3279–3296. [Google Scholar] [CrossRef]
  74. Li, H.; Ma, W.; Wang, X.; Lian, Y. Estimating monthly average daily diffuse solar radiation with multiple predictors: A case study. Renew. Energy 2011, 36, 1944–1948. [Google Scholar] [CrossRef]
  75. Paulescu, E.; Blaga, R. Regression models for hourly diffuse solar radiation. Sol. Energy 2016, 125, 111–124. [Google Scholar] [CrossRef]
  76. Lima, F.J.; Martins, F.R.; Pereira, E.B.; Lorenz, E.; Heinemann, D. Forecast for surface solar irradiance at the Brazilian Northeastern region using NWP model and artificial neural networks. Renew. Energy 2016, 87, 807–818. [Google Scholar] [CrossRef]
  77. De Souza, J.L.; Nicácio, R.M.; Moura, M.A.L. Global solar radiation measurements in Maceió, Brazil. Renew. Energy 2005, 30, 1203–1220. [Google Scholar] [CrossRef]
  78. André, M.; de Vecchi, R.; Lambersts, R. Feasibility of Using Personal Fans for Increasing Thermal Comfort in Mixed-Mode Shared Work Spaces in Brazil: A Field Study. In Proceedings of the Windsor 2020, London, UK, 16–19 April 2020; Available online: https://www.researchgate.net/profile/Maira-Andre/publication/341434764_Feasibility_of_using_personal_fans_for_increasing_thermal_comfort_in_mixed-_mode_shared_work_spaces_in_Brazil_a_field_study/links/5ec7254ea6fdcc90d68c91f4/Feasibility-of-using-personal-fans-for-increasing-thermal-comfort-in-mixed-mode-shared-work-spaces-in-Brazil-a-field-study.pdf (accessed on 15 June 2021).
  79. Medeiros, F.J.D.; Silva, C.M.; Bezerra, B.G. Calibration of Ängström-Prescott equation to estimate daily solar radiation on Rio Grande do Norte state, Brazil. Rev. Bras. Meteorol. 2017, 32, 409–416. [Google Scholar] [CrossRef] [Green Version]
  80. Martins, F.R.; Pereira, E.B.; Abreu, S.L. Satellite-derived solar resource maps for Brazil under SWERA project. Sol. Energy 2007, 81, 517–528. [Google Scholar] [CrossRef]
  81. ESMAP. Global Photovoltaic Power Potential by Country. In Global Solar Atlas; World Bank: Washington, DC, USA, 2020; Available online: https://globalsolaratlas.info/global-pv-potential-study (accessed on 1 December 2021).
  82. Riahi, S.; Abedini, E.; Vakili, M. Providing an accurate global model for monthly solar radiation forecasting using artificial intelligence based on air quality index and meteorological data of different cities worldwide. Environ. Sci. Pollut. Res. 2021, 28, 49697–49724. [Google Scholar] [CrossRef]
Figure 1. Geographical location of Salvador City in relation to Brazil and the State of Bahia, highlighting (red square) from the INMET (yellow circle) and LabMiM (red circle) experimental sites.
Energies 15 01058 g001
Figure 2. (a) DRMD components’ description: (1) shadow ring, (2) pyranometer, (3) threaded bar and pyranometer base set, (4) support and regulator screw of the base of the shadow ring, (5) latitude ϕ regulator bar, (6) latitude ϕ regulator lever lock, (7) tall pillar, (8) stabilizer base, (9) shadow ring support, (10) main base, (11) shadow ring base lever lock mechanism, (l2) shadow ring lever lock and (13) shadow ring threaded support bar. (b) The DRMD working.
Energies 15 01058 g002
Figure 3. Comparison of daily values of E G d observed in LabMiM and INMET. The squares symbols represent the block average and the vertical and horizontal bars the standard deviations. The dashed line is the linear fit and the red one is to identify its function. The R2 is the coefficient of determination.
Energies 15 01058 g003
Figure 4. Monthly evolution of (a) air temperature ( T ) and relative humidity ( R H ) (b) r a i n f a l l in “mm” and sunshine hours ( S ). The variables identified by “(1981–2010)” represent normal climate estimates, those identified by “(2010–2019)” represent monthly average daily values (both INMET) and those identified by “(2017–2019)” represent monthly average daily values (both LabMiM). The vertical bars correspond to standard deviation.
Energies 15 01058 g004
Figure 5. Liu-Jordan diagram K T h versus K D h for Salvador City. The solid squares represent the block average and vertical lines represent the standard deviation. The dispersion points represent the empirical model developed by different authors.
Energies 15 01058 g005
Figure 6. Diurnal evolution of E G   h and E T h in (a) summer and (b) rainy seasons in Salvador City in the period 2017–2019.
Energies 15 01058 g006
Figure 7. Monthly evolution of E G d , E D F d , E D R d and E T d in Salvador City in the period between 2010 and 2019; the vertical bars correspond to standard deviation. The black dashed line stands for Angstrom–Prescott adjusted model (Equation (10)). The black dashed-dotted and the blue dashed-dotted lines represent E G d and E D F d of values presented by BS-Atlas, respectively [20]. The light blue bars represent the E D F d estimates obtained for Salvador City though the use of empirical model proposed by Ridley et al. [58].
Energies 15 01058 g007
Table 1. Geographic coordinates of experimental sites, radiometric sensors and data series.
SiteGeographic
Coordinates
and (MAMSL)
Measured VariablesRadiometric SensorsData Collection IntervalAccuracy/
Uncertainty
Observational
Period
INMET13°0′19.85″ S
38°30′20.73″ W
48 m
E G Pyranometer
CM6B (Kipp&Zonen)
hourly-2010–2019
S Heliograph
(Campbell–Stoke)
daily-2010–2019
T ,   R H ,   r a i n f a l l -hourly-2010–2019
LabMiM12°59′56.74″ S
38°30′29.22″ W
46 m
E G Net Radiometer
CNR1 (Kipp&Zonen)
hourlyMax. dev. 2.5%
(0–1000 W m−2)
2017/Jan–2019/Dec
E D F Pyranometer PSP
(Eppley)
hourlyMax. dev. 2.0%
(0–1000 W m−2)
2018/Aug–2019/Dec
T
R H
CS215 Temp. & Relat. Humidity (Campbell)hourly±0.4 °C
±2%
2017/Jan–2019/Dec
r a i n f a l l TB4 -Rain Gage
(Campbell)
hourlyMax. dev. 2%2017/Jan–2019/Dec
E G (global radiation); E D F (diffuse radiation); T (air temperature); R H (relative humidity).
Table 2. Diffuse fraction empirical models.
Statistical ParametersRidleyMarques FilhoLemos
R 2 0.9100.8950.901
M B E   % 4.058.22−6.13
R M S E % 22.1525.5724.15
T S 10.60919.37114.979
d 0.9840.9790.981
Table 3. Values of E G d for Salvador, Rio de Janeiro, São Paulo and Maceio City.
Solar C o m p o n n e n t Salvador
M J m 2 d a y 1
Rio de Janeiro
M J m 2 d a y 1
São Paulo
M J m 2 d a y 1
Maceió
M J m 2 d a y 1
E G d max 23.2123.8918.4127.63
E G d m i n 13.2210.7811.8517.41
Table 4. Solar PV global capacity and theoretical potential for PV power for countries around the world.
RankCountryCap. Install. in 2020 (GW)Evaluated Area
(km2)
Theoretical Potential
(kWh/m2)
Theoretical Potential
( MJm 2 day 1 )
PV Equivalent Area %
1China253.49,348,7184.12714.85720.67
2United States95.58,039,9614.49816.19280.83
3Japan71.4372,5033.61413.01043.01
4Germany53.9355,8072.97810.72083.46
5India47.43,082,1335.09818.35280.35
6Australia20.47,703,6485.75920.73240.04
7Republic of Korea15.9100,3393.98714.35329.08
8Vietnam16.4327,9394.25215.307238.68
9Netherlands10.235,1152.86510.31429.49
10Brazil7.78,515,7705.27618.99360.06
Table 5. Global monthly solar radiation of different cities worldwide.
NumberCity/CountryLatitudeLongitude E G d   ( M J m 2 d a y 1 )
1Johannesburg, South Africa28.05° E28.05° E20.73
2Los Angeles, USA34.05° N144.96° E18.84
3Salvador12.49° S38.50° W18.65
4Melbourne, Australia37.81° S14.353216.98
5Tehran, Iran35.69° N51.39° E16.87
6Delhi, India28.70° N77.10° E15.38
7Beijing, China39.90° N116.41° E13.69
8Tokyo, Japan35.68° N139.65° E12.25
9London, England51.51° N118.25° W9.62
10Hamburg, German53.55° N9.99° E8.69
Publisher’s Note: MDPI stays neutral with regard to jurisdictional claims in published maps and institutional affiliations.

