Article

Energy Efficiency and Distributed Generation: A Case Study Applied in Public Institutions of Higher Education

1
ENEL Distribution Goiás, Goiânia 74805-180, Brazil
2
Graduate Program in Electrical and Computer Engineering, Federal University of Goiás (UFG), Goiânia 74605-010, Brazil
3
Graduate Program in Sustainable Process Technology Federal Institute of Education, Science and Technology of Goiás (IFG), Goiânia 74055-110, Brazil
*
Author to whom correspondence should be addressed.
Energies 2022, 15(3), 1217; https://doi.org/10.3390/en15031217
Submission received: 13 December 2021 / Revised: 27 January 2022 / Accepted: 31 January 2022 / Published: 7 February 2022
(This article belongs to the Special Issue Next-Generation Power and Energy Systems)

Abstract

:
This study focused on developing a sustainability project carried out in 11 Federal Institute of Education, Science, and Technology of Goiás (IFG) campuses wherein energy efficiency and distributed generation actions were developed. Energy consumption was optimized by retrofitting the lighting system, installing a photovoltaic (PV) generation system, quantifying the building efficiency, energy monitoring, training, and qualification, and focusing on the efficient use of electric energy. We first present the Brazilian legislation that regulates the Research and Development Program in the electric energy sector. Then, we describe the case study that was applied to the educational institution. In the lighting system, 18,377 inefficient lamps were replaced by lamps with more efficient technology, with an energy saving of 867.9 MWh/year and a peak demand reduction of 309.6 kW. The proposed generation system aimed to install 3076 PV modules on the roofs of selected campus buildings, totaling 1 MWp of installed power with an average annual power generation of 1736.9 MWh/year. The total project investment was USD 1,348,768.50 and the overall cost–benefit ratio of the project was 0.68, which will result in annual savings of approximately USD 197,321.85. This corresponded to a 58% reduction in energy bills. The project proposed in this work was considered technically and economically viable within the scope of the Brazilian Energy Efficiency Program.

1. Introduction

Current energy challenges have occupied a prominent space in the discussions on the environment while providing a broader view of the economic and social aspects associated with sustainability. Meeting the current electricity demand requires the adoption of short-, medium-, and long-term strategies. These strategies must be properly planned for providing convenient access to energy within different sectors of society at reasonable costs while considering the principles of sustainable development [1].
The high cost of fossil energy supplies and concerns regarding climate change resulting from global warming, which are attributed mainly to the production and consumption of energy, have brought new and consistent arguments that justify a more careful analysis regarding the balance between energy supply and demand. In this scenario, the efficient use of electricity is an important aspect in meeting demand, contributing to energy security, lower tariffs, economic competitiveness, and the reduction of greenhouse gas emissions [2].
The focus of energy efficiency policies in several countries is energy demand reduction. This can be achieved by improving the efficiency of products and processes relating to energy consumption, both on the demand and supply sides [3].
Humanity must change its interaction with the planet, as the current increasing rate of consumption is unsustainable. This condition is essential for implementing alternatives that allow for balanced development, ensuring that current needs are met without compromising the ability of future generations to meet their energy needs [4]. In this sense, any action aimed at implementing an efficient energy use system in residential, commercial, industrial, or public sectors must involve the employment of energy efficiency projects. This type of project comprises a set of studies, procedures, and actions aimed at reducing or eliminating waste in electricity consumption while maintaining or even increasing the competitiveness of the consumer market.
Energy efficiency provides multiple benefits for energy security, tariff modes, postponement of investments in electricity generation and transmission, greater competitiveness and productivity, employment generation, increased well-being for the population, lower spending on public health, and a reduction in environmental impacts.
Along with energy efficiency, electricity can be produced from renewable energy sources, which is one of the most efficient solutions to the problems of growing demand associated with sustainable development. It should be noted that renewable sources are considered ecologically safe and inexhaustible compared with fossil fuel sources [5]. It is necessary to consider that the distributed generation (DG) of electric energy represents a viable alternative under economic and environmental aspects when planning the expansion of an energy system [6]. DG units are considered a promising solution for a smart grid vision [7].
Brazil has had internationally recognized energy efficiency programs for several decades, such as the Brazilian Labeling Program (PBE), the National Electric Energy Conservation Program (PROCEL), the National Program for the Rationalization of the Use of Natural Oil and Gas Derivatives (CONPET), and the Energy Efficiency Program (PEE) of energy distributors, in addition to specific policies and plans [8].
In Brazil, there is a law that deals with the national policy for the conservation and rational use of energy, which establishes the maximum levels of specific energy consumption or minimum levels of energy efficiency of machines and appliances manufactured or sold in the country [9]. Based on this guideline, the energy efficiency program (PEE) of energy facilities is being implemented [10]. According to the National Electric Energy Agency’s (ANEEL’s) regulations, electricity distribution facilities or licensees must apply a minimum of 0.5% of the net operating revenue in PEE. The main objective of the energy efficiency program is to demonstrate the importance and economic feasibility of combating the wastage of electricity and improving the energy efficiency of equipment, processes, and energy end uses. The program seeks to maximize public services offered by saving energy and avoiding demand, thereby leading to the transformation of the electricity market by stimulating the development of new technologies and the creation of new habits for the use of electricity.
Through public policy, energy efficiency (EE) is included in the long-term guidelines of Brazilian energy planning. The 2030 National Energy Plan (PNE2030) [11] established targets to reduce electricity demand based on energy efficiency in the electricity sector. The National Energy Efficiency Plan (PNEf) was prepared and approved to face the challenge of meeting 10% energy savings by 2030. Its objective is to align instruments of government action, guide fundraising, and promote and improve the legal framework and regulation related to the subject. This will lead to a sustainable energy efficiency market, mobilize Brazilian society against energy waste, and preserve natural resources [12].
Since ANEEL created an electric compensation system in 2012, Brazilian consumers have been able to generate their own electricity from renewable sources or qualified cogeneration and supply the surplus to the distribution network in their locality [6,13]. According to Brazilian regulations, distributed micro- and mini-generation includes the production of electricity from small generating plants that use renewable sources of electricity or qualified cogeneration, which are connected to the distribution network through the installation of consumer units. Distributed micro-generation refers to an electric-power-generating plant with an installed power of less than or equal to 75 kilowatts (kW), while distributed mini-generation refers to generating plants with an installed power greater than 75 kW and less than or equal to 3 megawatts (MW) for hydro sources (or 5 MW for other sources). The regulatory conditions are valid for generators that use incentivized sources of energy, including hydro, solar, biomass, wind, and qualified cogeneration.
In December 2015, the Brazilian government published the Program for the Development of Distributed Electricity Generation (ProGD) with the objective of expanding and deepening actions to encourage consumers to generate energy from renewable energy sources [14]. Among these actions, the following describes the ProGD objectives:
  • Creation and expansion of credit lines and forms of financing projects for the installation of distributed generation systems in residential, commercial, and industrial sectors.
  • Encourage the establishment of industries that manufacture components and equipment used in generation projects from renewable sources; encompassing productive, technological, and innovation development, as well as the establishment of commercial companies and service providers in distributed generation with renewable sources.
  • Promote national and international investments, and facilitate the transfer and nationalization of competitive technologies associated with renewable energies.
  • Encourage people to work in all renewable energy production areas.
Thus, based on the context presented, in 2016, the Brazilian government selected projects with the objective of serving public institutions of higher education regarding energy efficiency actions and carrying out research and development projects [15]. The selected projects are shown in Table 1, and the actions and results to be achieved are as follows:
  • Replacement of inefficient equipment with more energy-efficient equipment;
  • Change in the consumption habits of teachers, students, and employees of public higher education institutions;
  • Implementation of mini-generation of electricity in these institutions;
  • Electricity bill reduction;
  • Implementation of a new form of energy management and impact analysis of this generation in the concessionaire’s network through research, development, and innovation actions;
  • Technical and academic training and improvement of laboratory infrastructure.
The project that received the best evaluation was that which applied to the Federal Institute of Education, Science, and Technology of Goiás (IFG), which was used as a case study for this work. Actions involving energy efficiency and distributed generation actions were presented with the following objectives:
  • Optimizing energy consumption by retrofitting the lighting system;
  • Installation of a photovoltaic (PV) generation system;
  • Monitoring the energy flow;
  • Providing training.
All actions focused on the efficient use of electricity, in compliance with the guidelines established by the ANEEL.
Table 1. Result of the Public Call for Priority Projects for EE and Strategic R&D no. 01/2016—“energy efficiency and mini generation in public institutions of higher education.”.
Power Distribution CompanyBeneficiary UniversityStateResult
ENEL CearáUNILABCearáApproved
ENEL GoiásIFGGoiás
RGE SulUFSMRio Grande do Sul
CEALUFALAlagoas
CEPISAUFPIPiauí
CPFL PirapitingaIFSP BoituvaSão Paulo
ELETROACREUFACAcre
ENEL RioUFFRio de Janeiro
ENEL GoiásUFGGoiás
DME DUNIFALMinas Gerais
DME DIF MG SulMinas Gerais
CPFL PaulistaUNICAMPSão PauloApproved with recommendations
AES EletropauloIFSP—São PauloSão Paulo
COPEL DUEMParaná
COPEL DUFPRParaná
COPEL DUF LondrinaParaná
AES EletropauloHU—USPSão Paulo
AES EletropauloPOLITÉCNICA USPSão Paulo
CERONUNIRRondônia
COPEL DUTFPR Pato BrancoParaná
COPEL DUTFPR CuritibaParaná
AES EletropauloUFABCSão Paulo
The potential for energy conservation and renewable energy generation existing in the country must be used as a strategy for serving the expansion of the Brazilian electric energy market. However, public policies aimed at promoting energy efficiency and distributed generation have broad challenges, including the differences between the distributors’ clients and the synergy between distributors and other government actions and programs.
From this contextualization, this work showed that integrated and synergistic actions between EE and DG are technically and economically viable and innovative in the sense that they are implemented continuously. These aspects were validated through a case study applied to several campuses of a higher education institution in different locations, serving as a reference for other electricity consumers.
Finally, in order to reach the aforementioned objectives, this work is structured as follow: 1. Introduction contextualizes the regulatory aspects and the Brazilian market regarding the EE and DG programs, making it possible to explain the objectives and contributions of the work; 2. Procedures of the Energy Efficiency Program (PROPEE) describes the methodology used to achieve the objectives of the work; 3. Results—Case Study presents the application of the methodology through a case study; finally, 4. Discussion and 5 present the analysis and conclusions obtained, respectively, from the results and the experience provided by the research work.

2. Procedures of the Energy Efficiency Program (PROPEE)

The Procedures of the Energy Efficiency Program (PROPEE) provide a definitive Brazilian guide of the procedures intended for electricity distributors for the preparation and execution of energy efficiency projects regulated by ANEEL [16]. Thus, the PROPEE defines the structure and form of presentation of projects, typologies, evaluation, and inspection criteria, as well as procedures for reporting costs and the appropriation of investments made that can be carried out with resources from the Energy Efficiency Program (PEE).
The PEE includes energy efficiency projects (EEPROJ) in all sectors of the economy, consumption classes, and end uses. Some projects have special characteristics regarding their importance in the development of energy efficiency actions or forms of contracting. PEE also indicates the priority form of prospecting for projects. Table 2 shows the possible typologies of projects, indicating the energy efficiency actions, special characteristics, investments, and ways to obtain financial resources associated with each typology, which are detailed as follows:
  • Typologies—establishes guidelines for projects and their characteristics.
  • Energy efficiency action—establishes guidelines for projects by type of energy efficiency action involved to improve the installation and its end uses.
  • Investment—resources necessary for the implementation of energy efficiency projects through energy performance contracts or without monetary refunds.
  • Preferential prospecting—selection starts with a public call for projects or by the action of the distributor to prospect facilities with potential for project implementation.
  • Special features—projects that, due to their relevance or non-typical characteristics, deserve special attention, both from the distributor and the energy regulatory agency. Special projects generally fall into the typologies defined in Module 4—Project Typologies and are classified as follows:
    a)
    Priority—wide-ranging projects whose purpose is to test, encourage, or define outstanding actions as a public policy to increase energy efficiency in the country;
    b)
    Great relevance—projects with relevant socio-environmental impact, which present clear and significant contributions to the transformation of the electricity market or which bring relevant benefits beyond the energy impact.
    c)
    Pilot—promising, unpublished, or innovative projects, including technological and/or methodological pioneering, that seek experience to subsequently expand their scale of execution.
    d)
    Cooperative—projects involving more than one energy distributor, seeking economies of scale, the complementarity of skills, the application of best practices, and improvements in the efficiency and quality of the projects carried out.
The PROPEE is composed of 10 modules that cover various aspects of projects and the PEE program, with multiple interconnections between them. The focal modules are shown in Figure 1.
Table 2. Typologies and Characteristics of Energy Efficiency Projects (EEPROJ).
TypologiesEnergy Efficiency
Action
Special
Features
InvestmentPreferential Prospecting
Installation
Improvement
RecyclingTraining and
Qualification
Bonus for
Efficient
Equipment
Energy
Management
Generation with
Incentive Source
Solar HeatingPriorityGreat
Relevance
PilotCooperativeEnergy
Performance
Contract
Without Monetary Refund Public
Call for
Projects
Industrial
Commerce and services
Public
power
Public
services
Rural
Residence
Lowincome
Municipal
energy
management
Street
lighting
Educational
There is no provision in the regulation. • General rule. ✓ Allowed in specific cases.
Each PROPEE module, as shown in Figure 1, is detailed as follows:
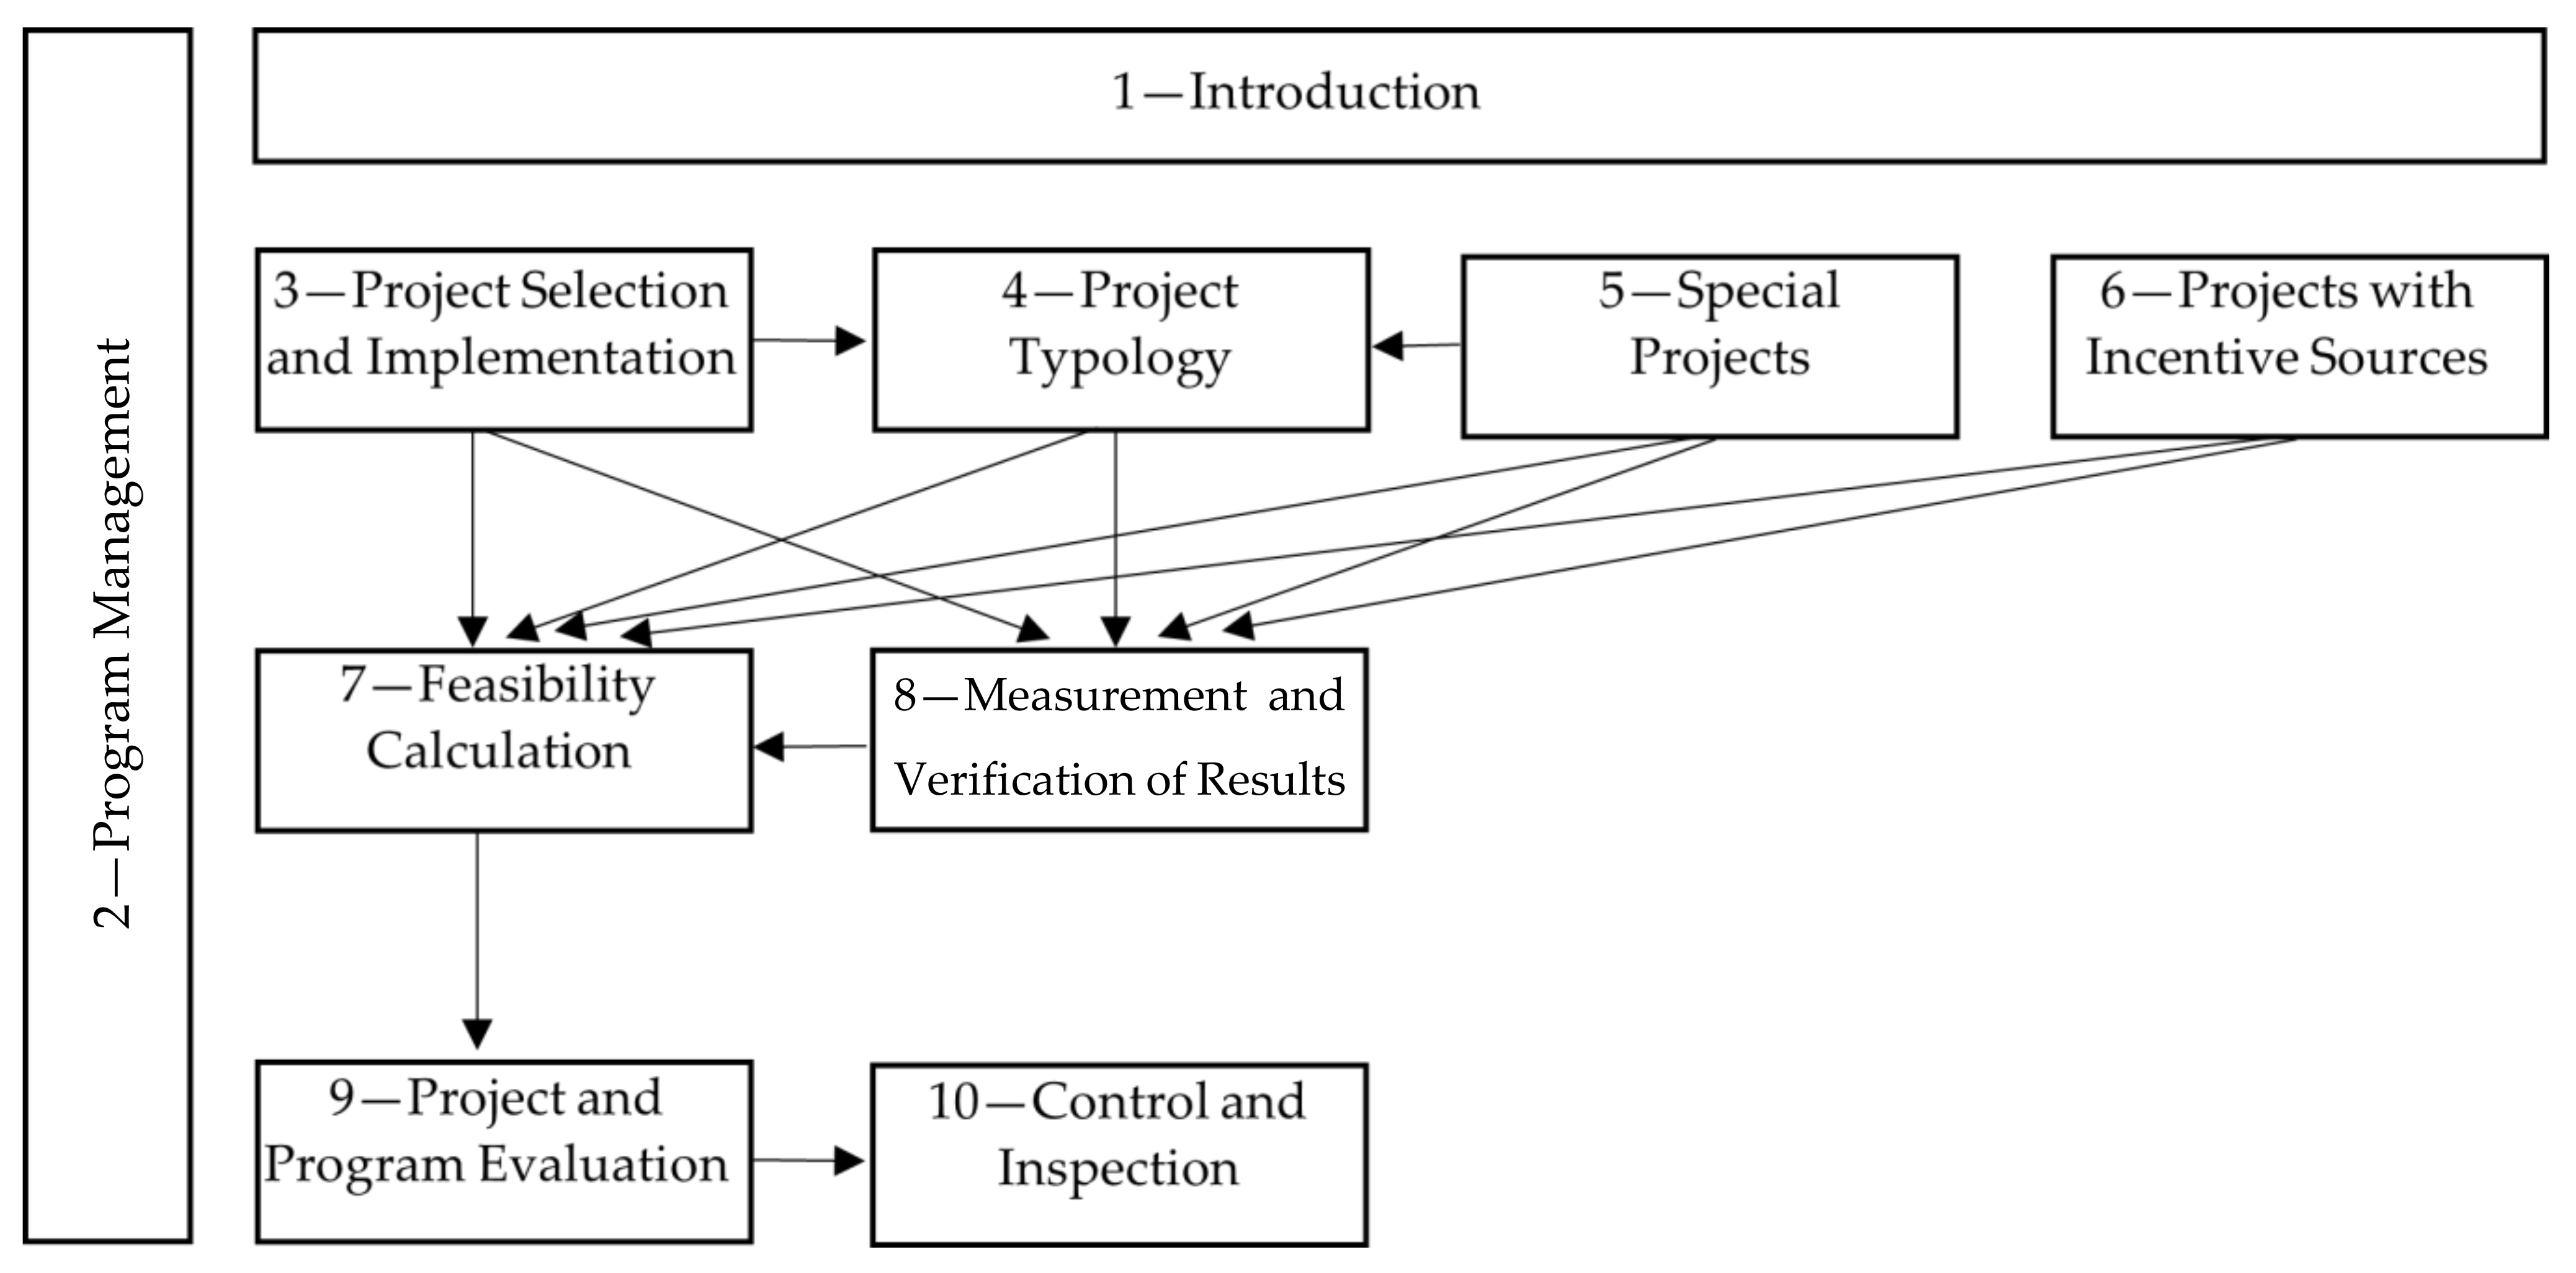
  • Module 1—Introduction presents an overview of PROPEE and the terms glossary;
  • Module 2—Program Management presents the managerial aspects that permeate the actions of PEE;
  • Module 3—Project Selection and Implementation presents a way to select projects for the PEE and provides guidance on implementation for the consumer or interested party;
  • Module 4—Project Typology presents the PEE project types and their main characteristics;
  • Module 5—Special Projects portrays projects that, due to their relevance or non-typical characteristics, need special attention, both from the distributor and the regulator;
  • Module 6—Projects with Incentive Sources comprises energy efficiency projects with the addition of a stimulated source to attend the consumer unit;
  • Module 7—Feasibility Calculation lays out the different factors and calculation forms that are considered to verify whether a project is economically viable and can be executed under the PEE, as well as other possible benefits that a project can obtain;
  • Module 8—Measurement and Verification of Results establishes the procedures for a reliable assessment of the energy benefits obtained from the projects;
  • Module 9—Project and Program Evaluation establishes the initial and final procedures for the evaluation of the PEE projects, and of the program as a whole for its improvement;
  • Module 10—Control and Inspection establishes the guidelines for project costs and inspection activities to be carried out by ANEEL.
A key feature in the strategic planning of investments in EEPROJ is its links to social and environmental aspects. It is evident that the sustainability aspect implies a clear vision of society and its integration into the environment, linked to the resulting benefits. Distributors’ energy efficiency programs enable investments in various types of projects that benefit different audiences based on the guiding concept of sustainability. Generally, each project follows the steps described in Figure 2 and are detailed as follows:
  • Selection—includes prospecting, pre-diagnosis, and project selection activities through a public call for projects or directly by the distributor;
  • Definition—definition of energy efficiency actions to be implemented with the respective technical–economic analysis and bases for M&V activities according to Module 8 (measurement and verification of results);
  • SGPE—loading the project into ANEEL’s PEE information system;
  • Initial evaluation—projects that require an initial evaluation according to Module 9 (project and program evaluation will be submitted to ANEEL’s prior evaluation);
  • Execution—implementation of energy efficiency actions;
  • Measurement and verification—reporting of M&V activities according to Module 8;
  • Financial accounting audit—elaboration of a report on the expenses incurred in the execution of the project;
  • Final report—elaboration of a report to present the results obtained after the conclusion of the project;
  • Final evaluation—mandatory for all projects developed under the PEE and is carried out according to Module 9 (project and program evaluation);
  • Monitoring—to assess the permanence of the energy efficiency actions implemented and changes in the market, follow-up studies will be carried out, as defined by ANEEL and according to Module 9 (assessment of projects and programs available on the regulatory agency’s portal).
Figure 2. Stages of EEPROJ (Energy Efficiency Projects).
Energies 15 01217 g002

2.1. Economic Viability

The criterion for evaluating the economic viability of the EEPROJ is the cost–benefit ratio (RCB). The benefit is the monetary value of energy saved and the reduction in peak demand during the lifetime of the project. The cost comprises the financial values generated by the project, consumers, and/or others for the implementation of the project.
According to the available data, two types of evaluations must be performed during the project:
  • Ex-ante evaluation is carried out with estimated values during the project definition phase. At this point, the costs and benefits of the project are evaluated based on field analyses, previous experiences, engineering calculations, and market price assessments.
  • Ex-post evaluation is performed with values measured through a measurement and verification protocol and is based on the costs spent. Thus, the energy savings and demand reduction during peak hours are evaluated.
Two types of studies for financial resources must be carried out in the two situations described above:
  • Comparison between the benefits and financial resources spent by the EEPROJ;
  • Comparison between the benefits and financial resources invested in the project by the PEE, consumers, and/or others.
Additionally, considering the perspective of those who evaluate, two types of studies can be conducted:
  • Considering the facility, calculate the energy savings and demand reduction as established in Module 7 of the Brazilian Tariff Regulation Procedures (PRORET);
  • Considering the consumer, calculate the energy savings and demand reduction of energy bills.
To assess the economic feasibility of the project carried out under the PEE, the perspective of the facility is considered, except in the case of incentive sources, where the price paid by the consumer can be taken as a reference.
Evaluating an EEPROJ made with consumer resources helps to recognize whether the benefit obtained is greater than it would have been if the resource had been used during the expansion of the electric system.
Based on this, the annual energy savings subtracted from the financial cost of expanding the electrical system is at least 25% greater than the project cost. Specifically, the cost–benefit ratio of the project must be less than or equal to 0.8. It is assumed that an additional 25% is considered due to the greater perceived risk of energy efficiency actions in relation to the expansion of the electricity system. According to ANEEL, this safety margin can be reduced as energy efficiency actions increase their credibility with consumers.
Therefore, the main criterion that guides the economic viability assessment of an EEPROJ is that the RCB calculated from the perspective of the facility and the PEE is less than or equal to 0.8. For energy performance contracts, which contemplates future payment commitments, an RCB less than or equal to 0.9 (nine-tenths) is ascertained. For projects with incentivized sources, an RCB less than or equal to 1.0 is associated with better tariffs and a new categorization of consumers.
If an EEPROJ has more than one end use (lighting, cooling, etc.), each must have its RCB calculated individually. The global RCB of the project must also be presented, considering the sum of costs and benefits.
Equation (1) defines the RCB cost–benefit ratio of an EEPROJ, where C A T corresponds to the total annualized cost (USD/year) and B A T represents the total annualized benefit value (USD/year).
R C B = C A T B A T
For the EEPROJ, with the addition of an incentivized source, the cost–benefit ratio is obtained according to Equation (2), where B A C G corresponds to the annual benefit of the generating plant (USD/year) and B A E E corresponds to the annual benefit of energy efficiency actions (USD/year).
R C B = C A T B A C G   + B A E E
The calculation of the total annualized costs follows the methodology indicated in Module 7 of PROPEE, as shown in Equations (3)—(6), where C A n corresponds to the annualized cost of each piece of equipment 𝑛 (USD/year).
C A T = n C A n
To obtain the annualized cost of each piece of equipment, C A n (USD/year) is used for Equation (4), where C E n is the cost of each piece of equipment (USD) and 𝐶𝑇 is the total cost of the project (USD).
C A n = C E n × C T C E T × F R C u
The total cost of n pieces of equipment C E T (USD) is obtained according to Equation (5).
C E T = n C E n
The capital recovery factor F R C u for 𝑢 years where 𝑢 is the useful life of the equipment (years) is obtained using Equation (6) with i representing the annual interest rate.
F R C u = i × 1 + i u 1 + i u 1
The total annualized benefits (USD/year) are obtained through Equation (7), where E S is the annual energy saved (MWh/year), C E E represents the unit cost of energy saved (MWh/year), R D P corresponds to the value of reduced demand in peak hours (kW), and C E D is the unit cost of avoided demand (USD/kW).
B A T   =   E S × C E E   +   R D P × C E D
For the EEPROJ with the addition of an incentivized source, the benefits must be computed separately according to their origin, as follows:
  • Generating power plant: the values of 𝐶𝐸𝐸 and 𝐶𝐸𝐷 are obtained according to final energy price and demand paid by the consumer, including taxes and charges;
  • Energy efficiency actions in energy end use: the values of 𝐶𝐸𝐸 and 𝐶𝐸𝐷 are calculated according to the cost associated with the expansion of the electricity system (when available), or from the blue hourly tariff, or according to the energy tariff system, as established in Module 7 of the Brazilian Tariff Regulation Procedures (PRORET) [17], without the incidence of taxes or charges.
The 𝐶𝐸𝐷 and 𝐶𝐸𝐸 are obtained through Equations (8) and (9), where 𝐶1 is the unit cost of peak demand (USD/kW/month); 𝐶2 is the unit cost of demand during off-peak hours (USD/kW/month); 𝐿𝑃 is the constant loss of demand during off-peak hours considering 1 kW of loss of demand during peak hours; 𝐶3 is the unit cost of energy during peak periods of dry periods (USD/MWh); 𝐶4 is the unit cost of energy during peak periods of wet periods (USD/MWh); 𝐶5 is the unit cost of energy during off-peak hours of dry periods (USD/MWh); 𝐶6 is the unit cost of energy during off-peak hours of wet periods (USD/MWh); 𝐿𝐸1 is the energy loss constant at the peak of dry periods considering 1 kW of loss of peak demand; 𝐿𝐸2 is the energy loss constant at the peak of wet periods considering 1 kW of peak demand loss; 𝐿𝐸3 is the energy loss constant at the peak of dry periods considering 1 kW of loss of demand during the off-peak hours; and 𝐿𝐸4 is the energy loss constant at the peak of wet periods considering 1 kW of demand loss in off-peak hours.
C E D   =   12 × C 1   +   12 × C 2 × L P
C E E   =   C 3 × L E 1   +   C 4 × L E 2   +   C 5 × L E 3   +   C 6 × L E 3 L E 1 + L E 2 + L E 3 + L E 4
This calculation is based on the system impact of the avoided load, assuming a typical load profile and a system characterized by the load factor (Fc). The losses avoided in the system are calculated from the reduction of 1 kW at the tip, its reflection on the out-of-point ( L P ) demand through the load factor, and the loss factors (Fp), which lead to the calculation of LE1, LE2, LE3, and LE4, together with the permanence of each time station in the year, giving 450, 315, 4686, and 3309 h/year, respectively), which measures the reflection of this reduction in the off-peak time and the energy consumed in different tariff posts. The loss factor can be simulated through the load factor using Equation (10).
F p = k × F c + 1 k × F c 2
Table 3 presents the coefficients calculated using ANEEL for 𝑘 = 0.15. The avoided energy and demand correspond to a reduction of losses in the system and the benefit of "avoiding a unit of losses is numerically equal to the cost of providing an additional unit of charge" [18].
Energy saved E S (MWh/year) and peak demand reduction R D P (kW) are the main quantitative indicators for the EEPROJ calculated based on the proposed methodology for each final use (PROPEE). Hence, for the final use "lighting system," these quantities are obtained through Equations (11) and (12), respectively, where q a j is the number of lamps in the current system j ; p a j is the power of the lamp and ballast in the current system j (W); h a j is the current operating time of system j (h/year); q p j is the number of lamps in the proposed system j ; p p j is the power of the lamp and ballast in the proposed system j (W); h p j   is the operating time of the proposed system j (h/year); F C P p j is the tip coincidence factor in the current system j; and F C P p j is the tip coincidence factor in the proposed system j .
E S = S i s t e m   j q a j × p a j × h a j S i s t e m   j q p j × p p j × h p j × 10 6
R D P = S i s t e m   j q a j × p a j × F C P a j S i s t e m   j q p j × p p j × F C P p j × 10 3
The estimate of the peak coincidence factor ( F C P ) can be obtained through Equation (13), where n m is the number of months throughout the year of use at peak hours (≤12 months); n d is the number of days during the month of use during peak hours (≤22 days); n u p is the number of hours of use during peak hours (≤3 h), and 792 is the number of peak hours available over one year.
F C P = n m × n d × n u p / 792

3. Results—Case Study

The IFG had more than 12,000 students throughout its 14 operating campuses, as shown in Figure 3. The EEPROJ was held on 11 IFG campuses located in the following cities: Jataí, Uruaçu, Itumbiara, Anápolis, Águas Lindas, Goiás, Formosa, Luziânia, Aparecida de Goiânia, Senador Canedo, and Valparaíso. Table 4 shows the contracted demand, total annual energy consumption, and average annual energy cost of each campus. The input voltage level at the IFG campuses was 13.8 kV, with peak hours from 6:00 p.m. to 9:00 p.m.
The EEPROJ on each campus was comprised of the following activities:
  • Replacement of existing lighting systems with new and more efficient models;
  • Disposal of replaced equipment;
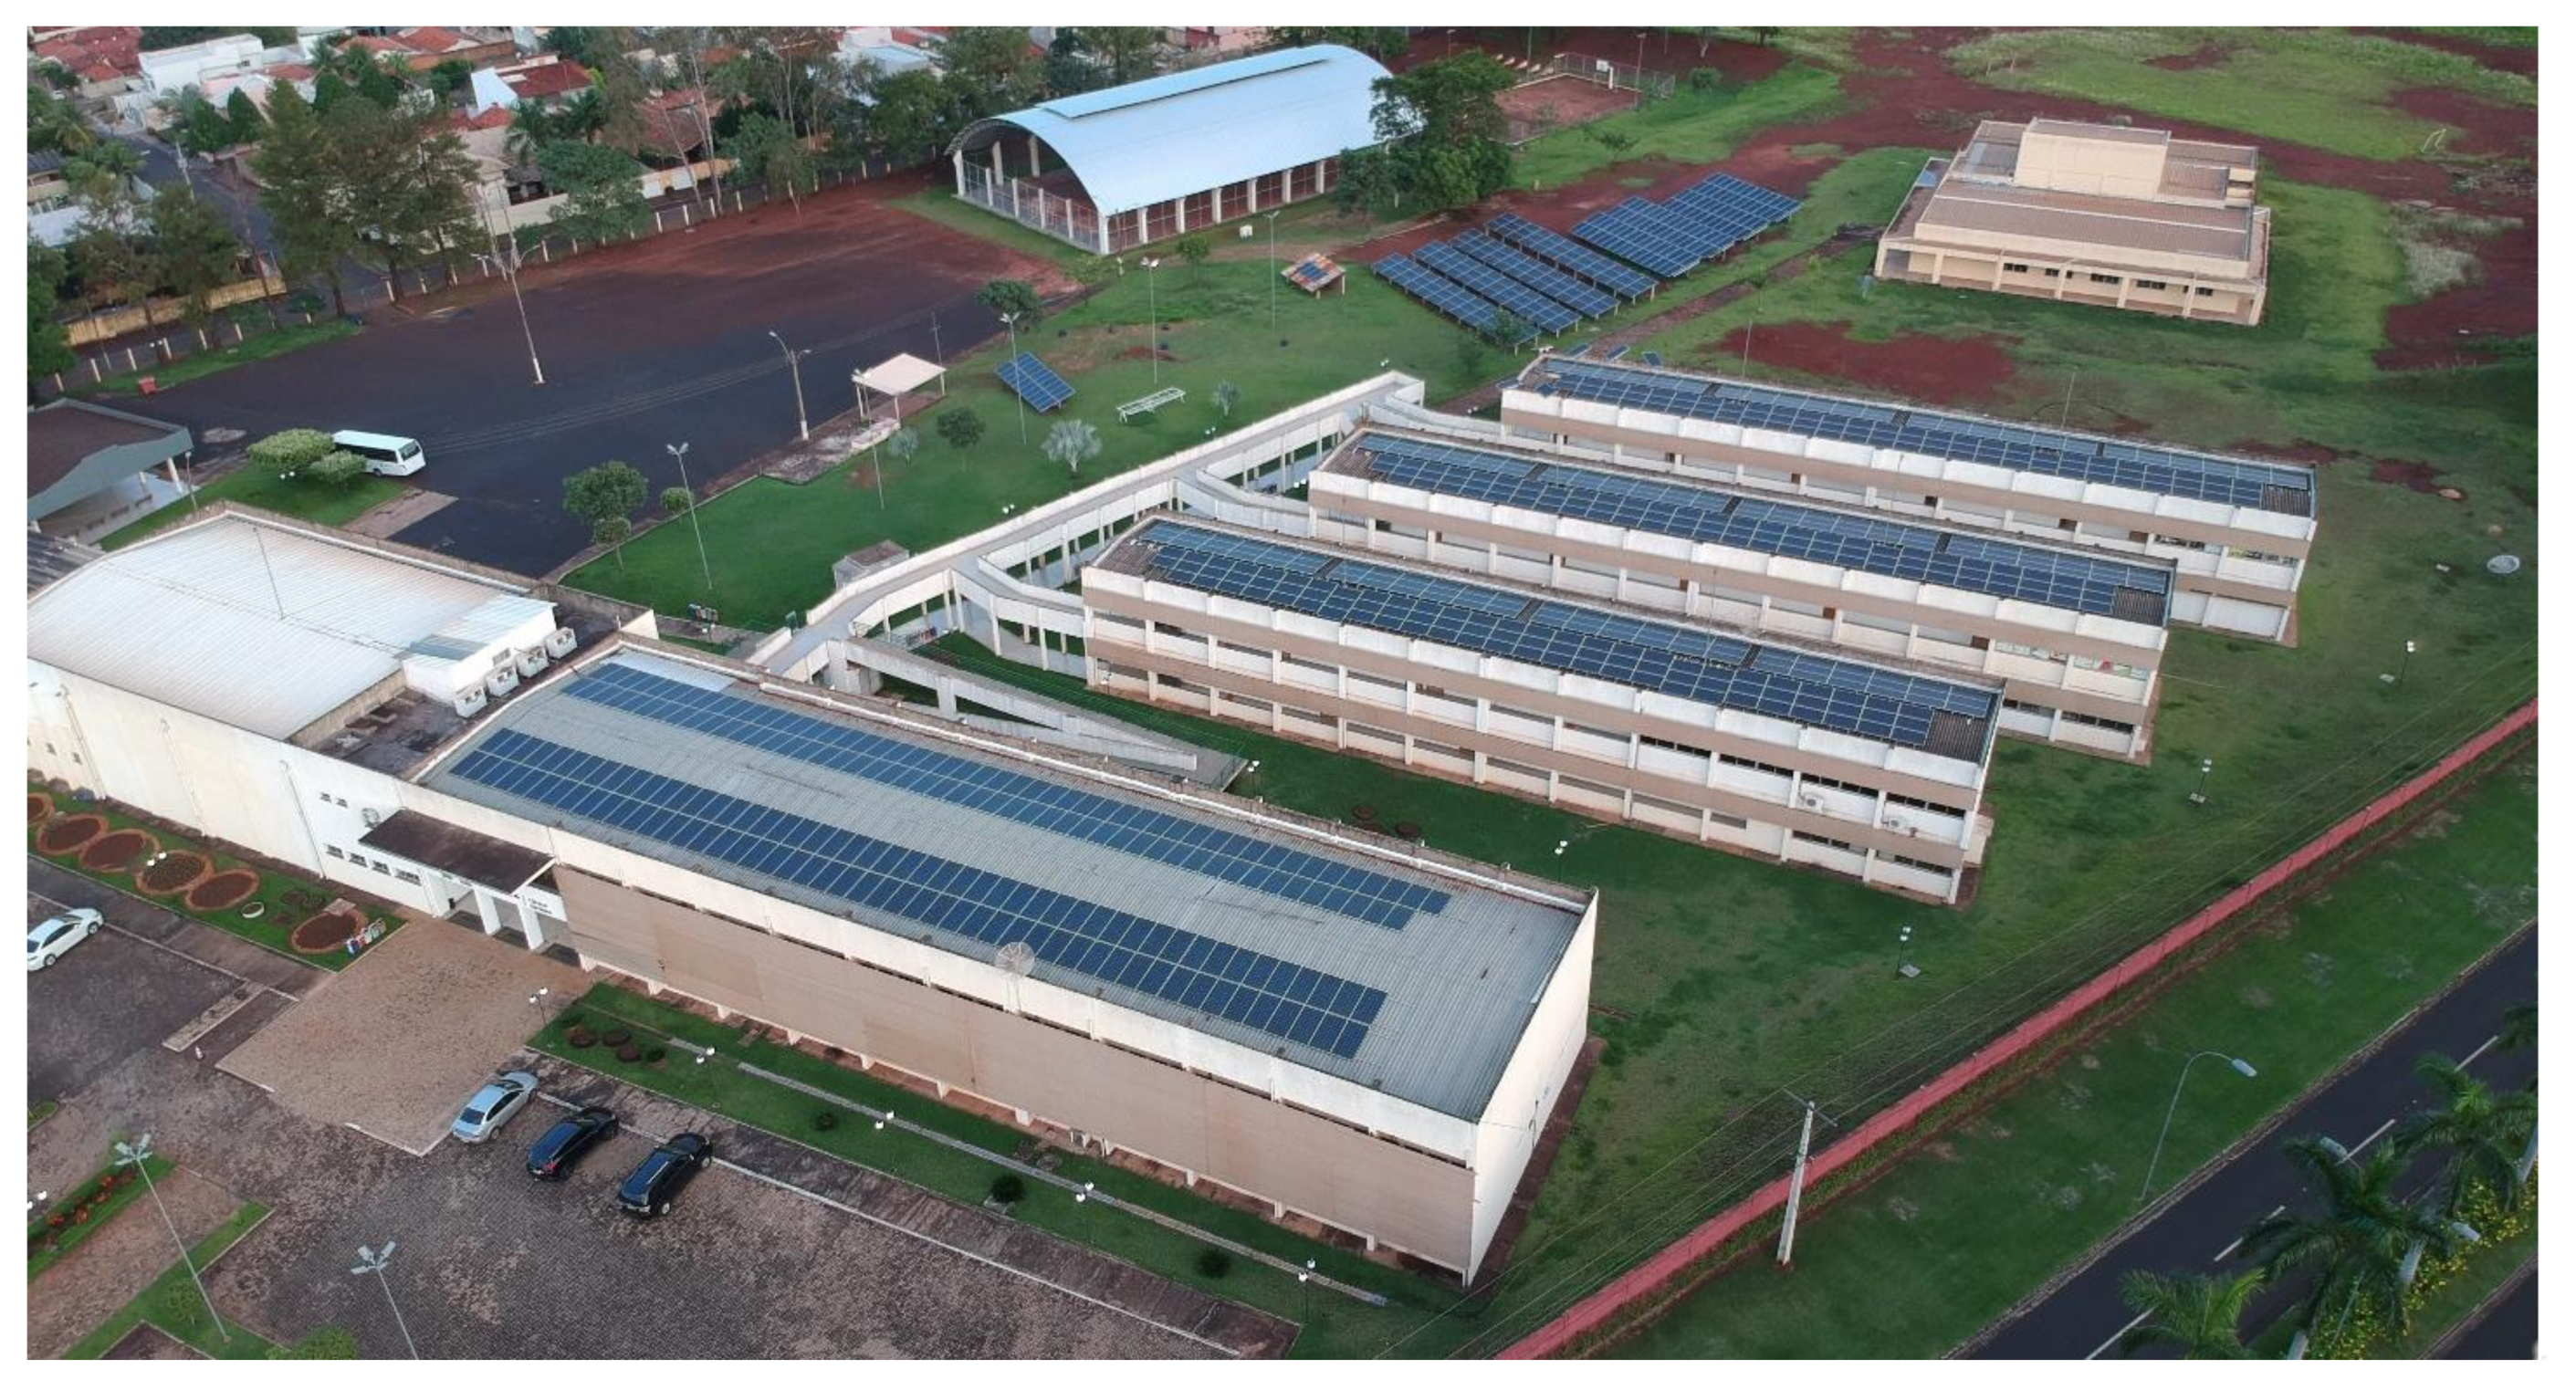
  • Installation of micro and mini PV energy generation systems;
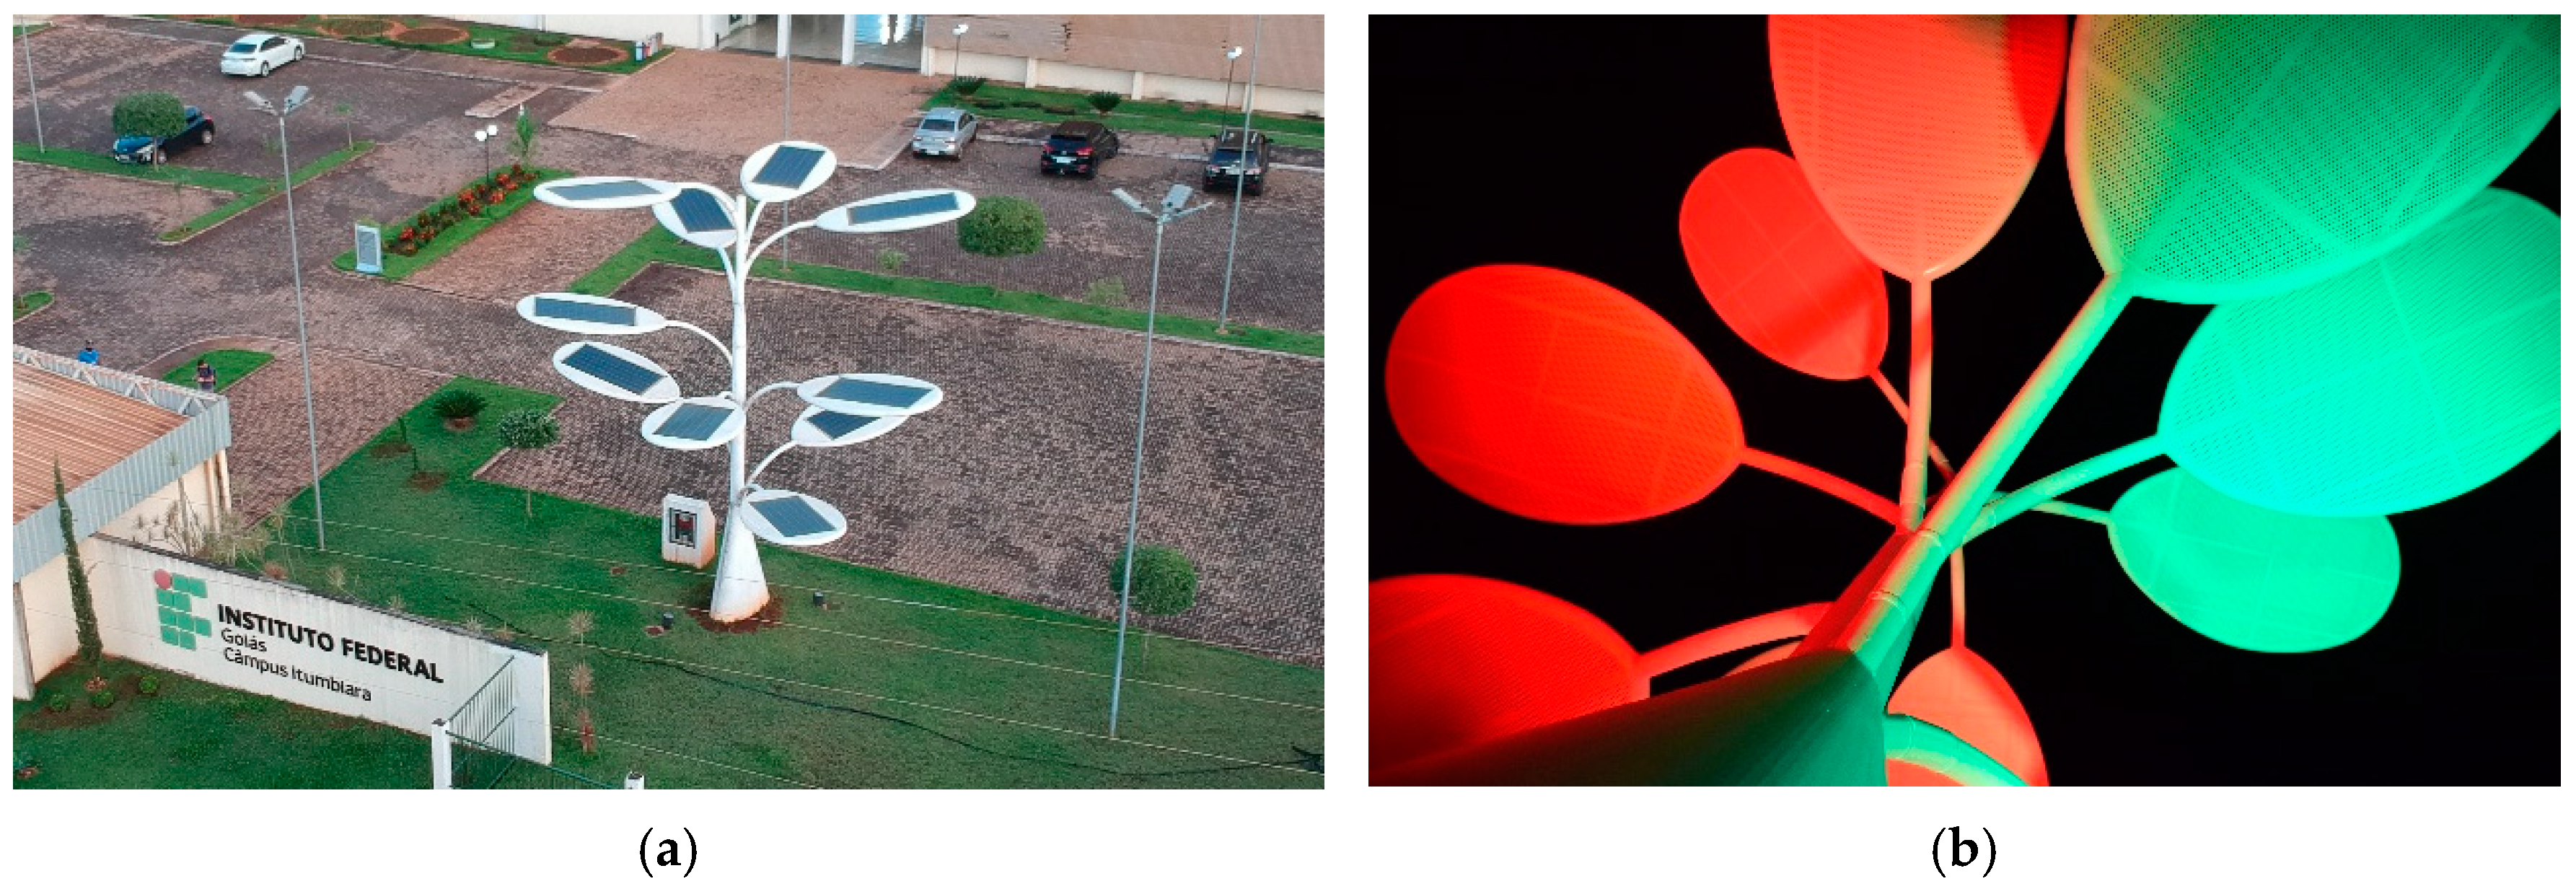
  • Installation of a PV energy generation tree;
  • Implementation of an energy generation monitoring system;
  • Making users aware of the efficient use of energy.

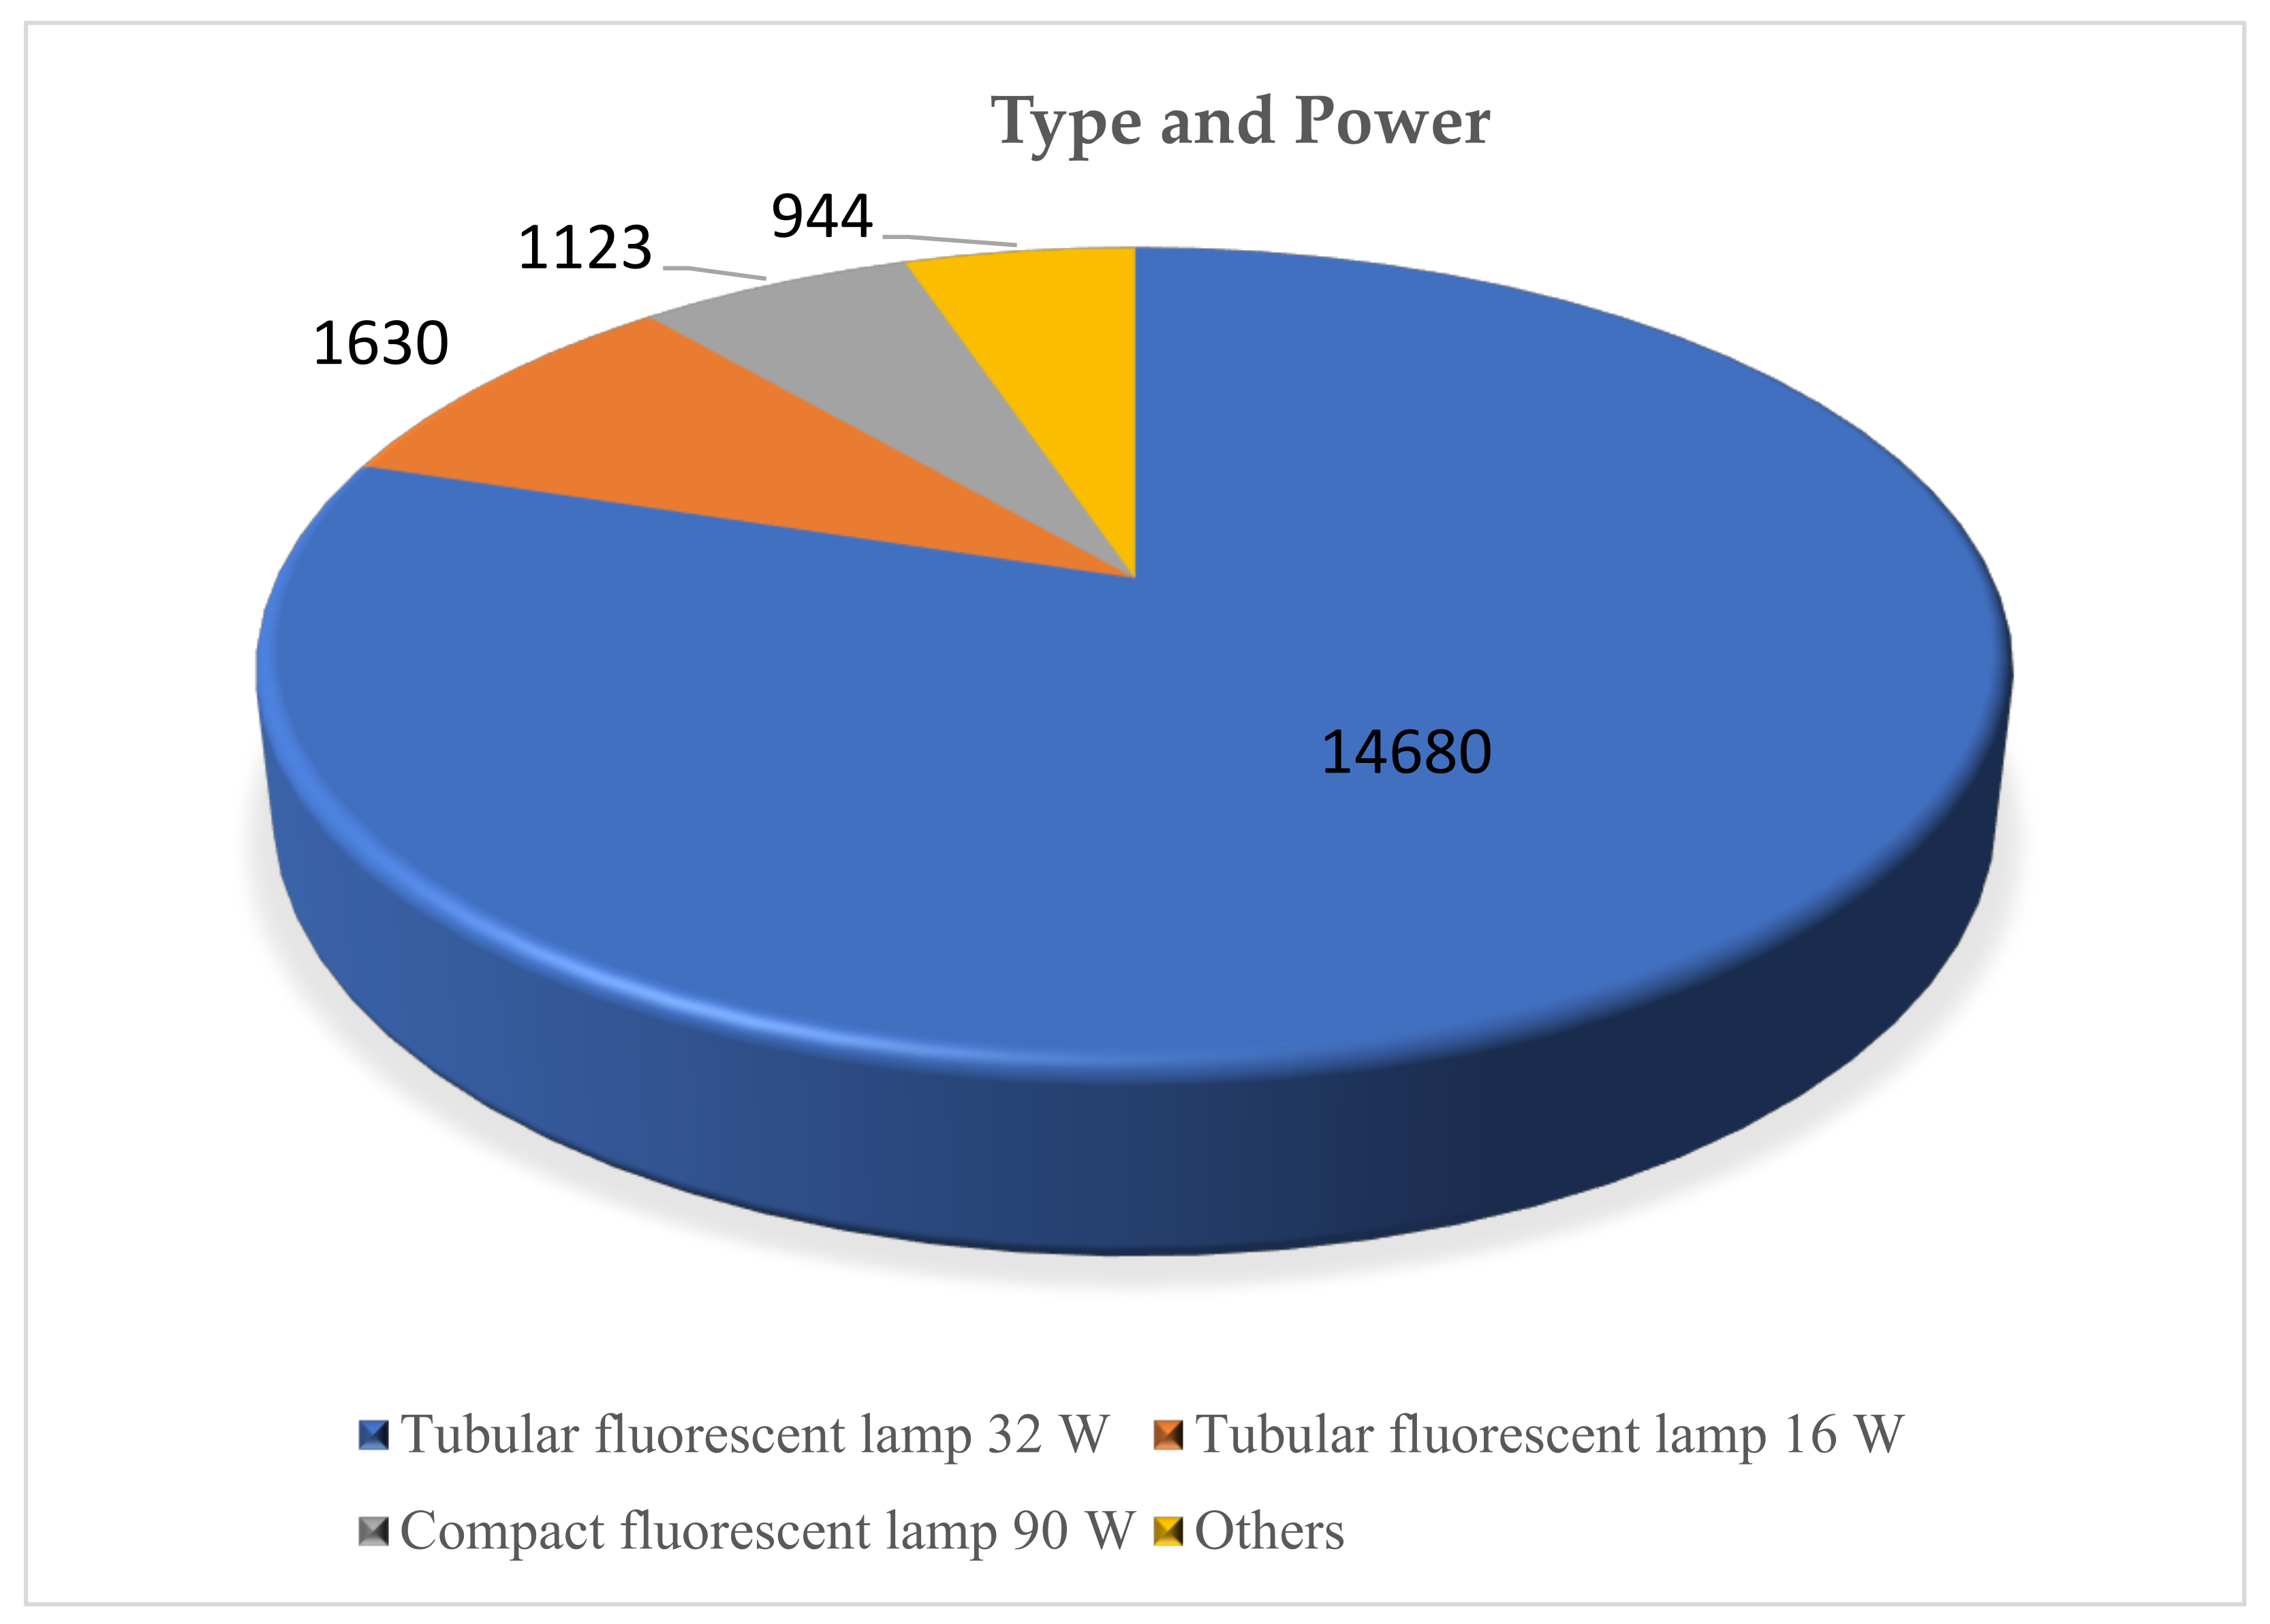
3.1. Retrofit Lighting System

A survey of the lighting system by type and power was conducted and the results are presented in Figure 4 and Table 5. We analyzed 18,377 lamps with the potential to be replaced by lamps with more efficient technology. The estimate of the number of hours per year of operation of the lighting system showed that the lamps were switched on for 12 h per day, 22 days per month, over 10 months. The total operating hours of lighting systems are 2640 h per year.
The methodology adopted for the efficiency of the lighting system was based on technological advances, as most modern systems can produce the same amount of light with less energy and are certified by the National Institute of Metrology, Quality, and Technology (INMETRO) and the National Electric Energy Conservation Program (PROCEL). Thus, it was proposed that the old lamps be replaced with new lamps utilizing LED technology that offer high efficiency, physical robustness, long life expectancy, and low power consumption [19].
Subsequently, an equivalence table between the old and the new system was established based on manufacturers’ catalogs and similar projects carried out by the electric energy distributor. Table 6 summarizes this equivalence.
According to the methodology presented in Section 2, an economic analysis was performed. An energy saving ( E S ) of 867.94 MWh/year and a peak demand reduction   R D P of 309.63 kW were obtained with the energy efficiency improvement of the proposed system. In addition, the unit saved a cost of energy ( C E E ) of 52.47 USD/MWh and cost of demand ( C E D ) of 79.14 USD/kW/year. These were obtained according to the tariff mode without incurring taxes or charges and were used for the economic viability analysis of the lighting system.
The RCB obtained a value of 0.50, meaning that the lighting systems highlighted the energy efficiency potential that the project offers. The annualized cost ( C A T ) of USD 34,895.03 was much lower than the annualized benefit ( B A T ) value of USD 70,044.65, demonstrating the technical and economic feasibility of the new lighting system. Table 7 summarizes the economic results.

3.2. Disposal of Replaced Equipment

The retrofitted lighting systems were installed at the 11 campuses during the years 2019 and 2020, resulting in a large amount of materials and waste to be disposed of in accordance with the current Brazilian environmental legislation. As a result of this process, recyclable glass, aluminum terminals, decontaminated lamp dust, metallic mercury, and reactor scrap were obtained for recycling companies. Figure 5 shows a portion of the discarded material.

3.3. Micro and Mini Power Generation Systems

The IFG had an area of approximately 48,000 m2 in terms of the roofs of the buildings. This study used part of that area for the installation of PV solar energy generation systems to compensate for the energy consumption, as established by ANEEL Resolution 482 of 2012, updated by resolution 687/2015 [5].
The proposed generation system aimed to install approximately 3076 PV modules on the roofs of selected campus buildings, with a total capacity of 1 MWp. Table 8 presents the characteristics of the PV modules used in this project.
Based on the contracted demand and the total installed power of 1 MWp, the value of each system was established for each campus, as shown in Table 9. The power generation was simulated based on the information in Table 8 and Table 9, as well as on the hourly average monthly solar irradiation in kW/m2 of the cities where the IFG campuses were located.
After dimensioning the PV generation systems, the annualized costs were calculated following the methodology described in Section 2.1.
The energy saved ( E S ) in MWh/year was the average annual generation of all PV plants, which was 1,736.9 MWh/year, as can be seen in Table 8. The peak demand reduction ( R D P ) in kW was null, as there was no electricity generation during peak hours (19:00 to 21:00). Table 10 summarizes the economic feasibility analysis of PV generation systems.
The RCB of 0.77 in the PV generation systems showed the potential for energy efficiency that the system offers. The annualized cost ( C A T ) of USD 101,288.97 was less than that of the annualized benefit ( B A T ) of USD 131,564.26, demonstrating the technical/economic feasibility of the proposed power generation system.
PV generation systems installed on the IFG campus were monitored using an online energy monitoring system. Information about each system, such as operating status; installed power; energy generated per day, month, and year; monetary value of generated energy; avoided carbon emission; and inverter configuration parameters, can be viewed and accessed remotely. A schematic of the monitoring system structure is shown in Figure 6. Figure 7 shows an example of a photovoltaic system installed in one of the IFG campuses.

3.4. User Awareness for the Efficient Use of Energy

This project also provided training on the efficient and safe use of electricity for teachers, students, and employees. The following topics were covered:
  • Energy efficiency program: What is energy efficiency? What are the PROPEE? What actions have been implemented in the IFG? What are the expected results? What are the benefits for the community and environment?
  • Operation and maintenance of new systems: How does an efficient lighting system work? What are its components? How can we operate and maintain this? How does a PV generation plant work? What are its components? How can we operate and maintain this? How does the monitoring system work? How can we operate and maintain this?
A solar tree is another device for the efficient use of energy and we must raise awareness about it. The solar tree is electrical equipment installed at the Itumbiara campus as a visually striking, artistic urban monument. It is a form of technological and service equipment, bringing a symbiotic relationship with nature that enriches and creates a new perception of public space, thus promoting sustainability worldwide. Unlike traditional PV systems, the position of the PV panels in the solar tree takes a radial form in its arrangement, similar to plants, for the capture of solar energy. This pattern is called a spiral phyllotaxis.
The solar tree system generates power of 3.3 kWp obtained from ten photovoltaic panels framed by tubular metal petals and perforated plates, facilitating heat exchange, and maintaining the efficiency of the system. Figure 8a shows the installed solar tree, allowing us to see the petals fixed on the trunk, reaching a height of 10.20 m. The power grid connection is carried out by means of an inverter installed near the base; in the surrounding of the tree, there is a programmable LED lighting system, displaying various color settings, as can be observed in Figure 8b.
With these characteristics, the solar tree assumes the role of a monument that represents the whole principle that permeates the motivation of the project realization in a visually appealing way. In this concept of sustainable action, the energy gains further help with the implementation of new technologies. This is a motivating agent that can help with lessening the bias associated with the aspect of sensitization of these new technologies.

3.5. Global Economic Analysis of the Project

The project has lighting and the installation of PV generation systems as end uses, each of which has the RCB value calculated separately. However, considering the sum of costs and benefits of all the proposed systems, it is necessary to present the global RCB of the project. As it is an energy efficiency project with the addition of an incentivized source of energy (PV generation), the overall RCB result of the project obtained was 0.68. As this value is less than 1.0, the project proposed in this work is considered technically and economically viable under the ANEEL Energy Efficiency Program. Table 11 presents the results of the economic feasibility analysis of the project. Table 12 summarizes the main project information.
The implementation of the project will result in annual savings of approximately USD 197,321.85 for the IFG, which corresponds to a 58% reduction in the energy bill.

4. Discussion

The multiplier effect of implementing an energy efficiency project goes far beyond the public benefits of energy savings and demand avoided during peak electrical system hours. An important goal is to implement a culture that is unwilling to withstand electricity waste and raise consumer awareness (students, teachers, technicians, and members of society) regarding the sustainable use of renewable and non-renewable natural resources. The possibility of replicating the project to other teaching units and other public institutions was also decisive in choosing the IFG as a case study, as it maximizes the process of transforming the electricity market, stimulating the development of new technologies, and the creation of efficient energy use habits.
Another benefit of the EEPROJ is that to meet the notice of call No. 001/2016/ANEEL, the IFG is developing, in partnership with the energy utility company, an R&D project involving several researchers and students whose objective is the development of five subprojects, as described below:
  • Evaluate the effects of wind on the PV panels installed on building rooftops.
  • Analyze the technical impact on the energy distribution networks due to the insertion of the distributed generation and energy efficiency actions using a simulation software integrated into the energy distributor system.
  • Implement a complete sewage collection and treatment system and a pilot plant for the use of biogas at the IFG Aparecida de Goiânia campus. In addition, study the cooling of PV panels with reused water to maintain the conversion efficiency.
  • Develop an experimental platform for the connection and interfacing of PV systems to the electricity grid.
  • Conduct an economic feasibility analysis applying deterministic and stochastic methods for the installation of distributed generation systems, with simulation software as a product.
The experience with the implementation of the energy efficiency project indicates the possibility of using other criteria consolidated in the literature for the analysis of the economic viability of the projects, such as the payback time or internal return rate. However, this would result in a limitation of the use of financial resources destined for PEE actions.

5. Conclusions

The search for a balance between the supply and demand of electricity has been increasingly necessary and challenging. With higher fossil energy supply costs and concerns regarding climate change, energy efficiency is an important issue regarding meeting demand, contributing to energy security, low tariffs, a competitive economy, and reducing greenhouse gas emissions.
This work sought to evaluate the technical/economic feasibility of reducing energy waste and improving the energy efficiency of equipment, processes, and energy end uses through a case study applied on 11 Federal Institute of Education, Science, and Technology of Goiás (IFG) campuses. These actions were linked to the implementation of PV electricity generation systems in compliance with the guidelines established by the National Electric Energy Agency (ANEEL).
The analysis methodology confirmed the importance of energy-efficient actions associated with distributed generation. Furthermore, it shows the energy savings potential for the country and should be used as an instrument that is capable of creating a future strategy for meeting the expansion of the electricity market.
There is potential for energy efficiency in lighting and the deployment of distributed generation through PV generation systems. The methodology adopted for the lighting system efficiency was based on the current technological advancement of the devices used. Most modern systems can produce the same amount of lighting using less energy. Thus, replacing the old lighting system with a new system using LED technology lamps was proposed and implemented. For the implementation of the PV systems, total power of 1 MWp distributed on 11 IFG campuses with a total annual average generation of 1736.90 MWh was considered.
From the point of view of technical and economic feasibility, updating the lighting system resulted in a good cost–benefit ratio (RCB) of 0.50. The implementation of photovoltaic generation systems resulted in an RCB of 0.77. The global RCB for the project was calculated to be 0.68. Therefore, the project proposed in this work is considered viable under the ANEEL energy efficiency program. However, it is important to highlight the resulting monetary savings, approximately USD 197,321.85 per year, corresponding to a 58% reduction in the energy bill. In addition to the energy and economic gains that the project provided, the new electrical installations on the campuses will serve as laboratories for future research, thus stimulating the continuous engagement of consumers in promoting the efficient use of natural resources. However, the implementation of projects, such as the one presented in this work, have their scope and methodology limited to the current legislation and, as the product of public policy, they are subject to the discontinuity of or reduction in financial resources.

Author Contributions

A.F. and G.L. contributed mainly to the survey and analysis of the case study information. G.V. and J.L.D. coordinated the general studies through a research and development project and contributed their expertise in the topic of energy efficiency and distributed generation. B.A., E.M., and all authors provided technical support during the research stages and contributed to the final writing of the article. All authors have read and agreed to the published version of the manuscript.

Funding

The autors would like to thank the Enel Distribuição Goiás for financial support to conduct the research through the resources of the Energy Efficiency Program, regulated by Brazilian Law No. 9991/2000 (Aneel Project number APLPEE06072_0018_S01).

Informed Consent Statement

Not applicable.

Data Availability Statement

Data sharing is not applicable to this article.

Acknowledgments

The authors would like to thank the Federal Institute of Goiás (IFG) for their support in obtaining project data.

Conflicts of Interest

The authors have no conflicts of interest to declare.

Nomenclature

IFGFederal Institute of Education, Science, and Technology of Goiás
DGDistributed generation
EEEnergy efficiency
PBEBrazilian Labeling Program
PROCELNational Electric Energy Conservation Program
CONPETNational Program for the Rationalization of the Use of Natural Oil and Gas Derivatives
PEEEnergy Efficiency Program
ANEELNational Electric Energy Agency
INMETRONational Institute of Metrology, Quality, and Technology
PNE20302030 National Energy Plan
PNEfNational Energy Efficiency Plan
ProGDDevelopment of Distributed Electricity Generation
PROPEEProcedures of the Energy Efficiency Program
EEPROJEnergy efficiency projects
PRORETBrazilian Tariff Regulation Procedures
LEDLight-emitting diode
PV systemsPhotovoltaic systems
M&VMeasurement and verification
RCBCost–benefit ratio
C A T Total annualized cost (USD/year)
B A T Total annualized benefit value (USD/year)
B A C G Annual benefit of the generating plant (USD/year)
B A E E Annual benefit of energy efficiency actions (USD/year)
C A n Annualized cost of each piece of equipment 𝑛 (USD/year)
C E n Cost of each piece of equipment (USD)
𝐶𝑇Total cost of the project (USD)
C E T Total cost of n pieces of equipment (USD)
F R C u Capital recovery factor for u years
𝑢Useful life of the equipment (years)
iAnnual interest rate
E S Annual energy saved (MWh/year)
C E E Unit cost of energy saved (MWh/year)
R D P Reduced demand during peak hours (kW)
C E D Unit cost of avoided demand (USD/kW)
𝐶1Unit cost of peak demand (USD/kW/month)
𝐶2Unit cost of demand during off-peak hours (USD/kW/month)
𝐶3Unit cost of energy during peak periods of dry periods (USD/MWh)
𝐶4Unit cost of energy during peak periods of wet periods (USD/MWh)
𝐶5Unit cost of energy during off-peak hours of dry periods (USD/MWh)
𝐶6Unit cost of energy during off-peak hours of wet periods (USD/MWh)
𝐿𝑃Constant loss of demand during off-peak hours, considering 1 kW of loss of demand during peak hours
𝐿𝐸1Energy loss constant at the peak of dry periods considering 1 kW of loss of peak demand
𝐿𝐸2Energy loss constant at the peak of wet periods considering 1 kW of peak demand loss
𝐿𝐸3Energy loss constant at the peak of dry periods considering 1 kW of loss of demand in the off-peak hours
𝐿𝐸4Energy loss constant at the peak of wet periods considering 1 kW of demand loss in off-peak hours
FcLoad factor
FpLoss factor
qaiNumber of lamps in the current system i
paiPower of the lamp and ballast in the current system i (W)
haiCurrent operating time of system i (h/year)
qpiNumber of lamps in the proposed system i
ppiPower of the lamp and ballast in the proposed system i (W)
hpiOperating time of the proposed system i (h/year)
FCPaiTip coincidence factor in the current system i
FCPpiTip coincidence factor in the proposed system i
n m Number of months throughout the year of use at peak hours (≤12 months)
n d Number of days during the month of use during peak hours (≤22 days)
n u p Number of hours of use during peak hours (≤3 h)
792 Number of peak hours available over one year

References

  1. Da Silva, E.P.; Marin Neto, A.J.; Ferreira, P.F.P.; Camargo, J.C.; Apolinário, F.R.; Pinto, C.S. Analysis of hydrogen production from combined photovoltaics, wind energy and secondary hydroelectricity supply in Brazil. Solar Energy 2005, 78, 670–677. [Google Scholar] [CrossRef]
  2. Energy Research Company (EPE). DEA Technical Note 07/13: Assessment of Energy Efficiency and Distributed Generation for the Next 10 Years (2013–2022). 2013. Available online: https://www.epe.gov.br/sites-pt/publicacoes-dadosabertos/publicacoes/PublicacoesArquivos/publicacao-245/topico-266/20140102_1[1].pdf (accessed on 13 October 2019).
  3. Silva, R.; Oliveira, R.; Tostes, M. Analysis of the Brazilian Energy Efficiency Program for Electricity Distribution Systems. Energies 2017, 10, 1391. [Google Scholar] [CrossRef] [Green Version]
  4. Ripple, W.J.; Wolf, C.; Newsome, T.M.; Galetti, M.; Alamgir, M.; Crist, E.; Mahmoud, M.I.; Laurance, W.F. World scientists’ warning to humanity: A second notice. BioScience 2017, 67, 1026–1028. [Google Scholar] [CrossRef]
  5. Energy Research Company (EPE). DEA Technical Note 025/17: Energy Efficiency Studies—Monitoring the Progress of Energy Efficiency in Brazil. Ministério de Minas e Energia: Brasilia, Brazil, 2017. Available online: https://www.epe.gov.br/sites-pt/publicacoes-dados-abertos/publicacoes/PublicacoesArquivos/publicacao-251/topico-311/DEA%20025-17%20-%20%20Indicadores%20de%20Efici%C3%AAncia%20Energ%C3%A9tica.pdf (accessed on 20 September 2020).
  6. National Electric Energy Agency (ANEEL). Normative Resolution 482. 2012. Available online: http://www2.aneel.gov.br/cedoc/ren2012482.pdf (accessed on 15 September 2019).
  7. Ates, Y.; Boynuegri, A.; Uzunoglu, M.; Nadar, A.; Yumurtacı, R.; Erdinc, O.; Paterakis, N.; Catalão, J. Adaptive Protection Scheme for a distribution system considering grid-connected and islanded modes of operation. Energies 2016, 9, 378. [Google Scholar] [CrossRef]
  8. Electrical Energy Research Center—CEPEL. Guide to Energy Efficiency in Public Buildings. 2014. Available online: https://www.gov.br/mme/pt-br/assuntos/noticias/mme-lanca-guia-para-eficiencia-energetica-nas-edificacoes-publicas (accessed on 3 February 2022).
  9. Law 10295 of 17 October 2001. Presidency of the Republic. Brazil. 2001; pp. 1–2. Available online: http://www.planalto.gov.br/ccivil_03/leis/leis_2001/l10295.htm (accessed on 20 September 2020).
  10. Law 9991 of 24 July 2000. Presidency of the Republic. Brazil. 2000; pp. 1–7. Available online: http://www.planalto.gov.br/ccivil_03/leis/l9991.htm (accessed on 18 October 2019).
  11. Ministry of Mines and Energy (MME)/Energy Research Company (EPE). 2030 National Energy Plan: Projections. 2007. Available online: http://www.epe.gov.br/PNE/20080512_2.pdf (accessed on 12 September 2019).
  12. Ministry of Mines and Energy (MME). National Plan for Energy Efficiency: Premises and Basic Directives. 2011. Available online: http://antigo.mme.gov.br/web/guest/secretarias/planejamento-e-desenvolvimento-energetico/publicacoes/plano-nacional-de-eficiencia-energetica(accessed on 15 January 2021).
  13. National Electric Energy Agency (ANEEL). Normative Resolution 687. 2015. Available online: http://www2.aneel.gov.br/cedoc/ren2015687.pdf (accessed on 20 September 2020).
  14. Ministry of Mines and Energy (MME). Ordinance 538. Distributed Electricity Generation Development Program (ProGD). 2015. Available online: http://www.abgd.com.br/portal/doc/201904150125-01-49a661_7be2db8614614903ab1c552ec2025e60.pdf. (accessed on 10 September 2020).
  15. National Electric Energy Agency (ANEEL). Public Call for Priority Projects for EE and Strategic R&D No. 01/2016—Energy Efficiency and Minigeneration in Public Institutions of Higher Education. 2016. Available online: https://www.aneel.gov.br/documents/656831/14930433/Prioritário+e+Estratégico+%28Edital+final%29/7817f2ab-0f65-42b8-b8d4-e91a2b61239f (accessed on 10 September 2020).
  16. National Electric Energy Agency (ANEEL). Procedures of the Energy Efficiency Program (PROPEE). 2018. Available online: https://www.aneel.gov.br/pt/programa-eficiencia-energetica/ (accessed on 14 October 2019).
  17. National Electric Energy Agency (ANEEL). Tariff Regulation Procedures (PRORET). 2011. Available online: https://www.aneel.gov.br/procedimentos-de-regulacao-tarifaria-proret (accessed on 5 September 2019).
  18. National Electric Energy Agency (ANEEL). Normative Resolution 920. 2021. Available online: https://www.in.gov.br/en/web/dou/-/resolucao-normativa-aneel-n-920-de-23-de-fevereiro-de-2021-*-306209537. (accessed on 12 January 2022).
  19. De Almeida, A.; Santos, B.; Paolo, B.; Quicheron, M. Solid state lighting review—Potential and challenges in Europe. Renew. Sustain. Energy Rev. 2014, 34, 30–48. [Google Scholar] [CrossRef]
Figure 1. PROPEE (Procedures of the Energy Efficiency Program) Modules.
Energies 15 01217 g001
Figure 3. Geographic Locations of the IFG Campuses in the State of Goiás, Brazil.
Energies 15 01217 g003
Figure 4. Type and Power of Lamps.
Energies 15 01217 g004
Figure 5. Lamps and Electronic Ballasts Removed for Disposal.
Energies 15 01217 g005
Figure 6. Energy Monitoring System.
Energies 15 01217 g006
Figure 7. PV System—Itumbiara Campus.
Energies 15 01217 g007
Figure 8. (a) Solar Tree; (b) Solar Tree with LED Lighting.
Energies 15 01217 g008
Table 3. Coefficients of equations for 𝑘 = 0.15.
Factor of ChargeLPLE1LE2LE3LE4
0.30.250.27320.19120.35170.2483
0.350.28090.28490.19950.52030.3674
0.40.31360.29730.20810.71010.5015
0.450.34810.31010.21710.92130.6506
0.50.38440.32360.22651.15380.8147
0.550.42250.33750.23631.40750.9939
0.60.46240.3520.24641.68251.1881
0.650.50410.36950.25871.97631.3956
0.70.54760.38520.26962.29381.6198
Table 4. Data on the Consumption, Demand, and Average Energy Expenditure on the IFG Campus in 2016.
IFG—CampusContracted Demand
(kW)
Total
Consumption (MWh/year)
Annual Average Energy Expenditure (USD)
1Jataí60221.813,679.49
2Inhumas90195.023,166.88
3Uruaçu180309.248,540.12
4Itumbiara250275.044,127.38
5Anápolis114157.034,383.74
6Formosa75136.09928.66
7Luziânia110166.833,095.54
8Aparecida350369.431,771.71
9Goiás3040.010,664.12
10Águas lindas8062.311,914.39
11Valparaíso3014.115,444.58
TOTAL13691946267,264.84
Table 5. Existing Lighting System.
DescriptionPower (W)QuantitiesDemand (kW)Operation (hours/year)Consumption (kWh/year)
Dichroic lamp501879.35264024,684
Mixed lamp25061.5026403960
Mixed lamp400249.60264025,344
Halogen lamp + electronic ballast122.515819.36264051,097.2
Sodium vapor lamp + electronic ballast27419753.982640142,501.9
Sodium vapor lamp + electronic ballast4328235.42264093,519.4
Compact fluorescent lamp15112316.85264044,470.8
Compact fluorescent lamp45492.2126405821.2
Compact fluorescent lamp90928.28264021,859.2
Tubular fluorescent lamp + electronic ballast17.5163028.53264075,306
Tubular fluorescent lamp + electronic ballast33.514,680491.7826401,298,299.2
Compact fluorescent lamp reflector5410.052640142.6
Mixed lamp reflector2509323.25264061,380
Metallic vapor lamp reflector + electronic ballast4325523.76264062,726.4
Total-18,377723.91-1,911,111.84
Table 6. Equivalence of the Lighting Systems.
Existing Lighting SystemProposed Lighting SystemQuantities
Dichroic lamp 50 WLED dichroic lamp 6 W187
Mixed lamp 250 WLED high bay lamp 80 W6
Mixed lamp 400 WLED high bay lamp 150 W24
Halogen lamp 110 WLED halogen lamp 40 W158
Sodium vapor lamp 250 WLED street light 120 W197
Sodium vapor lamp 400 WLED street light 210 W82
Compact fluorescent lamp 15 WLED bulb lamp 8 W1123
Compact fluorescent lamp 45 WLED bulb lamp 16 W49
Compact fluorescent lamp 90 WLED bulb lamp 30 W92
Tubular fluorescent lamp 16 WLED tubular lamp 10 W1630
Tubular fluorescent lamp 32 WLED tubular lamp 20 W14,680
Compact fluorescent lamp reflector 54 WLED reflector 30 W1
Mixed lamp reflector 250 WLED reflector 100 W93
Metallic vapor lamp reflector 400 WLED reflector 200 W55
TotalTotal18,377
Table 7. Economic Feasibility Analysis of the Lighting System.
System E S (MWh/year) R D P
(kW)
C E D ( USD / kW ) C E E ( USD / MWh ) C A T ( USD ) B A T ( USD ) RCB
Lighting867.94309.6379.1452.4734,895.0370,044.650.50
Table 8. PV Module Specifications.
DescriptionType
ManufacturerGCL SOLAR
TechnologyPolycrystalline
Maximum power325 Wp
Area1.94 m2
Efficiency16.70%
Table 9. Number of PV Modules, Installed Power, and Estimated Electricity Generation for Each Campus.
IFG—CampusArea (m2)Number of
FV Modules
Installed
Power
(kWp)
Estimated Electricity Generation (MWh/year)
1Jataí505827790161.33
2Inhumas191027790156.24
3Uruaçu189427790160.83
4Itumbiara4152554180307.64
5Anápolis4855308100188.88
6Formosa499823175133.84
7Luziânia5740338110199.27
8Goiás6755923051.00
9Águas Lindas600024680143.3
10Aparecida4420338110156.24
11Valparaíso20971384578.33
TOTAL47,879307610001736.9
Table 10. Economic Feasibility Analysis of the PV Generation Systems.
System E S (MWh/year) R D P
(kW)
C E D (USD/kW) C E E (USD/MWh) C A T
(USD)
B A T
(USD)
RCB
Photovoltaic1736.90--75.75101,288.97131,564.260.77
Table 11. Global Economic Analysis of the Project.
System E S (MWh/year) R D P   ( kW ) B A T ( USD ) C A T ( USD ) RCB
Lighting867.94309.6334,895.0370,044.650.50
Photovoltaic 1736.900.00101,288.97131,564.260.77
Total2604.84309.63136,184.00201,608.910.68
Global RCB0.68
Table 12. Summary of the Key Project Information.
LightingPhotovoltaic Generation
Quantity of Equipment18,377Quantity of Equipment3076
Energy Saving (MWh/year)867.94Energy Saving (MWh/year)1736.90
Demand Reduction at the Point (kW)309.63Demand Reduction at the Point (kW)0
Total Investment (USD)425,252.34Total Investment (USD)923,516.15
Investment in Equipment (USD)196,867.51Investment Equipment (USD)761,293.94
Own Labor—Concessionary (USD)5545.86Own Labor—Concessionary (USD)21,446.06
Third-party labor (USD)165,564.65Third-party labor (USD)250,698.68
Transportation—Concessionary (USD)310.17Transportation—Concessionary (USD)1199.43
Elaboration of the Project (diagnosis) (USD)10,955.45Elaboration of the Project (diagnosis) (USD)42,365.13
Marketing—Estate Agent (USD)755.55Marketing—Estate Agent (USD)2921.73
Training (USD)755.51Training (USD)2921.59
Discard (USD)5581.34Discard (USD)-
M&V (USD)22,935.21M&V (USD)15,058.47
C E E (USD/MWh)52.47 C E E (USD/MWh)75.75
C E D (USD/MWh)79.14 C E D (USD/MWh)-
RCB0.50RCB0.77
Publisher’s Note: MDPI stays neutral with regard to jurisdictional claims in published maps and institutional affiliations.

