
Feasibility of Solar Grid-Based Industrial Virtual Power Plant for Optimal Energy Scheduling: A Case of Indian Power Sector

 ,
,  ,
,  , and
, and
Abstract
:1. Introduction
1.1. VPP Concept
1.2. Literature Review
1.3. Literature Gap and Research Contributions
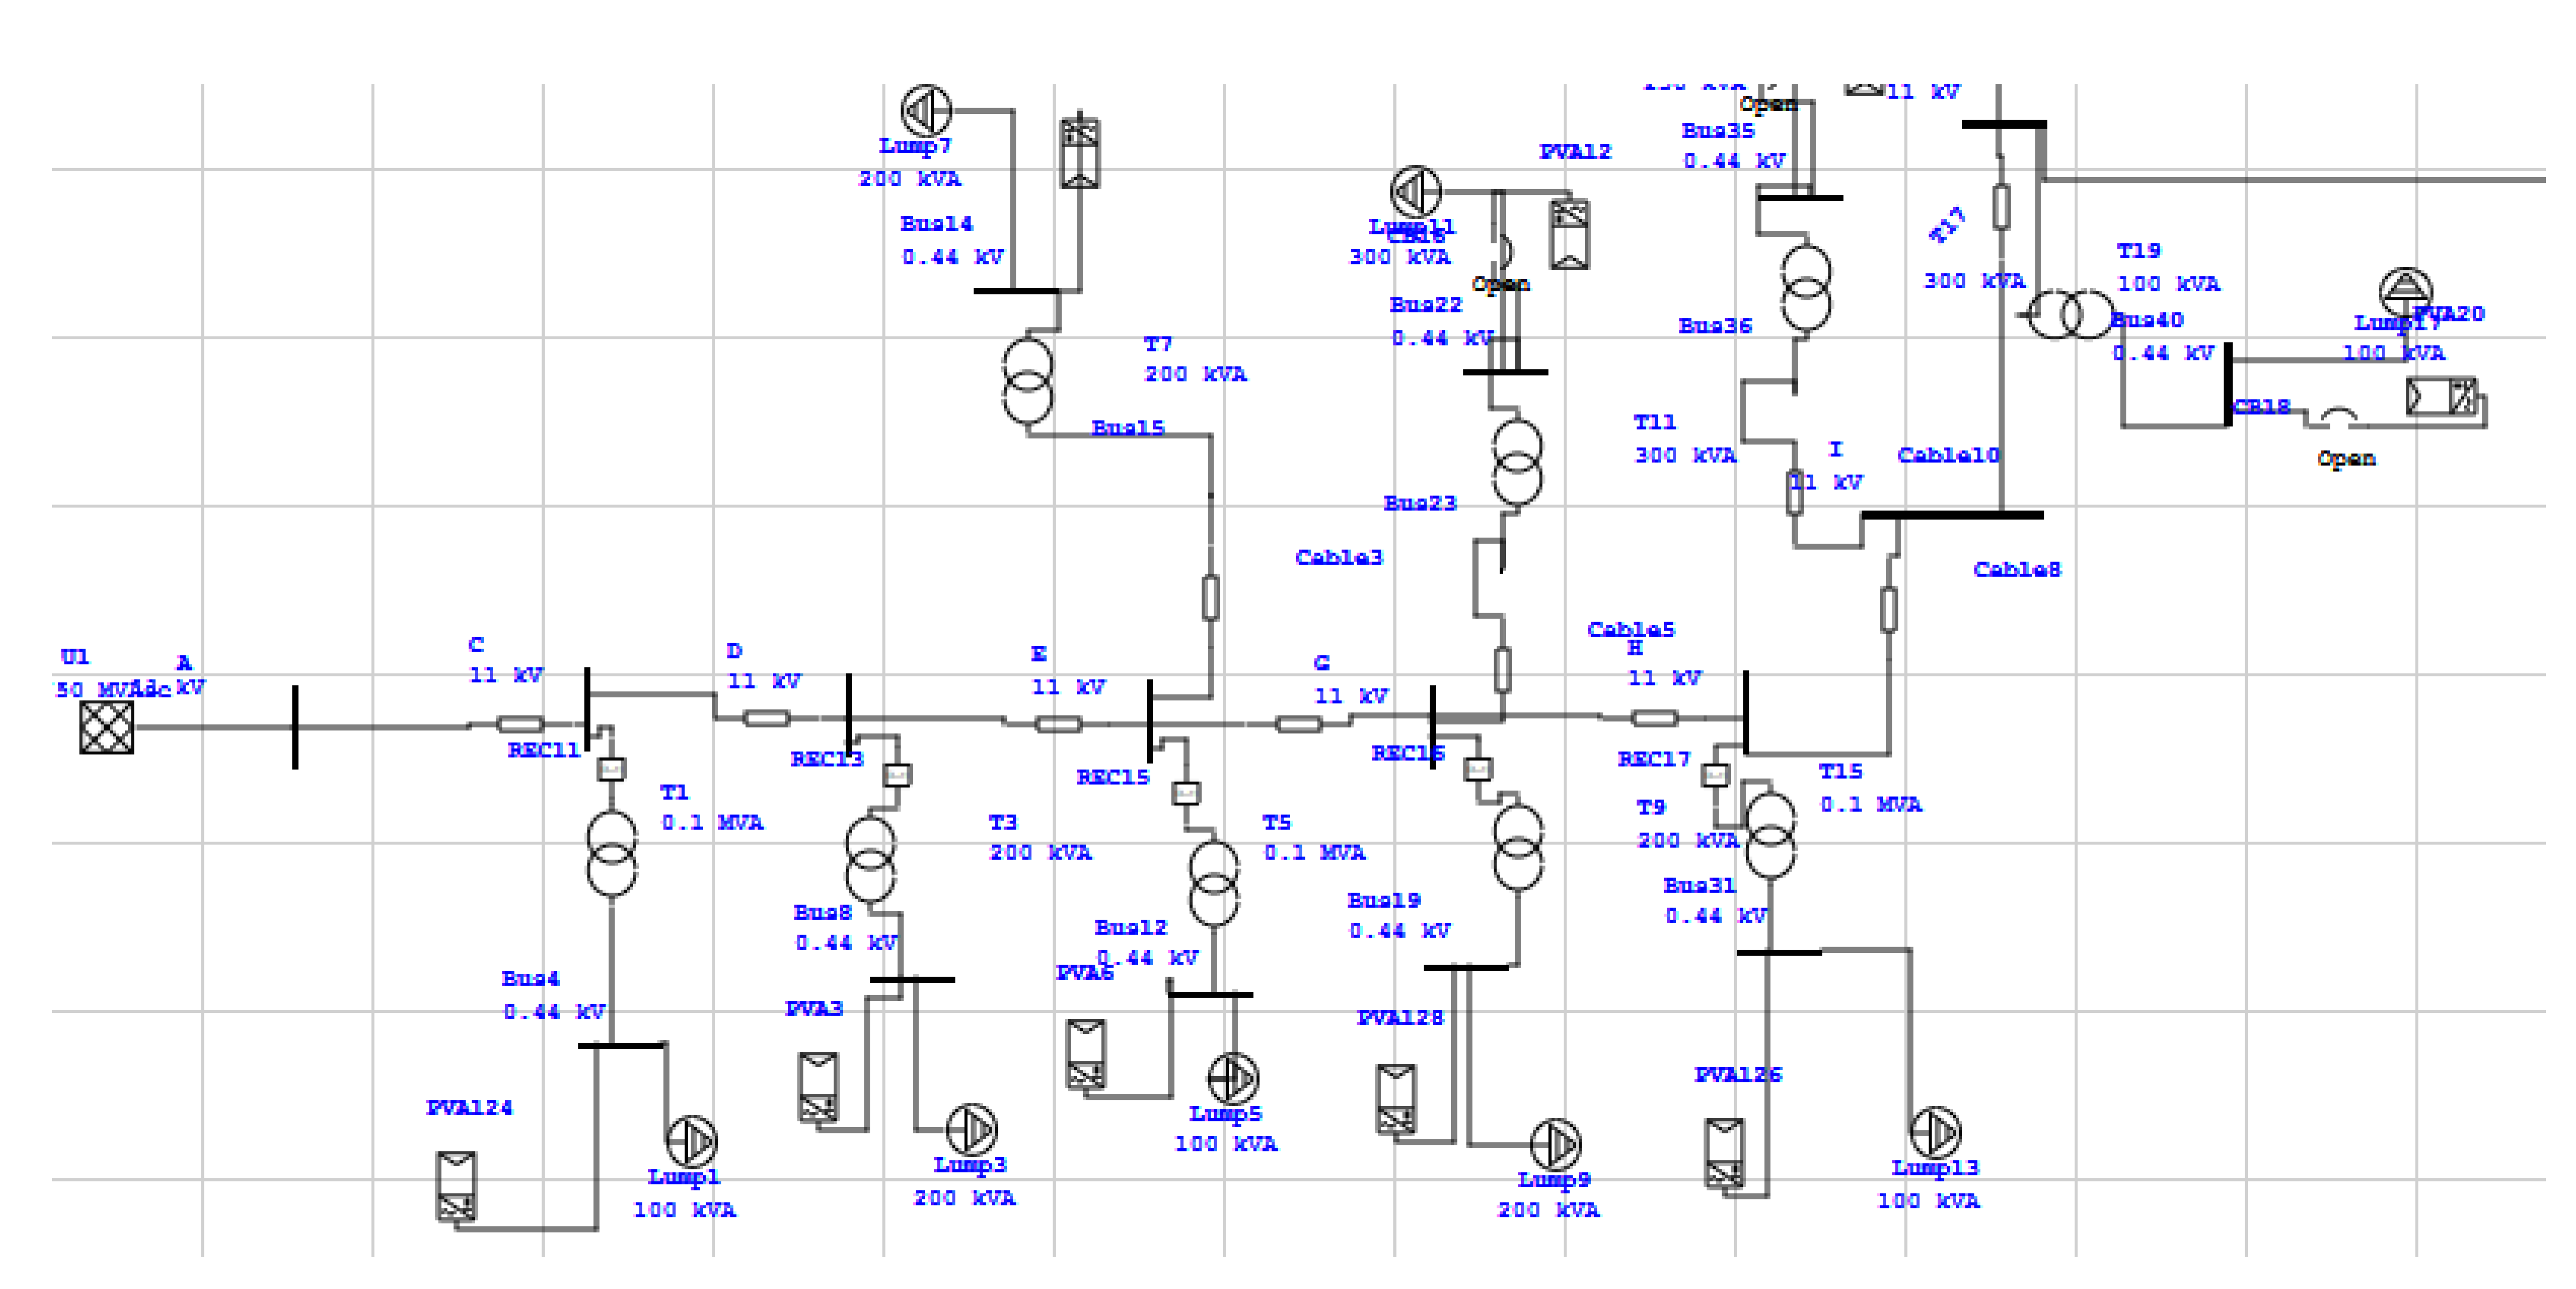
2. Case Study
- Base case with DER.
- Base case with DER and DR.
- Base case with DER, DR, and Storage.
3. VPP Modelling
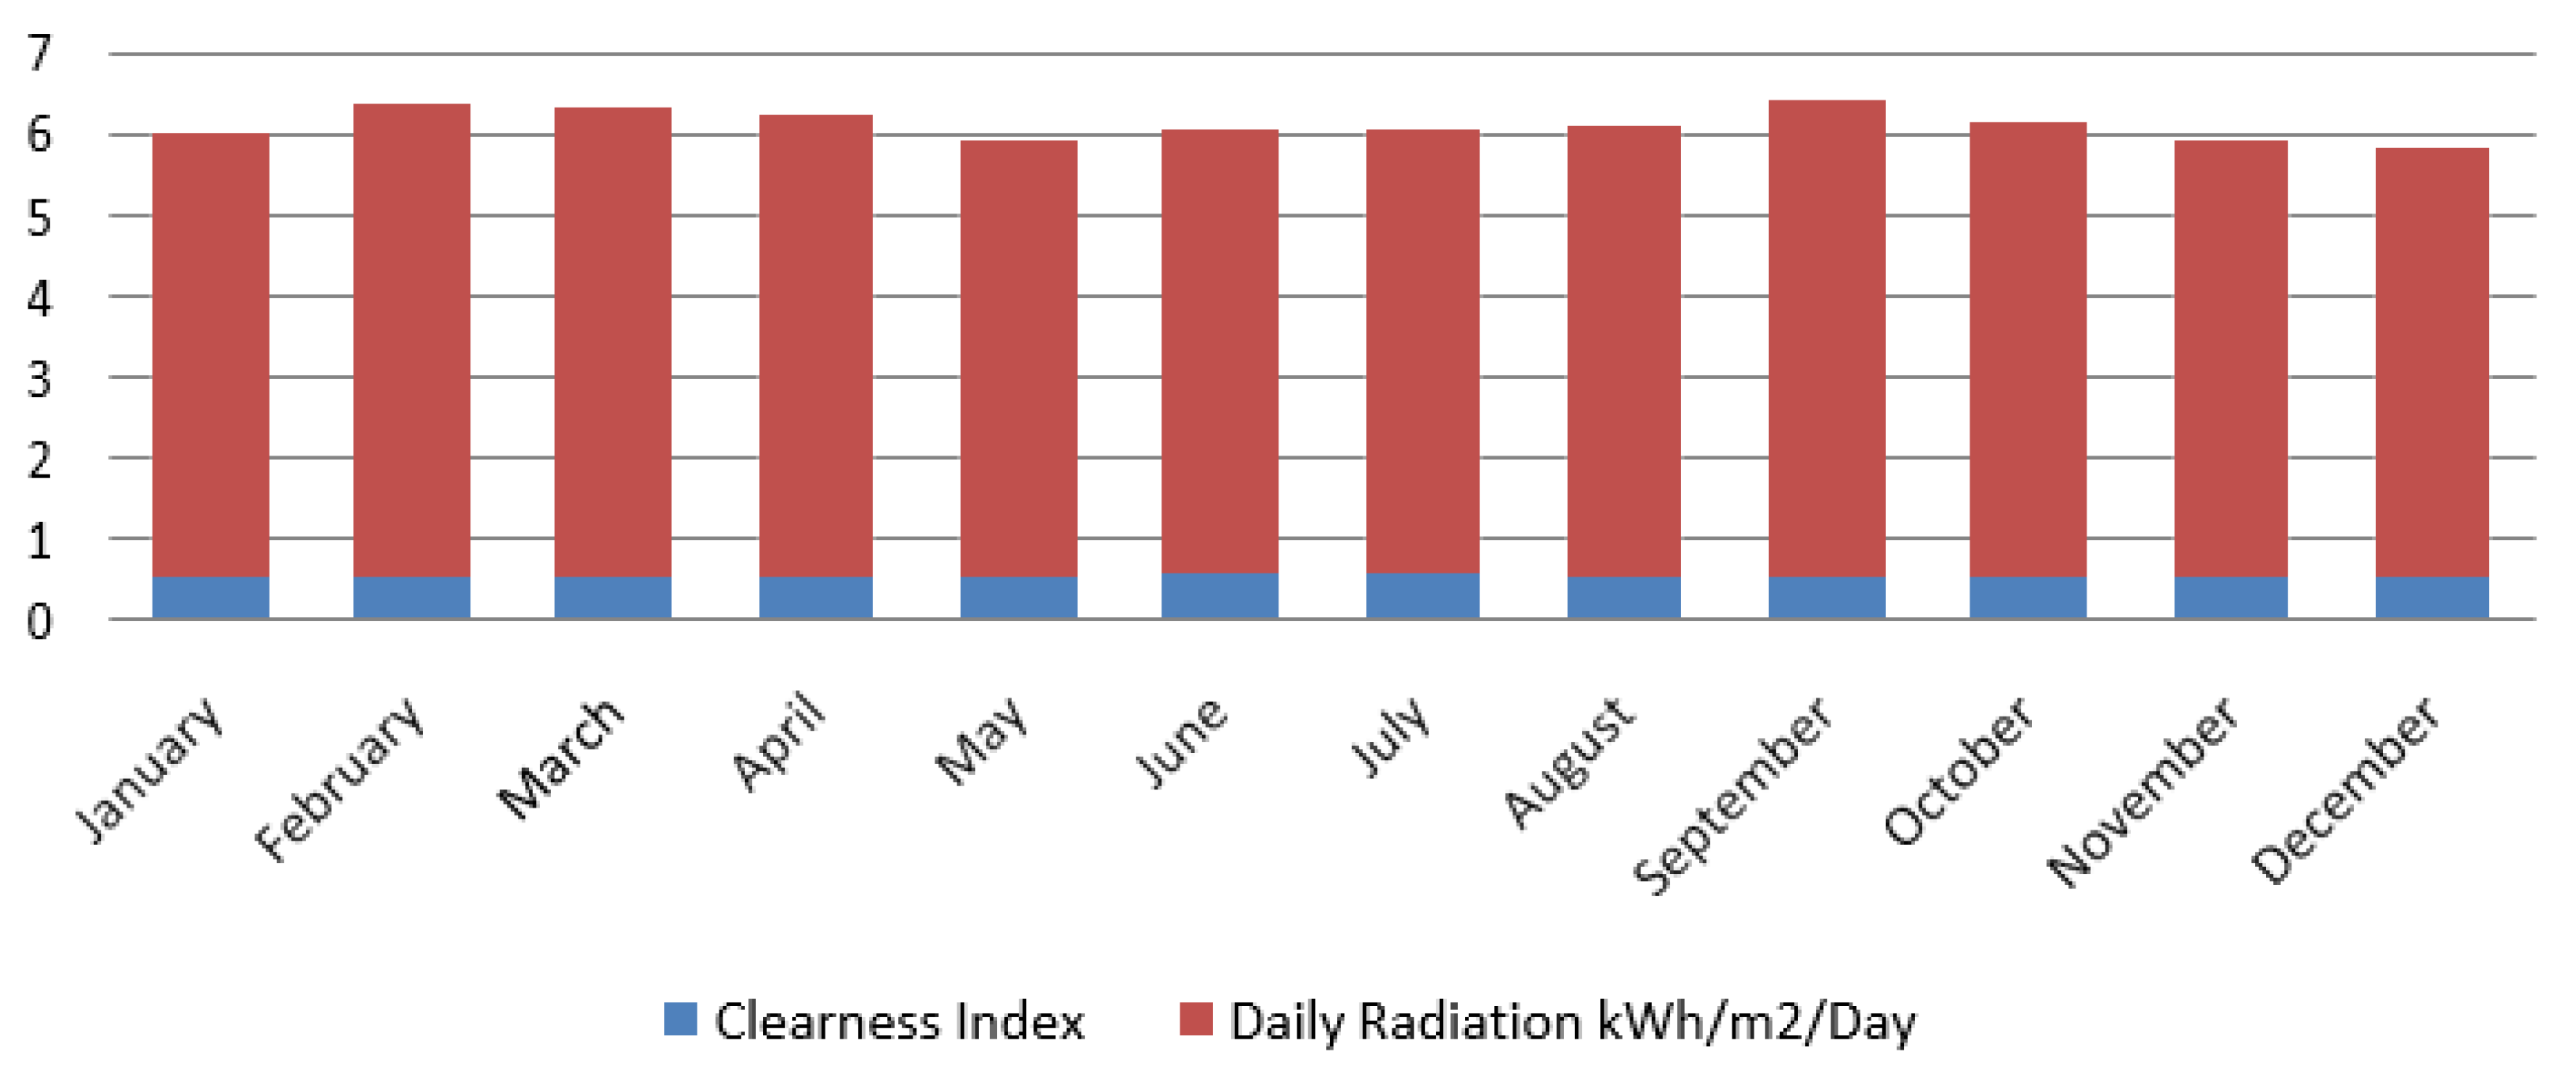
3.1. Solar PV
- η = Efficiency of a solar panel (14.9%)
- St = Solar irradiation (W/m2)
- t = Time step (h)
- N = Number of solar panels connected (no)
- A = Area occupied by solar panels (m2)
- T = Total time period (h)
- PVeo = Estimated output of solar PV, PVso = Scheduled output of solar PV, Lifetime of PV = 25 years
- PV Inverter size = 1.05*solar capacity
3.2. Battery
- = Operational price of battery in dispatch ($)
- = maintenance coefficient of battery
- = Discharging or recharging of the battery (AH)
- = Depreciation coefficient of the battery
- = Pollution coefficient of the treatment cost
- t = Timestep (h)
- T = Total time period (h)
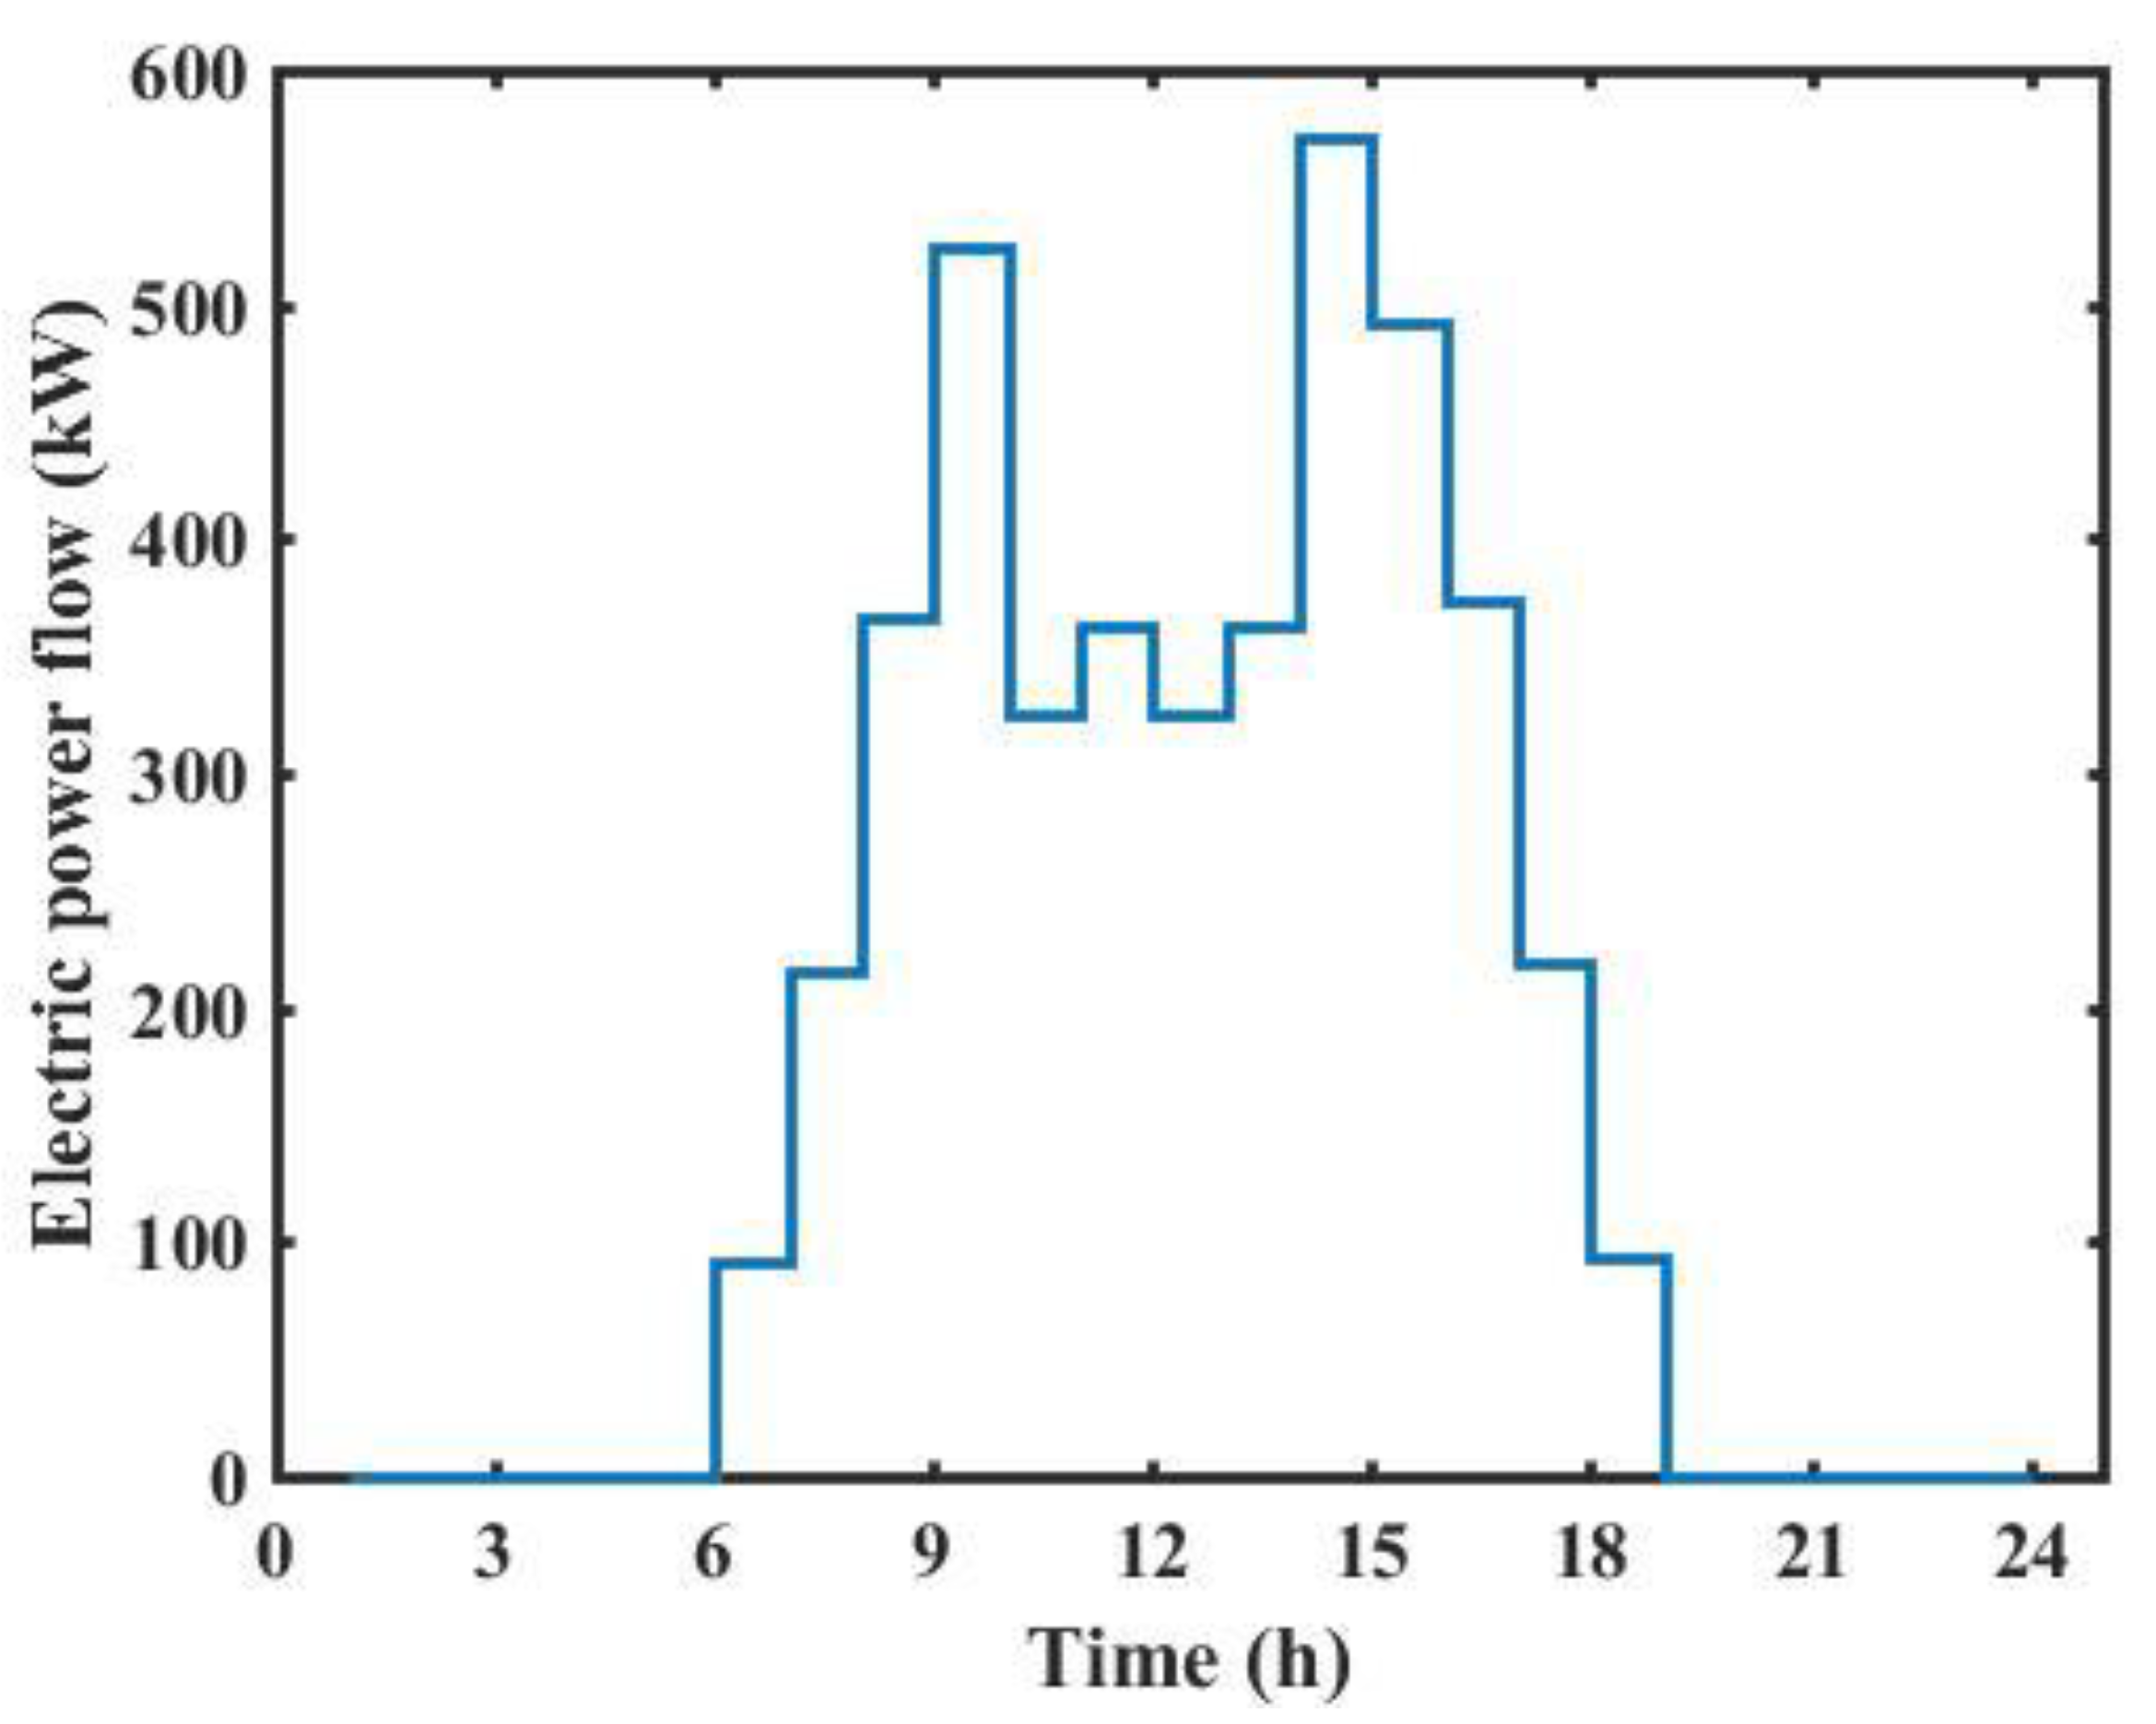
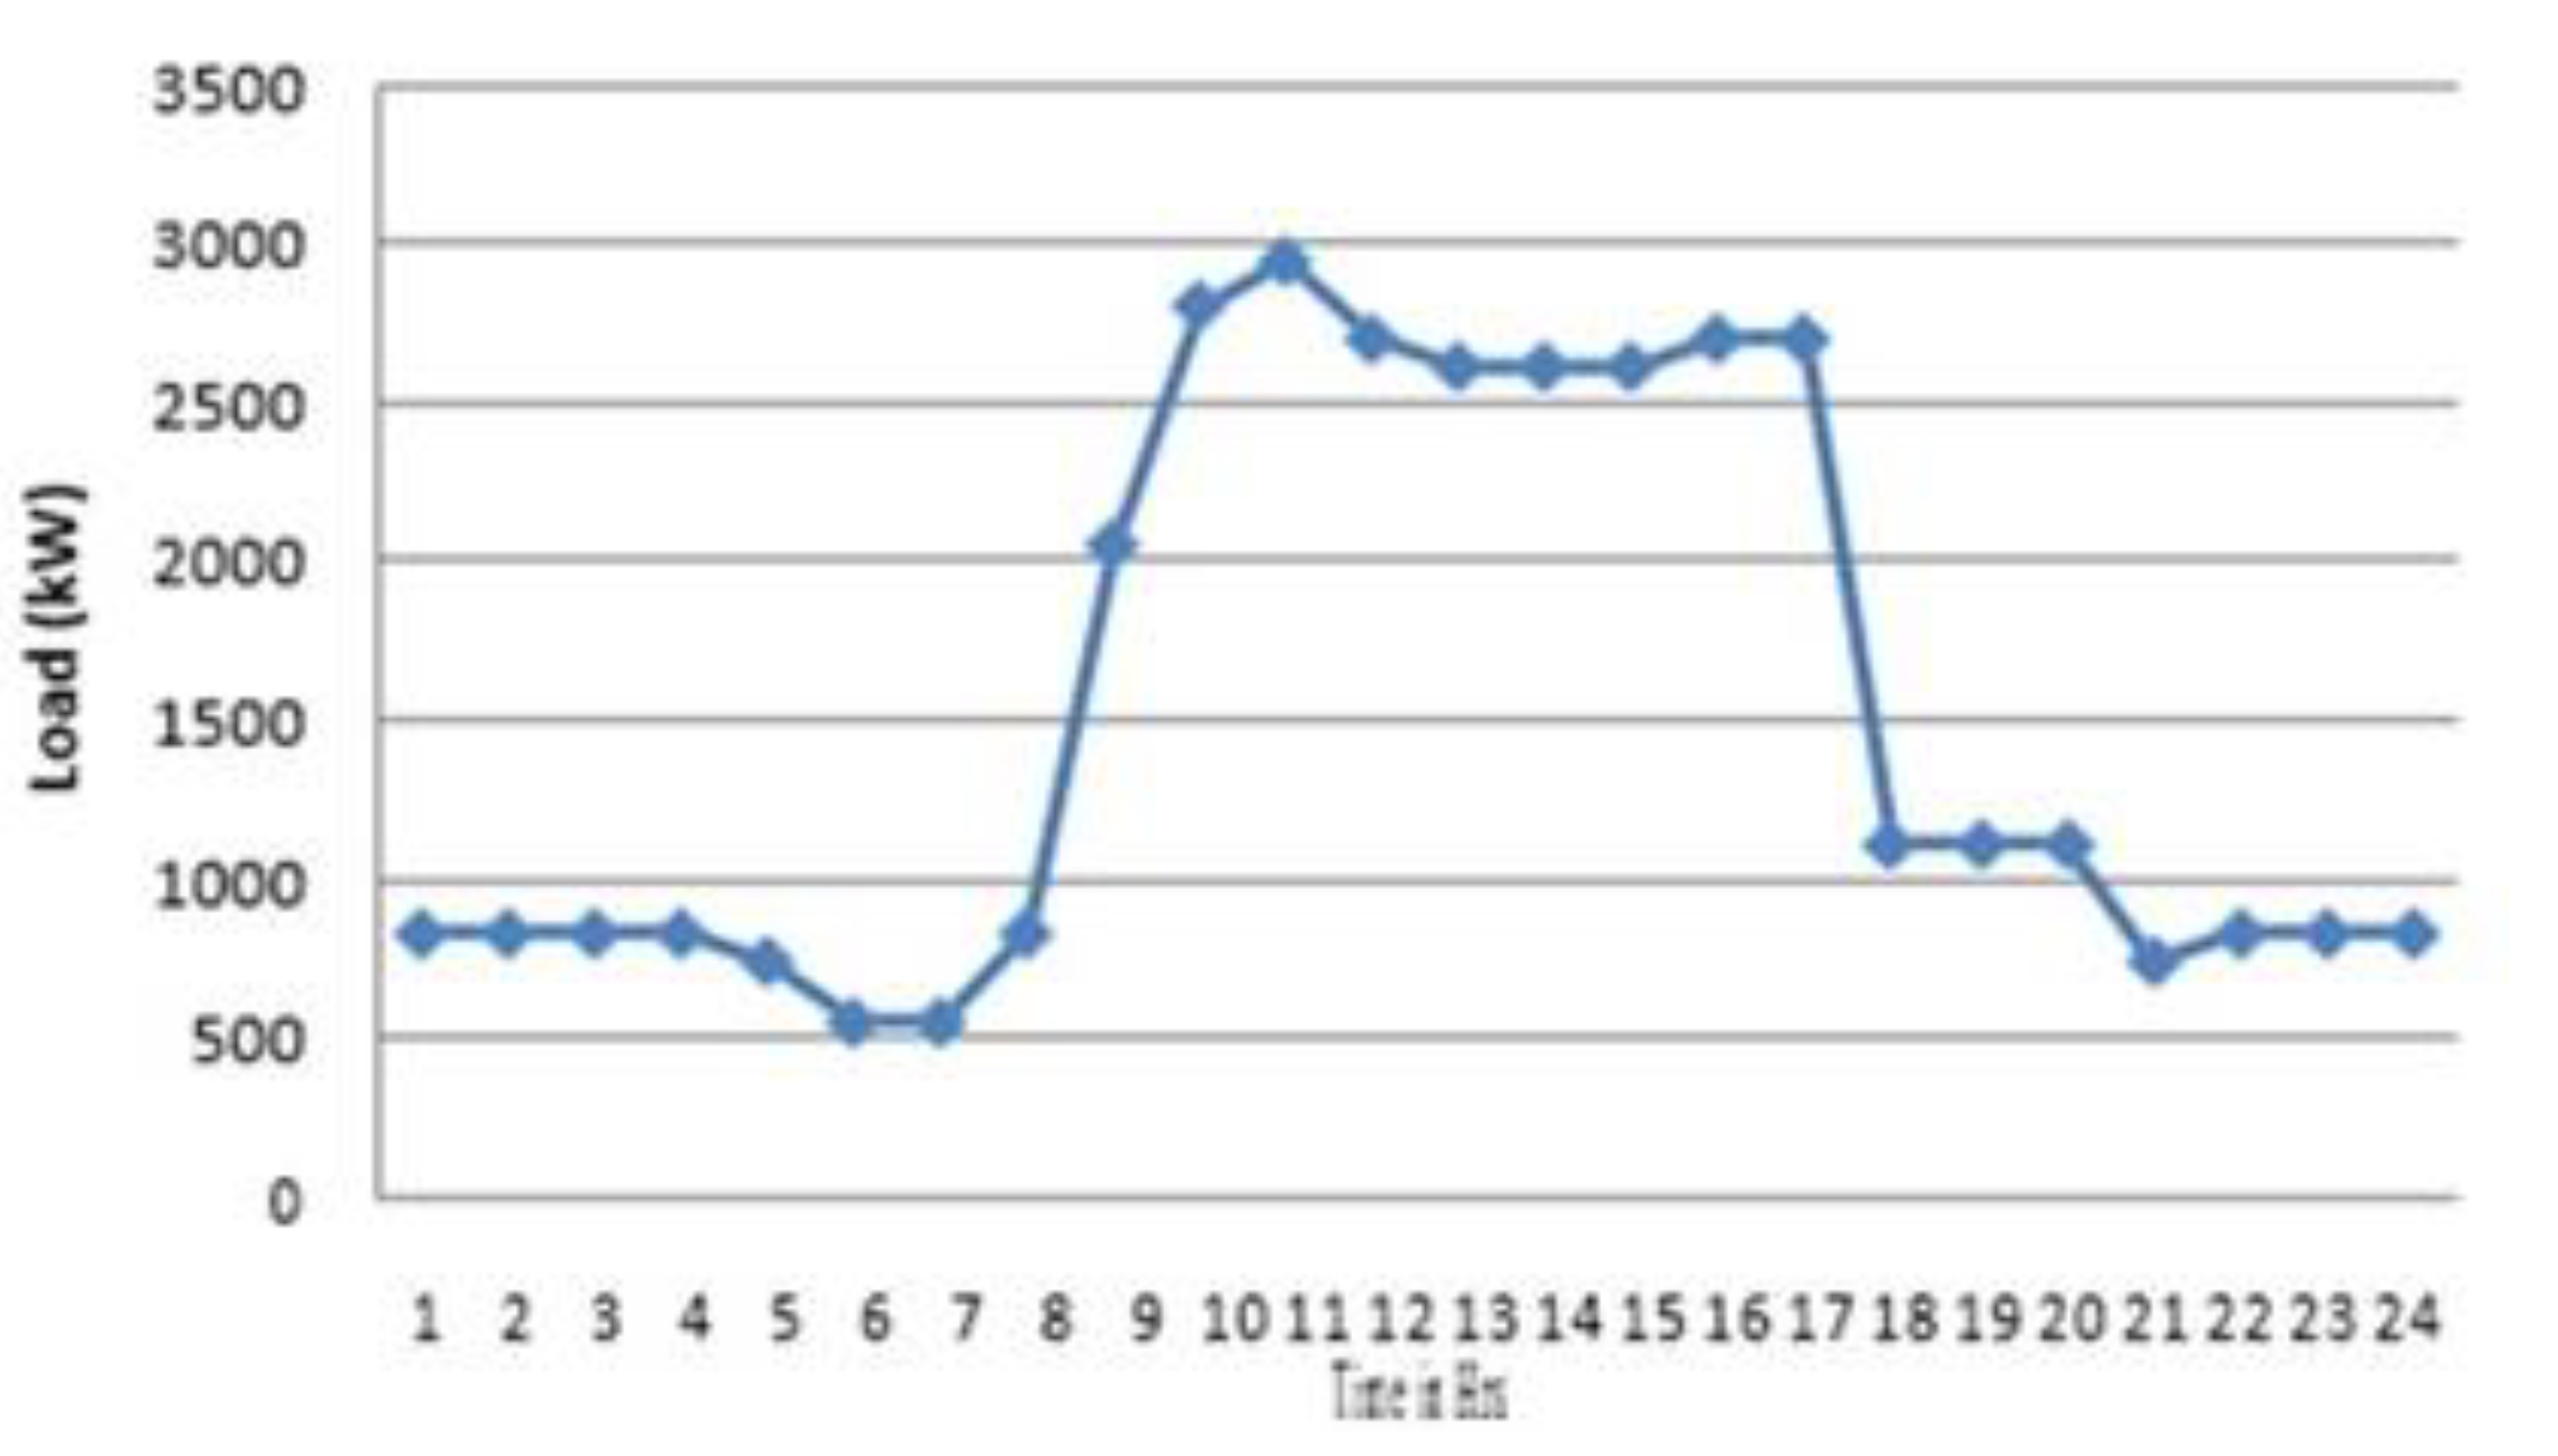
3.3. Loads
- = Total demand on the feeder
- = Schedulable demand
- = Non-Schedulable demand
- = Emergency demand t = Timestep
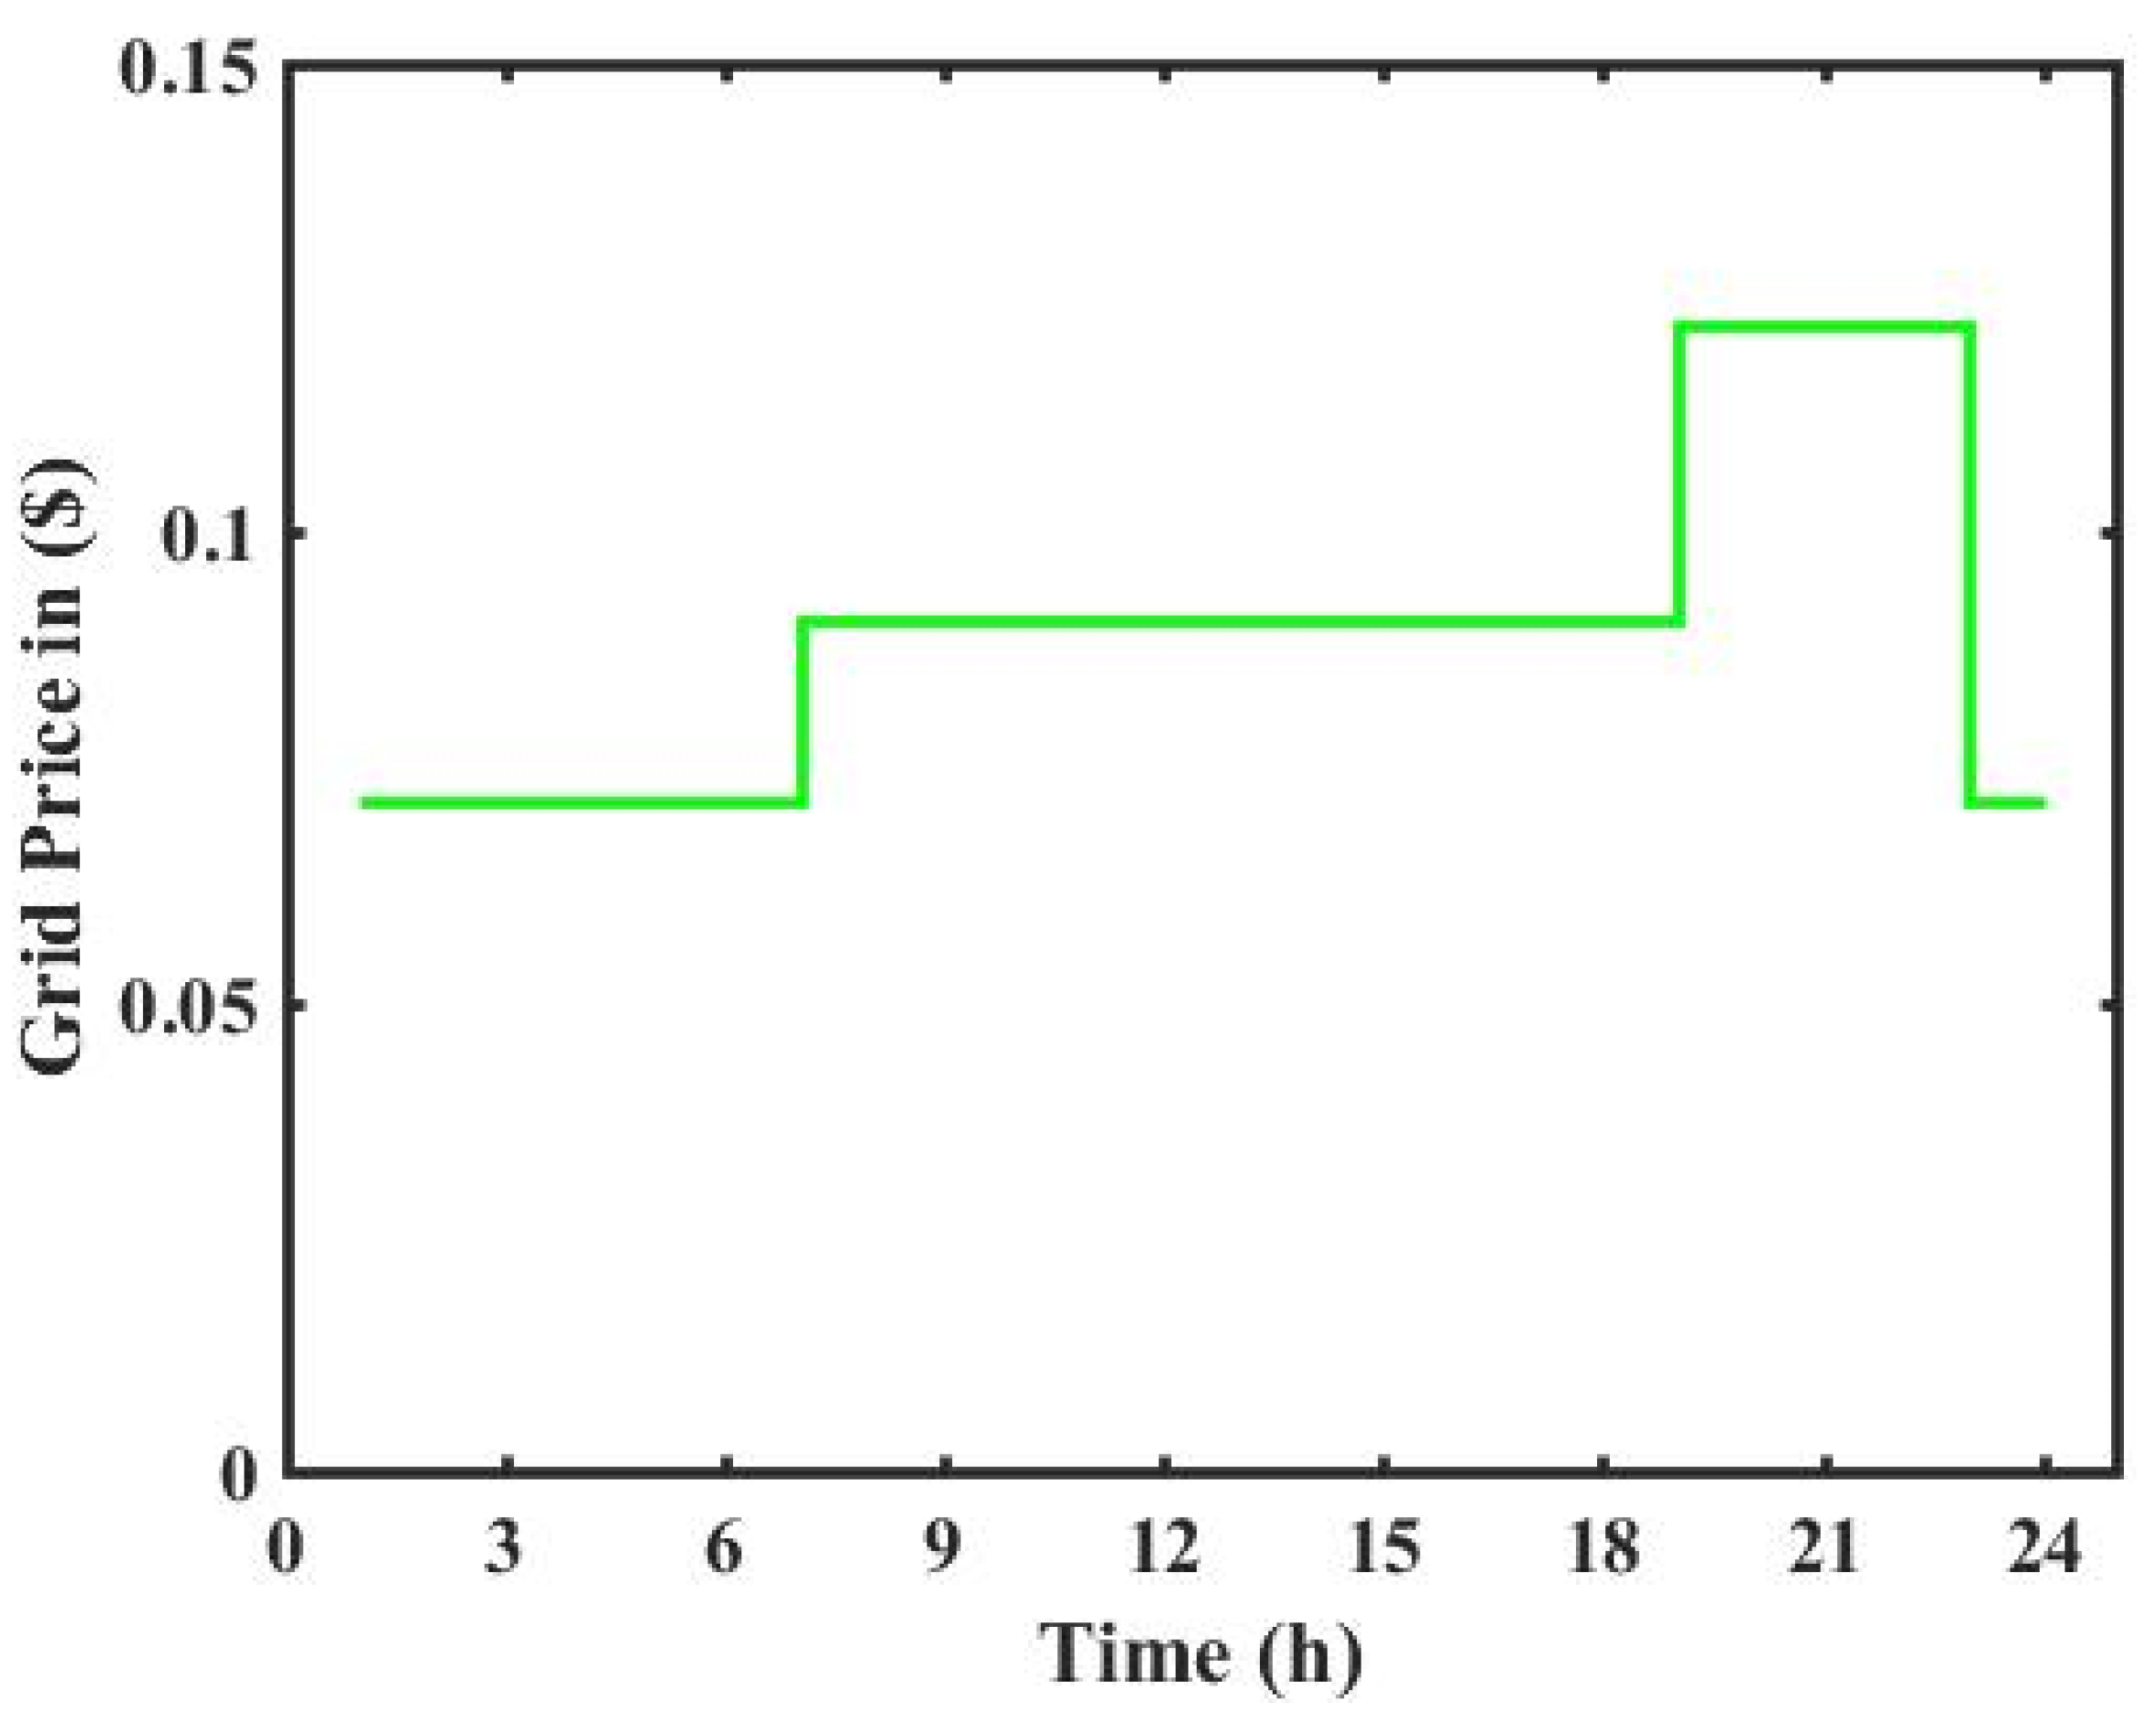
3.4. Main Grid
4. Objective Function and Constraints
- = Discharging rate of the battery
- = Charging rate of the battery
- = Total capacity of the battery
- = Initial capacity of the battery
- = Maximum rating of solar PV
- NS = Number of units of solar PV installed
- = Maximum annual operation hours for PV technology
- PV Capacity ≤ 20% of Transformer Capacity (to prevent reverse power flow during low demand)
- PV Capacity ≤ 80% of Connected Load
- Battery Maximum Discharge Capacity ≤ 20% of total storage capacity (to prevent reduction of battery life)
- The initial capacity of the battery = 500 kWh.
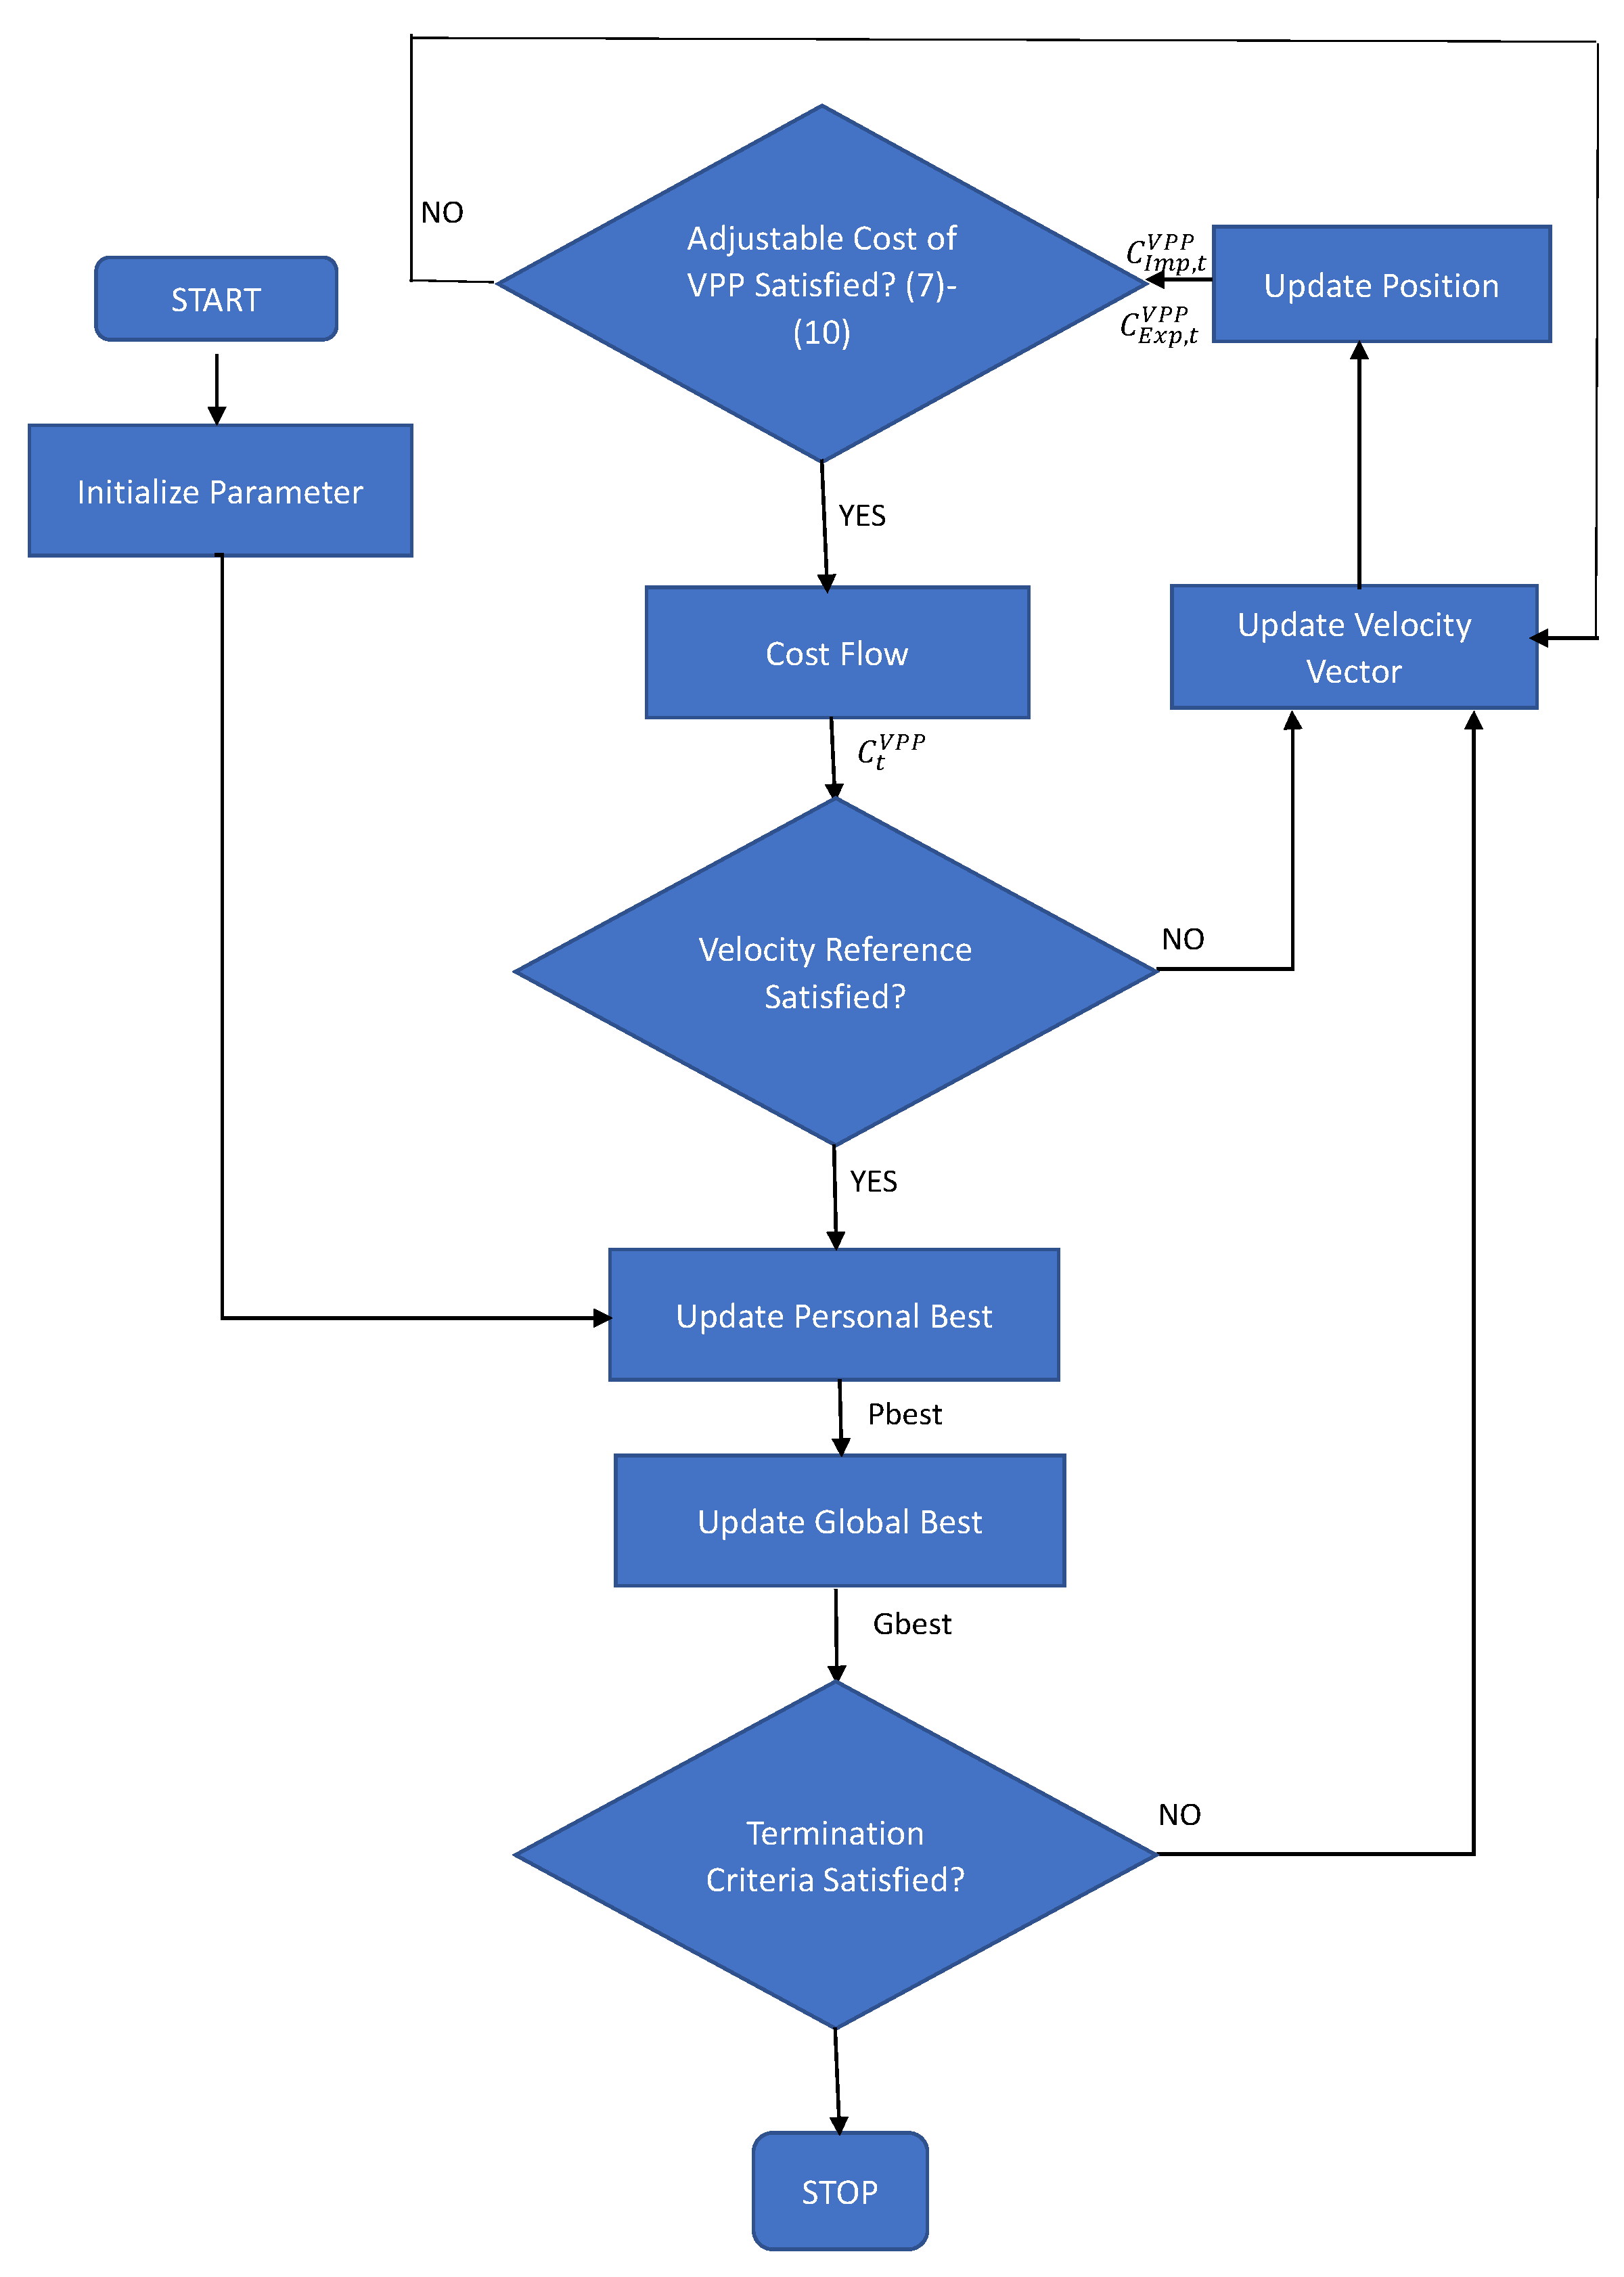
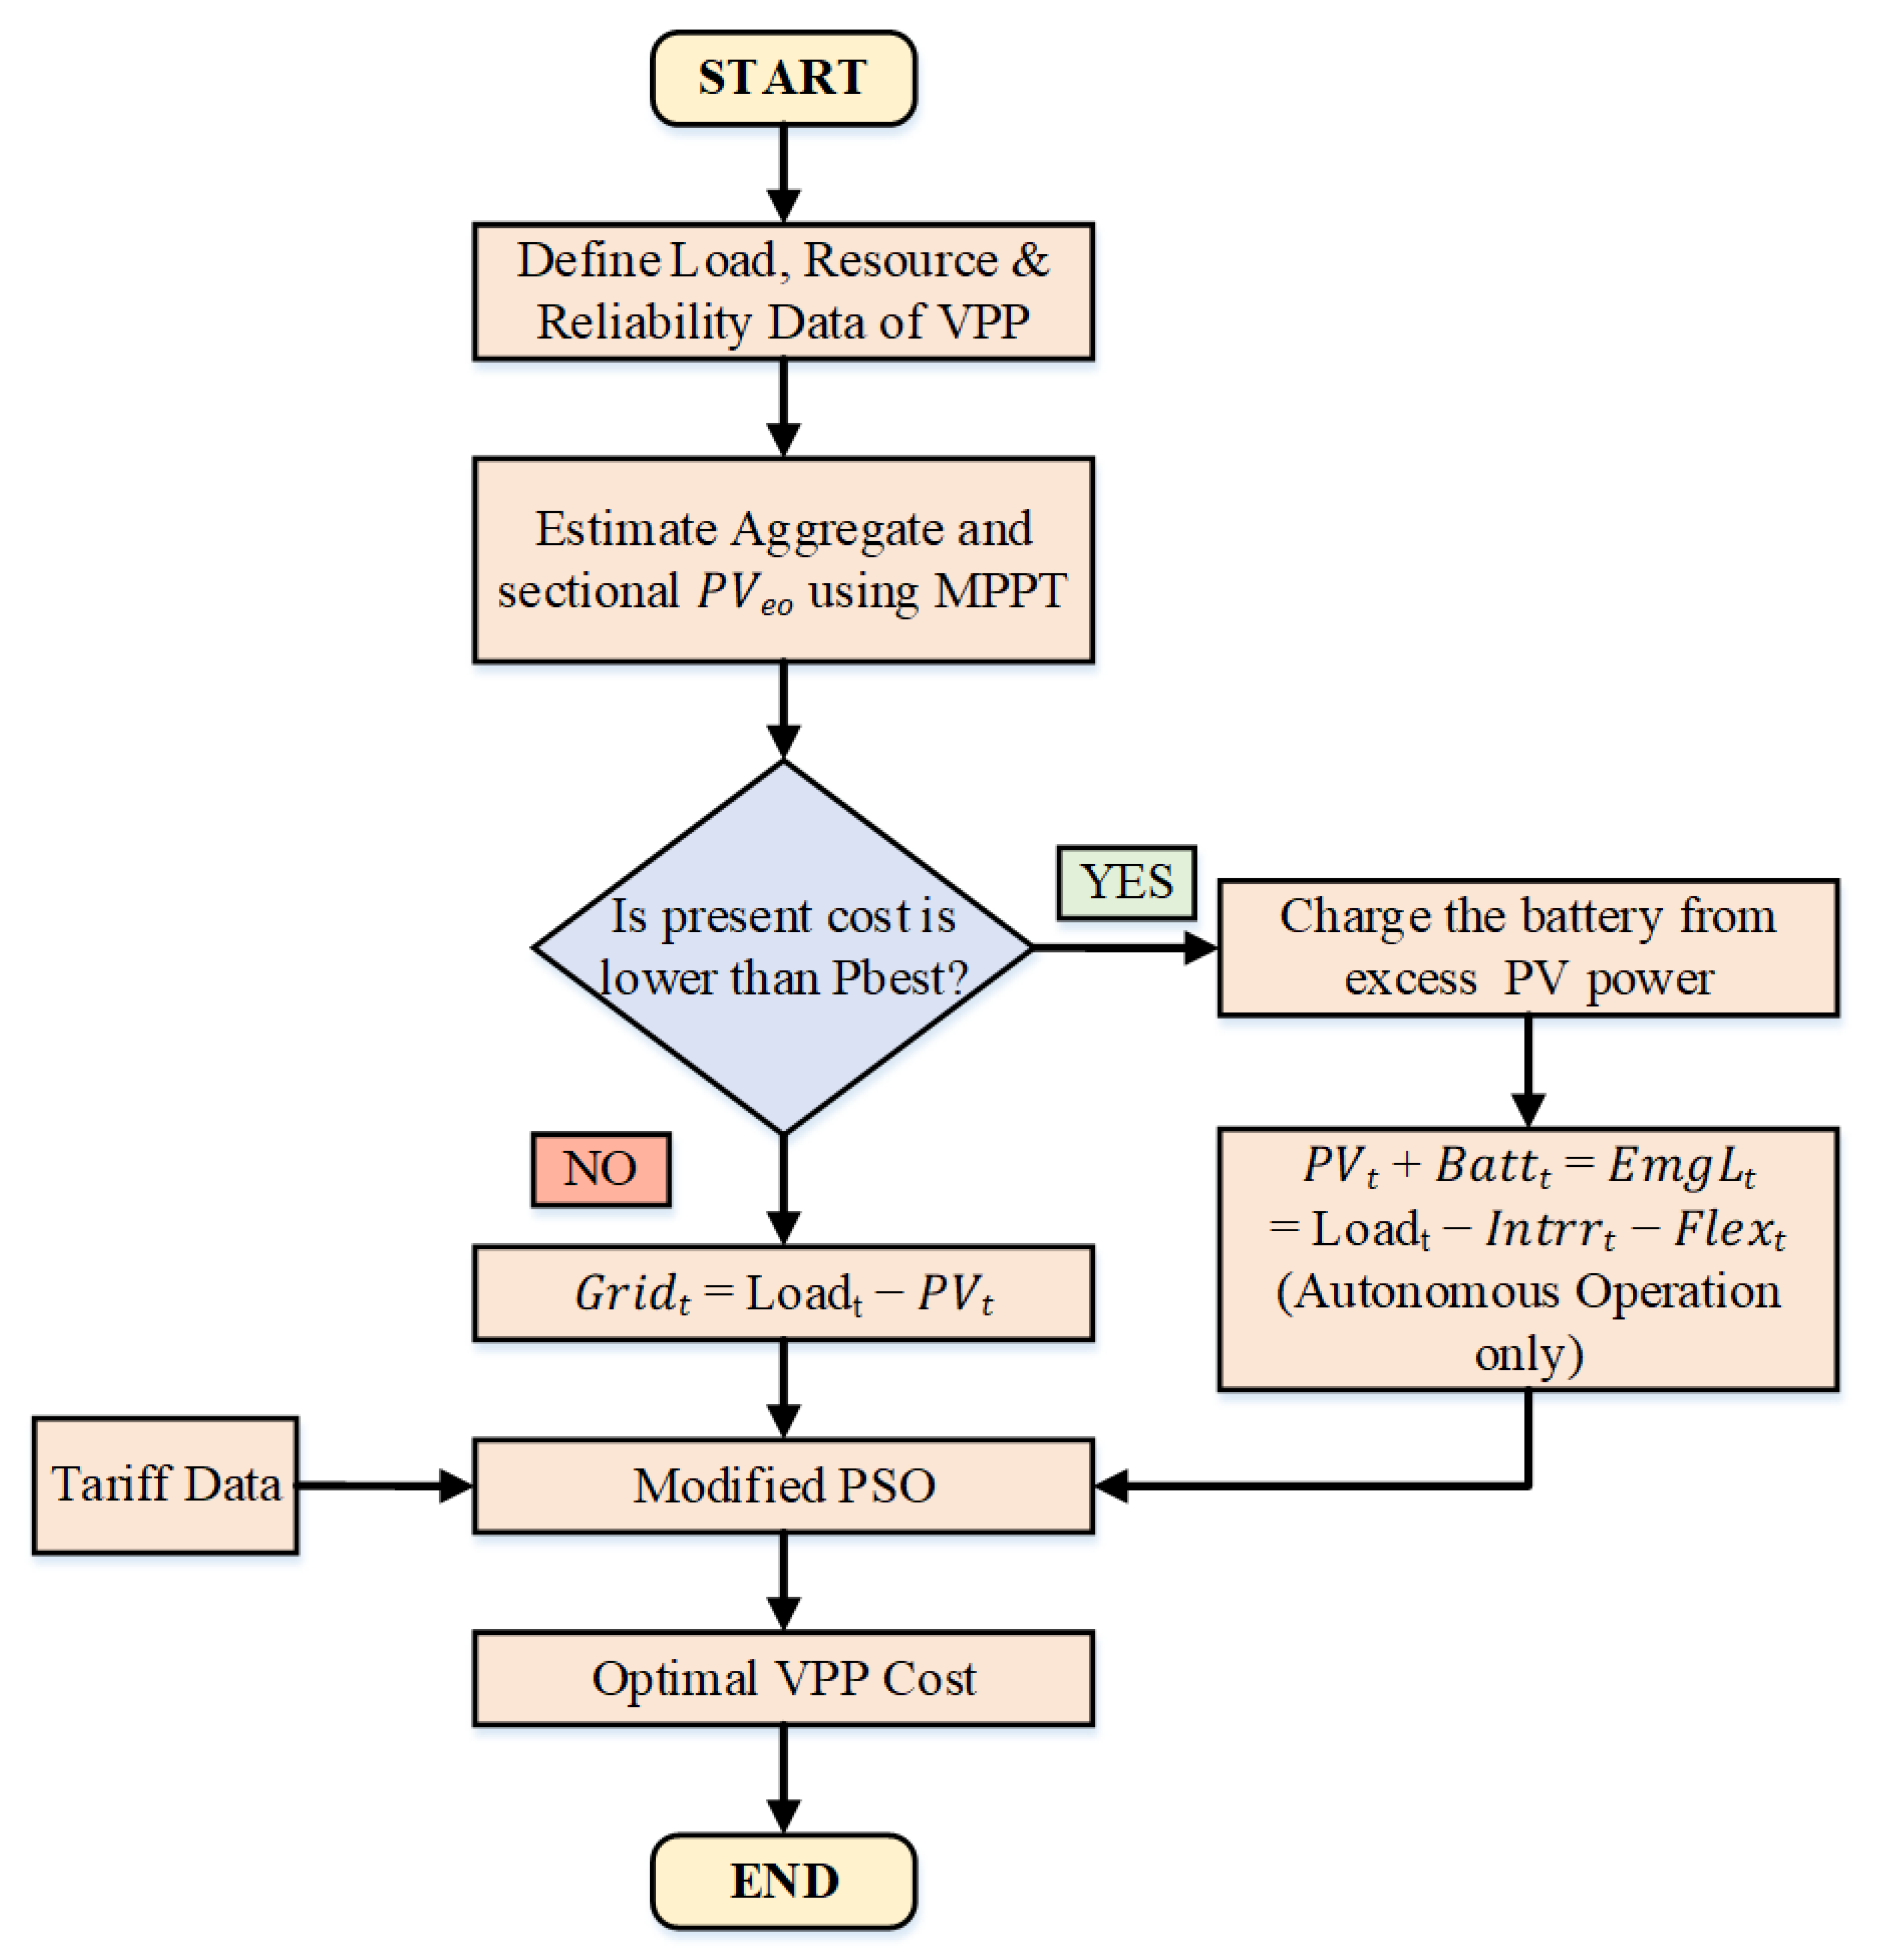
PSO and Dispatch Strategy
- (1)
- Gbest (global best solution of each particle)
- (2)
- Target objective
- (3)
- Stopping criteria
- (1)
- Pbest (particle valid solution)
- (2)
- Particle velocity
- (3)
- Particle best known local solution
5. Results and Discussions
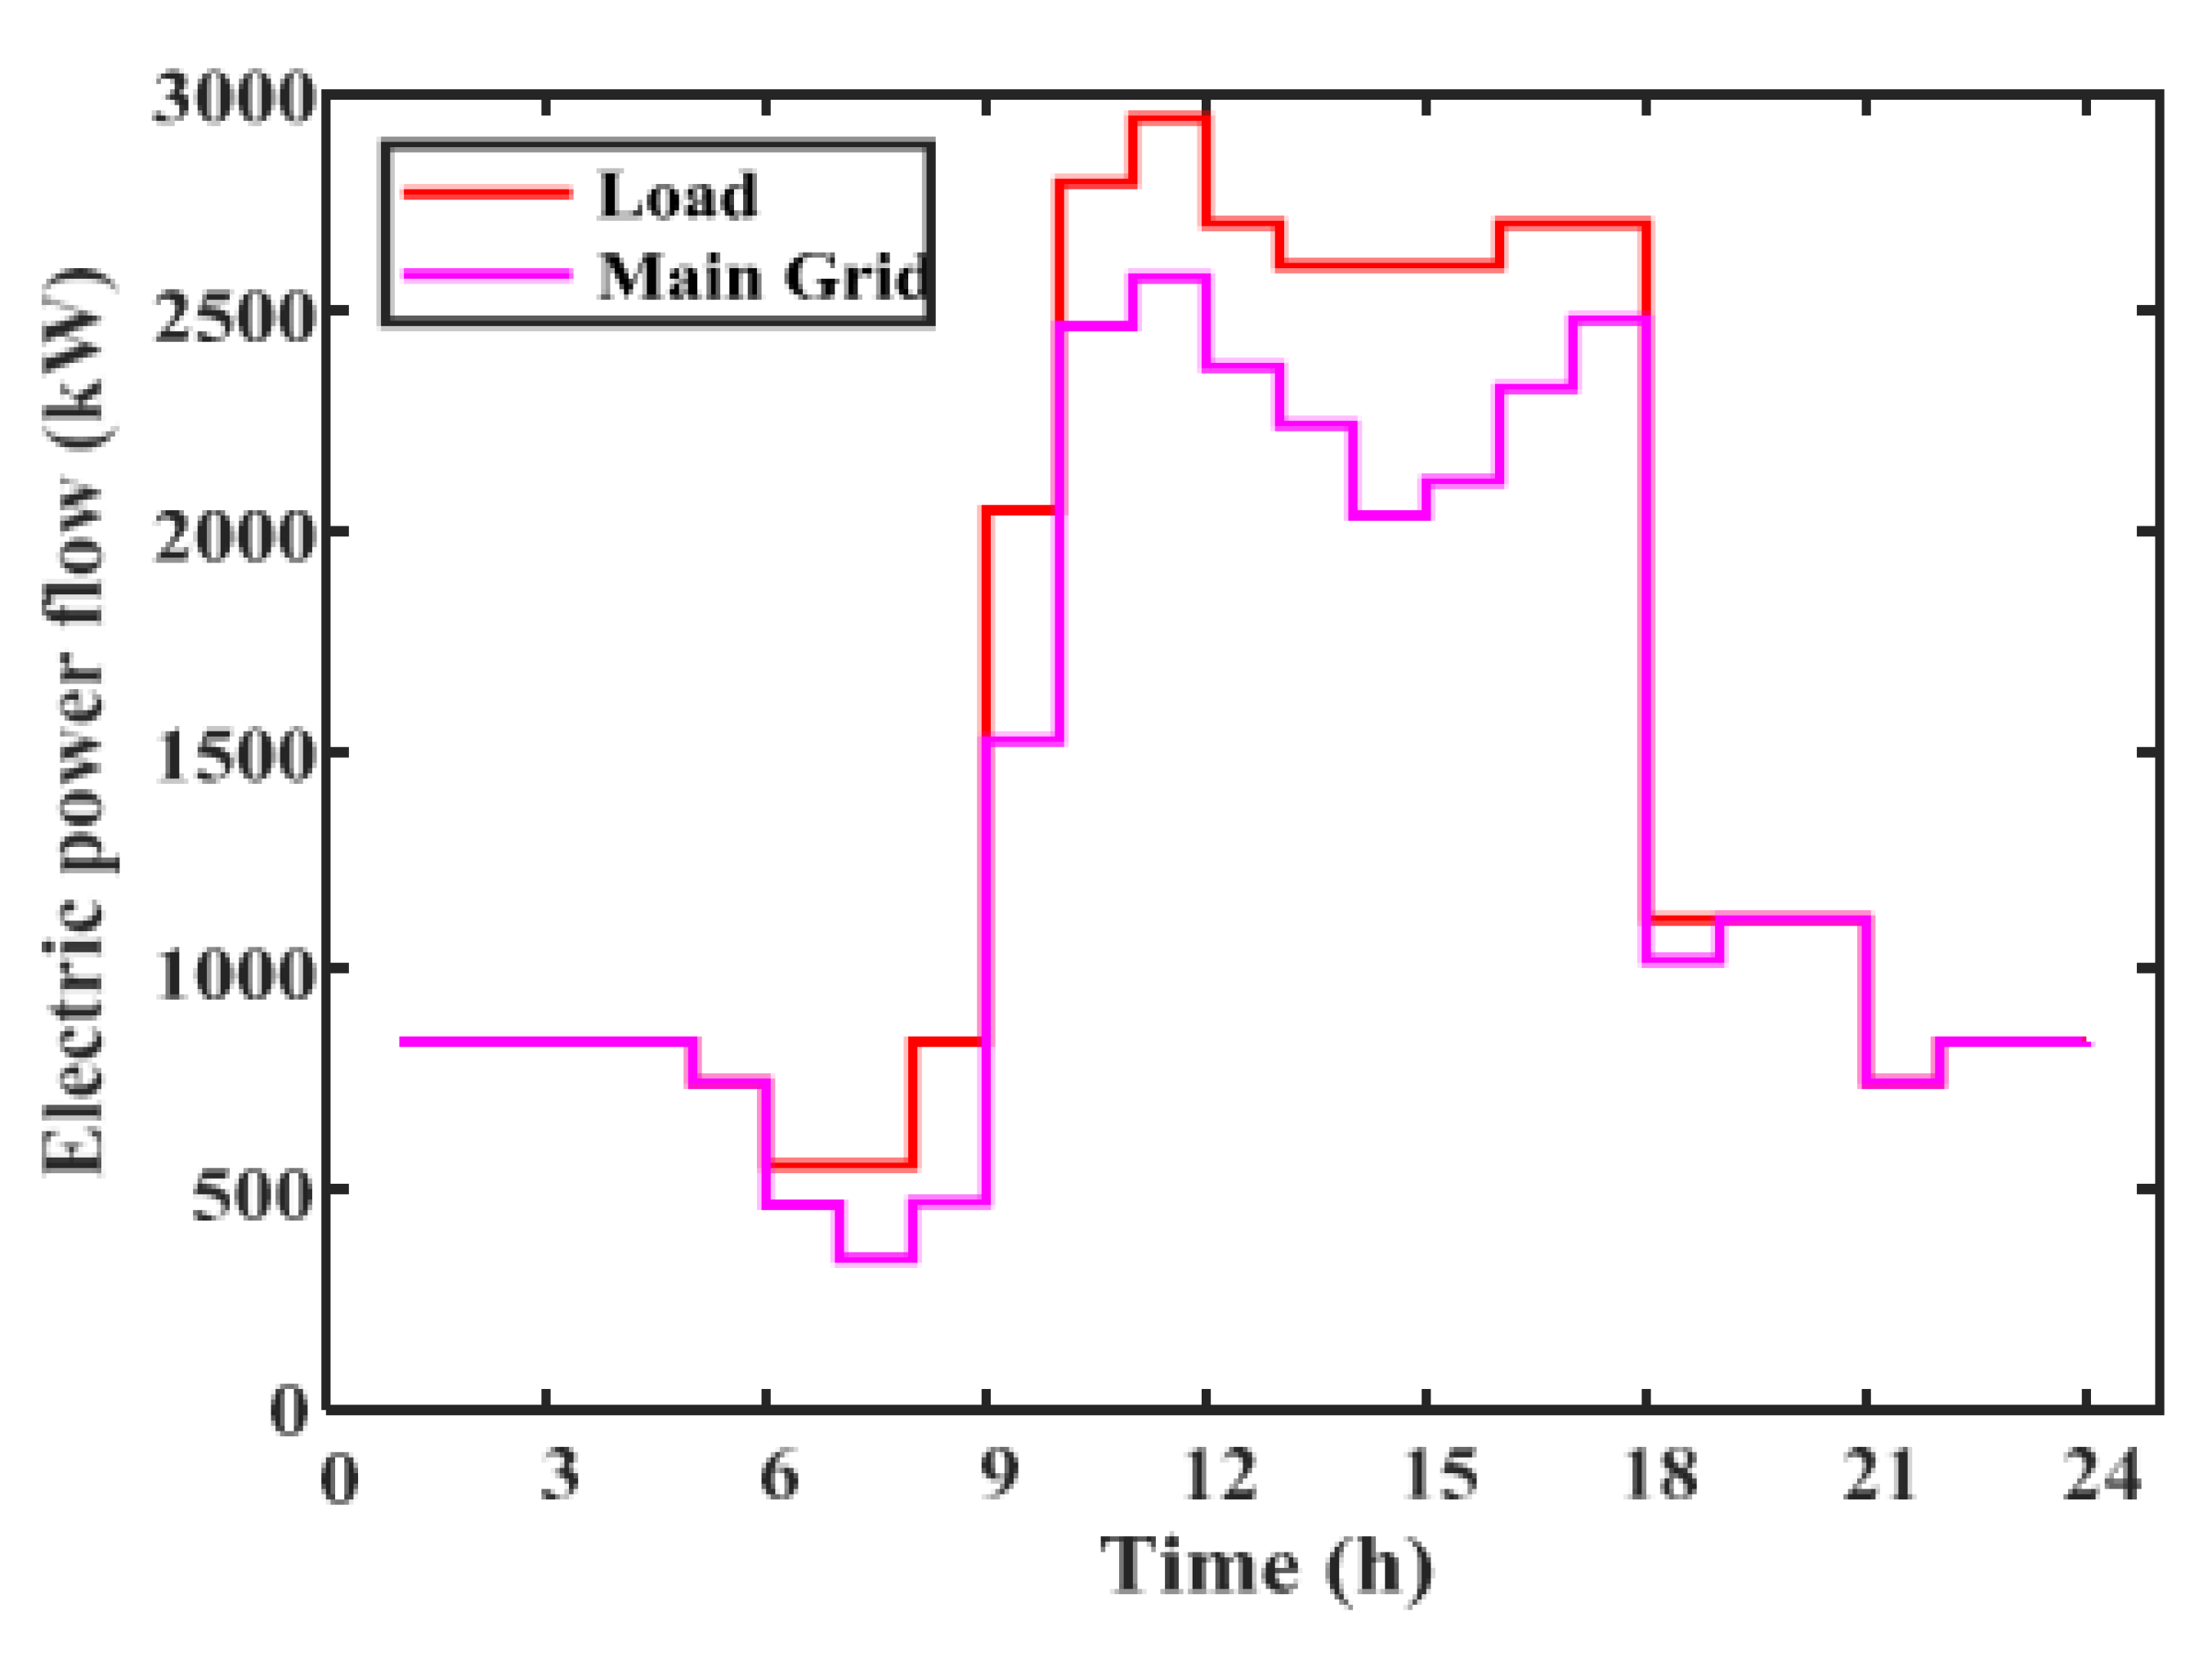
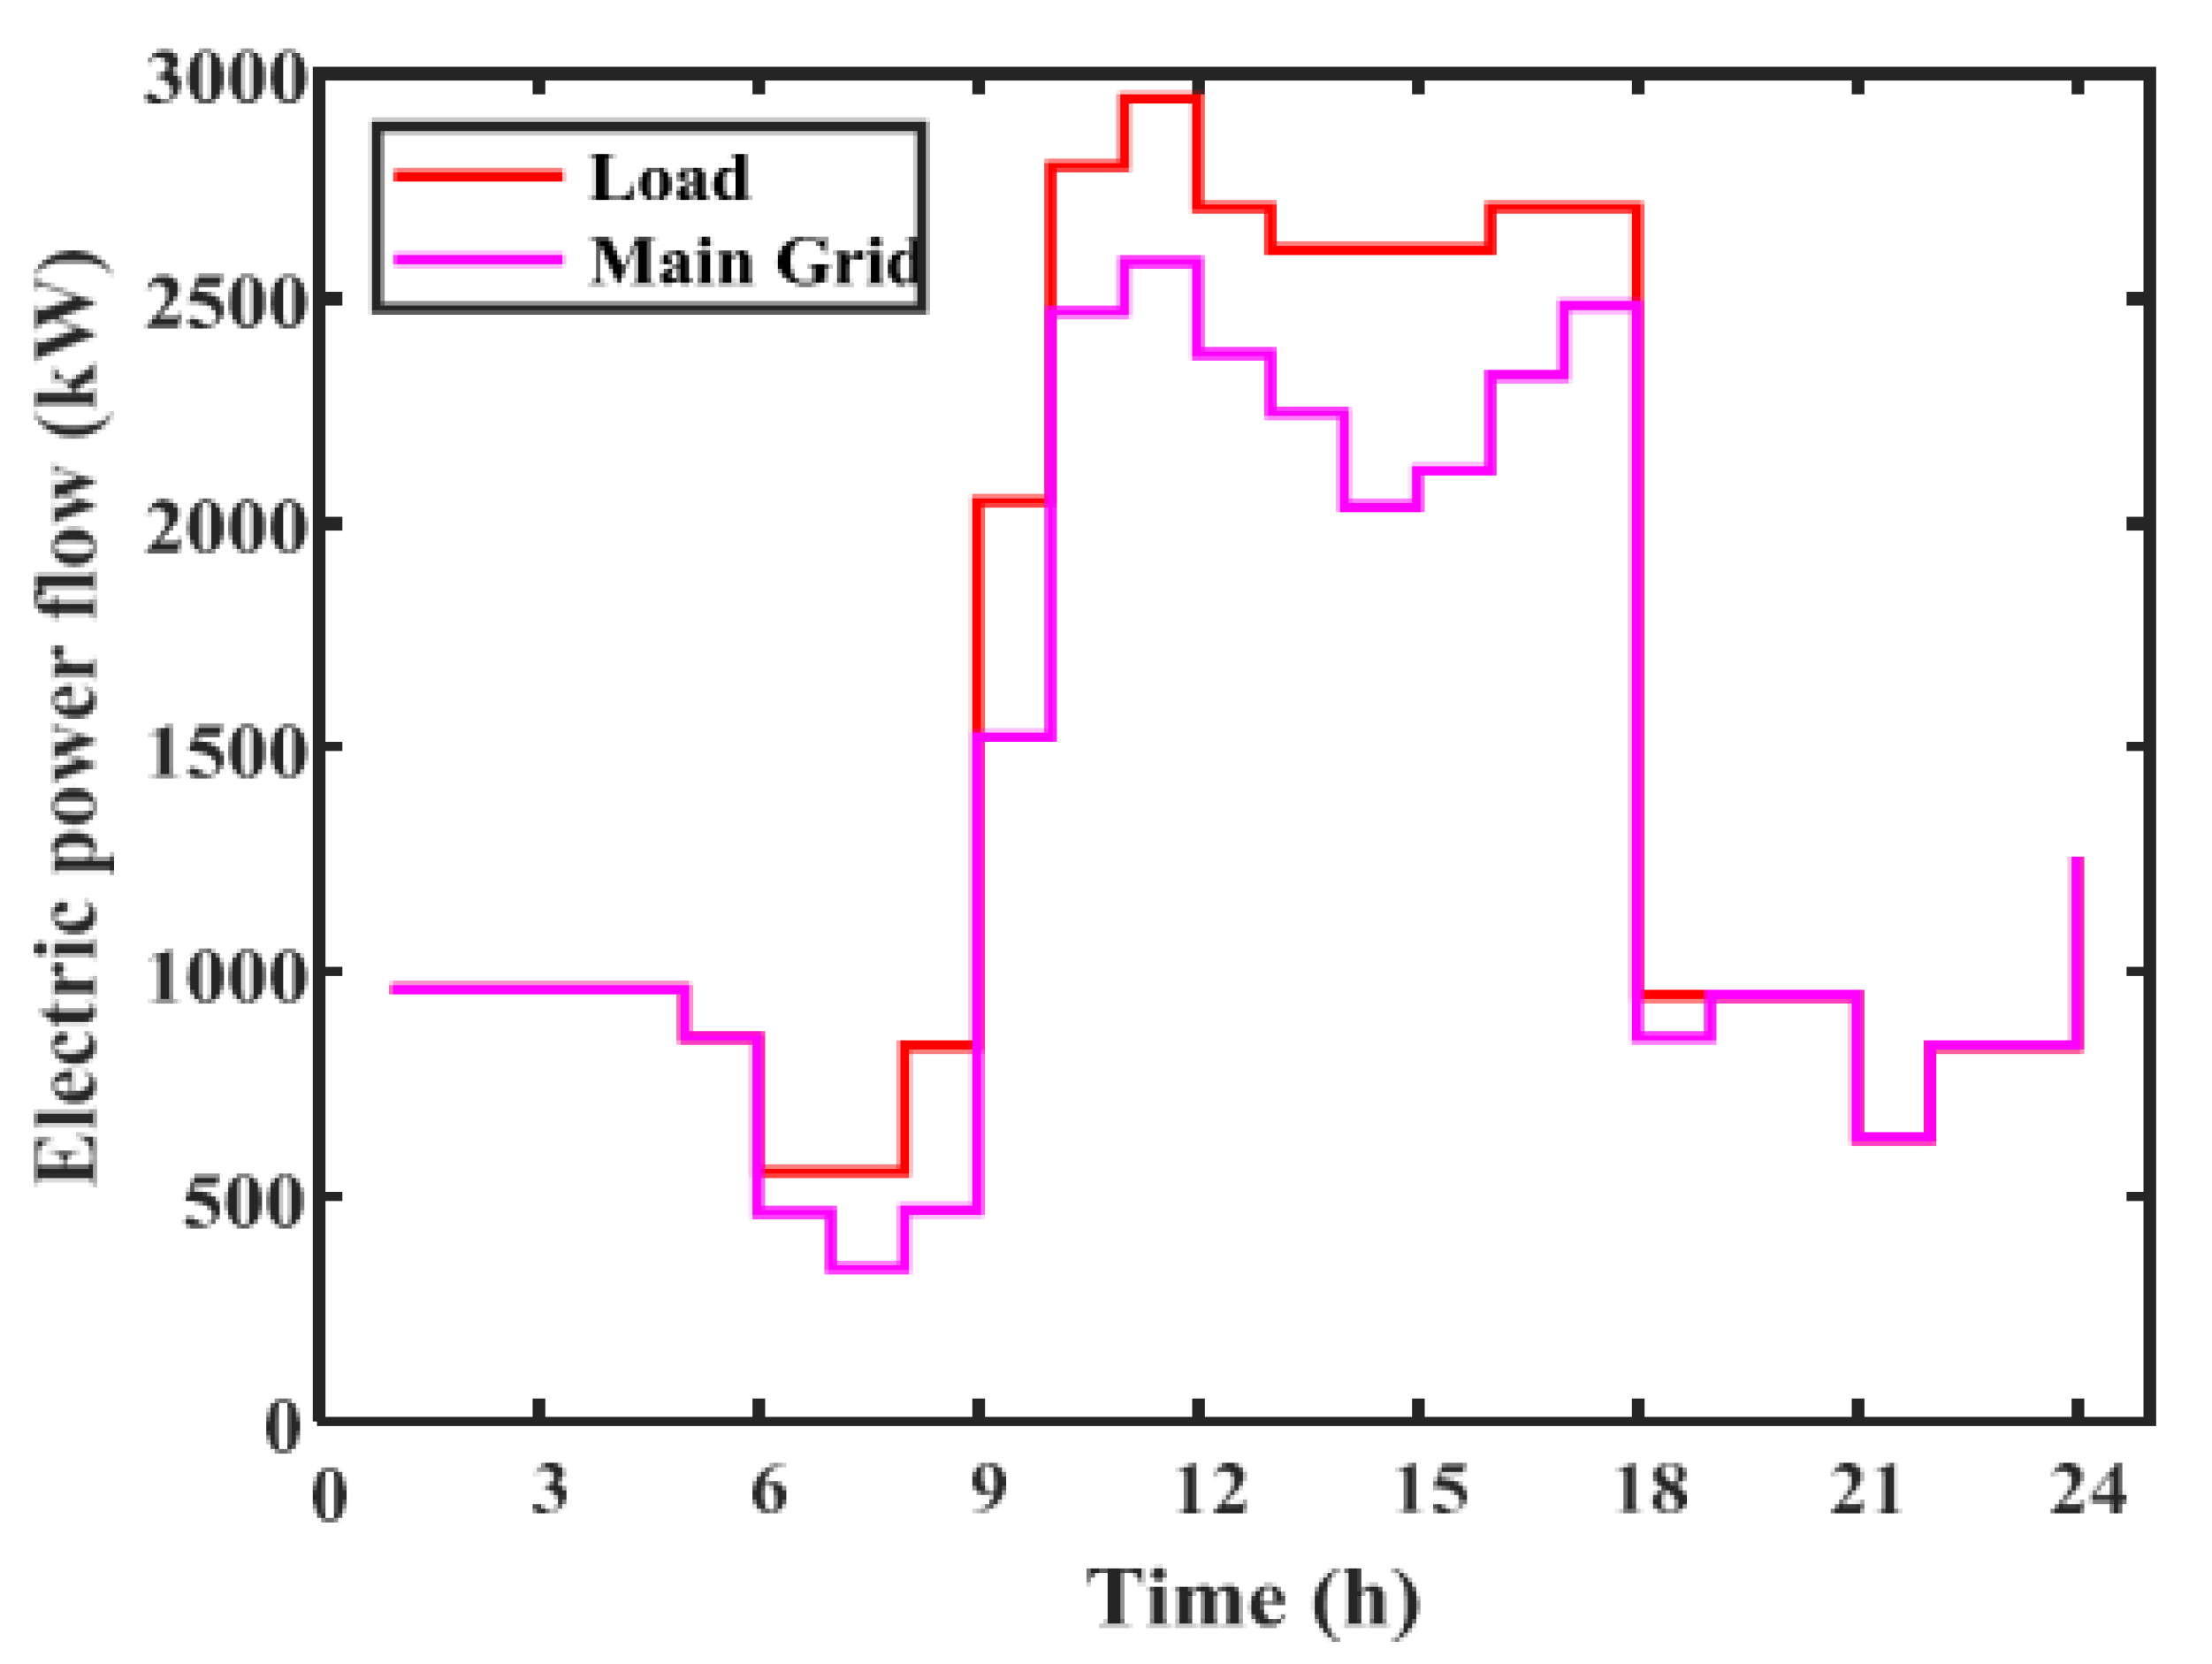
5.1. Grid Connected Mode
5.1.1. Base Case
5.1.2. Case with DER
5.1.3. Case with DER & DR
5.1.4. Case with DER, DR & Storage
5.2. VPP Autonomous Mode
5.2.1. Case with DER and Storage
5.2.2. Case with DER, DR & Storage
5.3. Benefits for Consumers
Influence of VPP on the Energy Charges
6. Comparison with Different Optimization Techniques
7. Conclusions
Author Contributions
Funding
Institutional Review Board Statement
Informed Consent Statement
Data Availability Statement
Acknowledgments
Conflicts of Interest
Nomenclature and Abbreviations
| η | Efficiency of a solar panel (14.9%) |
| St | Solar irradiation (W/m2) |
| T | Time-step (s) |
| N | Number of solar panels connected either in series or parallel |
| A | Area occupied by solar panels (m2) |
| Estimated output of solar PV | |
| Total demand on the feeder(kW) | |
| Schedulable demand (kW) | |
| Non Schedulable demand (kW) | |
| Emergency demand (kW) | |
| Operational price of battery in dispatch ($) | |
| Maintenance coefficient of battery | |
| Discharging or recharging of the battery | |
| Depreciation coefficient of the battery | |
| Total Cost of VPP($) | |
| Total Cost of PV($) | |
| Total Cost of Batteries ($) | |
| Total cost of Grid ($) | |
| Total cost of EENS($) | |
| Purchasing cost of electricity ($/kWh) | |
| Maximum rating of solar PV[kW] | |
| Energy imported from the grid (kWh) | |
| Cost of not supplying demand ($/kWh) | |
| EENS | Expected Energy Not Supplied (kWh) |
| Ttod | Energy usage charges [$/kWh] |
| MaxH | Maximum annual operation hours for technology [hour] |
| NS | Number of units of solar PV installed |
| Discharging rate of the battery (Amps) | |
| Charging rate of the battery (Amps) | |
| Total capacity of the battery (Ah) | |
| Initial capacity of the battery (Ah) | |
| Cost of VPP of utility imports ($/kWh) | |
| Cost of VPP of utility exports ($/kWh) | |
| Selling cost of electricity ($/kWh) | |
| Photovoltaic | |
| Time of Day | |
| Mixed Integer Linear Programming | |
| Electrical Transient Analyzer Program | |
| Failure rate/Year | |
| Distributed Generation | |
| Particle Swarm Optimization | |
| Distributed Energy Resource | |
| Demand Side Management | |
| Virtual Power Plant | |
| Punjab State Power Corporation Limited | |
| National Renewable Energy Laboratory | |
| Hybrid Optimization Model For multiple Energy Resources | |
| Supervisory Control and Data Acquisition |
Appendix A
| Algorithm A1. %P&O Tracking |
| function [P,V,I] = PandO(sun,v,T) Vr = zeros(size(sun)); Ir = zeros(size(sun)); for k = 1:size(sun)-1 if size(k)~= 0 Vr0 = 2.8; Vr1 = 2.8 + v; Ir0 = max60(Vr0,sun(k),T(k)); Ir1 = max60(Vr1,sun(k+1),T(k+1)); Pr0 = Ir0.*Vr0; Pr1 = Ir1.*Vr1; break; end end for m = k+1:size(sun)-1 if size(m+1)~=0 if Pr1>Pr0 if Vr1>Vr0 Vr1=Vr1+v; else Vr1=Vr1-v; end else if Vr1>Vr0 Vr1=Vr1-v; else Vr1=Vr1+v; end end Ir0=Ir1; Pr0=Pr1; Ir1=max60(Vr1,sun(m+1),T(m+1)); Pr1=Ir1.*Vr1; Vr(m+1)=Vr1; Ir(m+1)=Ir1; end end V=Vr; I=Ir; P=Vr.*Ir; |
Appendix B

References
- Abdolrasol, M.G.M.; Hannan, M.A.; Hussain, S.M.S.; Ustun, T.S.; Sarker, M.R.; Ker, P.J. Energy Management Scheduling forMicrogrids in the Virtual Power PlantSystem Using Artificial Neural Networks. Energies 2021, 14, 6507. [Google Scholar] [CrossRef]
- Oest, F.; Radtke, M.; Blank-Babazadeh, M.; Holly, S.; Lehnhoff, S. Evaluation of Communication Infrastructures for Distributed Optimization of Virtual Power Plant Schedules. Energies 2021, 14, 1226. [Google Scholar] [CrossRef]
- Kaczorowska, D.; Rezmer, J.; Jasinski, M.; Sikorski, T.; Suresh, V.; Leonowicz, Z.; Kostyla, P.; Szymanda, J.; Janik, P. A Case Study on Battery Energy Storage System in a Virtual Power Plant: Defining Charging and Discharging Characteristics. Energies 2020, 13, 6670. [Google Scholar] [CrossRef]
- Nghitevelekwa, K.; Bansal, R.C. A review of generation dispatch with large-scale photovoltaic systems. Renew. Sustain. Energy Rev. 2017, 81, 615–624. [Google Scholar] [CrossRef]
- Müller, T.; Möst, D. Demand Response Potential: Available when Needed? Energy Policy 2017, 115, 181–198. [Google Scholar] [CrossRef]
- Gu, C.; Yan, X.; Yan, Z.; Li, F. Dynamic pricing for responsive demand to increase distribution network e fficiency. Appl. Energy 2017, 205, 236–243. [Google Scholar] [CrossRef] [Green Version]
- Vallés, M.; Reneses, J.; Cossent, R.; Frías, P. Regulatory and market barriers to the realization of demand response in electricity distribution networks: A Europeanperspective. Electr. Power Syst. Res. 2016, 140, 689–698. [Google Scholar] [CrossRef]
- Eid, C.; Codani, P.; Perez, Y.; Reneses, J.; Hakvoort, R. Managing electric flexibility from Distributed Energy Resources: A review of incentives for market design. Renew. Sustain. Energy Rev. 2016, 64, 237–247. [Google Scholar] [CrossRef]
- Xie, S.; Wang, X.; Qu, C.; Wang, X.; Guo, J. Impacts of different wind speed simulation methods on conditional reliability indices. Int. Trans. Electr. Energy Syst. 2013, 20, 1–6. [Google Scholar]
- Ahmad, S.; Naeem, M.; Ahmad, A. Low complexity approach for energy management in residential buildings. Int. Trans. Electr. Energy Syst. 2019, 29, 1–19. [Google Scholar] [CrossRef] [Green Version]
- Ahmad, S.; Ahmad, A.; Naeem, M.; Ejaz, W.; Kim, H.S. A compendium of performance metrics, pricing schemes, optimization objectives, and solution methodologies of demand side management for the smart grid. Energies 2018, 11, 2801. [Google Scholar] [CrossRef] [Green Version]
- Cui, H.; Li, F.; Hu, Q.; Bai, L.; Fang, X. Day-ahead coordinated operation of utility- scale electricity and natural gas networks considering demand response based virtual power plants. Appl. Energy 2016, 176, 183–195. [Google Scholar] [CrossRef] [Green Version]
- Nosratabadi, S.M.; Hooshmand, R.; Gholipour, E. Stochastic profit-based scheduling of industrial virtual power plant using the best demand response strategy. Appl. Energy 2016, 164, 590–606. [Google Scholar] [CrossRef]
- Yin, S.; Ai, Q.; Li, Z.; Zhang, Y.; Lu, T. Electrical Power and Energy Systems Energy management for aggregate prosumers in a virtual power plant: A robust Stackelberg game approach. Electr. Power Energy Syst. 2020, 117, 105605. [Google Scholar] [CrossRef]
- Liu, Y.; Li, M.; Lian, H.; Tang, X.; Liu, C.; Jiang, C. Electrical Power and Energy Systems Optimal dispatch of virtual power plant using interval and deterministic combined optimization. Electr. Power Energy Syst. 2018, 102, 235–244. [Google Scholar] [CrossRef]
- Zamani, A.G.; Zakariazadeh, A.; Jadid, S.; Kazemi, A. Electrical Power and Energy Systems Stochastic operational scheduling of distributed energy resources in a large scale virtual power plant. Int. J. Electr. Power Energy Syst. 2016, 82, 608–620. [Google Scholar] [CrossRef]
- Ju, L.; Tan, Q.; Lu, Y.; Tan, Z.; Zhang, Y.; Tan, Q. Electrical Power and Energy Systems A CVaR-robust-based multi-objective optimization model and three-stage solution algorithm for a virtual power plant considering uncertainties and carbon emission allowances. Electr. Power Energy Syst. 2019, 107, 628–643. [Google Scholar] [CrossRef]
- Wang, H.; Riaz, S.; Mancarella, P. Integrated techno-economic modeling, flexibility analysis, and business case assessment of an urban virtual power plant with multi-market co- optimization. Appl. Energy 2019, 259, 114142. [Google Scholar] [CrossRef]
- Yusta, J.M.; Naval, N.; Raul, S. A virtual power plant optimal dispatch model with large and small- scale distributed renewable generation. Renew. Energy 2020, 19, 57–69. [Google Scholar]
- Hadayeghparast, S.; Farsangi, A.S.; Shayanfar, H. Day-ahead stochastic multi- objective economic/emission operational scheduling of a large scale virtual power plant. Energy 2019, 172, 630–646. [Google Scholar] [CrossRef]
- Sakr, W.S.; Abd, H.A.; El-sehiemy, R.A.; Azmy, A.M. Techno-economic assessment of consumers’ participation in the demand response program for optimal day-ahead scheduling of virtual power plants. Alex. Eng. J. 2020, 59, 399–415. [Google Scholar] [CrossRef]
- Magdy, F.E.Z.; Ibrahim, D.K.; Sabry, W. Energy management of virtual power plants dependent on electro-economical model. Ain Shams Eng. J. 2020, 11, 643–649. [Google Scholar] [CrossRef]
- PSPCL Installed Capacity. 2018. Available online: https://www.pspcl.in/about-us/statistics (accessed on 1 September 2021).
- Rashid, M.M.U.; Alotaibi, M.A.; Chowdhury, A.H.; Rahman, M.; Alam, M.S.; Hossain, M.A.; Abido, M.A. Home Energy Management for Community Microgrids Using Optimal Power Sharing Algorithm. Energies 2021, 14, 1060. [Google Scholar] [CrossRef]
- PSPCL Tariff. 2018. Available online: http://docs.pspcl.in/docs/sesalesto20180719161203100.pdf (accessed on 1 September 2021).
- Kita, E.; Shin, Y.B. Application of Particle Swarm Optimization to Packing Problem. WIT Transactions on the Built Environment, Vol 125, Computer Aided Optimum Design in Engineering XII. Available online: https://www.witpress.com/elibrary/wit-transactions-on-the-built-environment/125/23515) (accessed on 22 December 2021).
- Yousif, M.; Ai, Q.; Gao, Y.; Wattoo, W.A.; Jiang, Z. Application of Particle Swarm Optimization to a Scheduling Strategy for Microgrids Coupled with Natural Gas. Energies 2018, 11, 3499. [Google Scholar] [CrossRef] [Green Version]
- Yousif, M.; Ai, Q.; Member, I.; Gao, Y.; Wattoo, W.A.; Jiang, Z. An Optimal Dispatch Strategy for Distributed Microgrids using PSO. CSEE J. Power Energy Syst. 2019, 6, 723–724. [Google Scholar] [CrossRef]
- Sharma, H.; Mishra, S. Techno-economic analysis of solar grid-based virtual power plant in Indian power sector: A case study. Int. Trans. Electr. Energy Syst. 2019, 30, e12177. [Google Scholar] [CrossRef]
- Sharma, H.; Mishra, S. Optimization of Solar Grid-Based Virtual Power Plant Using Distributed Energy Resources Customer Adoption Model: A Case Study of Indian Power Sector. Arabian J. Sci. Eng. 2021, 1–21. [Google Scholar] [CrossRef]


| Industrial Feeder | |
|---|---|
| Loading Parameters | |
| Average demand | 1033 kW |
| Peak demand | 4288 kW |
| Annual energy demand | 9,718,850 kWh |
| Peak Month | November |
| Total consumers | 257 |
| Length | 2174 m |
| Current capacity | 254 Amp |
| kVA capacity on 11 kV | 4839 kVA |
| Maximum demand | 290 Amp/5518 kVA |
| Reliability Parameters | |
| No. of Transformers | 47 |
| Transformer Failure rate/year | 0.15 |
| Transformer Mean time to repair | 0.5 h |
| No. of sectional lines | 41 |
| Sectional Lines Failure rate/year | 0.5 |
| Sectional Lines Mean time to repair | 1.5 h |
| No. of Substations | 1 |
| Substation Failure rate/year | 0.6 |
| Substation Meantime to repair | 4 h |
| Period | Time | Cost/kWh |
|---|---|---|
| 1 April 2018 to 31 May 2018 | 06:00 a.m. To 06:00 p.m. | $0.09 |
| 06:00 p.m. To 10:00 p.m. | ||
| 10:00 p.m. To 06:00 a.m. | $0.07 | |
| 1 June 2018 to 30 September 2018 | 06:00 a.m. To 06:00 p.m. | $0.09 |
| 06:00 p.m. To 10:00 p.m. | $0.12 | |
| 10:00 p.m. To 06:00 a.m. | $0.09 | |
| 1 October 2018 to 31 March 2019 | 06:00 a.m. To 06:00 p.m. | $0.09 |
| 06:00 p.m. To 10:00 p.m. |
| Base Case | With DER | With DER & DR | With DER, DR & Storage | |
|---|---|---|---|---|
| PV Capacity | - | 1916 kW | 1916 kW | 1916 kW |
| Battery Capacity | - | - | - | 9511 kWh |
| Annual Savings | $0 | $367 | $402 | $1028 |
| Optimized operational cost | $3284 | $2917 | $2882 | $2247 |
| Total Electricity import | 36,413 kWh | 32,085 kWh | 32,085 kWh | 32,085 kWh |
| Peak Demand | 2945 kW | 2582 kW | 2582 kW | 2250 kW |
| EENS during autonomous operation for during 10 to 12 h in typical section TU | 3491 kWh | 1904 kWh | 1579 kWh | 1316 kWh |
| PV output for during 10 to 12 h in section TU | - | 260 kWh | 260 kWh | 260 kWh |
| DR (load shifting) for during 10 to 12 h period in section TU | - | - | 324 kWh | 324 kWh |
| Battery output for during 10 to 12 h in Section TU | - | - | - | 262 kWh |
| Energy Charges with TOD Tariff (On = On-Peak; Mid = Mid-Peak; Off = Off-Peak) | ||||||
|---|---|---|---|---|---|---|
| Charges in $ without VPP Implementation | Charges in $ with VPP Implementation | |||||
| Month | on | mid | off | on | mid | Off |
| January | 637.39 | 2906.07 | 137.96 | 464.95 | 1480.49 | 576.54 |
| February | 578.47 | 2673.97 | 121.38 | 345.83 | 1418.59 | 524.55 |
| March | 566.45 | 3050.77 | 142.78 | 312.65 | 1359.35 | 593.26 |
| April | 544.19 | 3167.03 | 147.45 | 288.85 | 1468.1 | 591.64 |
| May | 553.85 | 3215.48 | 151.89 | 263.8 | 1439.22 | 586.75 |
| June | 696.08 | 3050.88 | 187.39 | 180.67 | 2130.61 | 78.23 |
| July | 752.45 | 3265.23 | 197.4 | 183.74 | 2202.05 | 105.45 |
| August | 754.69 | 3289.84 | 196.13 | 192.72 | 2316.59 | 99.35 |
| September | 685.08 | 3038.58 | 186.89 | 166.66 | 2129.64 | 101.47 |
| October | 545.7 | 3176.31 | 150.78 | 271.22 | 1526.44 | 586.59 |
| November | 571.03 | 2760.63 | 125.46 | 336.78 | 1349.21 | 527.29 |
| December | 639.79 | 2952.88 | 134.68 | 459.25 | 1589.36 | 577.26 |
| Optimization Algorithm | Optimal Operational Cost |
|---|---|
| System without Optimization | $3284 |
| Proprietary Derivative Free | $2534 |
| MILP | $2390 |
| Proposed PSO | $2247 |
Publisher’s Note: MDPI stays neutral with regard to jurisdictional claims in published maps and institutional affiliations. |
© 2022 by the authors. Licensee MDPI, Basel, Switzerland. This article is an open access article distributed under the terms and conditions of the Creative Commons Attribution (CC BY) license (https://creativecommons.org/licenses/by/4.0/).
Share and Cite
Sharma, H.; Mishra, S.; Dhillon, J.; Sharma, N.K.; Bajaj, M.; Tariq, R.; Rehman, A.U.; Shafiq, M.; Hamam, H. Feasibility of Solar Grid-Based Industrial Virtual Power Plant for Optimal Energy Scheduling: A Case of Indian Power Sector. Energies 2022, 15, 752. https://doi.org/10.3390/en15030752
Sharma H, Mishra S, Dhillon J, Sharma NK, Bajaj M, Tariq R, Rehman AU, Shafiq M, Hamam H. Feasibility of Solar Grid-Based Industrial Virtual Power Plant for Optimal Energy Scheduling: A Case of Indian Power Sector. Energies. 2022; 15(3):752. https://doi.org/10.3390/en15030752
Chicago/Turabian StyleSharma, Harpreet, Sachin Mishra, Javed Dhillon, Naveen Kumar Sharma, Mohit Bajaj, Rizwan Tariq, Ateeq Ur Rehman, Muhammad Shafiq, and Habib Hamam. 2022. "Feasibility of Solar Grid-Based Industrial Virtual Power Plant for Optimal Energy Scheduling: A Case of Indian Power Sector" Energies 15, no. 3: 752. https://doi.org/10.3390/en15030752