1. Introduction
Energy availability is a significant factor in economic activities, such as the production process of goods and services [
1]. As economies develop, energy demand rapidly increases. Given the severity of the environmental degradation, which is due significantly to fossil fuel consumption, the developed and developing countries should consider energy transition and how they should use and produce green energy sources to improve environmental quality [
2]. However, environmental quality is one of the main significant issues in the literature. Although there are several indices of environmental quality, CO
2 emissions are the main significant factor in increasing environmental degradation [
3]. Since CO
2 is considered as the greatest threat to the global climate, nations have set up international agreements (e.g., the 2015 Paris agreement, the Kyoto protocol) to reduce the levels of carbon emissions [
4]. Several empirical papers have explored the influence of income and energy on CO
2 emissions, e.g., [
5,
6,
7,
8,
9,
10,
11]; most have not studied the effect of the real estate market in their empirical studies. The present study aims to study the link between real estate and carbon levels in Turkey.
Turkey, as a developing country, is one of the fastest-growing countries in the field of economic growth rates in the world. Turkey aims to be one of the world’s top 10 economies. According to the World Bank, GDP in Turkey reached USD 778.4 billion (
$) in 2018 compared to USD 90,695 billion in 1988 [
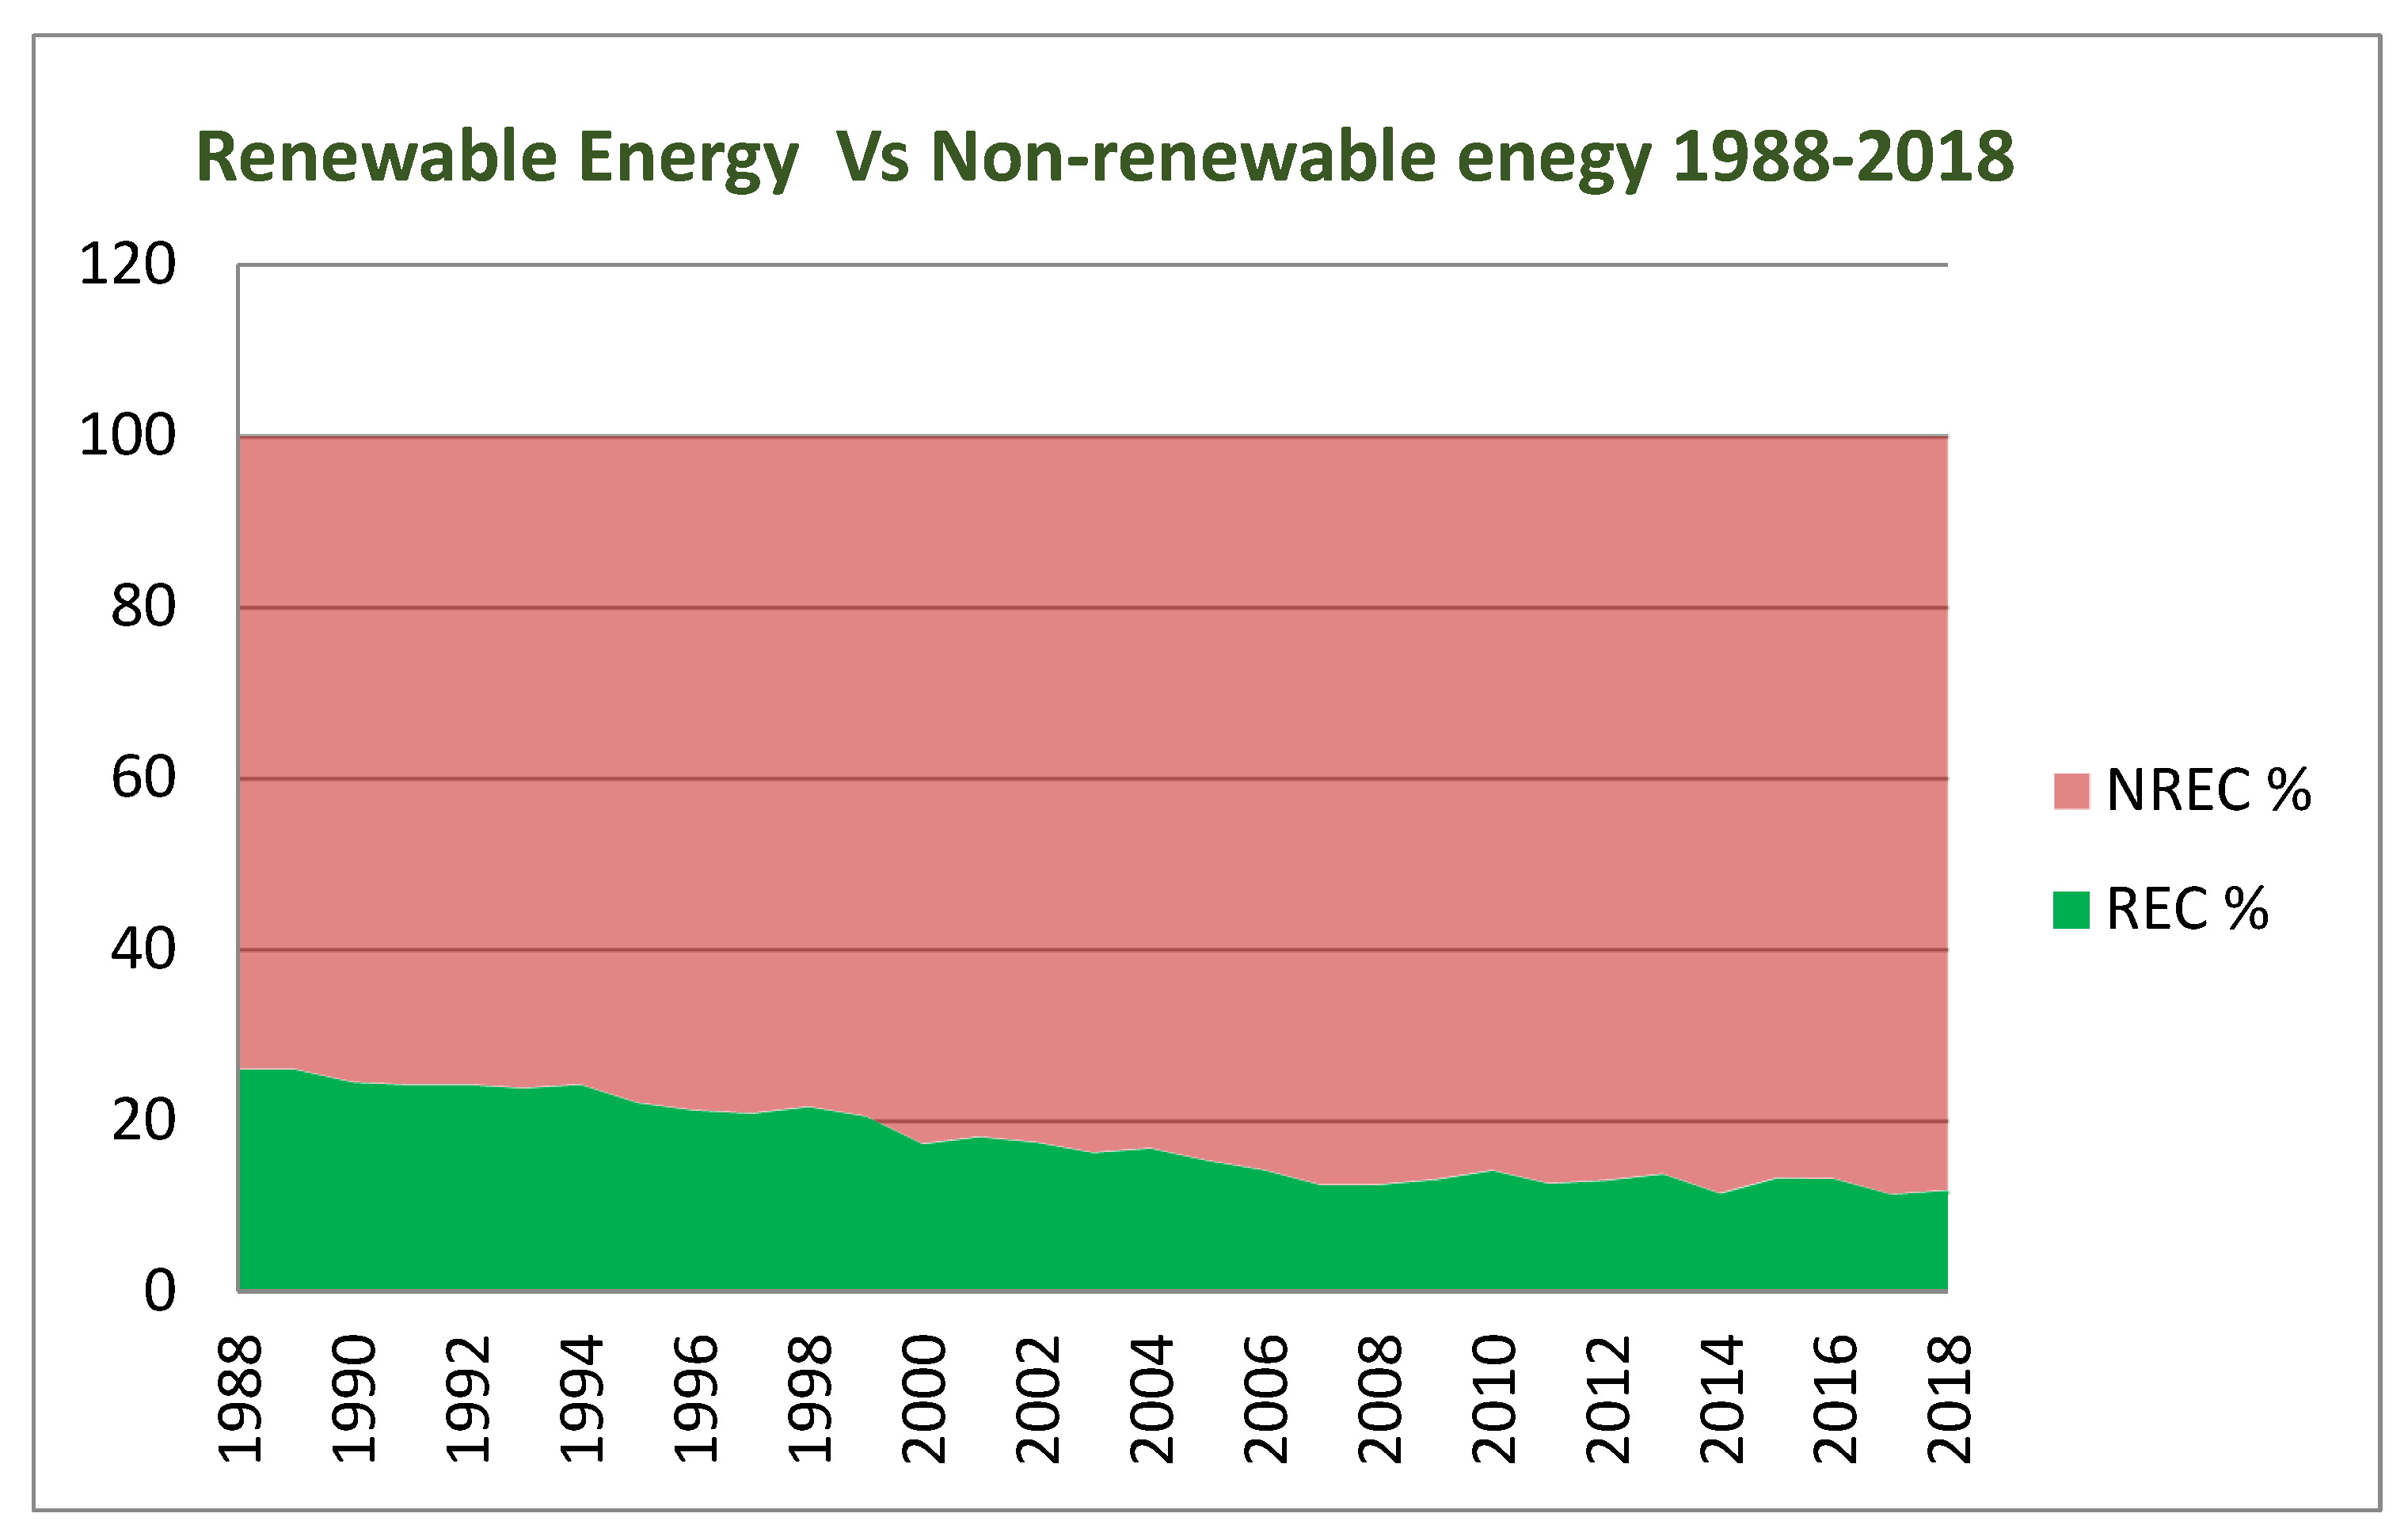
11]. As a result of the rapid GDP growth in Turkey, nonrenewable energy consumption in Turkey has increased significantly in recent decades. Fossil fuels dominate the total primary energy supply, and the share of fossil fuels in the total primary energy supply reached 82% in 2018, which ranked the ninth highest among International Energy Agency member countries (
Figure 1). On other hand, carbon emissions per capita for Turkey reached 4.83 tons in 2020 compared to 2.4 tons of carbon per capita in 1988.
Source: World Bank
On the other hand, as a result of rapid economic growth and urbanization, the Turkish real estate market has experienced an improvement over the last years. In this context, the real estate and construction sectors as a percentage of GDP reached a high level of 8% in 2017 [
12]. The number of house sales has increased significantly in recent. For example, the total number of house sales reached around one million houses in 2017. A significant increase in housing demand will eventually lead to an increase in the levels of housing prices; Turkey’s economy is ranked 6th among 60 countries, with an annual price growth rate of 10% [
12]. However, the growth of real estate significantly affects economic activities, such as providing more capital to the market. Subsequently, it leads to impact consumption of energy by adopting the modern techniques of energy. Therefore, the real estate market may affect the efficiency of the levels of investment in the markets. Subsequently, it will affect the economic growth rates. Several papers have added financial market development to their tested formwork [
13,
14,
15,
16], while the impact of the real estate market on environmental quality is neglected in their empirical studies. Our study suggests that real estate markets may affect the level of carbon emissions through two channels, namely energy consumption and economic growth. A significant improvement in the real estate market will positively affect household wealth and borrowing rates, which in turn leads to stimulating the investment and economic growth rates. In this context, many empirical studies have demonstrated that the real estate market significantly affects economic growth, e.g., [
17,
18,
19,
20]. These studies affirm that an improvement in the real estate market is accompanied by higher household consumption and firm investment, which improve economic growth rates. In this line, a significant impact of the real estate market on economic activities will lead to an increase in the level of investment. Subsequently, this leads to an increase in nonrenewable energy consumption.
Our study addresses how the real estate market has impacted the levels of environmental quality. We believe that the present research contributes to the current literature in two ways. Firstly, we developed a theoretical framework in CO
2 emission determinants by testing the effect of the real estate market on emission levels in the case of Turkey, alongside energy and income trade. To our academic knowledge, this is the first work that has tested the impact of the real estate market on carbon emission levels. Secondly, the present research employs advanced models to test the interaction amongst the selected variables, namely the BARDL test as introduced by McNown et al. [
21], and a modern co-integration method of the (B&H) (2013) [
22] applied to ensure the co-integration outcomes.
The structure of the paper is organized as follows: the second section of this article introduces a review of the empirical literature; the third and fourth sections introduce the data and tested models and the empirical outcomes of our work; and the conclusion is introduced in the last section.
2. Review of the Empirical Literature
Several scholars in the literature have emphasized the significant influence of income as an essential origin of environmental degradation. In this context, several empirical studies have confirmed that real income positively affects the level of environmental deterioration by different methods, for instance, Altıntaş and Kassouri [
23] in 14 European countries over the period of 1990 to 2014, Minlah and Zhang [
24] in Ghana over the examined period of 1960–2014, Akadiri and Adebayo [
25] in India over the period of 1970–2018, Osadume [
26] in selected West African countries for the period of 1980–2019, Jun et al. [
27] in the South Asian region over the period of 1985–2018, Aziz et al. [
28] in Pakistan for the period of 1990–2021, and Altarhouni et al. [
16] in Turkey for the period of 1981–2016. It has been confirmed that the growth of income and population are the main significant factors that lead to increased fossil fuel consumption. Therefore, the level of carbon emissions invariably increases due to the growth of economic activities and energy consumption.
On other hand, several empirical studies have reported and proved that renewable energy consumption (REC) contributes significantly to carbon emission reduction. For instance, Adebayo et al. [
5] tested the interconnectedness among REC and CO
2 over the annual data from 1990–2018. Using the NARDL test, the outcomes reported that REC mitigates CO
2 in Chile. Liu et al. [
6] assessed the interconnectedness among REC and carbon emissions. The outcomes reported that REC is negatively linked to CO
2 emissions in BRICS nations over the period of 1999–2014. Nguyen and Kakinaka [
7] tested the interconnectedness among REC and CO
2 in 107 countries. The authors ensured that REC is negatively associated with CO
2 emissions over the period of 1990–2013. Bilgili et al. [
8] found that REC adversely affected the levels of carbon emissions in 17 OECD countries over the selected annual data from 1977–2010. Adams and Acheampong [
9] report that REC had an adverse influence on CO
2 emissions in 46 sub-Saharan African countries over the period of 1980–2015. Saidi and Omri [
10] used a panel model, and the outcomes approved that REC adversely affected the levels of carbon in 15 major renewable energy-consuming countries. In Turkey, Abumunshar et al. [
11] used the ARDL technique and showed a negative link between REC and CO
2 over the tested period of 1985–2015, while several empirical studies have demonstrated and proved that non-renewable energy consumption (NREC) contributes adversely to carbon emissions reduction. For instance, Sulaiman and Abdul-Rahim [
29] confirmed the level of NREC has a significant and positive impact on the carbon levels in Malaysia. Recently, Anwar et al. [
30] affirmed that NREC has a positive impact on environmental degradation in ASEAN countries. Nawaz et al. [
31] approved that that the NREC and CO
2 link is positive in BRICS and OECD regions. Similarly, results from He et al. [
32] who affirmed the positive link between NREC and CO
2 in Mexico, and Fatima et al. [
33] who suggested that an increase in the level of NREC led to increased CO
2 emissions in high emitter countries. In Turkey, [
34,
35,
36,
37] used a different method and ensured the NREC positively affected the levels of carbon in Turkey over different tested periods.
Some papers tested the interconnection among markets and carbon levels. For instance, Sharma et al. [
13] tested the impact of stock market development on the carbon intensity. Using the CS-ARDL approach, the findings showed that stock market development insignificantly affected the level of carbon, while Paramati et al. [
14] affirmed that stock market development negatively affected the levels of carbon emission in G20 countries. Samour et al. [
15] tested the impact of banking sector development on the carbon levels in Turkey. Using the ARDL approach, the authors ensured a positive interaction between banking development and carbon emissions. Altarhouni et al. [
16] tested the impact of insurance market development on Turkey’s carbon emissions. The outcomes provided empirical evidence that insurance market development positively affected the carbon emissions over the selected period. Other studies tested the impact of financial development on carbon emissions in different countries, for instance, Gokmenoglu and Sadeghieh [
38] in Turkey, Koondhar et al. [
39] in China, Shahbaz et al. [
40] in China, Tahir et al. [
41] in South Asian economies, and Baloch et al. [
42] for OECD countries. However, no empirical study has ever tested the impact of the real estate market on environmental quality. Therefore, we have focused on presenting a novel research topic by examining the role of the real estate market on environmental quality using two advanced methods of the BARDL (2018) and B&H (2013) test. We suggest that the real estate market affects the levels of environmental quality through energy and income factors channels. However, several scholars in the literature have ensured that the real estate market has a powerful impact on economic performance, e.g., [
17,
18,
19,
20]. In their empirical results, the scholars affirmed that an improvement in the real estate market is accompanied by higher household consumption and firm investment that boosts economic growth.
3. Data, and Model Construction
Real income (R), and renewable energy (REC), non-renewable energy (NREC), and carbon emissions (CO
2) are the main factors in the tested model in several empirical studies (e.g., 26; 16; 27; 23). The present paper is different from existing empirical papers by testing the influence of the real estate market (REM) on carbon levels. Therefore, the real estate market will be added to the theoretical framework of our study. The investigated model of the present research is formulated in the next equation:
In Equation (1) lnCO2 symbolizes carbon emissions (measured in kilotons), symbolizes the real income (constant-2010-US-Dollar $), symbolizes a share of REC to the total of NREC, symbolizes non-renewable energy consumption of (oil, natural ga, coal), is the real estate market, and represents the error term. The study uses Turkey’s annual data over the period of 1988–2018; the selected data are derived from Energy Information Administration, World Bank, and OCED.
It is important to analyze and ensure that the selected series are integrated before testing any link amongst the tested variables. Our paper employs two structural unit root tests: Zivot–Andrews (Z
) and Clemente–Montanes–Reyes (CMR test) [
43]. The main advantage of ZA and CMR tests is that these tests take into consideration structural breaks in test series.
To estimate co-integration levels among R, REC, NREC, REM and CO
2, we utilize the new method of the ARDL model (BARDL) as developed by McNown et al. (2018) [
21]. The developed method of BARDL (2018) includes the
. or
tests on the determined coefficients of independent variables. In this test the
of
test is
= 0. The
. of
test is
=
=
=
=
= 0. The
of the
test is
es
es
≠ e
.
The new method of the BARD (2018) test is recommended over classical methods of co-integration for several reasons: firstly, one of the core benefits of using the BARDL test is that it increases both the t-test and f-test power. In addition, the properties of integration levels in this test are not complex. Secondly, it is the preferred method for the tested models that are dynamic time series in nature (McNown et al., 2018) [
21]. Thirdly, unlike conventional approaches, the BARDL method addresses the issue of inconclusive cases. Fourthly, this test decreases the possibility of indecision cases (areas) because critical values are generated. Finally, the critical values of the BARDL test are produced by bootstrap simulation, which is established on the determined levels of integration of each selected time series. In this line, this feature will lead to eliminating the instability issue of the ARDL approach, and it provides better findings than the conventional methods of co-integration, such as the ARDL-Pesaran (2001) ARDL test. For example, for the CVs in the conventional methods of co-integration, only one tested variable is allowed to be endogenous, while all tested variables in the BARDL test are allowed to be endogenous. In this context, we focused on presenting a new exploring topic to the current literature by testing the impact of the real estate market, income, energy and CO
2 emissions using the developed approach of ARDL testing.
We employ ARDL testing to measure the interaction among R, REC, NREC, REM, and CO
2 in the long and short term. The ARDL approach is formulated in the following equation:
where ∆ means the first-difference operator of the studied series.
,
,
are the selected variables of our research in the log; E, K, M, N, and X are optimal of lags.
error correction term (
of the estimated model. The
coefficient should be a negative and static sign (less than −l) to stand and affirm the speed adjustment from convergence to equilibrium.
To ensure the co-integration level between the studied variables, we employ the new method of Bayer and Hanck of co-integration (B&H) (2013) [
22]. The core feature of this method is that it can be employed for varied integration orders. Furthermore, B&H combines four different approaches of co-integration, namely, an Engle and Granger test (1987) (E
[
44], (2) the Johansen method of co-integration (1988) (
[
45], (3) the Boswijk approach of co-integration (1994) (
[
46], and
the Banerjee et al. test of co-integration (1998) (
[
47].
Moreover, this method includes the
-statistics feature to ensure the levels of co-integration, which is formulated in Equations (3) and (4) as follows:
In Equations (3) and (4): E, , , are four co-integration tests in B&H testing of co-integration. The of no co-integration will not be valid if the calculated statistics exceed the CV of the B&H test.
Moreover, the current paper employs ARCH
, and Breusch–Pagan Godfrey
to ensure the absence of serial correlations. A Ramsey Reset test
, and Normality test
are used to ensure the model of our current research is stable and normally distributed. To capture the casual link among
, Granger causality analysis is applied
To estimate the causal interconnection, this research used Wald testing to determine causal interconnection among the variables in the short run. In addition, this research employs the (t) test of the lagged EC term to capture the causal interconnection in the long run. In this analysis, the EC term is utilized to capture deviations of the studied series in the short run. The equation of error correction model is formulated in Equations (5)–(9). The structure of the econometrics methods and techniques of this study is shown in
Figure 2.
4. Empirical Findings
The outcomes of the structural unit root test (ZA, CMR) are reported in
Table 1. The outcomes reported that, CO
2, R, REC, NREC, and REM variables are integrated and stationary at the first-difference process. Therefore, these outcomes ensure that the selected variables (CO
2, R, REC, NREC, and REM have I (1) order of integration level.
Since all the examined variables are integrated I (1), we can verify the long-run interaction among CO
2, R, REC, NREC, and REM variables. To achieve this step, we employed BARDL and B&H tests. The outcomes of the BARDL approach are displayed in
Table 2. The outcomes confirm that the
FPesaran,
Tdependent, and
Fdependent are higher than the CVs at 5% of the statistical significance level. Therefore, the outcomes ensure that the hypothesis (there is a co-integration level among CO
2, R, REC, NREC, and REM) is accepted. Furthermore, the outcomes of the B&H (2013) test as presented in
Table 3 illustrate that the “F” statistics of “EGT-JOT” and “EGT-JOT-BOT-BAT” are higher than the 5% of the CV.
However, the outcomes of the BARDL and B&H tests prove that the co-integration among the selected variables is valid. Hence, the determination of carbon emission drivers can be further achieved by applying the ARDL test.
The ARDL approach has been utilized to assess how income, energy, and the real estate market affect the level of carbon emissions. The coefficients of the ARDL method are shown in
Table 4. The outcomes of the ARDL estimation method are affirmed that the real income has a significant, positive impact on CO
2. A one percent increase in income will cause a rise in Turkey’s carbon level by 2.139% and 1.45% in the short and long term, respectively. This result is in line with Altarhouni et al. [
16], who affirmed that real income positively affected the carbon emissions in Turkey over the period of 1981–2016.
On other hand, the outcomes are confirmed that the REC has a significant, adverse effect on CO
2. A one percent increase in REC will cause a decline in Turkey’s carbon level by 0.210% and 0.131% in the short and long term, respectively. This result is in line with Abumunshar et al. [
11] who used the ARDL technique and showed a negative link among REC and CO
2 over the tested period of 1985–2015, while NREC has a significant, positive impact on carbon levels. A one percent increase in NREC will cause a rise in Turkey’s CO
2 level by 0.85% and 0.49% in the short and long term, respectively. This finding is consistent with [
34], who ensured that the NREC positively affected the levels of carbon in Turkey over different tested periods.
Furthermore, the outcomes of the ARDL method have ensured that the real estate market negatively affected the CO2 emission reduction. A one percent increase in the real estate market will cause a rise in Turkey’s carbon level by 0.010% and 0.009% in the short and long term, respectively. However, this study provides novel empirical evidence that the real estate market significantly affected the level of carbon emissions.
Table 4 proves that the rate of convergence from
) to the
equilibrium is 41%. The results of the diagnostic tests are presented in
Table 5. The findings prove the selected model among
is correct and normally distributed. In addition, the outcomes affirmed the absence of any serial correlation in the tested model of our research. Moreover,
Figure 3 (CUSUM, and
) proves the selected model is stable and correct. The figures imply that the blue lines fall between the red and green lines at a 5% significance level.
To capture the casual link among the R, REC, NREC, REM→CO
2 variable, we employed the Granger causality test. The results of this test are shown in
Table 6 and showed that (t) statistics of the lagged value of the
EC—
T ensure the existence of a causal link among R, REC, NREC, and REM→CO
2 variables in long run. Furthermore, the outcomes ensure that the (F) statistics value provides evidence that there is a unidirectional causal interaction among R, REC, NREC, and REM→CO
2 in the short run. Thus, real income, energy, and the real estate market significantly causes the levels of Turkey’s carbon emission in the short run. Moreover, there is a unidirectional causal link between the REM to NREC and income (REM→R, NREC). Therefore, we affirm that the real estate market has a powerful statistical influence on CO
2 emissions in Turkey through income and NREC. We provide new evidence to the literature that the real estate market plays a significant role in environmental quality.
The development of financial markets and the economy have been swiftly growing in Turkey over the recent decades. Together with the issues regarding environmental pollution levels, there has been controversy about the energy policies in Turkey. Therefore, our study aims to examine the interaction between income, REC, NREC, the real estate market, and carbon emissions. In this context, the findings show that REC has an adverse impact on CO2 emissions in Turkey. In contrast, the findings affirm that NREC has a positive impact on CO2 emissions in Turkey. Furthermore, the findings affirm that real income positively affected the level of carbon emissions in Turkey over the test period. Hence, Turkish policymakers should design new policies to improve the environmental quality by increasing energy efficiency and by adding more clean energy sources in the energy formula. However, the findings of the present research suggest that policymakers should promote investments and projects in renewable energy to achieve sustainable development.
Finally, we provide empirical evidence that the real estate market increases environmental pollution. This result can be explained due to several factors: (I) Turkey is an attractive country because of its transportation facilities and tourism. (II) The legislative amendments in Turkey helped to ease citizenship for foreigners. (III) Developments of technology in the markets and government initiatives to promote investment in the markets. All these factors create a positive impact on the real estate markets and increase the number of house sales in Turkey, as well as increase the share of the real estate market to GDP. The rapid growth in Turkey’s real estate market significantly affected the levels of income and energy consumption in Turkey, which in turn led to an increase in the emission levels. However, the study suggests that the real estate markets in Turkey may affect the level of environmental degradation through two channels, namely income and energy consumption. A significant improvement in the real estate market will positively affect household wealth and borrowing rates, which in turn leads to stimulating the investment and economic growth rates. An improvement in the real estate market is accompanied by higher household consumption and firm investments that improve economic growth rates. In this context, a significant impact of the real estate market on economic activities will lead to an increase in the level of investment, which in turn, leads to cause an increase in nonrenewable energy consumption.
However, our study provides a significant conclusion that the sustainability of the real estate market is an important issue for Turkey in facing environmental quality challenges. Therefore, it will be difficult to improve the environmental quality if the real estate sector is not considered in energy policies. The real estate market has an important role in the economy by impacting the volume of investment and economic growth rates, which in turn may affect fossil fuel consumption and CO2 emission levels. The outcomes of our work suggest that Turkey should design energy and economics policies to achieve a sustainable real estate market and improve the environmental quality by adding and using more green energy and supporting green investments.
In summary, our research provides valuable recommendations for Turkey’s policymakers considering green real estate markets. In this context, our work suggests that the Turkish officials should adopt strategies for a sustainable real estate market to improve the environmental quality through efficient energy consumption channels and investment incentive programs in clean energy investments.
5. Conclusions
Turkey is a developing country that has a strong financial market, high economic growth rates, and high investment volume. On the other hand, Turkey’s energy demand and carbon levels have been increasing fast in recent decades. For these reasons, applying the BARDL approach to co-integration and the Granger causality test, our research investigates the co-integration and causal interaction among income, energy consumption, the real estate market, and Turkey’s carbon emissions over the period of 1988–2018. Our current research explores how the real estate market has affected the levels of carbon emissions. We believe that our research contributes to the existing literature in two ways. Firstly, the study develops a theoretical framework to analyze the impact of the real estate market on carbon emissions in Turkey. To the best of our research knowledge, this is the first study that has developed such a framework in the literature. Secondly, the study uses advanced techniques to explore the interaction between the selected variables, namely the (ARDL) bootstrap testing approach. In addition, a developed co-integration method of the Bayer–Hanck method is used to ensure the ARDL testing outcomes.
Our findings demonstrated several policy implications for policymakers in Turkey. First, increasing NREC negatively affects the environmental quality. Hence, Turkish policymakers should design new policies to improve environmental quality by increasing energy efficiency and by adding more clean energy sources in the energy formula. These policies may not only improve environmental quality but will lead to limiting its dependency on foreign suppliers of energy. Second, the findings of the present research demonstrated the significant impact of increasing the share of renewable energies in the energy formula in Turkey to the sustainable energy sector. Thirdly, we conclude that the income–carbon interaction is positive. Therefore, Turkey should design new green economic policies to limit the negative impact of income on environmental quality. Finally, we provide empirical evidence that real estate increases environmental pollution. Hence, policymakers in Turkey should promote sustainable real estate markets by supporting green investments in the real estate market. In this context, policymakers should support the firms which use and incorporate green energy resources into their investments in real estate sectors. Moreover, to improve the environmental quality, policymakers are required to identify some priorities to reduce the initial costs and efficiency of investments. The policymakers should measure and estimate the exact scale of environmental degradation that is generated by the housing sector. Future empirical studies should be devoted to the investigation of the long-term linkage between different sectors of the economy and the environment using different panel methods.


