1. Introduction
Although energy consumption is a key element of economic development, high energy consumption has caused climate change and greenhouse gas emissions. Thus, countries, including those in the European Union (EU), have based their policies on energy efficiency. In most countries, a significant percentage of the total final energy consumption is related to the residential sector. Although energy consumption in the building sector of Europe has not increased significantly in recent years, 40% of the total energy consumption in Europe, about one-third of the emissions of greenhouse gas, and 36% of the carbon emissions, which all cause climate change, are due to energy consumption in the residential sector (e.g., De- Boeck et al. [
1], Wang et al. [
2], Li et al. [
3], and the European Commission [
4]). Numerous factors affect energy consumption in the residential sector, which has made this sector complex [
5]. So, the residential sector is the main target of many EU energy efficiency policies and an excellent opportunity to decrease energy consumption. Indeed, the residential sector has made the most progress in energy efficiency compared to other sectors. On the other hand, the most economical method of reducing energy consumption in buildings is achieved through energy efficiency measures (e.g., Ramos et al. [
6], Pablo-Romero et al. [
7], and Palma et al. [
5]). Given the impact of the building sector on the environment, the study of energy efficiency in this sector should focus on energy policies.
Southern European countries, such as Portugal, have different economic, cultural, and climatic characteristics than northern European countries. The final energy consumption for cooling and heating in the residential sector is very different in European countries, and southern European buildings are less adaptable to severe climate change than northern European buildings. In addition, there are many concerns about energy efficiency in southern European countries due to the increasing demand for cooling and heating systems [
5]. Therefore, the study of southern European countries can provide different and important results for implementing policies. On the other hand, a case study is necessary to provide policies following the climatic characteristics of each country. In a southern European country (Portugal), the residential sector consumes 18.2% of the total energy consumption [
8].
The Energy Performance Guidelines for buildings are a popular policy initiative proposed by the European Union to address climate change and energy efficiency issues. One of these measures is the directive for using energy performance certificates (EPCs) to analyse the residential sector energy performance (e.g., Abela et al. [
9] and Lee et al. [
10]). The European Commission introduced the EPC building directive in 2002, which required member countries to implement EPC certifications [
11]. The purpose of providing these guidelines is information transparency and reducing asymmetries in the information concerning the energy efficiency of residential units, to achieve the goals of improving energy efficiency and reducing the energy consumption of buildings [
12]. Transparency of information on energy efficiency leads owners of residential units to provide EPC certification to potential buyers and tenants at the time of sale and rent. With EPCs, buyers and tenants can easily access fast, reliable, and accessible information (e.g., Lee et al. [
10], Gouveia and Palma [
13], Dell-Anna et al. [
14], and Franke and Nadler [
15]). Therefore, EPCs evaluate the performance and energy efficiency of the building. In addition, an EPC can encourage people to renovate their buildings to save energy [
3].
Residential property owners are interested in getting higher EPCs because buildings with higher EPCs have higher prices due to higher energy efficiency (e.g., Brounen and Kok [
16], Cajias and Piazolo [
17], Hyland et al. [
18], Fuerst et al. [
19], and Stanley et al. [
20]). On the other hand, according to the European Commission, renovation can save up to 46% of the energy consumption [
4]. Therefore, the EPC rating process encourages the owners to save energy by upgrading their building energy efficiency. It also presents an occasion to train them about energy efficiency and recommends various actions that can quickly improve the energy performance of residential units to owners. With a small investment in energy efficiency, technologies can easily be upgraded to a higher EPC (e.g., Collins and Curtis [
12] and Comerford et al. [
21]). Unfortunately, there is no standard framework for EPC delivery in member countries [
14].
The building energy certification system was implemented in Portugal in 2008, where all new residential buildings were required to have an energy performance certificate [
22]. Moreover, since 2009, it is mandatory in Portugal that all buildings have a valid energy certificate. Therefore, the EPCs became mandatory in the country with Decree-Law no. (118/2013) of 20 August 2013, which follows Directive (2010/31/EU). As a result, Portugal issued 13,799 certificates in 2008, and in 2020 issued 198,090 (see
Figure 1 below).
Indeed, when we address the number of issued energy certificates by energetic class in Portugal, we can see that in 2008 the energy certificate with ratings
B and
B+ were the most issued, with 4164 and 1635 certificates, respectively, while there were issued 141 for rating
C, 75 for rating
D, 14 for rating
E, 4 for rating
F, and 11 for rating
G. In 2014, the energy certificates with a rating of
C and
D were the most issued, with 58,209 and 46,661 certificates, respectively, while there were issued 1893 for rating
A+, 7018 for rating
A, 12,950 for rating
B, 19,171 for rating
B−, 24,379 for rating
E, and 9758 for rating
F. Moreover, in 2020, the energy certificates with ratings of
C and
D were the most issued, with 41,347 and 34,961 certificates, respectively, while there were issued 31,185 for rating
B, 20,155 for rating
B−, 21,720 for rating
E, and 12,933 for rating
F (see
Figure 2 below).
Indeed, the increase in the number of energy certificates with high ratings (e.g.,
A+ A,
B, and
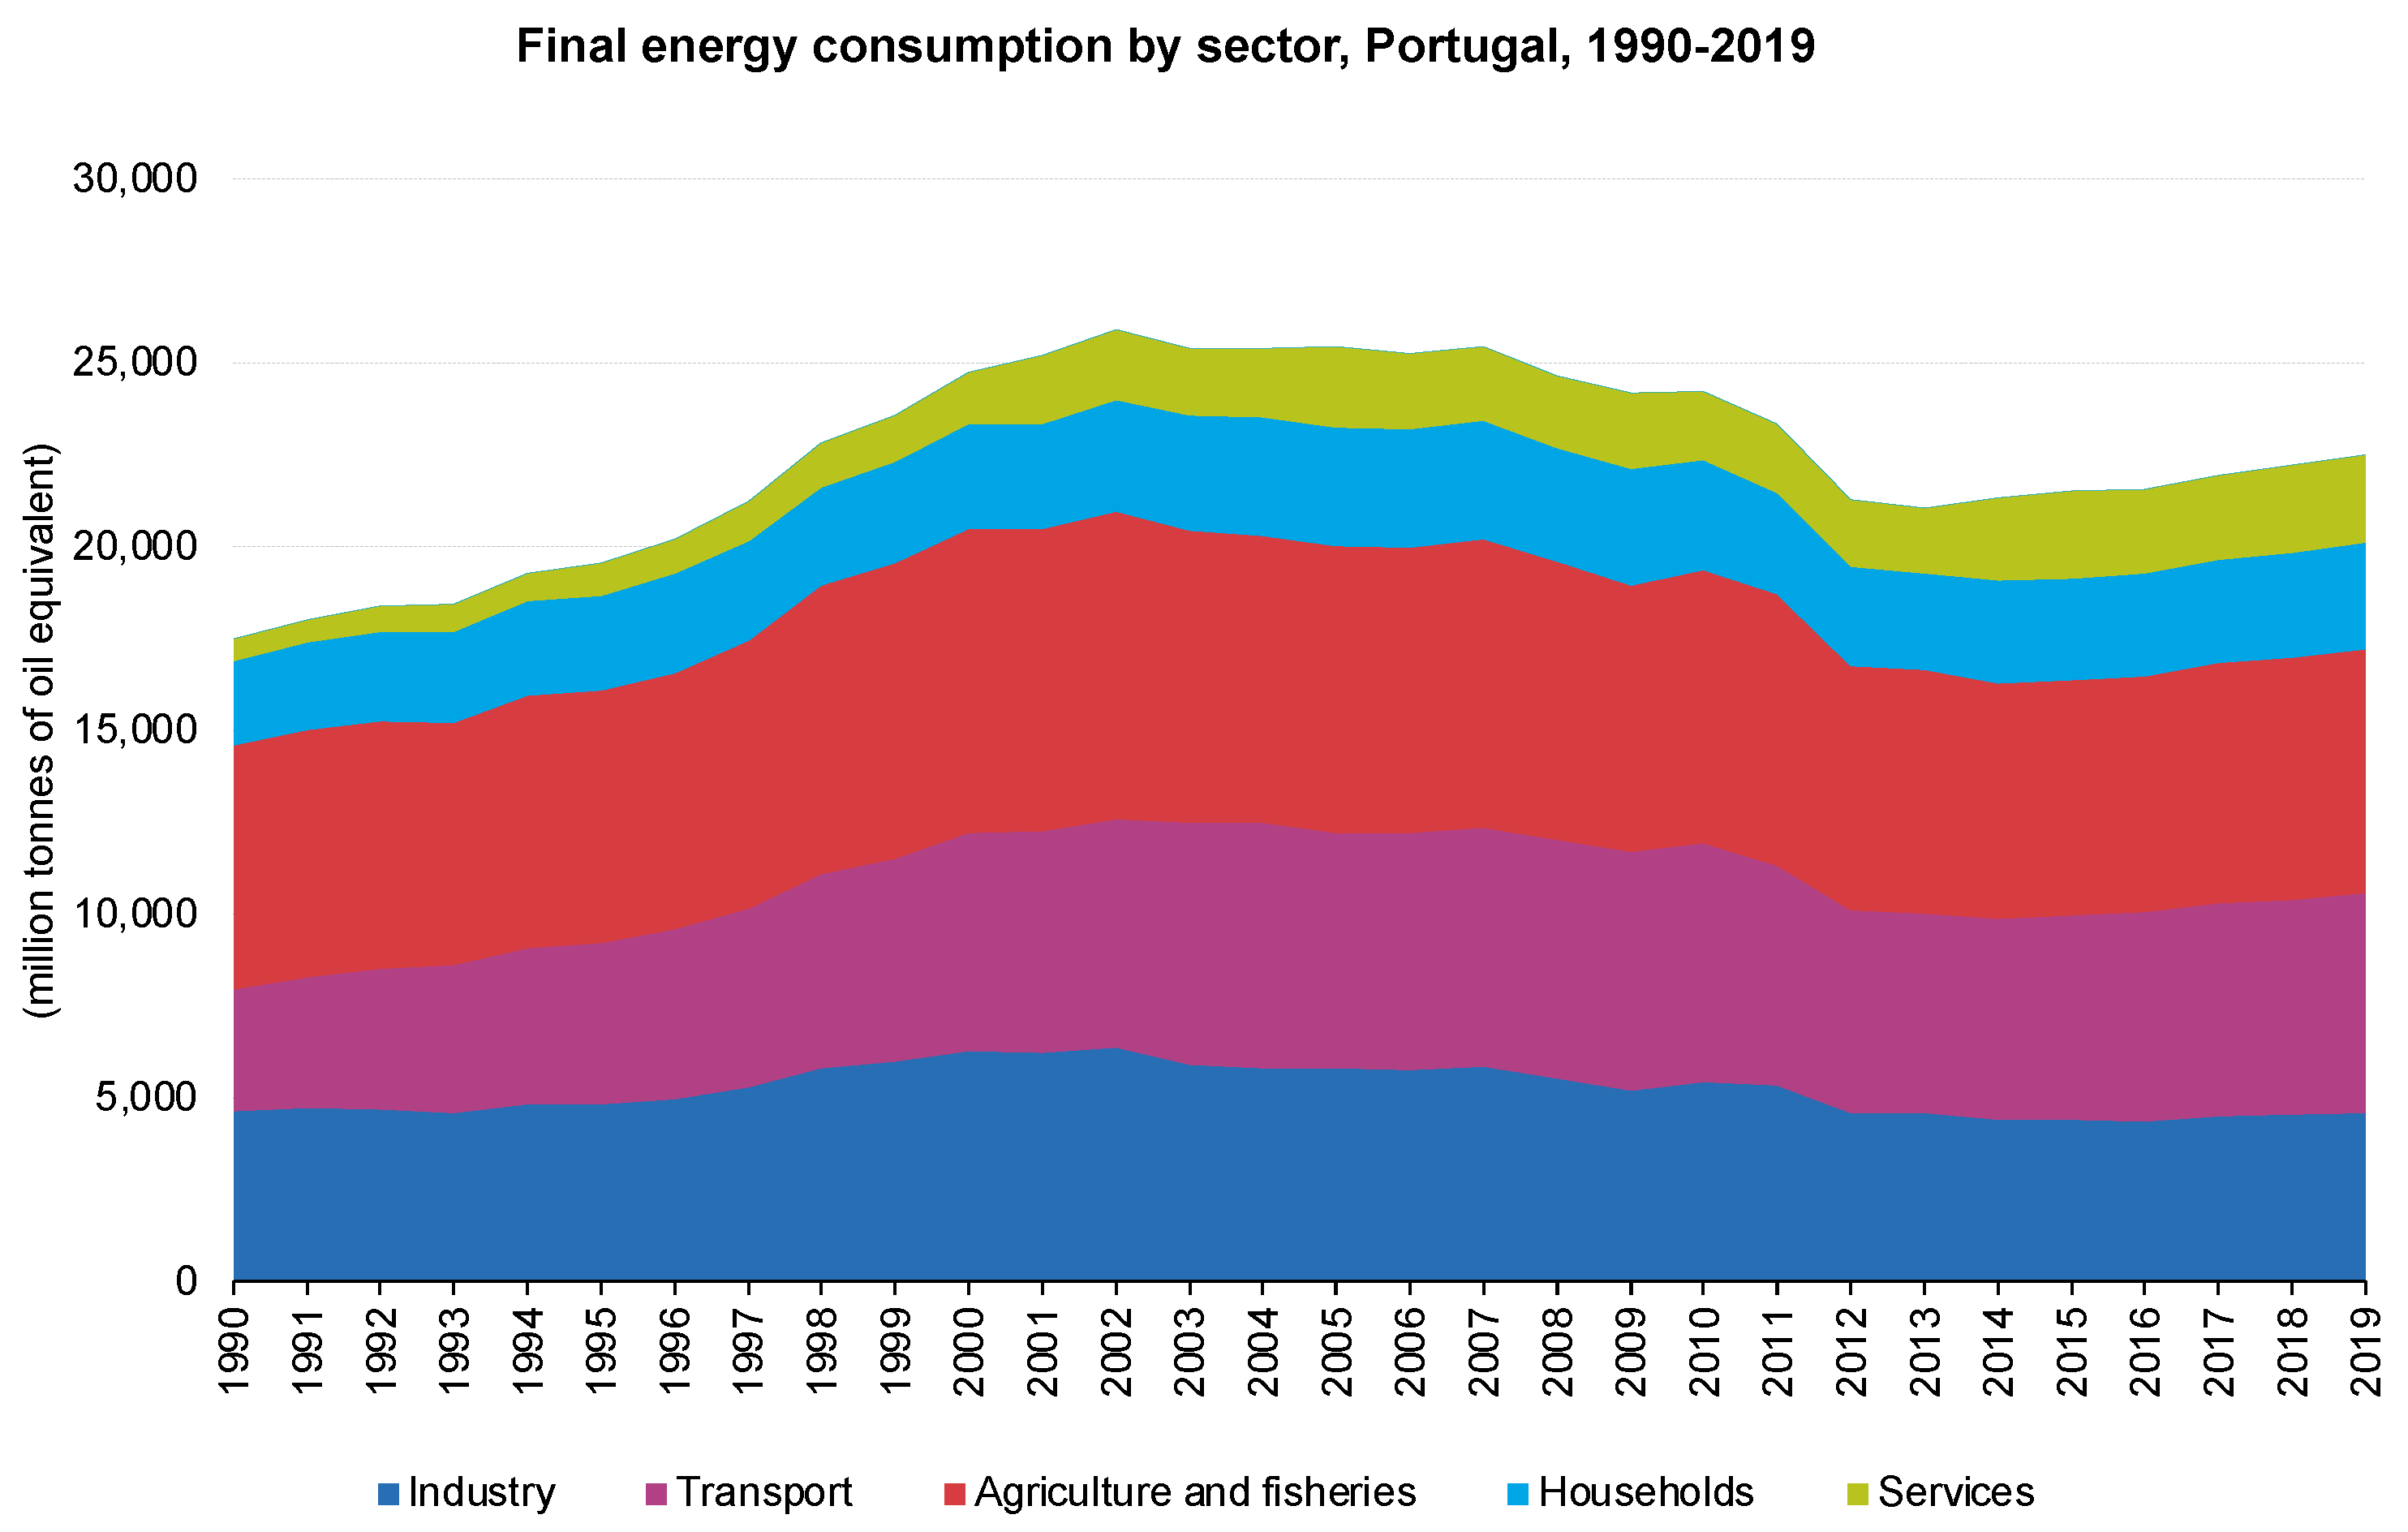
B−) is essential for Portugal to reduce the household energy consumption, where this sector consumed (18.2%) of the total energy consumption in 2019 (see
Figure 3 below).
Moreover, in 1990, the consumption of energy from the household sector was 2301.6 Mtoe, and in 2000 this value reached 2820.9 Mtoe, and in 2019 reached a value of 2891.3 Mtoe. During the period between 1990 and 2019, the consumption of energy from the household sector increased 26% despite the 6.51% drop in 2011, 3.04% drop in 2012, and 2.28% drop in 2013 caused by the financial and economic crisis that occurred in this period (see
Figure 4 below).
Indeed, when we addressed the gross inland energy consumption by fuel in Portugal, we identified that the oil and petroleum products had a 42.6% share in the energetic mix, while for the EU, this value is 34% in 2019. Solid fossil fuels had a share of 11.2%, natural gas 21%, and renewables and biofuels 25.2%, while in the EU, these values are 11.6%, 23.1%, and 15.8%, respectively (see
Figure 5 below).
As shown in the figure above, the fossil fuel energy source share represented 74.8% of the energy mix of Portugal in 2019. For this reason, the adoption of EPCs is essential to reduce energy consumption by households in order to mitigate climate change.
Previous studies have analysed various energy efficiency policies (e.g., energy efficiency labels, standards and codes, financial and credit incentives, information policies, and regulatory standards) in the EU and different countries. Some studies have suggested that financial and credit incentives increase energy efficiency (e.g., Noaily [
26], Filippini et al. [
27], and Trotta et al. [
28]). Financial instruments were introduced in 2017 to support investment in urban rehabilitation and renovation of buildings, insulation, and efficient equipment purchase [
8]. Some studies have shown that regulatory standards and major renovations reduce energy demand [
29]. Broin et al. [
30] argued that information policies increase energy efficiency. Another solution is to achieve higher energy efficiency in the residential sector through building codes [
28].
Despite the rapid release of EPCs and similar tools, no studies are examining the impact of energy efficiency policies on the energy performance of residential properties in Portugal. This study uses energy codes and standards related to buildings, information policies, financial incentives, and residential sector credit as proxies for energy efficiency policies. In addition, the effect of per capita production on buildings’ energy performance was studied. Increasing household per capita income also improves energy efficiency because wealthier households renovate buildings and install heating and cooling systems and air conditioning with better and newer technologies in energy consumption (e.g., Saussay et al. [
31] and Broin et al. [
30]).
A case study to match the specific characteristics of each country can offer different scales of space and time and provide new policies and insights for other countries [
32]. Portugal is a good and interesting case study for several reasons: (1) The level of access to EPC databases varies in different European countries, but the Portuguese database is one of the first databases. (2) Many Portuguese buildings are old and were built before 1990, affecting energy consumption. About 50% of buildings in Portugal need renovation, so some studies have considered the issues and problems related to Portugal’s energy shortage to be related to its residential sector (e.g., Simoes et al. [
33], Gouveia et al. [
32], and Palma et al. [
5]). Portugal was one of the first countries to adopt the EPC guidelines and implement them fully and correctly in its own country. So, consumers in Portugal have much information about EPCs. In addition, Portugal is warmer than northern European countries, which significantly affects consumer preferences for EPC properties. The residential sector’s final energy consumption per capita of Portugal is lower than the European mean, even in countries with comparable climates such as Spain and Italy (e.g., Ramos et al. [
6] and Palma et al. [
5]). Therefore, a case study of Portugal can provide interesting and meaningful results for policymakers.
Most studies of European countries have examined one or two variables of energy efficiency policy. In this study, to complete the previous studies and fill the gap of prior studies, the effect of several energy efficiency policies on energy performance in the residential sector of a southern European country was considered. To our knowledge, our study is the first one that analyses the impact of energy efficiency policies on residential properties’ energy performance in Portugal. This study, therefore, goes a step further and develops an analysis of energy efficiency policies.
According to the above, in this paper, we seek to answer whether energy efficiency policies affect the energy efficiency performance of residential properties/houses in nineteen Portuguese districts from 2014 to 2021. Which energy efficiency policy variables have the most significant effect on energy efficiency in the Portuguese building sector? To answer this question, the main purpose of this study is to investigate the impact of energy efficiency policies on the energy performance of residential properties in Portugal. While the analysis in this article is specific to Portugal, it has far-reaching policy implications. Any success, challenge, or impact of energy efficiency policies on EPCs in a country is a helpful lesson for officials in other European countries similar to Portugal to improve the energy efficiency of residential properties. In addition, the policy implications of this article help direct investment in optimal opportunities to improve Portugal’s energy efficiency. This study also provides insights and helpful information for national and local stakeholders and political decision-makers.
This investigation is divided into six sections.
Section 2 presents the literature review;
Section 3 describes the data and model used in this empirical investigation;
Section 4 shows the empirical results;
Section 5 presents the discussion; and, finally,
Section 6 presents the conclusions and policy implications.
2. Literature Review
This section reviews previous studies on energy efficiency policies in the housing sector. Past studies revealed that different policies had been implemented to increase energy efficiency (e.g., Alberini and Bigano [
34], Aydin and Brounen [
35], Charlier [
36], Dubois and Allacker [
37], Filippini et al. [
27], Lopes et al. [
38], and Ramos et al. [
6]). These policies include, for example, energy performance standards; required labels of energy efficiency for appliances and building standards; fiscal, regulatory, and information policies; tax credits; energy certificates; energy feedback programs; subsidies for renovation; and subsidies for building new houses.
Most studies conducted to review energy efficiency policies in the housing sector have been conducted for a panel of countries. However, some studies have evaluated energy efficiency policies in the housing sector for EU countries. For example, Filippini et al. [
27] explored the impact of energy policy instruments on energy efficiency in the EU housing sector during 1996–2009. In this research, econometric approaches of energy demand modelling and boundary analysis have been used. The empirical analysis revealed that financial incentives and energy performance standards play a crucial part in promoting energy efficiency.
In contrast, the enlightening actions do not affect it. Thonipara et al. [
29] examined the energy efficiency policies of residential buildings in the European Union. The results showed that construction regulations are an effective policy tool to reduce energy consumption in residential buildings. However, the impact of regulatory standards for new buildings and major renovations is only visible over more extended periods. Carbon and energy taxes are effective in improving energy efficiency. Broin et al. [
30] examined the energy efficiency policies of the EU housing sector during the period 1990–2010. The effects of policies have generally been discussed in fiscal, regulatory and information policies. The correlation between real demand decline and the estimated impact of regulatory policies is stronger than the correlation with the implications of fiscal and information policies. Given the energy efficiency market barriers in the residential sector, the results support that the regulatory policy is the main concern in designing successful paths in the direction of the EU’s broader targets for heating energy.
Several other studies that examined a panel of countries evaluated European countries and the Organisation for Economic Co-operation and Development (OECD). Aydin and Brounen [
35] examined the impact of residential energy efficiency policies on household energy consumption across Europe from 1980 to 2016. In this study, electrical and non-electrical energy consumption was examined separately because households usually use these items for different purposes (appliances and heating) and are subject to different energy efficiency policies. They focused on two distinct mandatory energy efficiency labels for household appliances and building standards. It was revealed that home appliances’ strict building regulations and energy labelling requirements reduce residential energy consumption. Bertoldi and Mosconi [
39] studied the impact of energy efficiency policies on energy storage in 29 European countries during 1990–2013. Their results show that in the absence of energy efficiency policies, energy consumption in Europe in 2013 would have been about 12% higher. Finally, Costantini et al. [
40] examined the impact of policies on energy efficiency technologies for the residential sector in 23 OECD countries from 1990 to 2010. Evidence showed that innovation in energy efficiency technologies is driven by both demand policy tools and technological pressure. Most importantly, the evidence presented shows that the simple adding of an uncontrolled number of policy tools simultaneously can reduce the effectiveness of the policy mix.
In other studies, researchers compared the effectiveness of energy efficiency policies between the two countries. Kern et al. [
41] examined policy instruments to stimulate energy efficiency in Finland and the United Kingdom from 2000 to 2014. The results show that both countries increasingly have complex policy mixes that include various goals and tools and use a wide range of different tools to encourage users to reduce their energy consumption. Huang et al. [
42] compared energy-saving policies in the housing sector between Japan and China. Related policies fall into four categories: control and regulatory instruments, economic/market-based instruments, financial and information instruments, and voluntary measures. The effect of the policy analysis showed that energy-saving policies in the housing sector led to energy savings in both Japan and China. Comparing the barriers showed that Japan and China have many barriers, including high transaction costs and a lack of usable methods. Compared to Japan, China suffers from more obstacles, such as inefficient implementation, insufficient information and awareness, and an immature financial regulation system.
In the meantime, several studies on energy efficiency policies have been conducted nationally. Beerepoot and Beerepoot [
43] examined their government’s strict regulations to motivate improvements in energy performance in the Dutch building sector during the period 1996–2003. The results show that energy performance policy in the Netherlands has not helped to disseminate or develop innovations in hot-water technologies. To some extent, it helps to improve the efficiency of conventional hot-water production technologies. Related factors, such as changes in gas prices or housing investment, also have hardly impacted incremental or new energy consumption in the Dutch residential building. Boonekamp [
44] examined the results of the Netherlands household energy efficiency policies from 1990 to 2003. The author also deals with the quantitative analysis of the interactions between three main measures: (i) the regulatory energy tax; (ii) investment subsidies; and (iii) gas regulation used to heat the place. The results showed that combining two or three policies is 13–30% less effective than all the effects of individual measures. In another study for the Netherlands, Murphy [
45] used policy tools to improve the energy efficiency in private homes. The results showed that the current tools to create a long-run energy-saving plan for present homes are weak. In addition, most tools appear and disappear over short periods and cannot form a coherent and integrated strategy that continuously targets existing dwellings.
Yu et al. [
46], in a study considering the Global Change Evaluation Model, examined the growth in the building sector and the impact of building energy policies in Gujarat (India). The results show that without developing energy incentive policies, the energy consumption could strongly increase in commercial and residential buildings from 2010 to 2050 in Gujarat. Indeed, realising the Energy Saving Building Law can increase energy efficiency in commercial buildings and reduce building electricity consumption in Gujarat by 20% by 2050. Contrasted to the no-policy scenario, having energy codes for commercial and residential buildings can save 10% electricity consumption. Alberini and Bigano [
34] examined the motivations for promoting residential energy in Italy. The study used data collected from 3000 Italian landlords between May and June 2013. The results showed that non-monetary incentives have little effect on increasing energy efficiency and monetary incentives are generally not cost-effective, even under the optimistic assumptions contained in Italy’s tax credit program. Li and Shui [
47] conducted a comprehensive analysis of building energy efficiency policies concerning improving energy performance, the standard of living, and mitigating climate change in China. The results showed that the analysis emphasises the importance of ensuring policy compliance within the current regulatory framework to maximise the effectiveness of energy efficiency policies in the Chinese-made environment. Kamal et al. [
48] researched the energy efficiency policies’ roles in the housing sector in Qatar using the system dynamic method. Seven energy efficiency policy measures based on renovation and new constructions were evaluated for these buildings to see their effects on electricity consumption. The results showed that building energy-intensive facilities and renovating old buildings every ten years could save more than 4700 gigawatt-hours of electricity by 2050.
Ramos et al. [
6] review the empirical evidence focusing on energy certifications, feedback programs, and energy audits. As the findings revealed, the energy certifications and feedback programs could be successful. Nevertheless, this only will occur if they are carefully designed. In contrast, the evidence supports that the effectiveness of energy audits is mixed. Charlier [
36] examined the impact of tax credits and energy burdens on the energy efficiency costs of the residential sector. Due to the complexity of studying decision-making to invest in energy-saving renovations, a two-variable Tobit model was used to compare decisions about energy-saving. The findings confirmed that tax credits were unsuccessful in distributing incentives. Therefore, the government public policy should focus on low-income residents. Finally, Dubois and Allacker [
37] evaluated the efficacy of three economic instruments to increase energy efficiency in the housing sector: (i) reconstruction subsidies; (ii) demolition and reconstruction project subsidies; and (iii) the construction of new housing subsidies. The results show that renovation subsidies, with low energy gains, worsen the overall housing energy consumption due to inefficient energy homes. Therefore, the use of policy tools requires structural changes.
Pasichnyi et al. [
49] analysed the data quality assurance method for energy performance certificates (EPCs). The analysis showed that EPC data could be improved by adding or revising the EPC features and ensuring the interoperability of the EPC dataset. Shen et al. [
50] researched the current development of policy instruments to promote energy efficiency (compulsory enforcement instruments, economic incentives, and voluntary design instruments) (BEE) by examining their performance in seven selected countries and regions. The results showed that different countries had made good progress in building energy efficiency by adopting different policy instruments. Boza-Kiss et al. [
51] stated that while specific instruments such as product standards and labels can achieve the greatest energy savings, in terms of cost-effectiveness, it is not possible to prioritise the policy instruments under consideration. McCormick and Neij [
52] collected policy instruments for energy efficiency in buildings in Nordic countries. This study focuses on policy instruments, including building codes, subsidies, labels and flyers, information campaigns, and taxes.
Trotta et al. [
28] had identified policy instruments and private initiatives in five European countries (Finland, Hungary, Italy, Spain, and the United Kingdom). The results show that the British government has implemented better policies with private sector initiatives to improve energy efficiency. However, Finland’s scarcity of effective and directed policies has raised energy consumption. In Hungary, Italy, and Spain, interesting initiatives were found (for example, financial incentives). Nair et al. [
53] analysed the factors affecting the energy efficiency investment in the Swedish construction sector. The findings showed that personal characteristics, for instance, income, education, house age, thermal discomfort, past investment, and perceived energy cost, affect the homeowners’ preference for a particular energy efficiency measure. Amstalden et al. [
54] examined the effects of policy instruments on energy efficiency in the Swiss residential sector. The findings indicated that Swiss policy instruments drive investments to increase energy efficiency.
Houde and Aldy [
55] examine the increasing impact of energy subsidies on the presence of policy expression in the United States. The results showed that, in general, the impact of this subsidy program on long-term energy demand is probably negligible. Tambach et al. [
56] examined Dutch energy policy instruments for the building sector. The results show that although Dutch energy policy instruments for present housing appear to meet local executive demands largely, complementary policy instruments are required to encourage and pressure the current modernisation regime. Lindén et al. [
57] stated that policy instruments had enhanced the energy efficiency behaviour in Sweden, namely, extensive information campaigns during the oil crisis of the 1970s and the labelling of household energy. Finally, Murphy et al. [
58] reviewed policy instruments to improve energy performance in the Dutch construction sector. The results indicated that the existing instruments are not outfitted to create a long-run energy-saving plan for current homes.
As can be seen, although previous studies have used variables, methods, countries, regions, and time series to explain the impact of energy efficiency policies on energy performance in the housing sector, gaps in the literature have been found and need to be filled. This study’s energy efficiency policy variables include standard energy policies and codes, financial incentives, and information policies. Given that in most previous studies only one or two of these policies have been used to examine the impact of energy efficiency policies, extensive use of the number of policies to explore their effect is one of the main innovations of this study. On the other hand, there is no research on the impact of energy efficiency policies on energy performance in the household sector in Portugal. The research that has been done so far, with the exclusion of Portugal, was mainly based on the European Union, OECD, India, and China. The following section presents the data and methods used in this research.
4. Empirical Results
As mentioned before, this section will focus on the empirical results of our investigation. In other words, the preliminary tests, main model regression, post estimation tests, and robustness check. The first step before the model regression is the realisation of the preliminary tests, such as (i) the normal distribution tests (e.g., skewness/kurtosis test and Shapiro-Wilk test); (ii) VIF test; (iii) Unit root test; and (iv) Hausman test.
Therefore, to test the presence of normality in the variables, the normality of distribution was tested with the skewness/kurtosis test—first separately and then combined, and with the Shapiro–Wilk test (see
Table 4 below). The Stata commands
sktest and
swilk were used to perform the normal distribution tests.
Table 4 above shows that the data is slightly positively skewed (
1 > 0) and with a lighter tail (β
2 < 3); that is, in the direction of a higher-rated housing certificate or more policies and with fewer extreme values. For
LogA and
LogCCPC, the distributions of the scores were more highly skewed. The D’Agostino et al. [
66] skewness/kurtosis test allows us to reject the null hypothesis of a normal distribution of the data. Furthermore, when testing normality with the Shapiro–Wilk test, the returned values suggest the null of normal distribution for
LogA+,
LogB−,
LogC,
LogD,
LogE,
LogFFIPA, and
LogCCPC can be rejected; the other variables are normally distributed in the model. Therefore, the data are not normally distributed in the model. After realising the normality distribution tests, it was necessary to assess multicollinearity between the model’s variables. To this end, the variance inflation factor (VIF) test was realised (see
Table 5 below). The Stata command
vif was used to perform the VIF test.
The results from
Table 5 point that the variance inflation factor is in the range of 1.0 to 10, signifying a relatively high but tolerable collinearity among the predictor variables in the regression [
63]. The repeated VIF value shows that the income and policy variables are repeated for each cross, as the policies are determined at the national level. After identifying high multicollinearity between the variables, it was time to identify the unit roots. The first-generation LLC panel unit root was computed to achieve this objective (see
Table 6 below). The Stata command
xtunitroot llc was used to perform the unit root test.
In
Table 6, the first-generation test for the unit roots developed by Levin, Lin, and Chu [
59] is displayed. They show that most panels are stationary; that is, I(0). In turn, some panels (
LogFFIPA,
LogIPCC, and
LogCCPC) are near-stationary; that is, on the boundary between the I(0) and I (1) order of integration. The stationarity of the variables is due to low temporal variation in the variables, leading to random effects. Therefore, the next step of this investigation is to search for individual effects. To this end, the Hausman test, which compares the random (RE) and fixed effects (FE), was computed (see
Table 7 below). The Stata command
hausman was used to perform the Hausman test.
According to Koengkan et al. [
62], when the data fails to meet the asymptotic assumptions of the Hausman test, the results of the Hausman test contrast with the use of the RE or FE models (see
Table 7); it can be concluded that the RE model is present. According to the same authors, when this occurs, it is an indication of the non-systematic difference in coefficients.
The second step after the preliminary tests is the realisation of the random-effects linear regression model.
Table 8 below show the outcomes of the linear RE model. The Stata command
xtreg with the option
re robust was used to perform the linear random-effects model regressions.
The random-effects linear regression analysis (see
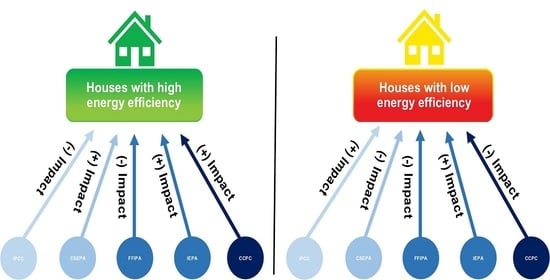
Table 8 above) shows that most policies have a significant, differentiated effect on residential energy efficiency choice. For example, the variable
LogIPCC impacts negatively the residential properties with higher energy efficiency; that is, with high energy efficiency performance certificates (e.g.,
A+,
A, and
B). It supports that Portuguese personal income is low and prevents the investment in residential properties with high energy efficiency, making consumers prone to prefer the least expensive, lower-efficiency residential properties; that is, with low energy efficiency performance certificates (e.g.,
C,
D, and
E).
Regarding the energy policy effect on the choice of energy efficiency of the residential properties, results are not uniform. Consumer credit (LogCCPC) positively impact higher-efficiency residential property and negatively impact lower-grade certificates. Consumers may decide to use credit for higher-efficiency housing when facing a budget constraint. For fiscal policies (LogFFIPA), the impact is also positive for the higher-grade certified residential property (e.g., A+, A, B, and B−) and negative for the lower-efficiency residential property (e.g., C and D). Taken together, this may suggest that consumers are encouraged to take on credit because of fiscal policies—a tax reduction in the interest rates—for purchases of higher-efficiency housing. These differentiating effects of personal income, credit, and fiscal policies on residential energy efficiency suggest that incentives are narrowly targeted to higher energy-efficient homes. Indeed, they effectively incentivise higher-efficiency housing purchases, thus leading to greater differentiation in the residential sector concerning energy efficiency.
It should be noted that the effects of consumer credit and fiscal policies in the F category do not follow the general tendency described above. Regarding income per capita, the negative impact shows that consumers tend to not choose the lowest-efficiency residential property as income rises. However, fiscal and credit policies have positive effects, suggesting that consumers use credit with comparatively higher interest rates. Codes and standards policies (LogCSEPA) are significant and positive for higher-grade efficiency residential property (e.g., A, B, B−, and C). They are negative for lower-efficiency housing (e.g., D, E, and F) but insignificant for A+ housing, suggesting that these policies cannot incentivise the choice for the highest-efficiency residential property. Information and education policies (LogIEPA) positively affect most energy efficiency category housing, with the greatest impact on higher-grade housing (e.g., A+, A, and B). The exception for grade B− housing, for which information policies and personal income are insignificant, may signify consumers choose average energy efficiency residential property without policy incentives.
After the linear random-effects model regression, it was required to realise the post-estimation tests; that is, in this investigation, the following tests will be computed: (i) Wooldridge’s test; (ii) Breusch and Pagan LM test; and (iii) Pesaran’s test.
Table 9 below points to the results of the post-estimation tests. The Stata commands xtserial, xttest0, xtcsd, and pesaran abs were used to perform the post-estimation tests for the linear random-effects of the models.
Table 9 reveals several diagnostic tests. The Breusch and Pagan LM test [
71] rejects homoscedasticity, supporting that the random-effects model is preferable compared to the OLS one. Woolridge’s [
70] test found diverse results for panel autocorrelation. Autocorrelation was found in the energy efficiency certificates for the grades
A+,
A,
B,
B− and
D, but not in certificate grades
C,
E, and
F. Pesaran’s [
72] test for residuals reveals cross-sectional dependence for the energy EPC of grades
B−,
C,
E, and
F. In contrast, the energy EPC of
A,
B, and
D shows cross-sectional independence.
Figure 8 below reviews the independent variables’ impact on the dependent ones. Therefore, this figure was created with the results from
Table 8 above.
5. Discussions
Discussing our main results, we can see that energy policies indeed play a meaningful role in promoting the energy performance of residential properties in Portugal.
Talking about the codes and standards policies (
LogCSEPA) and information and education policies (
LogIEPA), since 1 January 2009, all residential buildings in Portugal must have an energy certificate [
22]. Following Fragoso and Baptista [
73], excluding the information campaigns that were conducted “to provide a better understanding to the building owner of the building features that can be improved when considering the potential energy reduction or achieving costs savings”, an energy certificate is, undoubtedly, a central source of information. Indeed, it is a friendly and user-oriented document. Beyond the evaluation of the energy efficiency of a property, it also provides owners with information on the measures that will enable a reduction in energy consumption, a comfort improvement, cost reduction, and an increase in the property valuation. It is also important to stress that, in the real estate market, any advertisement of buildings or apartments needs to present the energy label of the building since December 2013 [
73]. In addition to the previous information, the creation of programs such as “CINERGIA—Energy Information Centre” and the ADENE (Portuguese Energy Agency) initiative, under the “Portugal Energia” (Portugal Energy) measure of the SIMPLEX+2017 program, was also crucial to the increase in energy literacy in the Portuguese society [
73].
All these factors may lead to an enhanced awareness of the owners on the advantages of increased building energy efficiency, leading them to take the necessary measures to turn their properties into high-grade housings (
A+,
A, and
B). Indeed, following the data from the Portuguese Energy Agency (ADENE), in 2014, only 1828 certificates for residential houses were
A+, 6135 were
A, and 9337 were
B, which contrasts with 2021, where 3370 of the issued certificates were
A+, 12,472 were
A, and 10,050 were
B [
59].
According to “The Energy Efficiency Watch Survey Report 2020” [
74], Portugal’s progress in energy efficiency policies has been significant. Experts recognise the valuable progress made in promoting energy efficiency in this report. Indeed, in industry, transport, and buildings, with energy labelling of products, energy efficiency requirements for buildings, and energy certification of buildings being pointed as the most effective specific policy measures.
However, the models’ results reveal strong restraints limiting the Portuguese investment in highly energy-efficient housing. Indeed, Portugal has a household income that can be considered low [
75]. Therefore, the policy has been used to lessen the budget constraints of Portuguese households. Indeed, to support energy efficiency projects, the execution of fiscal and financial incentive policies (LogFFIPA) is of major relevance. “The Energy Efficiency Watch Survey Report 2020” [
74] already referred to the ineffectiveness of Portuguese policies.
Furthermore, many experts (46%) consider financial incentives ineffective [
62] in promoting investments energetically efficient. Consequently, it is far from unexpected that the effect of consumer credit (LogCCPC) is of higher magnitude than the one from fiscal and financial incentive policies (LogFFIPA). Therefore, one can consider that, in the absence of appropriate fiscal and financial incentives, households will recur to credit to materialise their projects to achieve energy efficiency in their houses.
Nevertheless, the Portuguese government seems to recognise that failure. To deal with the goals of “Plano Nacional Energia e Clima 2030” (National Energy and Climate Plan 2030), the “Programa de Apoio Edifícios mais Sustentáveis” (More Sustainable Buildings Support Program) was created by the Portuguese government. It was assigned 4.5 million euros in 2020/2021 to implement the first phase. This first phase intended to establish procedures and actions to boost (i) rehabilitation; (ii) decarbonisation; (iii) energy efficiency; (iv) water efficiency; and (v) buildings’ circular economy. Indeed, the initial endowment of 4.5 million euros was soon exhausted, requiring the addition of 5 million euros. Furthermore, the Portuguese government publicised the program’s second phase, “Plano de Recuperação e Resiliência” (Recovery and Resilience Plan), in the summer of 2021. This phase incentivises projects to improve the energy sustainability of houses. Consequently, the government is supporting this investment with a further 30 million euros.
6. Conclusions and Policy Implications
This article addressed the impact of energy efficiency policies on EPCs for residential properties, identifying whether energy policies effectively promote the residential properties’ energy efficiency in Portugal. It is essential to highlight that the characteristics of buildings are fundamental in determining the energy needs and identifying possible ways to enhance energy efficiency.
The increase in energy consumption is a consequence of the development of societies. However, this increase can be significantly reduced through responsible use of energy. The residential sector is one of the biggest energy consumers in Portugal. Energy consumption in habitations depends on several factors, such as construction quality, location, insulation level, and equipment types.
Buildings are responsible for considerable environmental impacts throughout their life cycle, as they cause the occupation and use of land and changes in local ecosystems. When applied to residential buildings, energy certification allows future owners to know the energy performance of habitation even before its purchase and use. In this way, the importance of builders using more efficient construction solutions and equipment, from an energy point of view, is highlighted.
Energy inefficiency is caused by excessive energy consumption in the habitations. Several factors contribute to excessive consumption, such as thermal comfort, the number of equipment used and its energy efficiency, the local climatic conditions, and the economic conditions of the families.
The findings of this article can support policymakers in choosing measures with the most significant potential for implementation in the housing sector and which may be the target of public and private support and financing for the improvement and development of Portugal’s housing park. It is important to promote sustainable energy consumption based on renewable energy sources, adopting public policies to promote energy efficiency together with environmentally conscious decisions. Thus, it is necessary to implement changes in the design phase of buildings and their use phase, studying their energy performance and improvement strategies to realise sustainable construction.
Portugal is taking several measures to make its economy more efficient and sustainable, following the guidelines of European policies regarding the energy performance of residential housing. Among the measures are (i) to support and promote policies to encourage energy efficiency and the rehabilitation of energy-efficient residential buildings; (ii) encourage the promotion of smart technologies; (iii) decrease energy consumption; (iv) reduce the emissions of greenhouse gas; (v) increase energy efficiency with the use of renewable energy sources; (vi) reduce energy consumption needs and energy dependence; and (vii) promote financial mechanisms and incentives to encourage the construction of energy-efficient real estate parks.
Energy efficiency policies for residential properties in Portugal contribute to sustainable growth and an efficient economy in terms of resources and reducing greenhouse gas emissions. In addition, the public sector can create new markets for energy-efficient technologies, services, and business models. On the economic front, it is necessary to optimise investments in promoting energy efficiency in the housing sector. Increased public sector credit and subsidy policies reduce the financing costs, encouraging development and investment in renewable energy technologies and energy efficiency. In addition, it is necessary to develop strategic planning to direct resources and investments, thereby establishing policies and goals to promote energy efficiency. On the social front, it is essential to learn to use energy responsibly and raise awareness among users to improve the present and ensure a better future for future generations.
Furthermore, it is crucial to adopt the best practices and small actions to save energy. On the environmental front, it is recommended to apply renewable energy to construct and improve residential properties, such as photovoltaic solar panels. Therefore, it is crucial to supply the maximum energy from renewable energies to prevent and mitigate environmental impacts from energy production. The application of renewable energies is essential for increasing energy efficiency and ensuring sustainability.
Finally, the finds of this investigation may lead us to develop future investigations, such as the effect of energy efficiency certificates on transaction prices and rents. As we already know, the environmental and energy labelling schemes make visible in the market a dimension of a product that is not easily visible, in this case, energy performance. Therefore, in the absence of information from sellers regarding the energy performance of a property, the added value of a well-insulated building would not be reflected in the transaction price or rent. It may, in turn, dissuade owners from making energy-saving improvements—especially if they are planning to rent their property or sell it in the short term. Therefore, it is essential to understand how these energy certificates affect the transaction prices and rents in Portugal to develop public policies that mitigate possible imbalances in the housing market and increase the access to residential properties with high energy efficiency by low-income families.


 ,
, 


