Abstract
Environmental meteorological parameters (temperature, humidity, air pressure, etc.) have an important impact on short gap streamer discharge. Based on the streamer theory and particle continuity equation of gas discharge, a short gap streamer discharge simulation model is established, and the influence of environmental parameters on the dynamic development process of streamer discharge is simulated and analyzed. The short gap air gap discharge characteristics were tested in a self-made gas discharge chamber. The results show that at low humidity (relative humidity <80%), with the increase of humidity, the electron density of the streamer channel increases, the field strength of the streamer head increases, the streamer development speed speeds up, and the gap breakdown voltage decrease; At higher humidity (relative humidity >80%), with the increase of humidity, the electron density of the streamer channel decreases, the field strength of the streamer head decreases, the development speed of the streamer slows down, and the gap breakdown voltage increase. With a decrease of gas pressure, the electron density of the streamer channel decreases, the field strength of the streamer head decreases, the development speed of the streamer increases, and the gap breakdown voltage decreases; The temperature change has little effect on the streamer development process.
1. Introduction
The air gap structure of power transmission and transformation projects is mainly determined by the discharge characteristics of the air gap. Studying the discharge characteristics of air gaps, especially long air gaps, is of great significance for UHV transmission and compact transmission [1,2]. As the pilot of air gaps and the initial stage of breakdown, the propagation of streamers has an important impact on gap breakdown, so the propagation characteristics of streamers have attracted more and more attention [3,4]. The development of air gap discharge and streamers will be affected not only by the electrode structure [1] but also by the atmospheric environment, such as air pressure, humidity, and temperature [2]. Many scholars at home and abroad have carried out a lot of numerical analysis and experimental research in this direction.
In terms of low-pressure research, Tsinghua University has conducted two-dimensional simulation of the dynamic characteristics of streamer propagation at low pressure by establishing a fluid model considering photoionization factors and obtained the effect of pressure on streamer propagation field strength and average propagation speed [5]. Based on the construction needs of ultra/ultra-high voltage transmission lines and Qinghai Tibet Railway in the western region, China Electric Power Research Institute and Chongqing University have carried out research on air gap discharge characteristics at an altitude of more than 4 km and given the corresponding altitude correction formula [6,7,8]. F. O. Dmitry of the University of Maryland first explored the use of streamer discharge with a 40 mm gap under a low pressure gradient to simulate red flash discharge in the range of 30–50 km above sea level [9]. Okubo and Homma of Nagoya University in Japan have studied the AC and DC short gap flashover characteristics along the dielectric surface and the short gap insulation characteristics of a vacuum circuit breaker under low pressure. The experimental vacuum degree is 10-5 Pa, and the discharge gap is less than 10 cm [10,11]. E. M. Bazelyan of Moscow Institute of Electric Power Engineering carried out a streamer discharge experiment of 45.6 cm at 30 kPa. The results show that reducing the air pressure has no obvious effect on streamer development speed [12]. S. Pancheshnyi of ABB has conducted in-depth research on streamer propagation characteristics in the pressure range of 40–100 kPa and concluded that, with a decrease of air pressure, the field strength of the streamer head is basically constant, and the electron density of the head decreases by about an order of magnitude [13].
In terms of temperature and humidity research, these are representative: Dhali and Williams simulated the development process of nitrogen-positive flow in parallel plates [14]; Vitello simulated the development process of the negative flow of nitrogen in parallel plates [15]; Morrow and lowke simulated the development process of positive streamers in air [16]. For a uniform or slightly non-uniform field, air humidity has little effect on gap breakdown voltage [17]; for an extremely uneven field, most scholars believe that, under the influence of the electronegativity of water, the breakdown voltage increases slightly with the increase of humidity [18,19]. However, this is not entirely the case. Under some electrode structures, the breakdown voltage decreases with the increase of humidity [20,21]. Humidity has a significant effect on the discharge characteristics of an air gap under a non-uniform electric field, but there is no consistent conclusion about its influence law. Researchers at home and abroad have proposed corresponding humidity correction methods, curves and formulas [22,23] for the influence of humidity on air gap breakdown characteristics, and some have been accepted by the IEC standard [24] and by China’s national standard [25].
Based on the streamer theory and particle continuity equation of gas discharge, a short gap streamer discharge simulation model is established, and the influence of environmental parameters on the dynamic development process of streamer discharge is simulated and analyzed. The discharge characteristics of a short gap air gap under the influence of different meteorological parameters were experimentally studied in a self-made gas discharge chamber. Combined with the simulation and experimental results, the short gap air discharge mechanism under different atmospheric parameters is analyzed. The research results can provide technical reference for practical engineering application.
2. Simulation Model of Air Streamer Discharge
2.1. Mathematical Model of Streamer Discharge
Streamer discharge is the initial stage of gap breakdown discharge, which will directly affect the breakdown characteristics of a gap. Therefore, it is necessary to study streamer discharge before testing breakdown characteristics. Microscopically, air gap streamer discharge mainly includes molecular ionization, recombination between electron positive ions and positive negative ions, electron molecular attachment, particle migration, and diffusion processes, which can be characterized by the particle balance equation [26], and photoionization is one of the equations. The fluid model consists of the continuity equation of charged particles coupled with the Poisson equation:
where ne is the electron number density; unit m−3; μe is electron mobility; De is the electron diffusion coefficient; E is the electric field strength; α is the collision ionization coefficient, η is the electron adhesion coefficient; βep is the electron positive ion recombination coefficient, and βnp is the positive ion negative ion recombination coefficient. The electron positive ion recombination coefficient in air is close to the positive ion negative ion recombination coefficient. In order to simplify the calculation, βep = βnp is set in this model. Where φ is the potential, εr and ε0 are the relative dielectric constant and vacuum dielectric constant respectively, in this paper, ε0 = 8.854187817 × 10⁻¹² F/m, εr = 10.
2.2. Selection of Discharge Parameters
According to literature [16], the selection of discharge parameters of dry air is shown in Table 1.

Table 1.
Dry air discharge parameters.
According to document [27], the ionization coefficient and adhesion coefficient of wet air are:
where H is the relative humidity; Pw is the saturated water vapor pressure, and αs and ηs are the ionization coefficient and adhesion coefficient of water molecules, respectively.
2.3. Mesh Generation and Solution Method
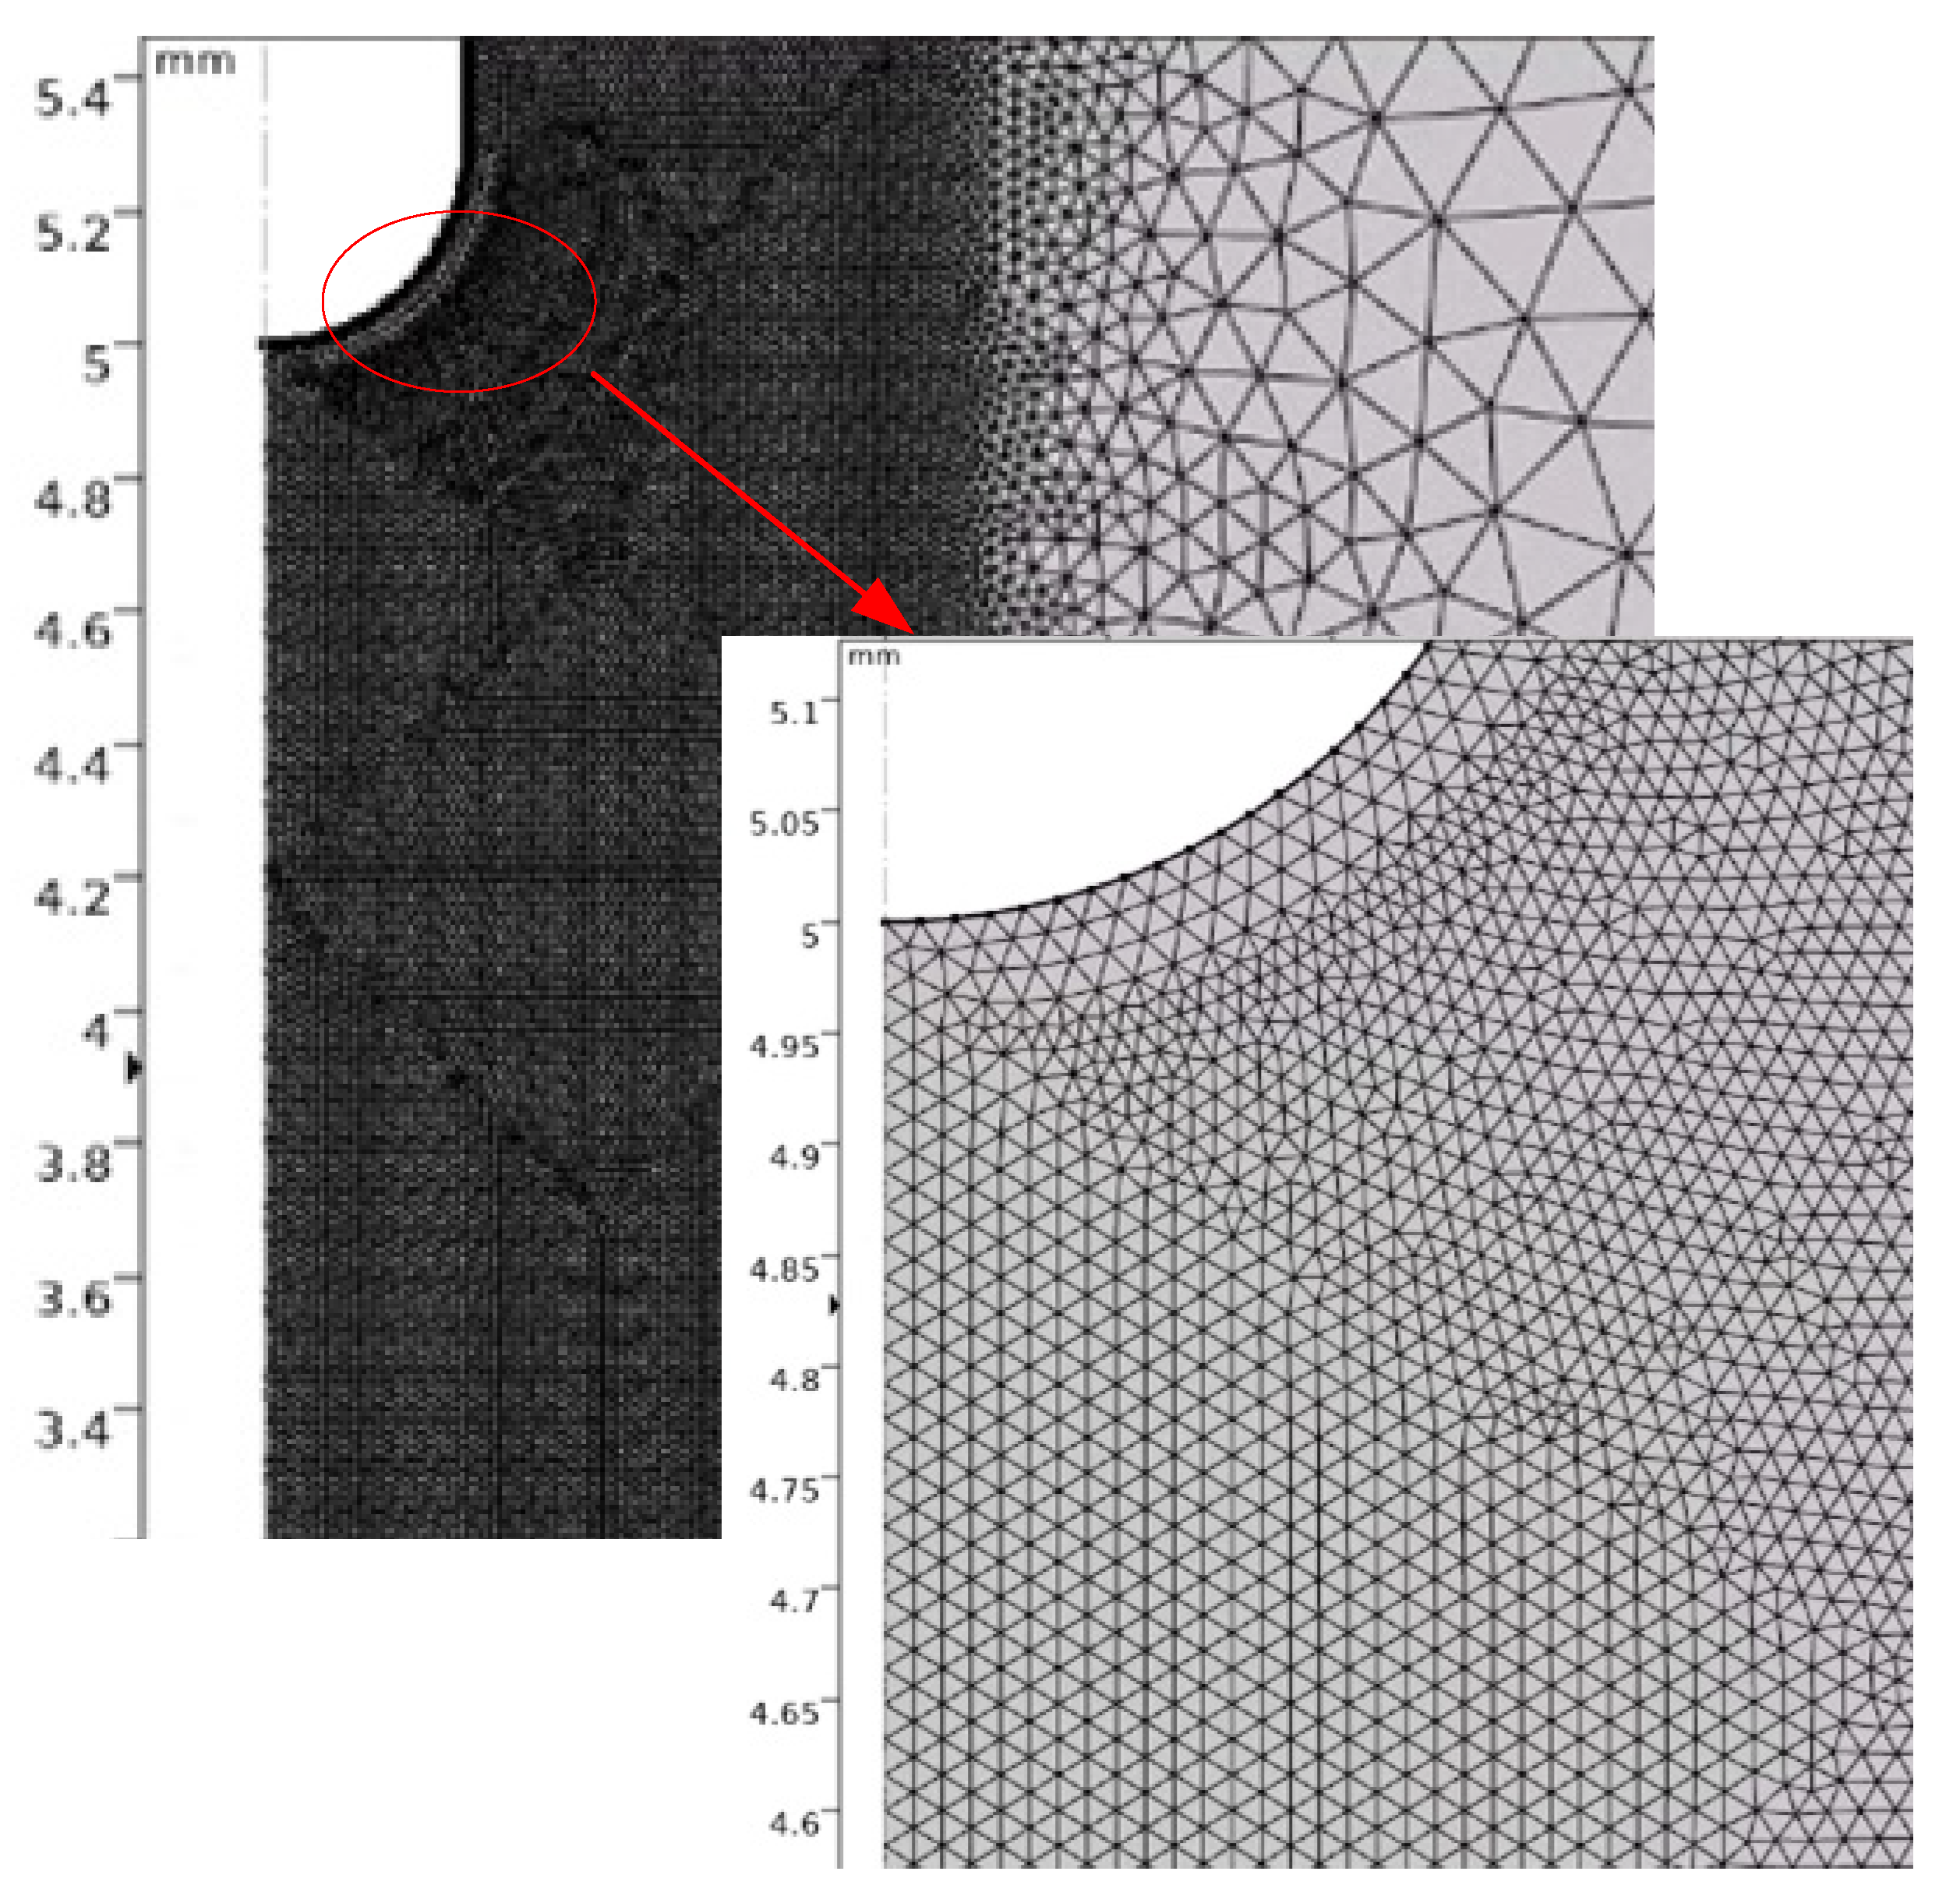
The simulation model in this paper assumes that the streamer channel is cylindrical, and the behavior of particles in the electric field during discharge basically occurs in the area near the axis below the rod electrode, while the interaction of particles in the air area far away from the rod electrode is not intense, and there is the phenomenon of uneven fluid distribution. Therefore, when meshing, it is best to use different sizes of meshes in different parts of the structure, that is, the mesh density is set, which is very helpful in accurately calculating the particle concentration, maintaining considerable accuracy, and reducing the number of meshes. After several trial calculations, the free triangulation mesh is selected; the rectangular area under the rod electrode is densified, and the mesh of other solution domains is refined. The final mesh division is shown in Figure 1.
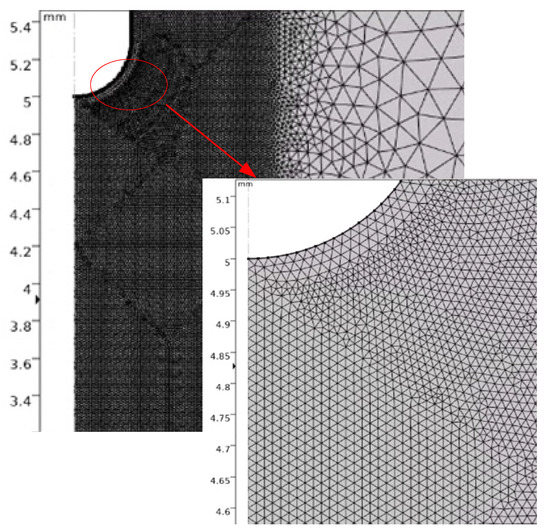
Figure 1.
Partial mesh.
The solution of the equation adopts the time-domain finite element method in space. Compared with the finite difference method, this method is more flexible. A simple triangular element can not only fit the field better but also realize non-uniform subdivision and save calculation time.
In time, the partial derivative of time is approximately expressed by difference. Due to the huge amount of calculation of implicit and semi-implicit difference, the explicit difference method is adopted:
where N is the particle density; n is the number of time steps; S(N) represents the right items in the original Equations (1)–(3). Discretization in time and space will introduce errors. For example, in time discretization, is used to approximate , but in fact, that is, more than second-order terms are ignored in the calculation. In spatial discretization, the spatial discretization effect of the finite element method is equivalent to the central difference of finite difference, which is of second-order accuracy and introduces a truncation error.
The particle balance equation is a convection diffusion equation dominated by convection, and its solution changes sharply in space. Truncation error will bring very serious numerical diffusion and dispersion problems to this kind of equation. For such problems, the FCT method is very effective in dealing with the hydrodynamic problems dominated by convection, so this method is adopted in this paper [28].
The solution steps of streamer simulation are as follows: (1) assuming that the particle density at time t is known, (2) the spatial electric field distribution at this time is solved by Poisson equation; (3) the parameters in Equations (1)–(3) are updated from the electric field distribution, such as α, η, βep, βnp, etc.; (4) the particle balance Equations (1)–(3) are solved, and the spatial particle distribution at t + 1 time is calculated.
In order to ensure the calculation accuracy, the characteristic length and time step of mesh generation need to take a very small value, and the amount of calculation is very large. Therefore, this paper adopts mesh adaptive generation and parallel computing methods to improve the calculation efficiency.
3. Simulation Results and Analysis
In this model, the needle plate gap distance is 5 mm, and the needle electrode applies +6 kV DC voltage. The dynamic evolution law of needle plate gap flow at room temperature, dry clean air, relative humidity of 40%, 80%, and air pressure of 101 kpa, 85 kpa and 70 kpa is simulated and studied respectively. The temporal and spatial distribution of electron density and electric field intensity is compared with the streamer discharge model under dry clean air and standard atmospheric pressure.
3.1. Analysis of Streamer Discharge Simulation Results under Different Humidity
3.1.1. Electron Concentration
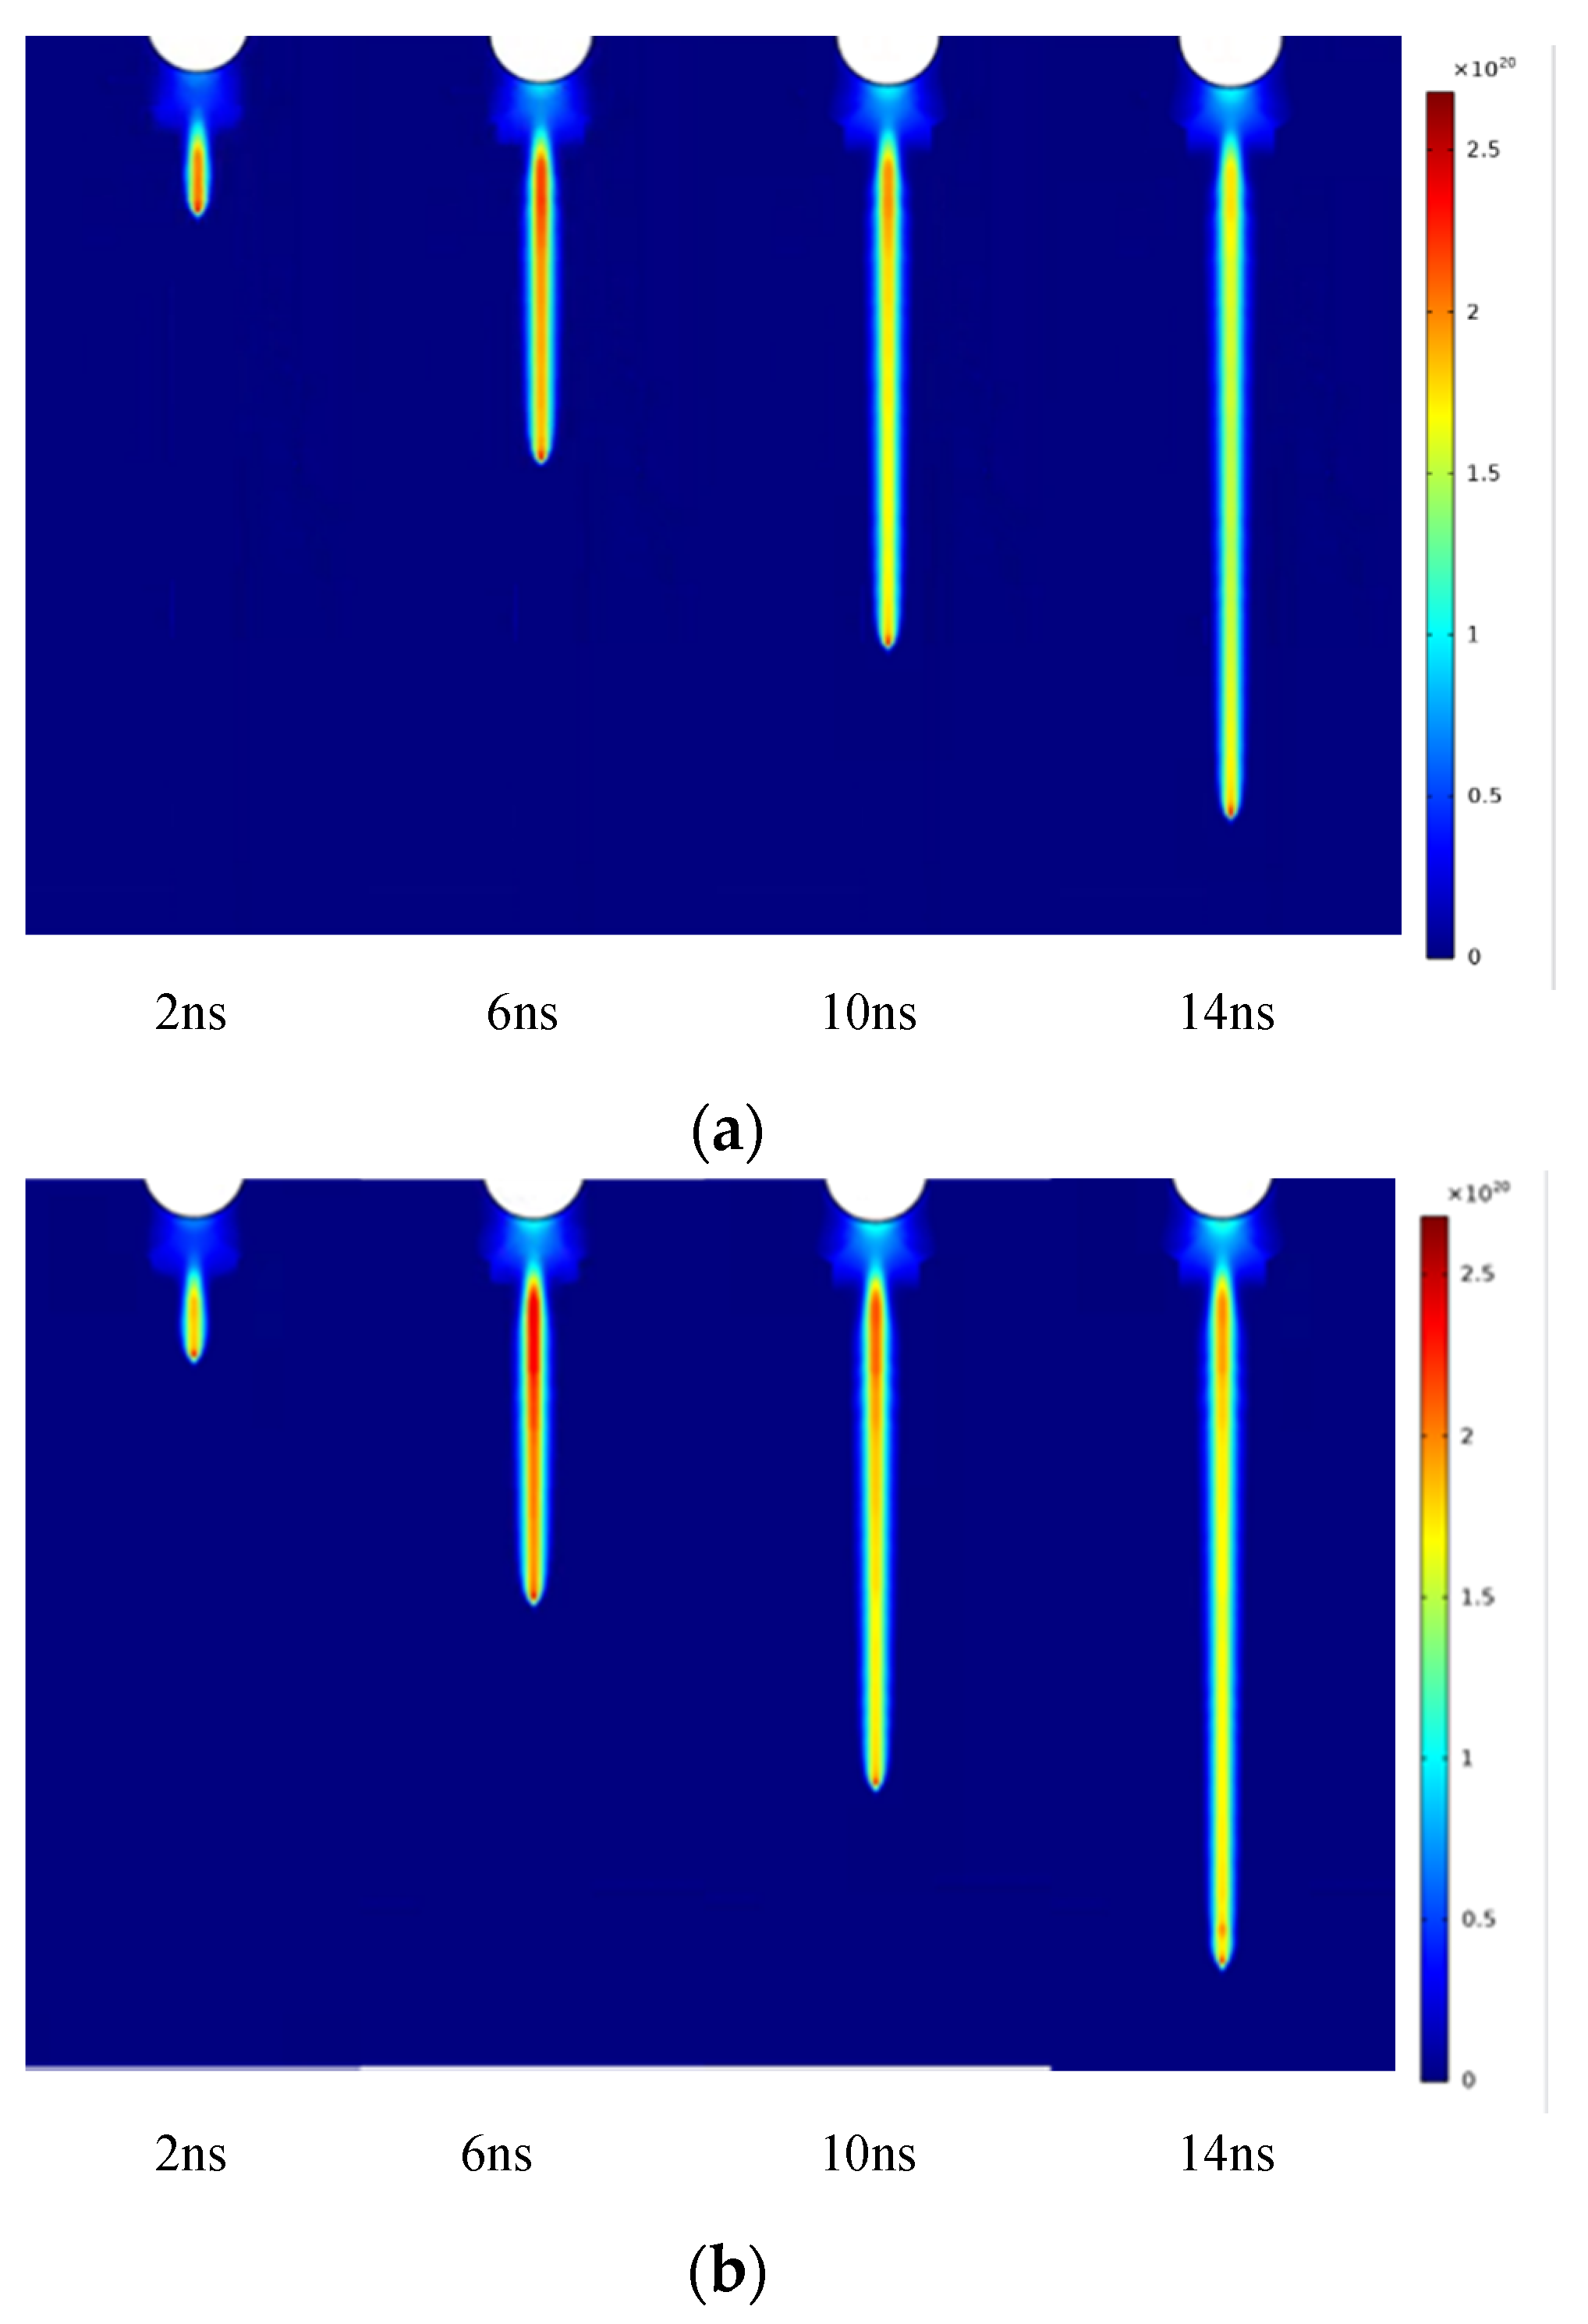
In Figure 2a–c are one-dimensional diagrams of electron concentration in the axial direction during the development of streamers with electron concentration at room temperature and different humidity respectively. Figure 2a shows dry clean air; Figure 2b shows 40% relative humidity, and Figure 2c shows 80% relative humidity. The curves in the figure show the changes of electron concentration on the symmetry axis of the model during the streamer discharge time of 2 ns to 14 ns. Figure 3 is a two-dimensional cloud diagram of electron concentration during streamer development.
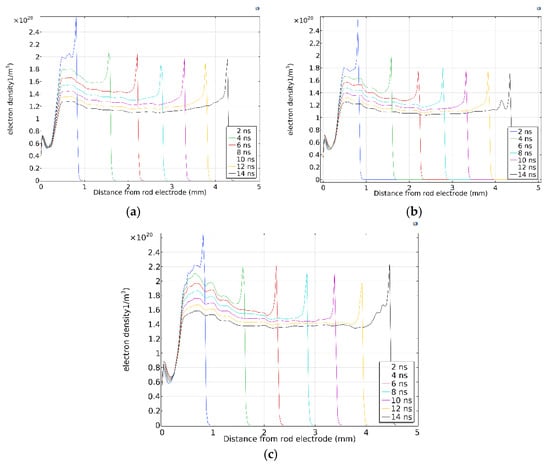
Figure 2.
One-dimensional distribution of electron concentration along the axis: (a) Dry clean air, (b) 40% relative humidity, (c) 80% relative humidity.


Figure 3.
Two-dimensional distribution of electron concentration: (a) Dry clean air, (b) 40% relative humidity, (c) 80% relative humidity.
According to the analysis in the Figure 3:
- (1)
- The essence of streamer discharge is the ionization process of a large number of gas molecules. The collision ionization of electrons and gas molecules is the most important ionization process in the process of streamer discharge. Electrons are the main carrier of energy transfer between electric field and particles. Electrons obtain energy from an electric field and then use the collision and scattering process with gas molecules to transfer energy to gas molecules. It can be seen that electrons play an important role in the process of streamer discharge. In the process of gas ionization, the generation rate of electrons is always greater than zero. With the development of discharge, more and more gas molecules are ionized, resulting in the gradual increase of electron density in the discharge region with the development of the streamer. The main area where gas molecules collide, ionize, and release electrons is the streamer head area, so the maximum electron generation rate appears in the streamer head area, and the electron concentration in the streamer head is high during the development of the streamer. It can also be seen that, although the generation of electrons mainly occurs at the streamer head, due to the positive discharge, the electrons generated at the streamer head will quickly move along the streamer channel to the positive needle electrode, resulting in a peak electron density near the surface of the needle electrode.
- (2)
- Comparing the electron concentration distribution under different humidity, it can be found that, at the same time, with the increase of humidity, the peak electron concentration increases slightly, and the forward distance of the streamer increases, that is, with the increase of humidity, the development speed of the streamer accelerates: Under dry clean air, the gap breakdown time is 16 ns; the breakdown time under 40% relative humidity is 15 ns, and the breakdown time under 80% relative humidity is 14.6 ns. This is because higher relative humidity means that the density of water molecules in the air increases, which increases the amount of collision ionization between electrons and water molecules in the air, so as to increase the ionization constant and promote the development of discharge. Although the increase of humidity also leads to the increase of the electron adhesion coefficient, which will hinder the development of discharge. The increase of ionization coefficient dominates in this range of humidity, resulting in more intense discharge with the increase of humidity.
3.1.2. Electric Field Intensity
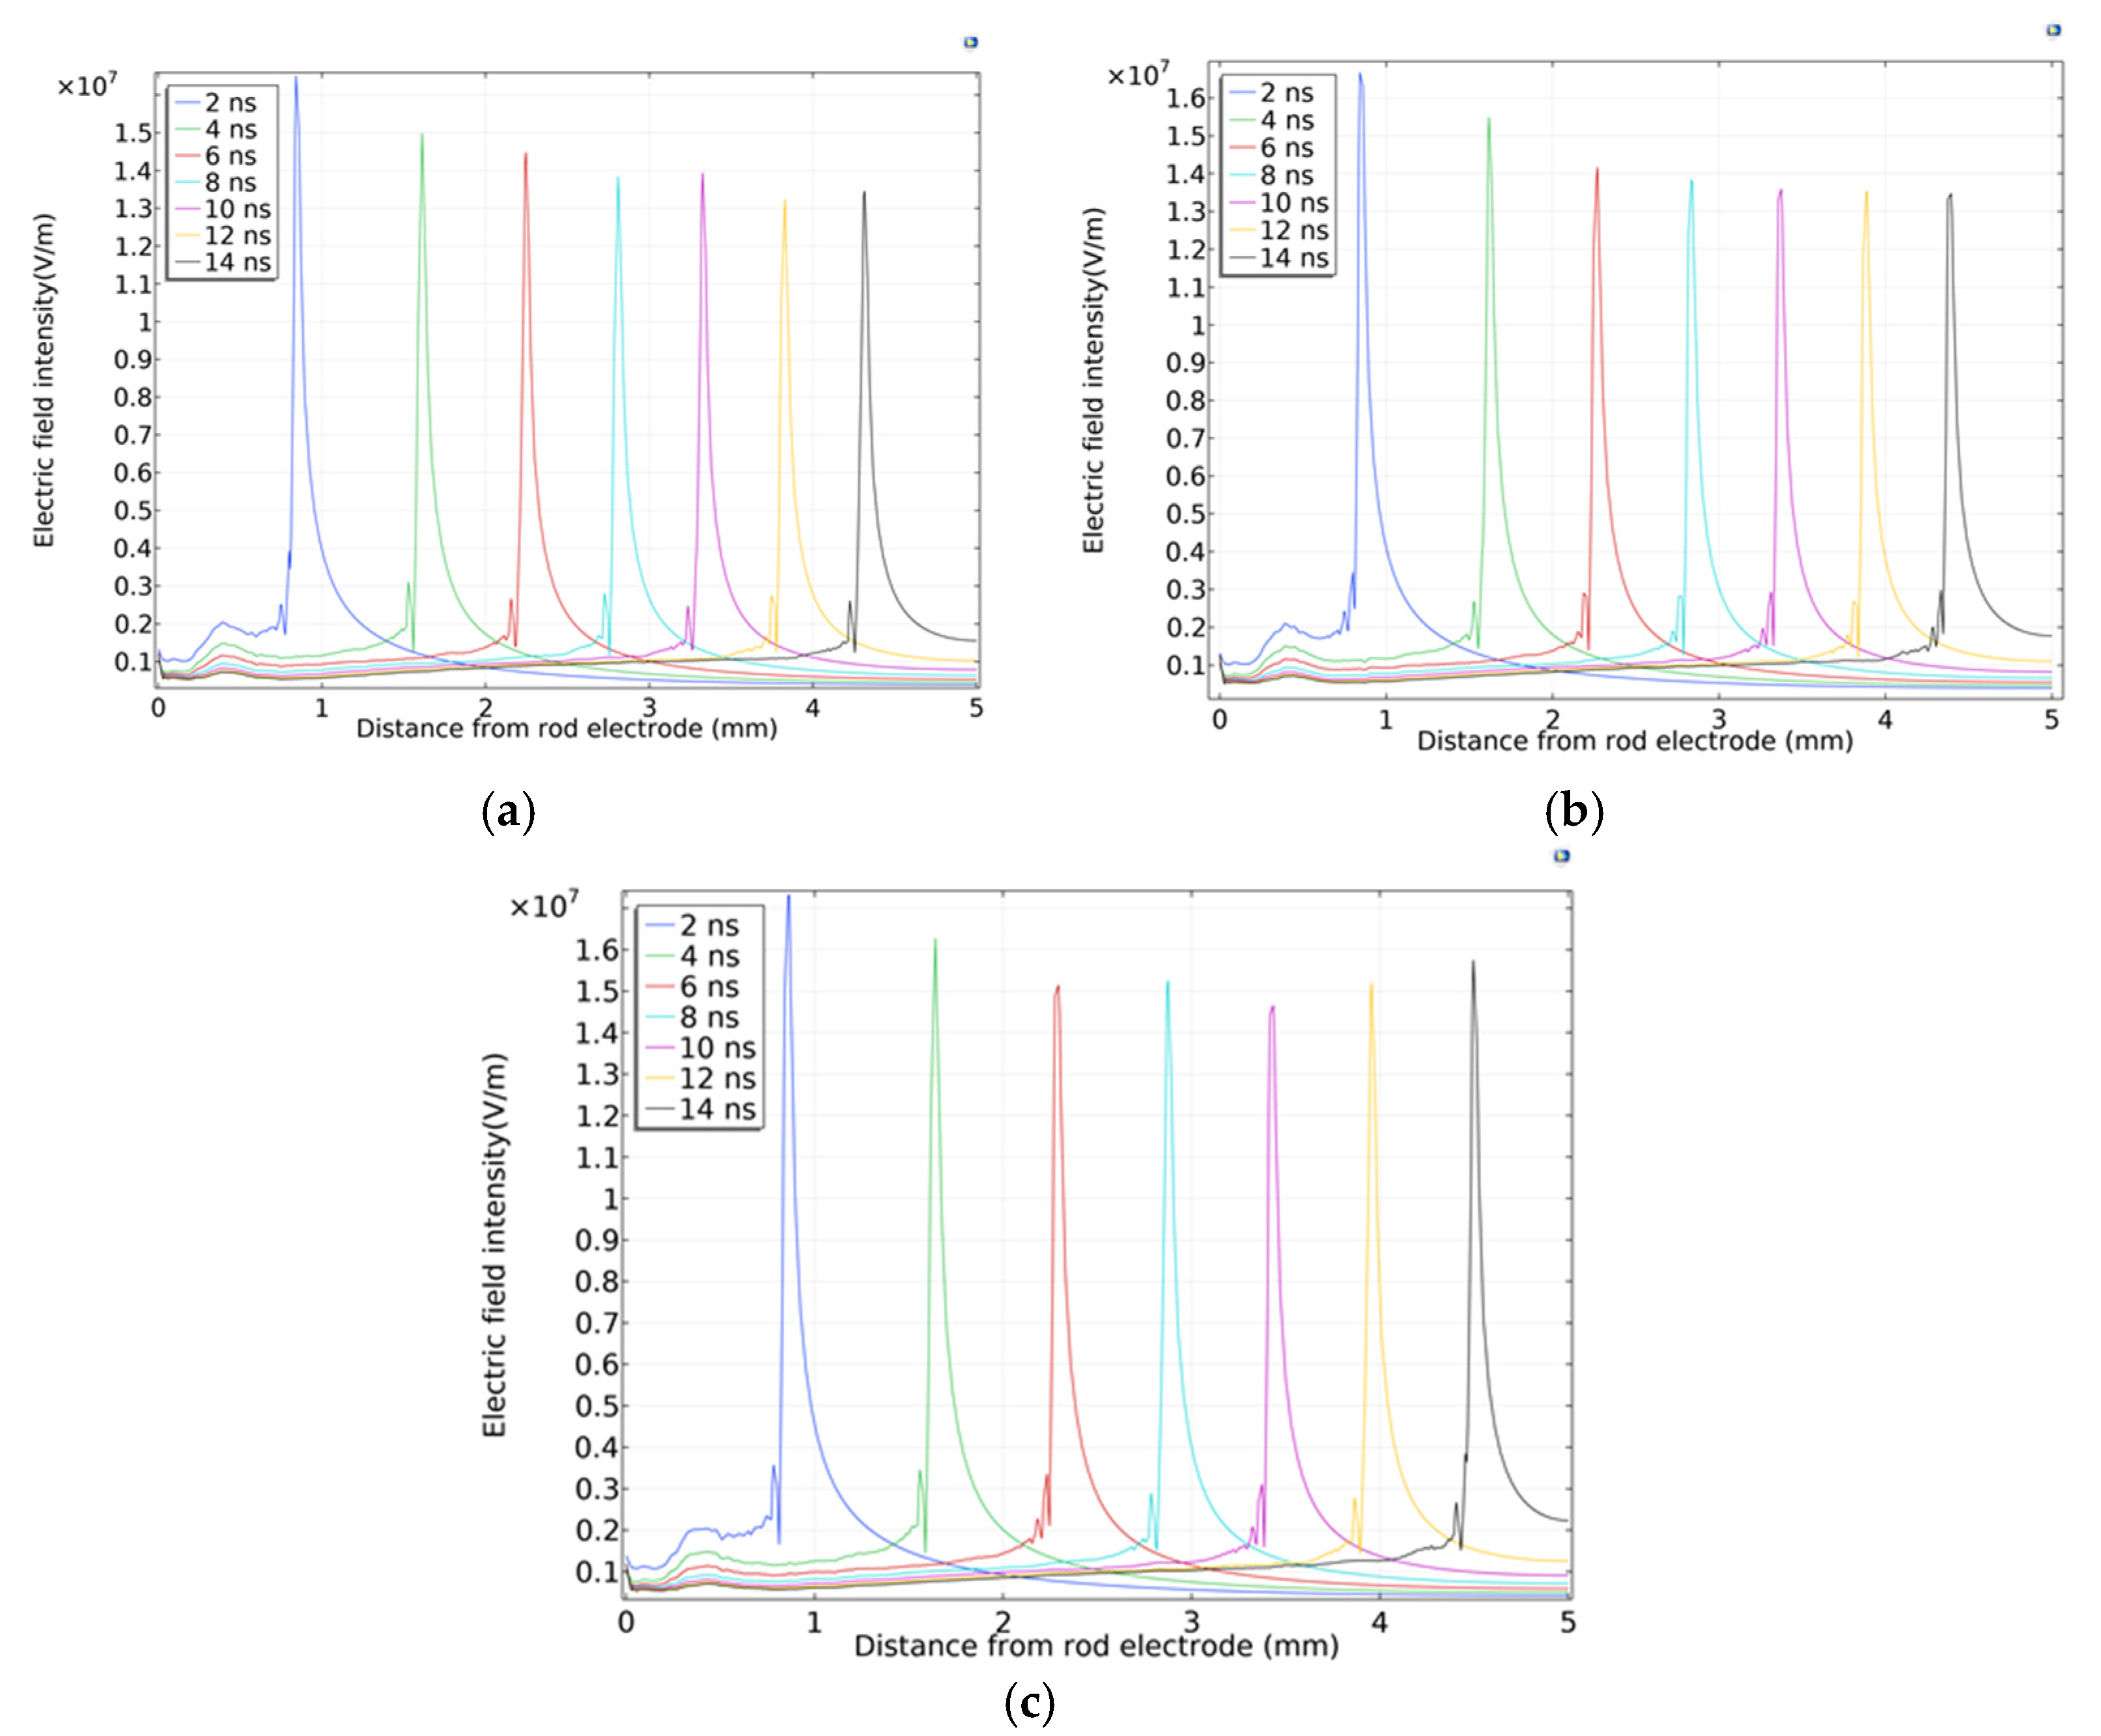
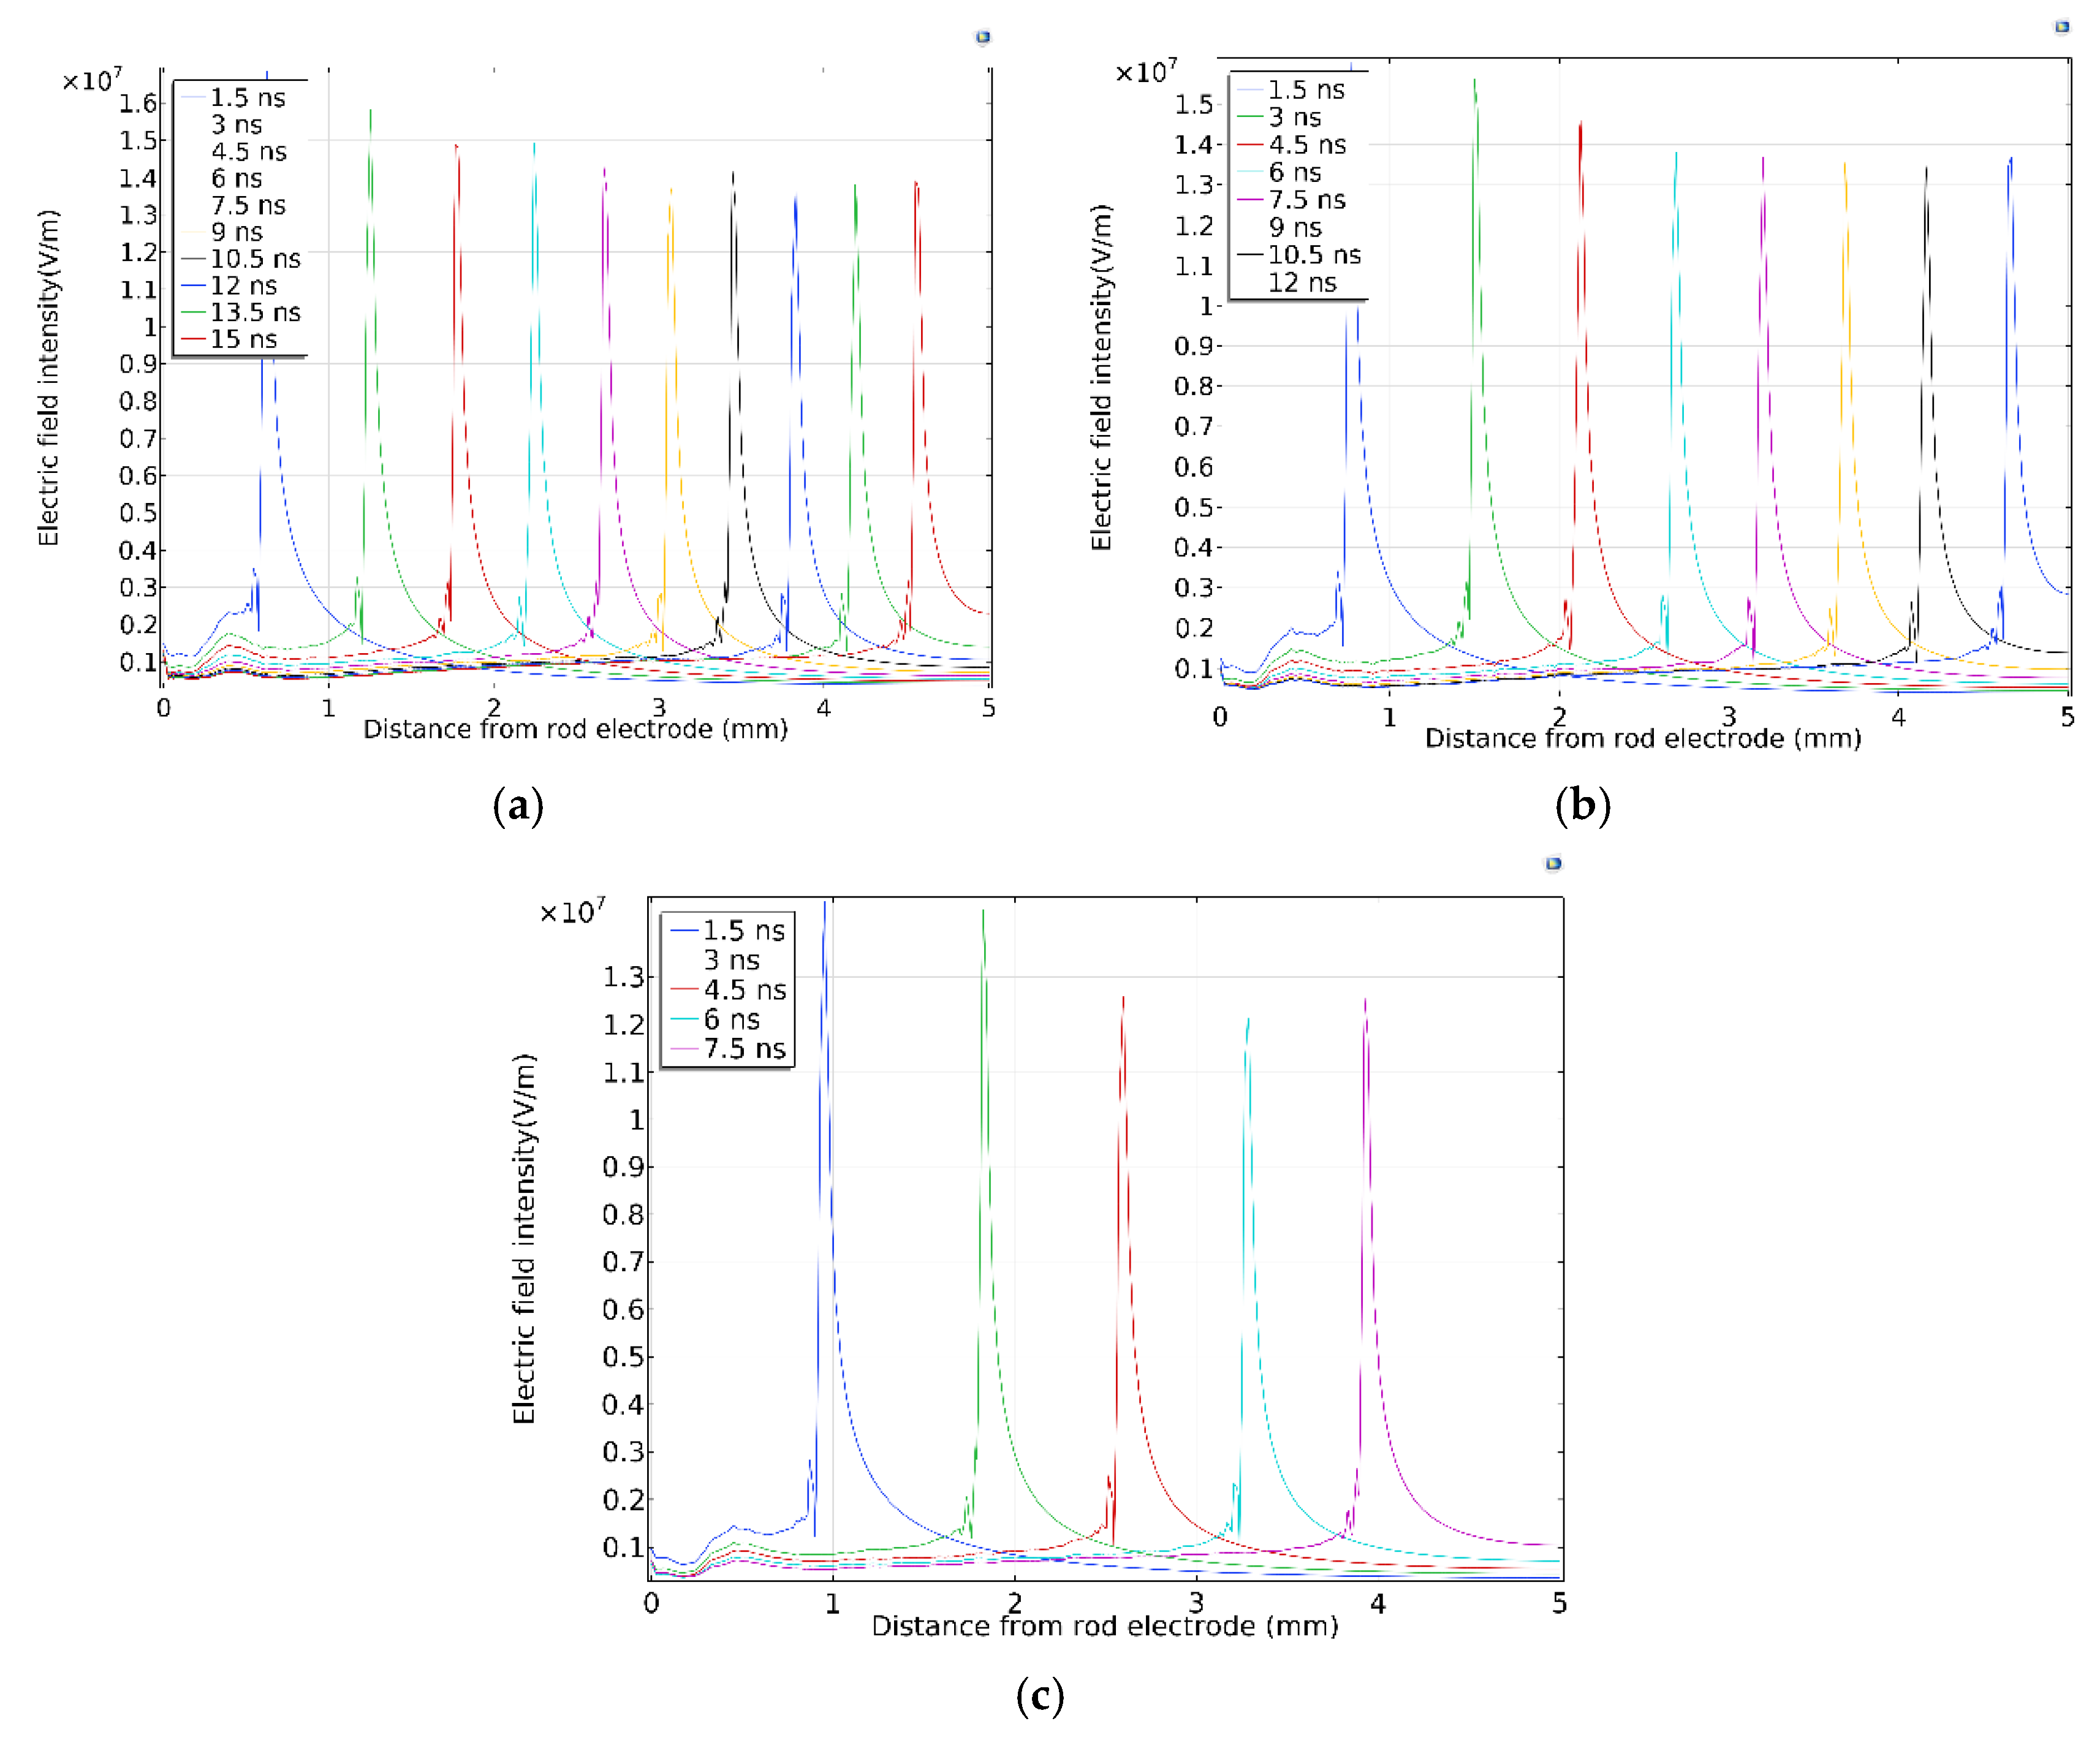
In Figure 4a–c are one-dimensional diagrams of electric field intensity in the axial direction of streamer development under different humidity. Figure 4a shows dry clean air; Figure 4b shows 40% relative humidity, and Figure 4c shows 80% relative humidity. Each curve in the figure shows the change of electric field intensity on the symmetry axis of the model during the streamer discharge time of 2 ns to 14 ns.
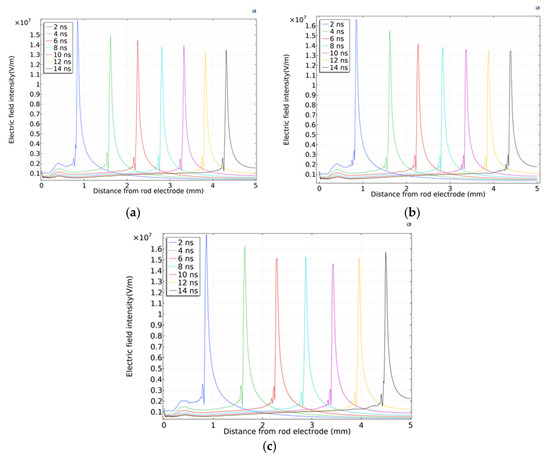
Figure 4.
One-dimensional distribution of electric field intensity along the axis: (a) Dry clean air, (b) 40% relative humidity, (c) 80% relative humidity.
According to the analysis in the Figure 4:
- (1)
- In the positive needle negative plate streamer discharge structure, at the starting time or during the streamer development, the electrons formed at the streamer head migrate to the anode under the action of an electric field force; some electrons are neutralized at the anode surface, and the positive ions migrate to the negative electrode. However, the migration rate of positive ions is much lower than that of electrons, resulting in the shift of positive and negative charge centers in the discharge space, and the accumulation of a large number of positive ions in the region of the streamer head, resulting in the positive polarity of the streamer head. The accumulation of positive charges distorts the space electric field at the streamer head and intensifies the electric field at the streamer head. As shown in Figure 4, the electric field intensity reaches the maximum at the streamer head. It can also be seen that, during the development of the streamer, the area in front of the streamer head where no discharge occurs bears most of the voltage drop, while the medium voltage drop of the streamer channel is small. This is mainly because the streamer channel has a large number of positive and negative charges and is approximately electrically neutral, that is, the external charge density is almost zero, which can be approximately regarded as a plasma channel (low resistance). Therefore, the voltage drop in the streamer channel is small.
- (2)
- Comparing the field strength distribution under different humidity, it can be found that the maximum field strength at the streamer head increases slowly with the increase of humidity. The reasons are as follows: the increase of humidity means that there will be more water molecules or water vapor molecular clusters in the air. The existence of water vapor molecular clusters will lead to the distortion of the original spatial electric field distribution, and the electric field intensity around water molecular clusters will increase significantly, resulting in the increase of air ionization coefficient in local areas. The more water molecules, the greater the average ionization coefficient of the gas, the higher the probability of electron collision ionization, and the severity of discharge will be greatly increased. In the streamer discharge channel, the most intense gas discharge is the streamer head. Collision ionization will produce a large number of charged particles; electrons and negative ions will flow to the metal anode under the action of electric field force, and a large number of positive ions will stay in the streamer head, which will greatly strengthen the electric field strength of the streamer head. Moreover, the higher the humidity is, the more intense the discharge is and the more positive ions will stay in the streamer head, resulting in the greater electric field strength of the streamer head.
3.2. Analysis of Streamer Discharge Simulation Results under Different Pressure
3.2.1. Electron Concentration
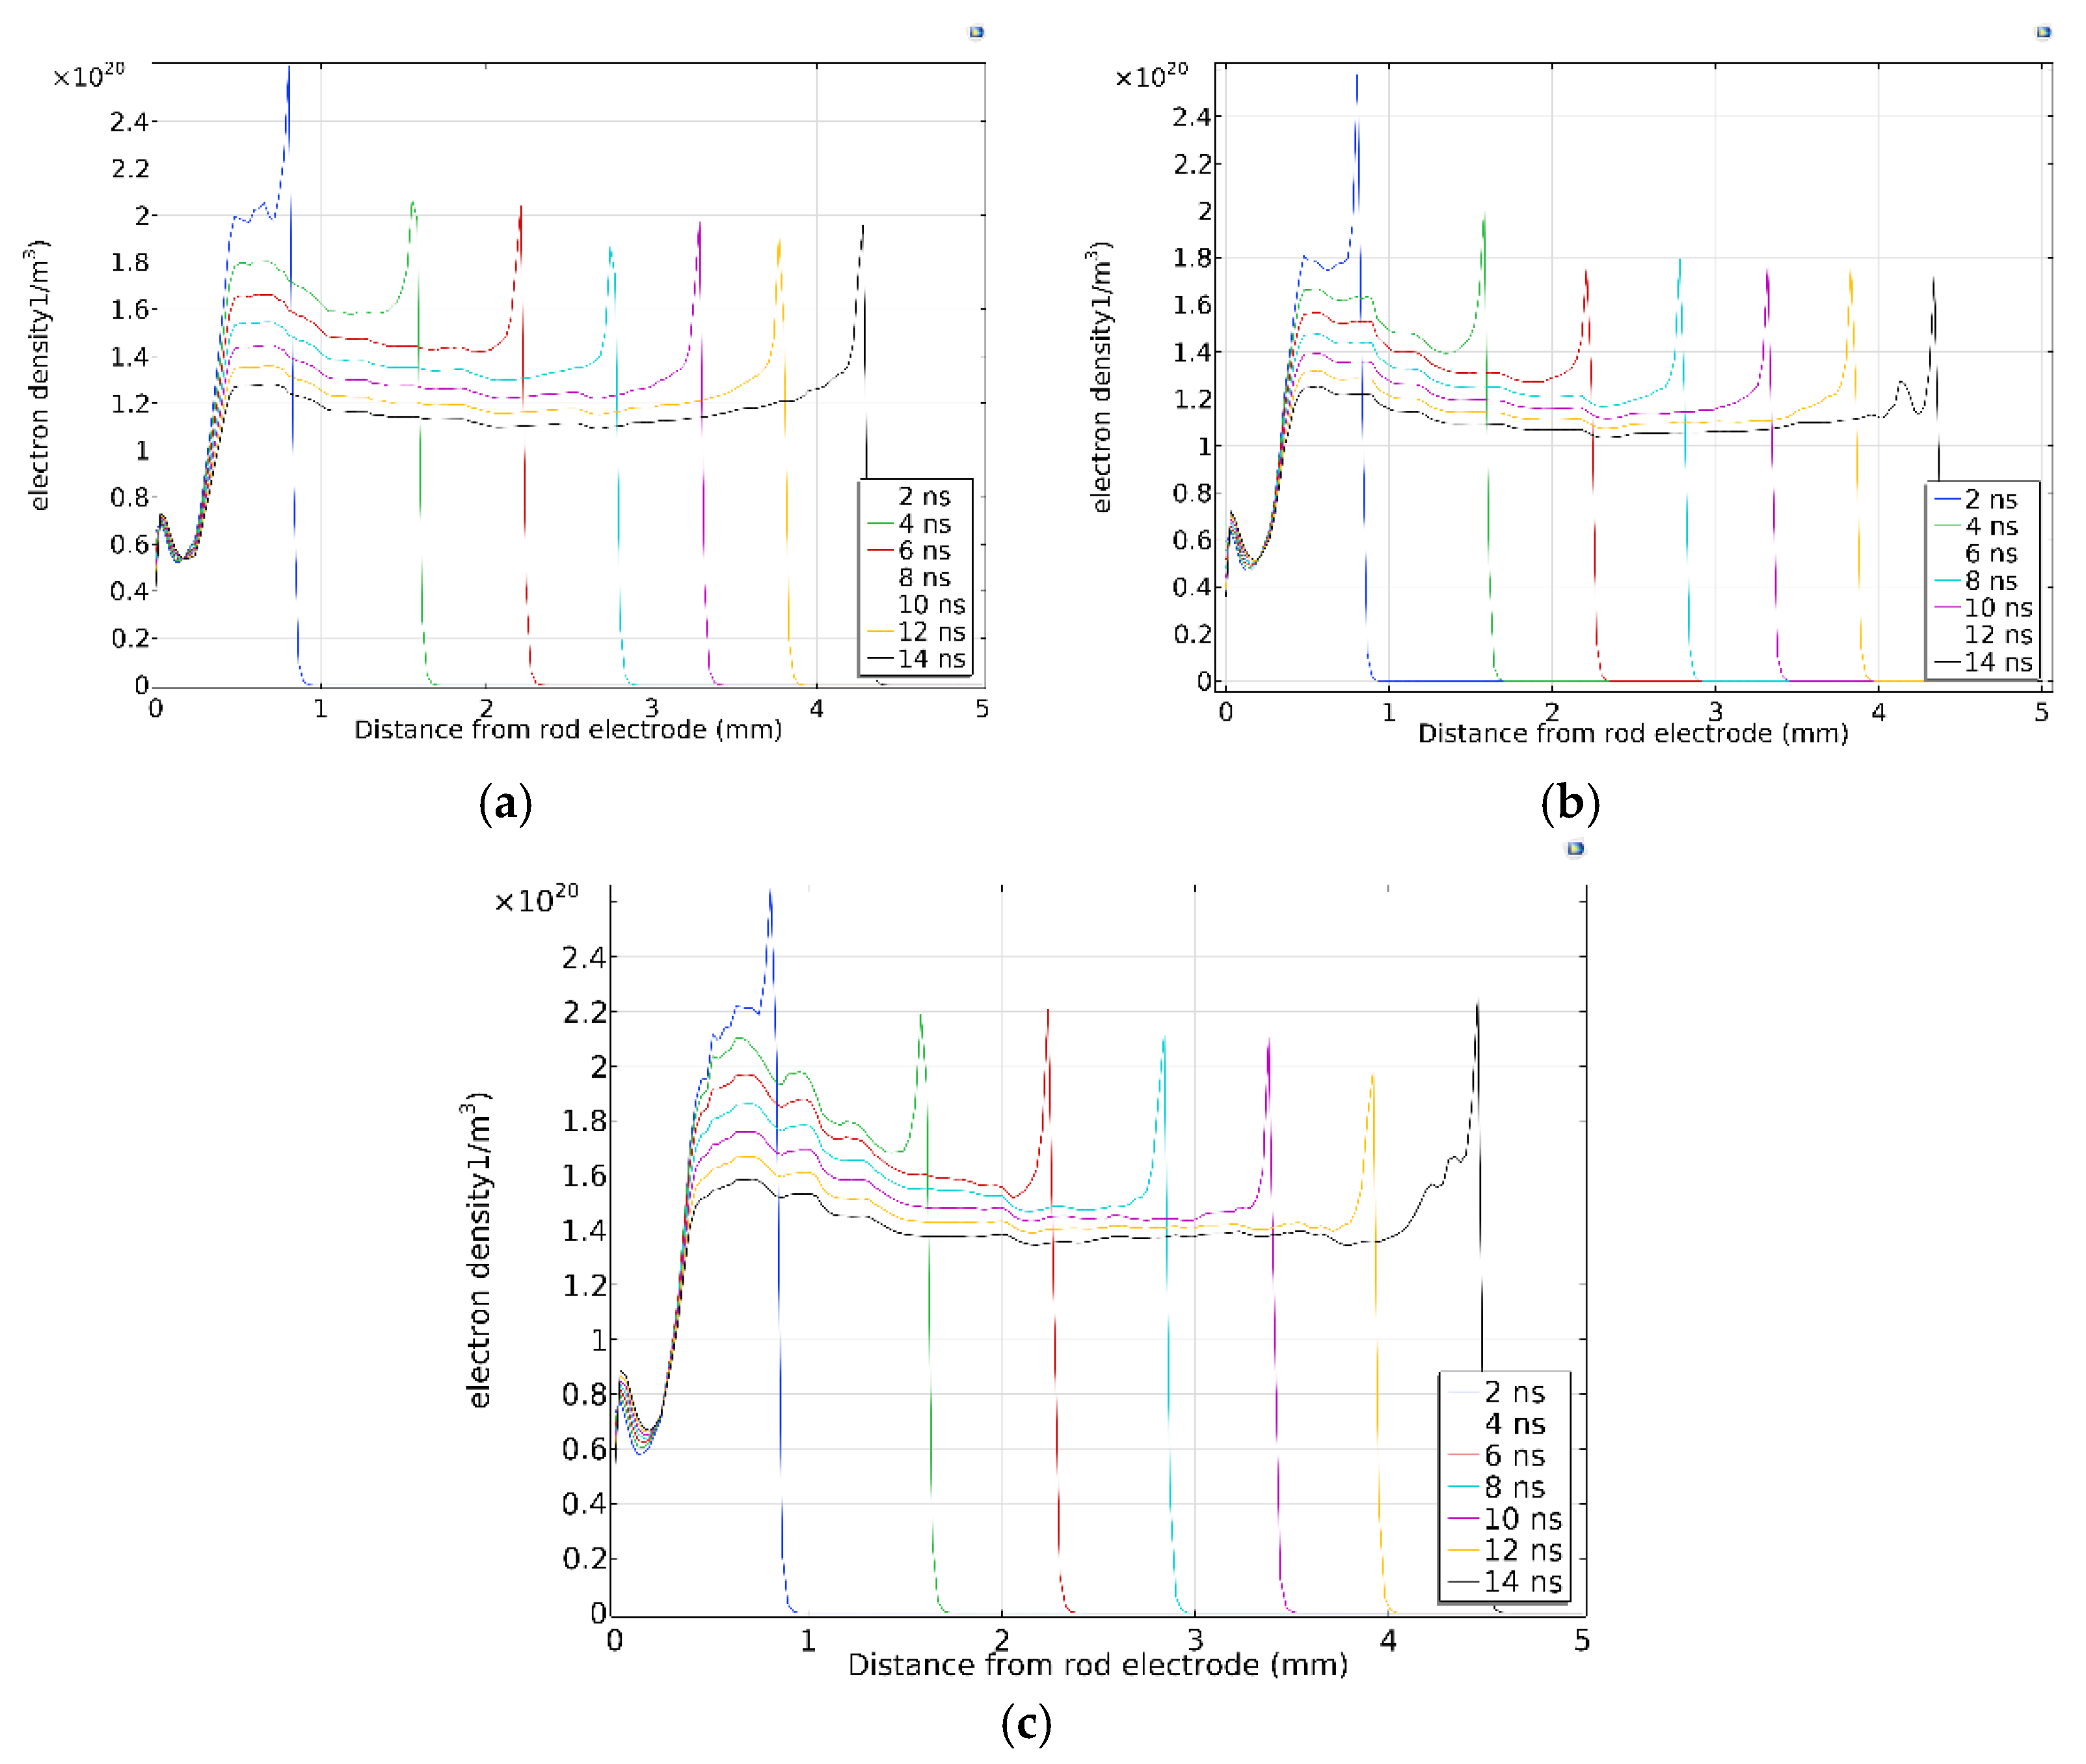
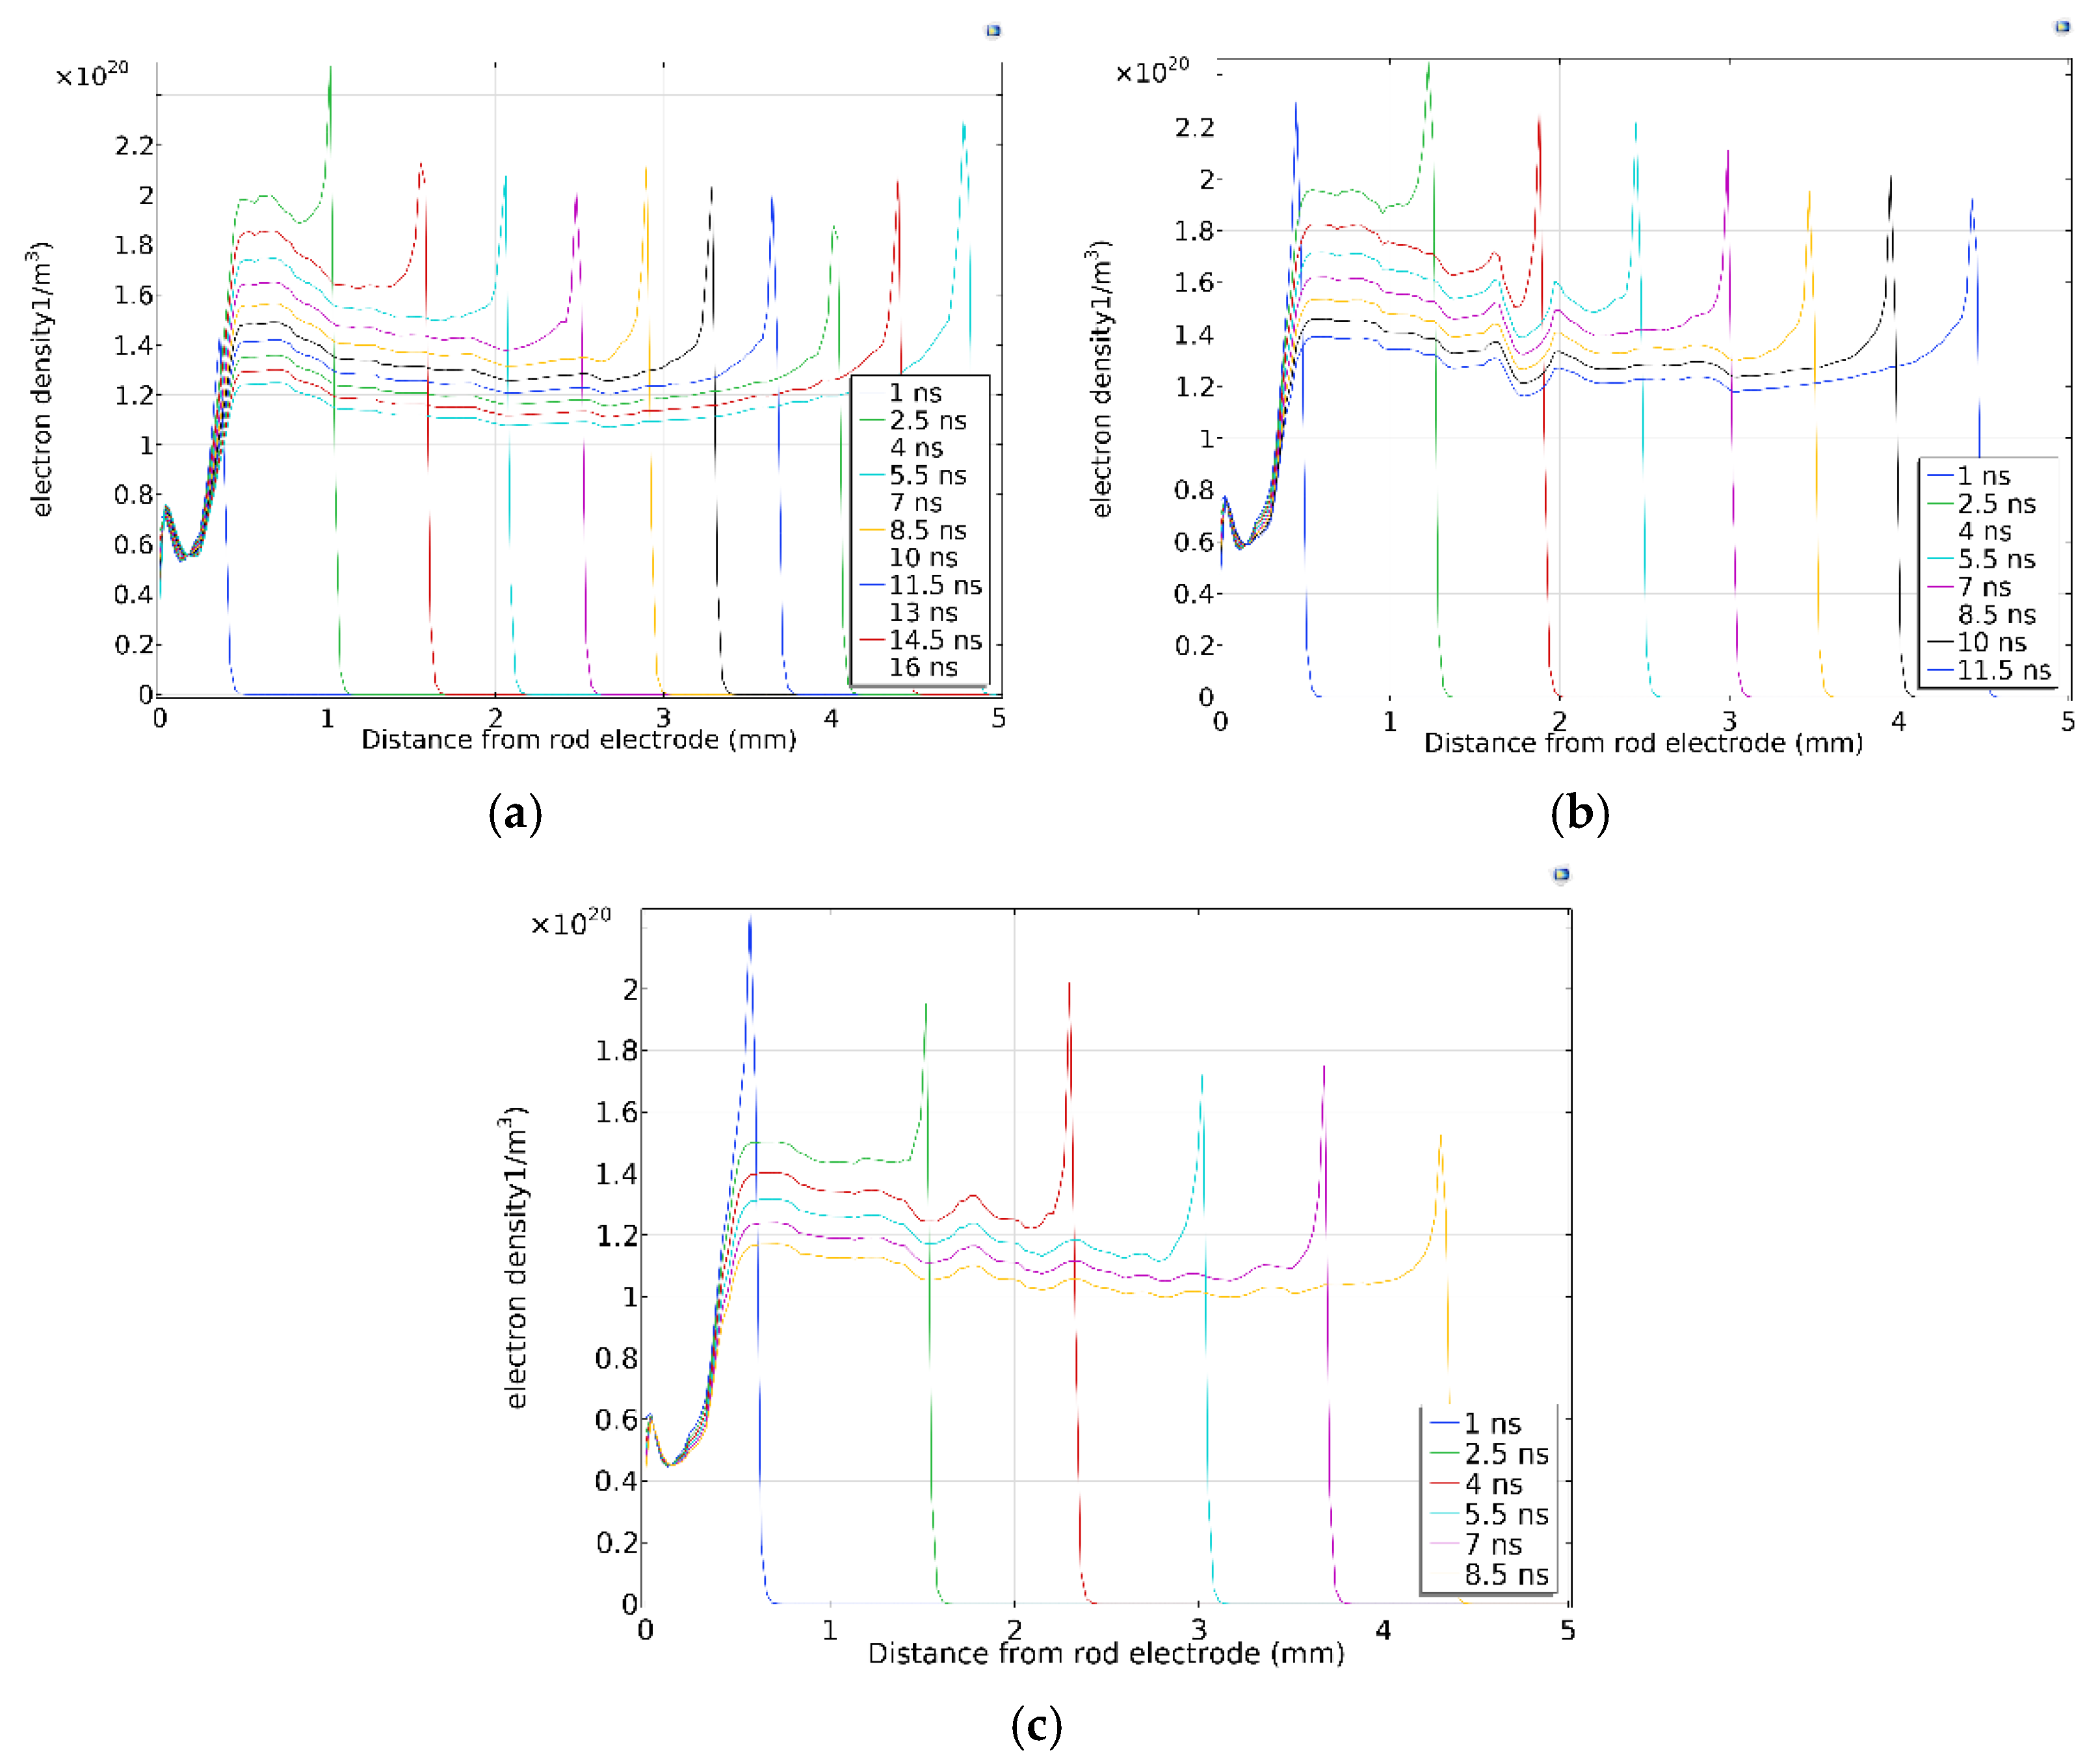
In Figure 5a–c are one-dimensional diagrams of electron concentration in the axial direction during the development of streamers at different pressures. Figure 5a shows the standard atmospheric pressure. Figure 5b shows 85 kpa, and Figure 5c shows 70 kpa. Each curve in the figure shows the change of electron concentration on the symmetry axis of the model from the beginning of streamer discharge to the time of breakdown. Figure 6 is a two-dimensional diagram of electron concentration during streamer development.
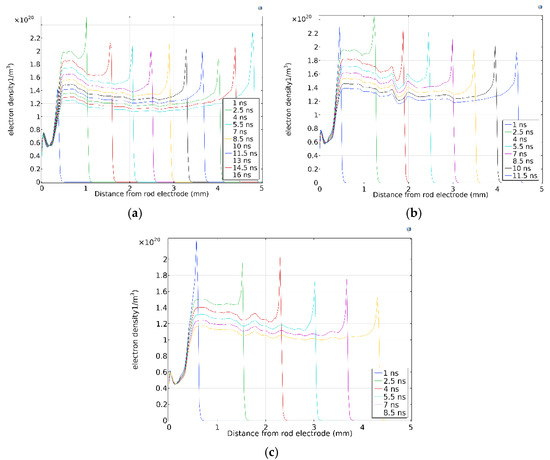
Figure 5.
One-dimensional distribution of electron concentration along the axis: (a) 101 kPa, (b) 85 kPa, (c) 70 kPa.

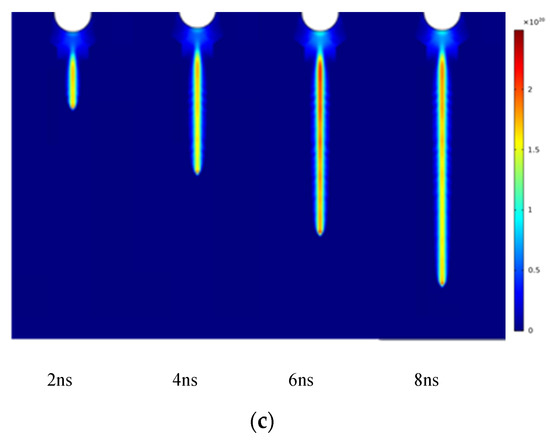
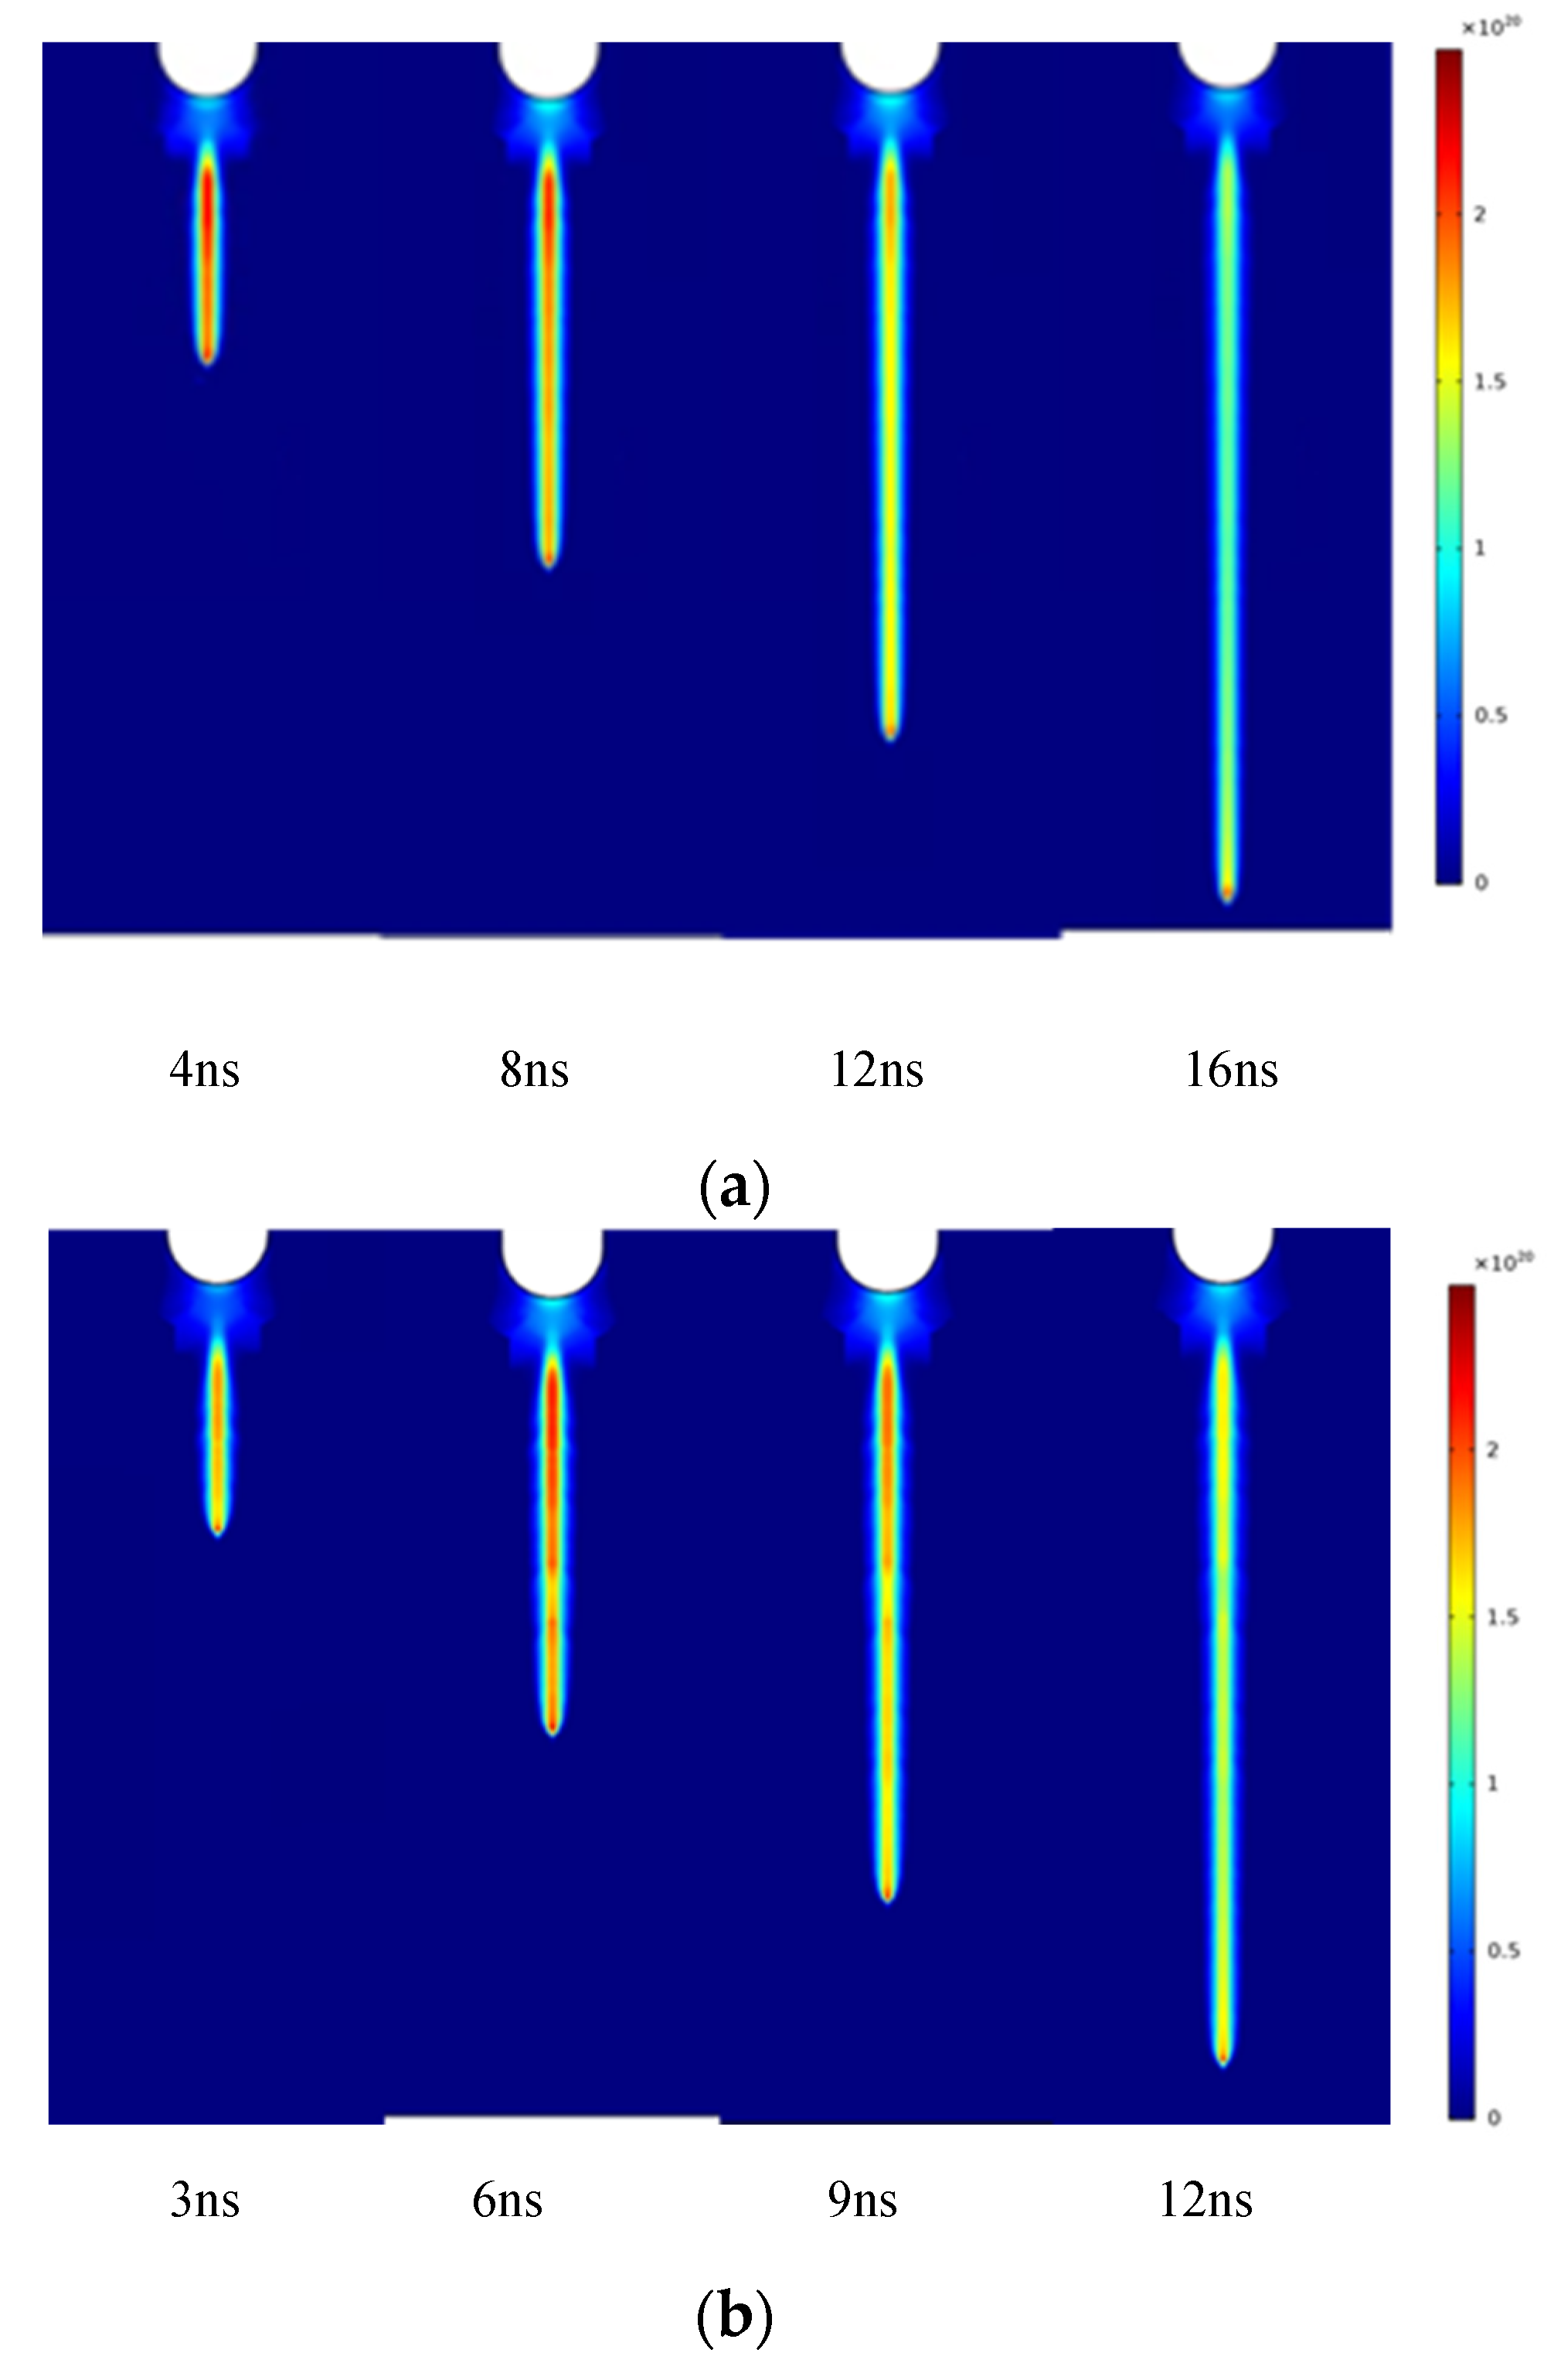
Figure 6.
Two-dimensional distribution of electron concentration: (a) 101 kPa, (b) 85 kPa, (c) 70 kPa.
As can be seen from the Figure 6:
- (1)
- Comparing the electron concentration profiles under different air pressures, it is found that, at the same time, the electron concentration decreases with the decrease of air pressure, and the decreasing trend is more obvious at low air pressure. From the perspective of the average free path of electrons, with the decrease of air pressure, the particle concentration in the air decreases as a whole, the number of particles per unit distance decreases, and the average free path of electrons increases, which leads to the greatly reduced probability of collision ionization caused by electrons per unit distance, that is, the collision ionization coefficient decreases. The frequency of electron positive ion recombination decreases with the decrease of electron collision probability, resulting in the decrease of the intensity of particle behavior in the electric field.
- (2)
- When the air pressure decreases, the streamer develops faster. Under the condition of low air pressure, the streamer can reach the negative electrode faster. At 9 ns, the streamer head at 70 kPa has reached the distance from the plate electrode, and the streamer head at 80 kPa is at 3.5 mm. At this time, the streamer head at standard atmospheric pressure is still about halfway because, with the increase of the average free path of the electron, the faster the movement speed of the electron and the greater the kinetic energy that can be accumulated in the electric field. After the collision of the streamer head, the electron can move forward at a faster speed, which has a greater distortion effect on the spatial electric field, resulting in the acceleration of the propagation speed of the streamer. The acceleration of electron movement will greatly reduce the probability of electron attachment and negative ions, which will be conducive to the formation of streamers. However, because collision ionization dominates the discharge intensity in streamer discharge, the increase of streamer discharge intensity caused by the decrease of adhesion coefficient is not obvious. Low pressure can reduce the intensity of streamer discharge, but it will accelerate the propagation speed of streamer in space electric field. According to the calculation, the air gap between rod and plate will be broken down after 9 ns of streamer at 70 kPa pressure, and the average forward speed of streamer is about 5.6 × 107 cm/s.
3.2.2. Electric Field Intensity
In Figure 7a–c are one-dimensional diagrams of electric field intensity in the axial direction of streamer development under different pressures. Figure 7a shows the standard atmospheric pressure. Figure 7b shows 85 kPa, and Figure 7c shows 70 kPa. Each curve in the figure shows the change of electric field intensity on the symmetry axis of the model from the beginning of streamer discharge to the time of impending breakdown.
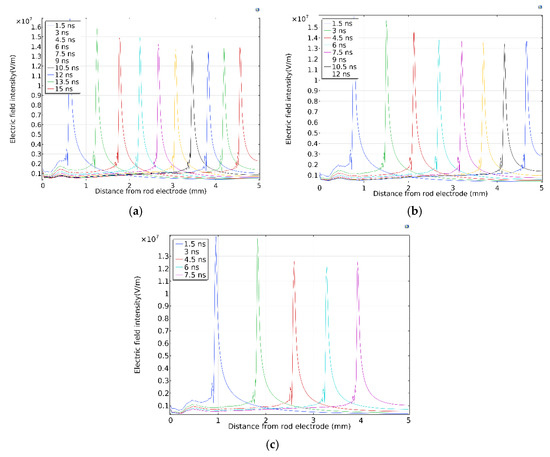
Figure 7.
One-dimensional distribution of electric field intensity along the axis: (a) 101 kPa, (b) 85 kPa, (c) 70 kPa.
By observing the electric field distribution diagram under different air pressure conditions, it is found that, with the decrease of air pressure, the frequency and degree of electric field intensity distorted by space charge decrease because the discharge intensity decreases under low air pressure, and the change of charged particle concentration is not enough to cause the change of space field intensity. With the increase of air pressure, the fluctuation range of the space electric field becomes larger and larger, and the distribution of space positive and negative charges changes the external electric field more and more obviously. It shows that, with the increase of air pressure, the collision, ionization, and drift of charged particles intensify in the process of streamer discharge, and the space net charge increases, which promotes the discharge intensity in the head area of streamer.
4. Experimental Study on Short Air Gap Breakdown Characteristics of Rod Plate under Different Environmental Parameters
4.1. Test Equipment and Test Methods
4.1.1. Test Device
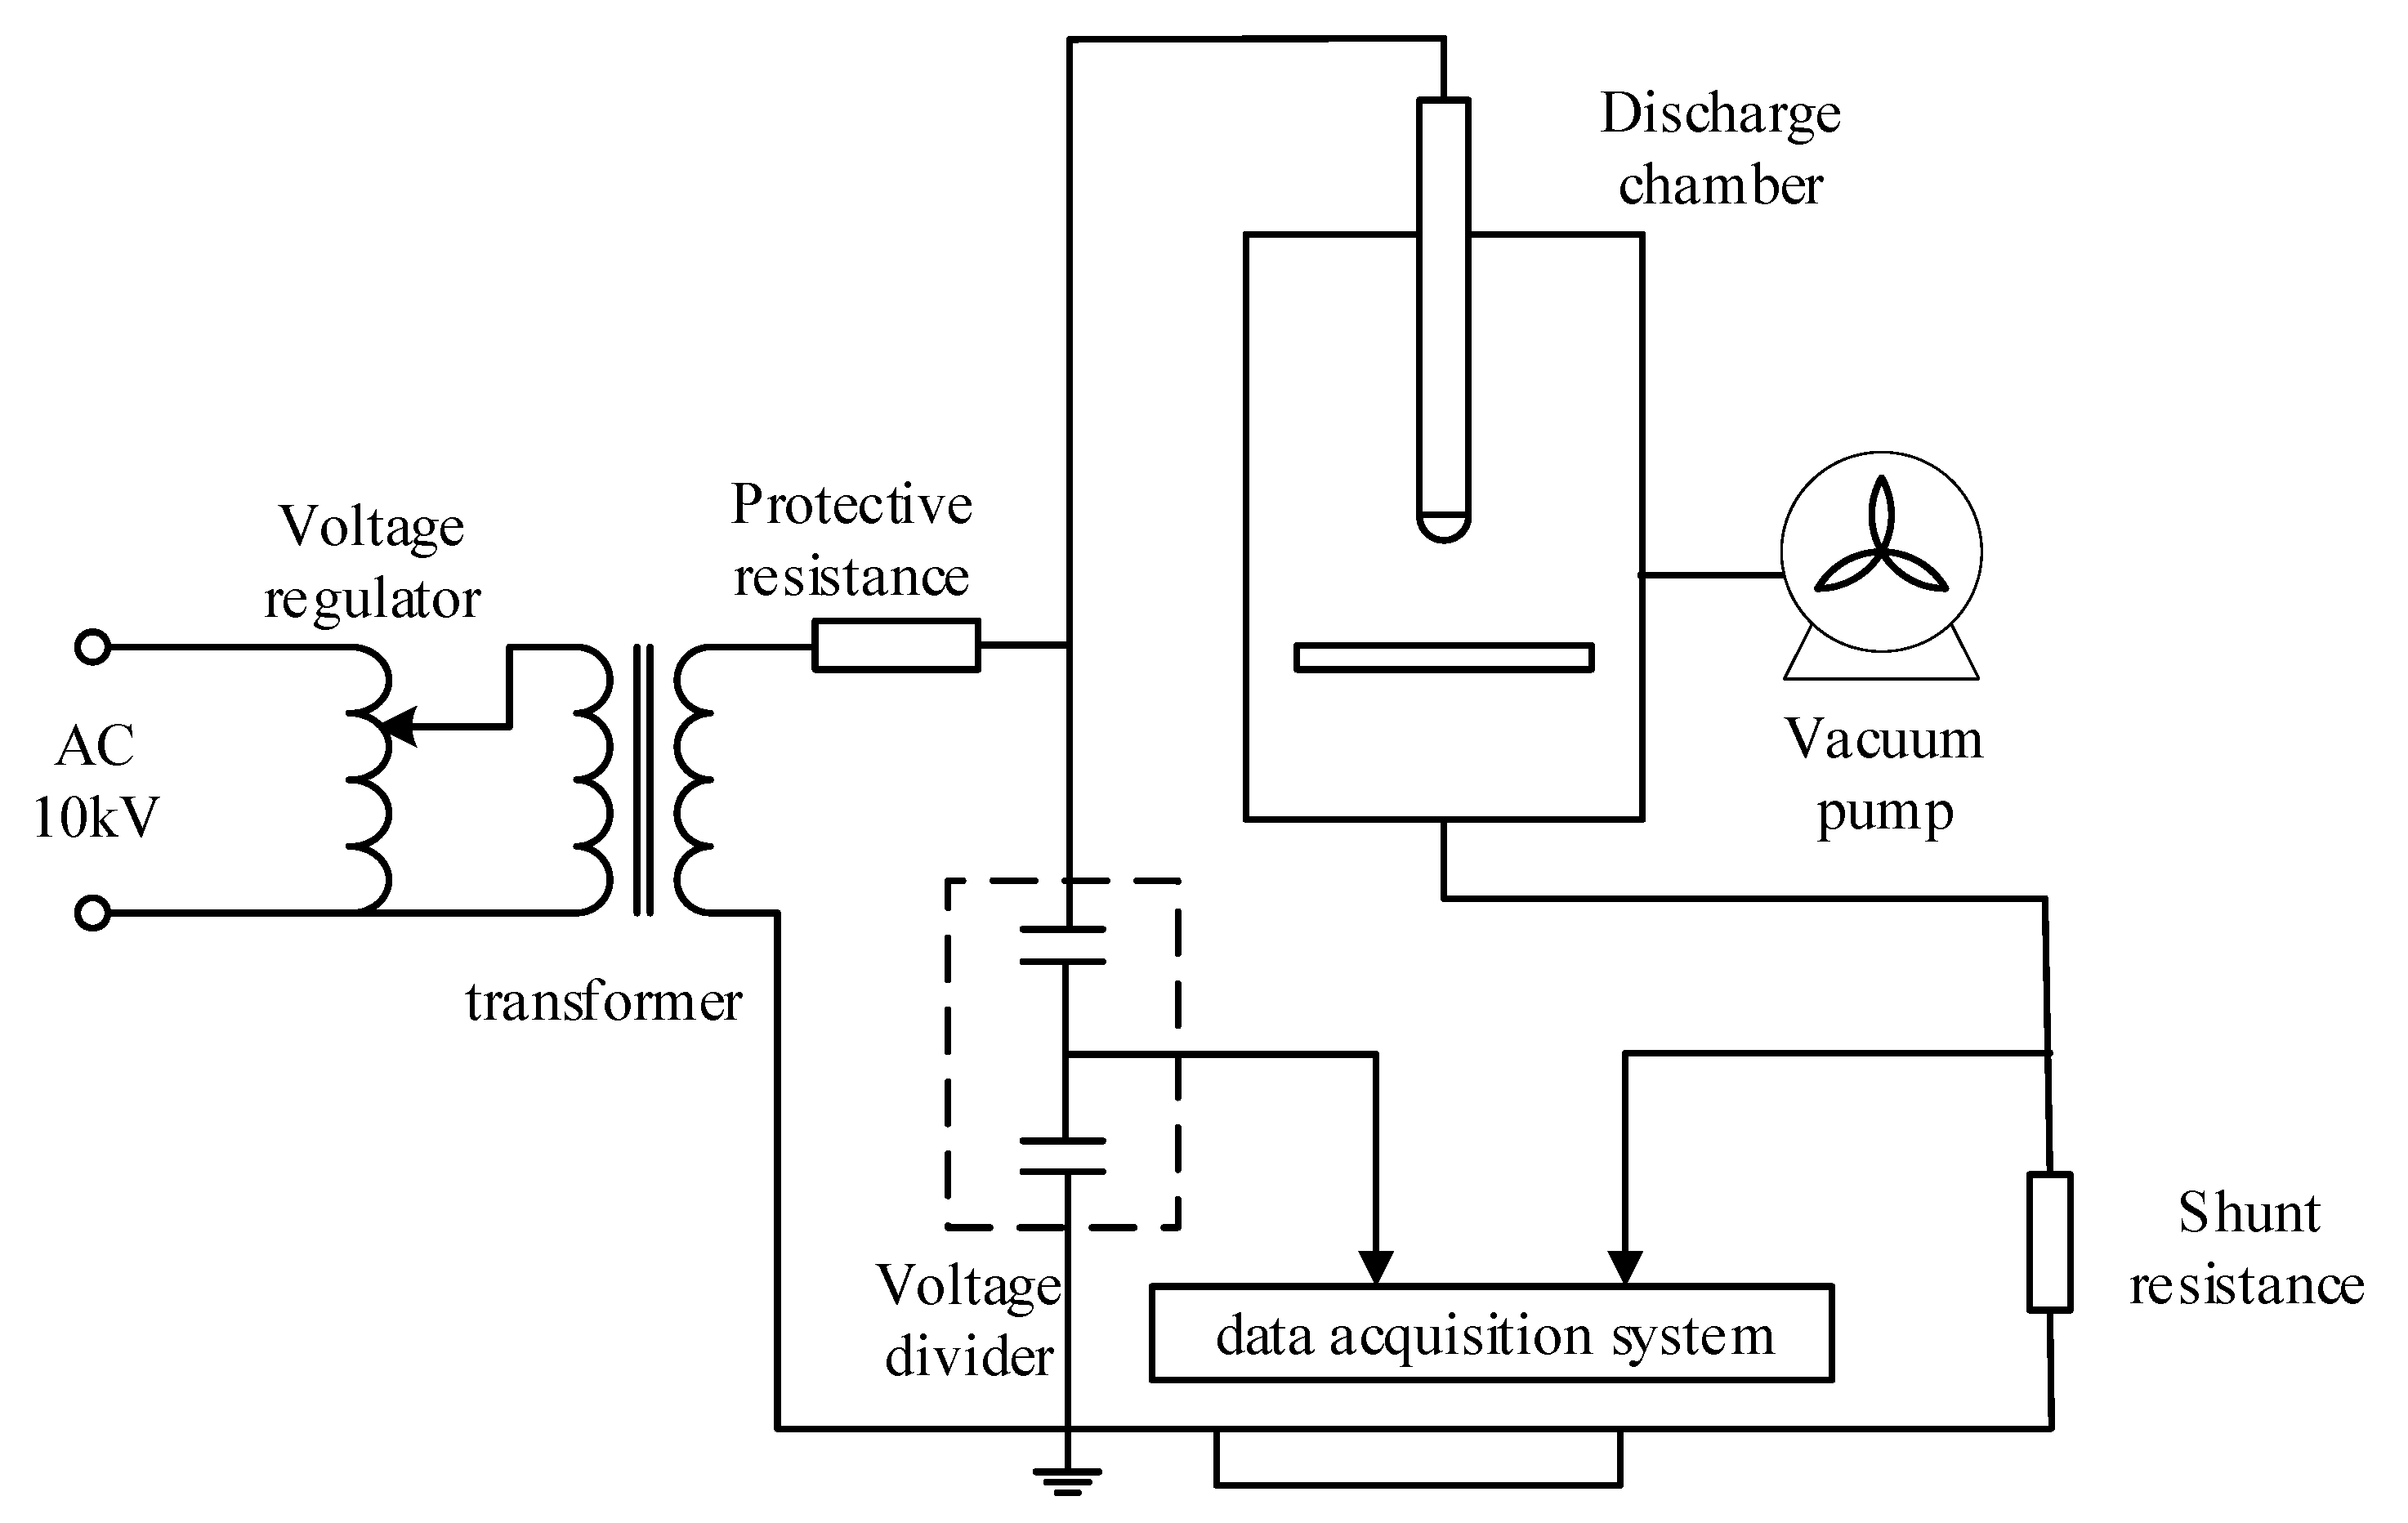
The breakdown characteristics of a short air gap between rod and plate under different environmental parameters were tested in a self-made discharge chamber. The test power supply is provided by ydtw-2000 kva/500 kV AC corona free test transformer with rated capacity of 2000 kVA, rated voltage of 500 kV, rated current of 4 A, maximum short-circuit current of 75 A, short-circuit impedance of less than 6%, and output voltage waveform distortion rate of less than 3%. The test wiring principle is shown in Figure 8.
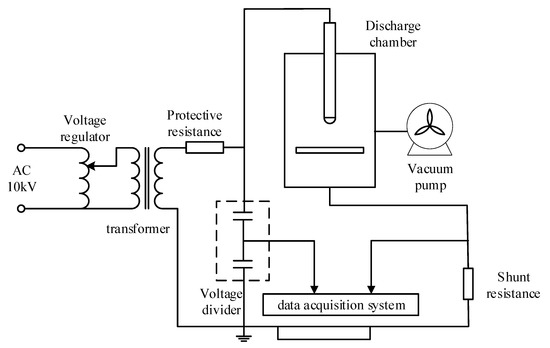
Figure 8.
Schematic diagram of test wiring.
4.1.2. Test Method and Process
In this study, power frequency discharge experiments were carried out for 10 cm, 15 cm, and 20 cm rod plate gap under dry clean air at room temperature, relative humidity of 40%, 80%, and air pressure of 101 kPa, 85 kPa and 70 kPa. During the experiment, the power frequency voltage boost rate is 0.2 kV/s, discharged 20 times at each air pressure point, and the average value is taken as the average breakdown voltage at the test point. Under the fixed gap, the air pressure inside the discharge chamber is pumped to 85 kPa and 70 kPa by vacuum pump, and the simulated altitude is 1500 m and 2500 m, respectively. Because the dispersion of AC breakdown voltage at low pressure is small, if the standard deviation σ < 3%, the experiment is considered effective. In order to avoid the impact of the charge generated by the discharge on the next discharge, the interval between two adjacent discharges is 5 min. The rod plate electrode is cleaned with absolute alcohol before the experiment.
4.2. Test Result
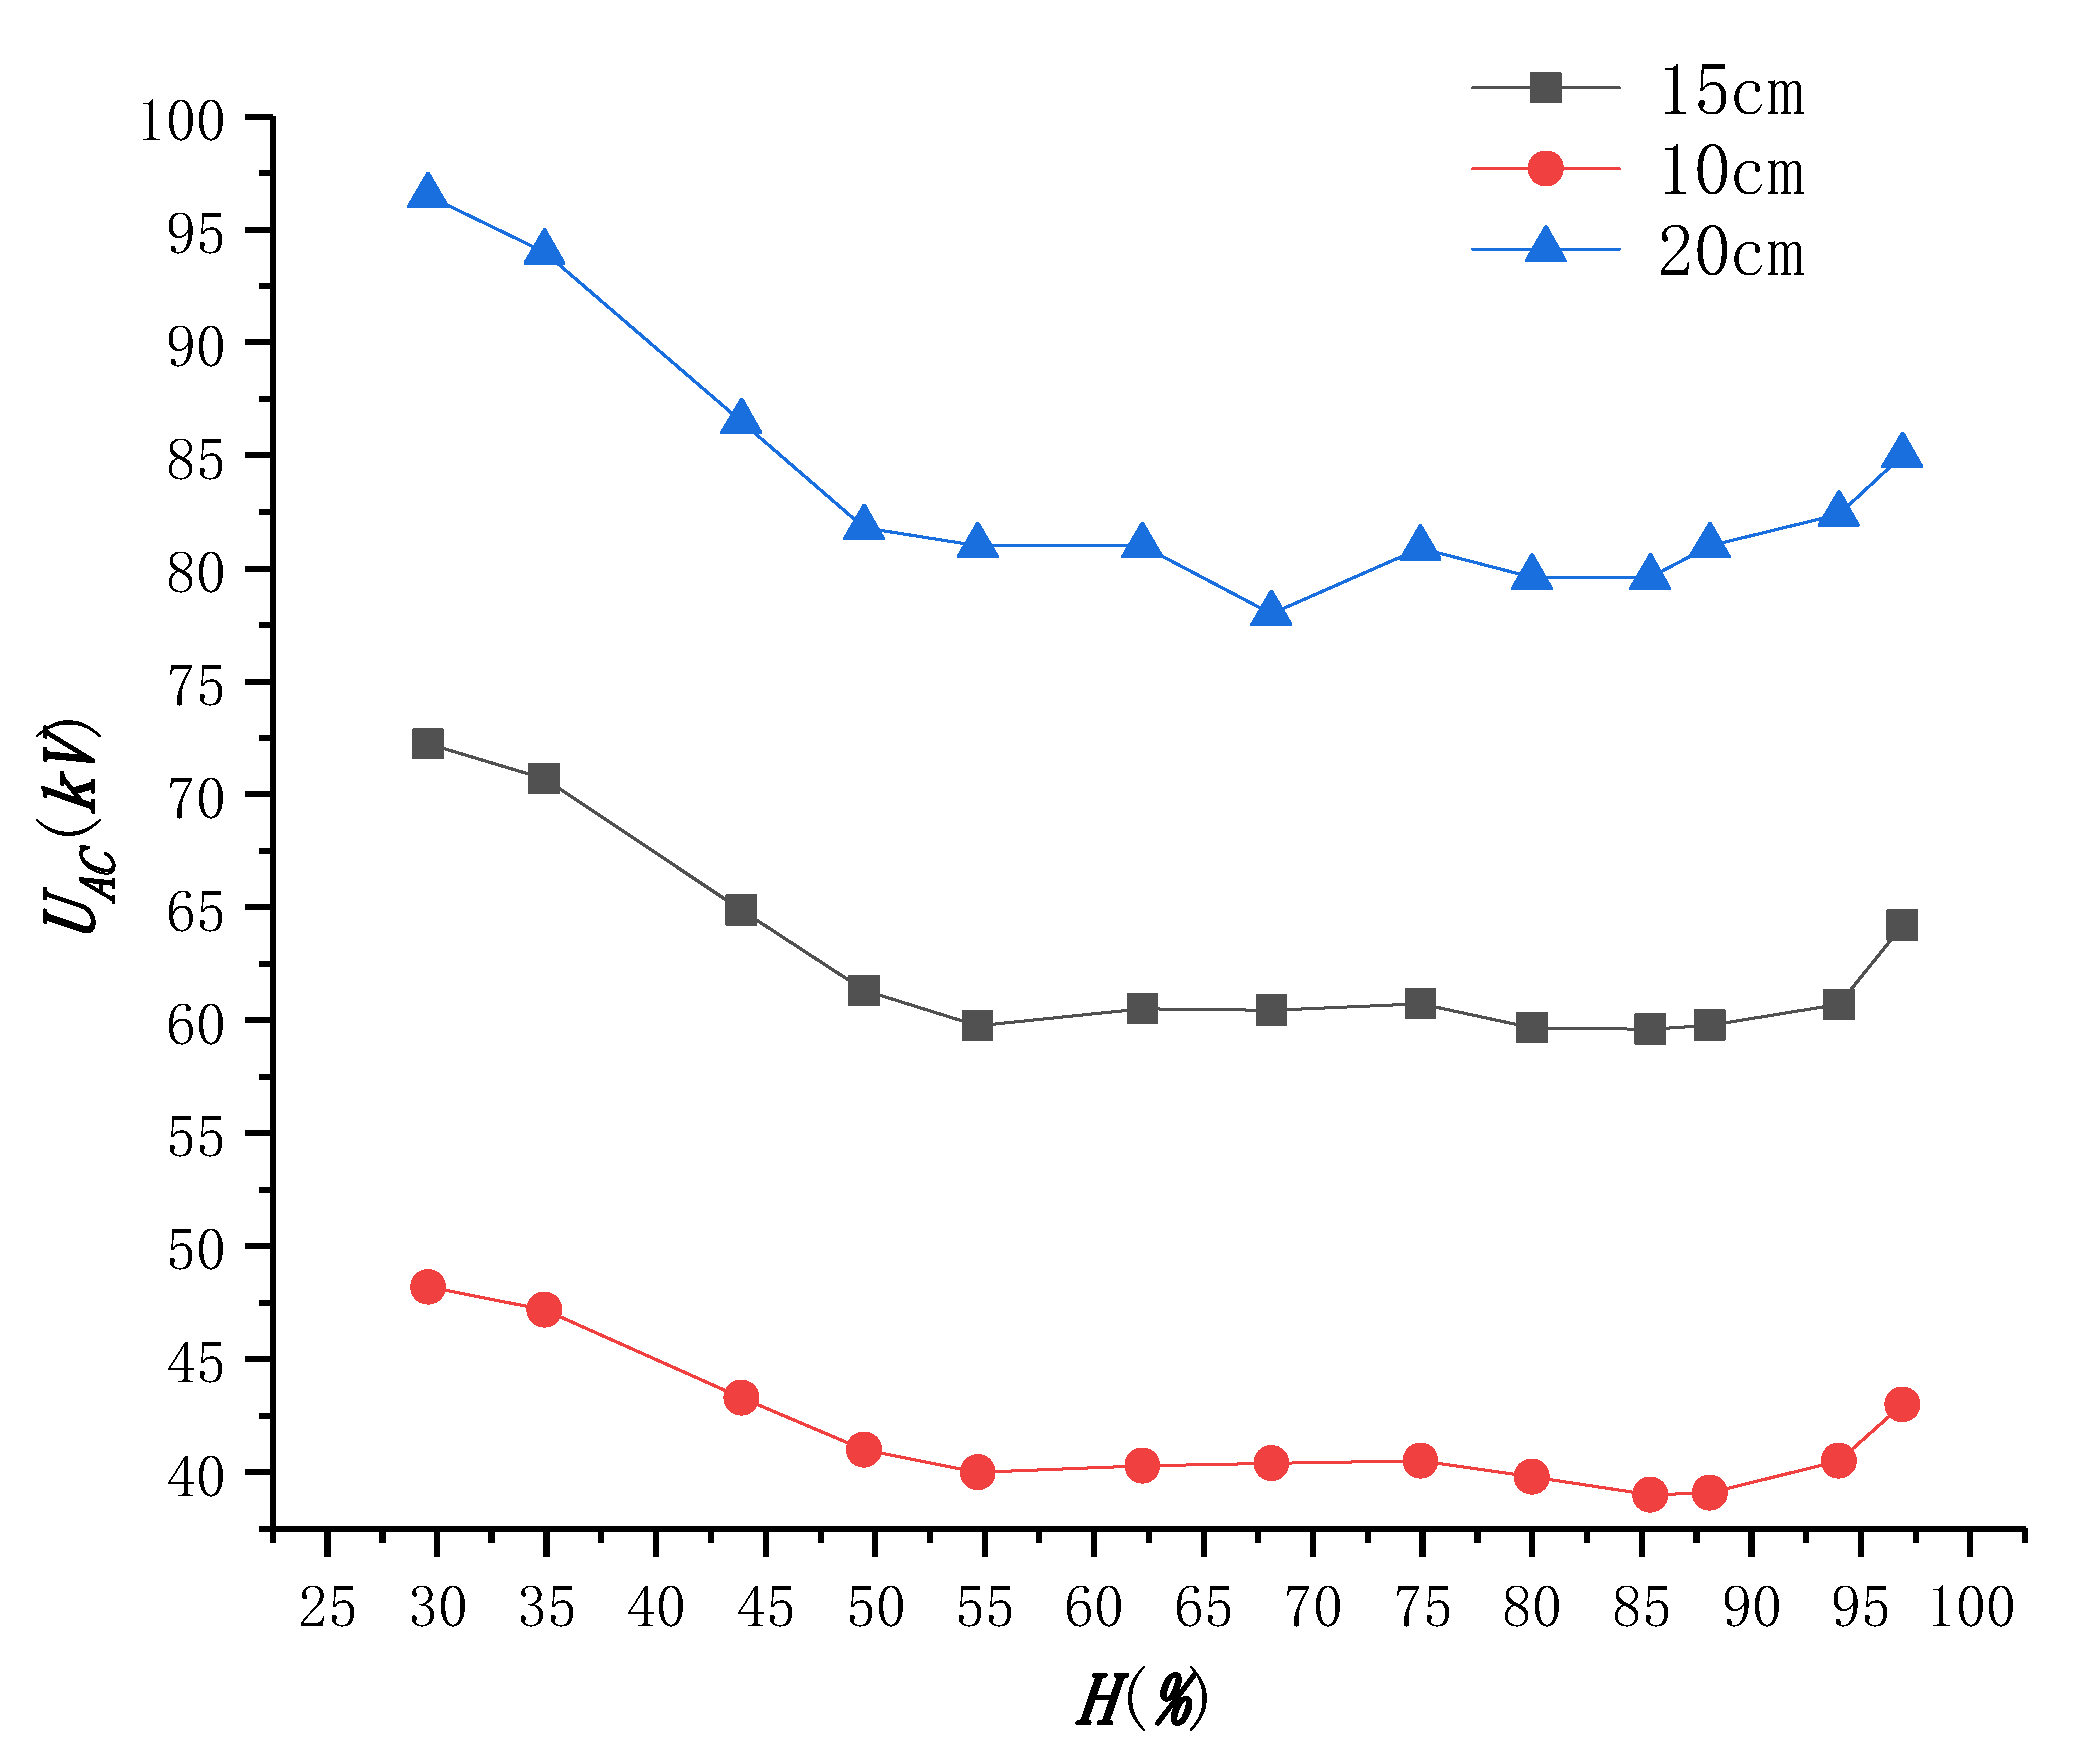
When studying the effect of humidity on breakdown voltage, the air pressure is kept at atmospheric pressure, and the temperature is kept at room temperature; the breakdown voltage UAC data of relative humidity h from 30 to 97% are measured, as shown in Figure 9.
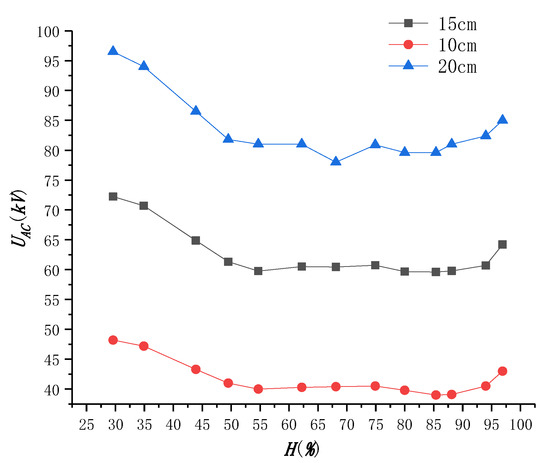
Figure 9.
Gap breakdown voltage under different humidity.
The test results show that the gap breakdown voltage decreases with the increase of humidity at lower humidity and increases with the increase of humidity at higher humidity. For example, at 20 cm gap distance, when the humidity is 5.33 g/m3 (relative humidity 29.6%); the gap breakdown voltage is 96.5 kV, and, when the humidity is 8.9 g/m3 (relative humidity 49.5%) to 15.8 g/m3 (relative humidity 88.1%), the gap breakdown volage fluctuates little and remains at about 80 kV, which is about 17% lower than that of low humidity. When the humidity increases to 17 g/m3 (relative humidity 94%), the gap breakdown voltage increases slightly to 85 kV, about 7%. The influence of humidity on the discharge voltage mainly has two aspects: on the one hand, the increase of absolute humidity increases the number of electron collisions with water vapor molecules and the overall collision ionization coefficient of gas, which makes the discharge develop more violently. On the other hand, the free electrons generated by discharge are adsorbed by water vapor molecules, resulting in the reduction of the number of electrons involved in the ionization process and the increase of the probability of being adsorbed by water molecules. The electron adhesion coefficient η increases with the increase of absolute humidity, which affects the development of discharge. At lower humidity, the former is dominant in the discharge process, resulting in the decrease of breakdown voltage with the increase of humidity. At higher humidity, water molecules have strong ability to adsorb electron ions; the latter is dominant, and the breakdown voltage increases with the increase of humidity.
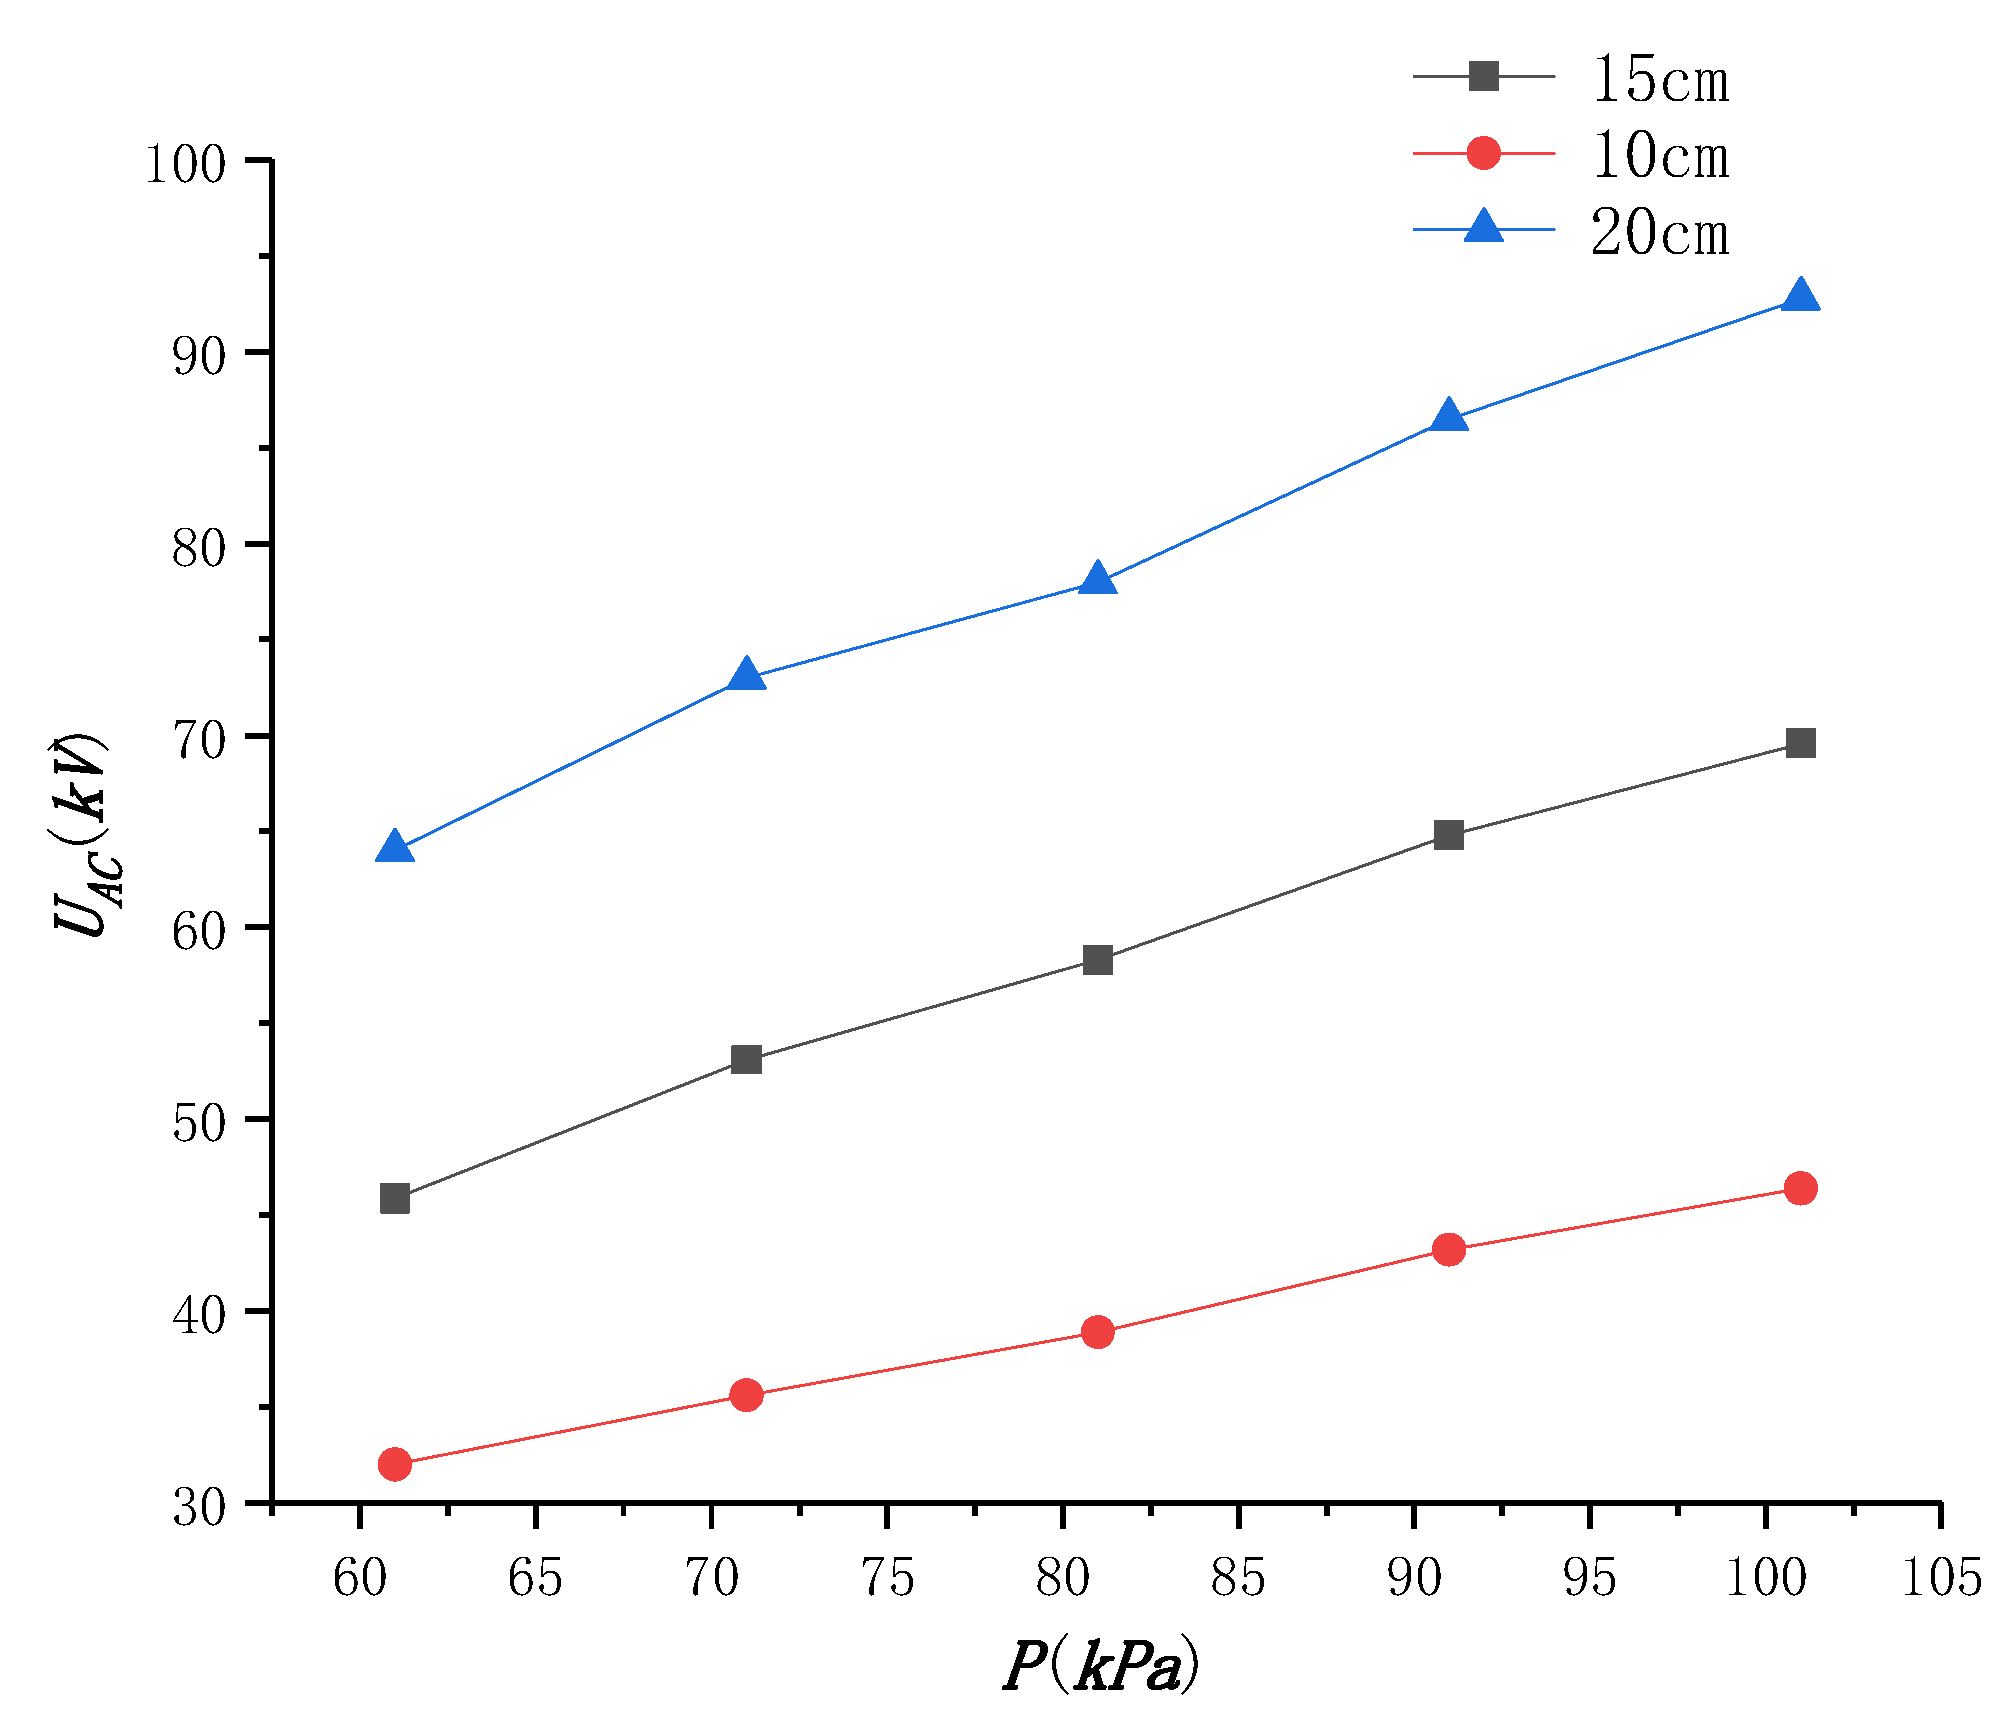
When studying the effect of air pressure on breakdown voltage, the temperature and relative humidity are kept constant, and the breakdown voltage UAC data of air pressure from 60 kpa to 101 kpa are measured, as shown in Figure 10.
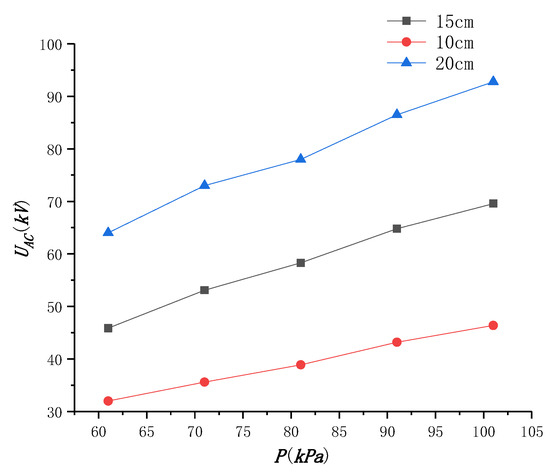
Figure 10.
Gap breakdown voltage at different air pressures.
The analysis of the test results shows that the gap breakdown voltage decreases with the decrease of air pressure. As the air pressure decreases (altitude increases), the air density decreases and the average free travel of electrons increases; electrons can accumulate kinetic energy sufficient to cause ionization between two collisions, which makes it easy to form electron avalanches and aggravate the formation and development of streamers, and the breakdown voltage will be reduced. This is in good agreement with the previous simulation results and also proves the effectiveness of the simulation.
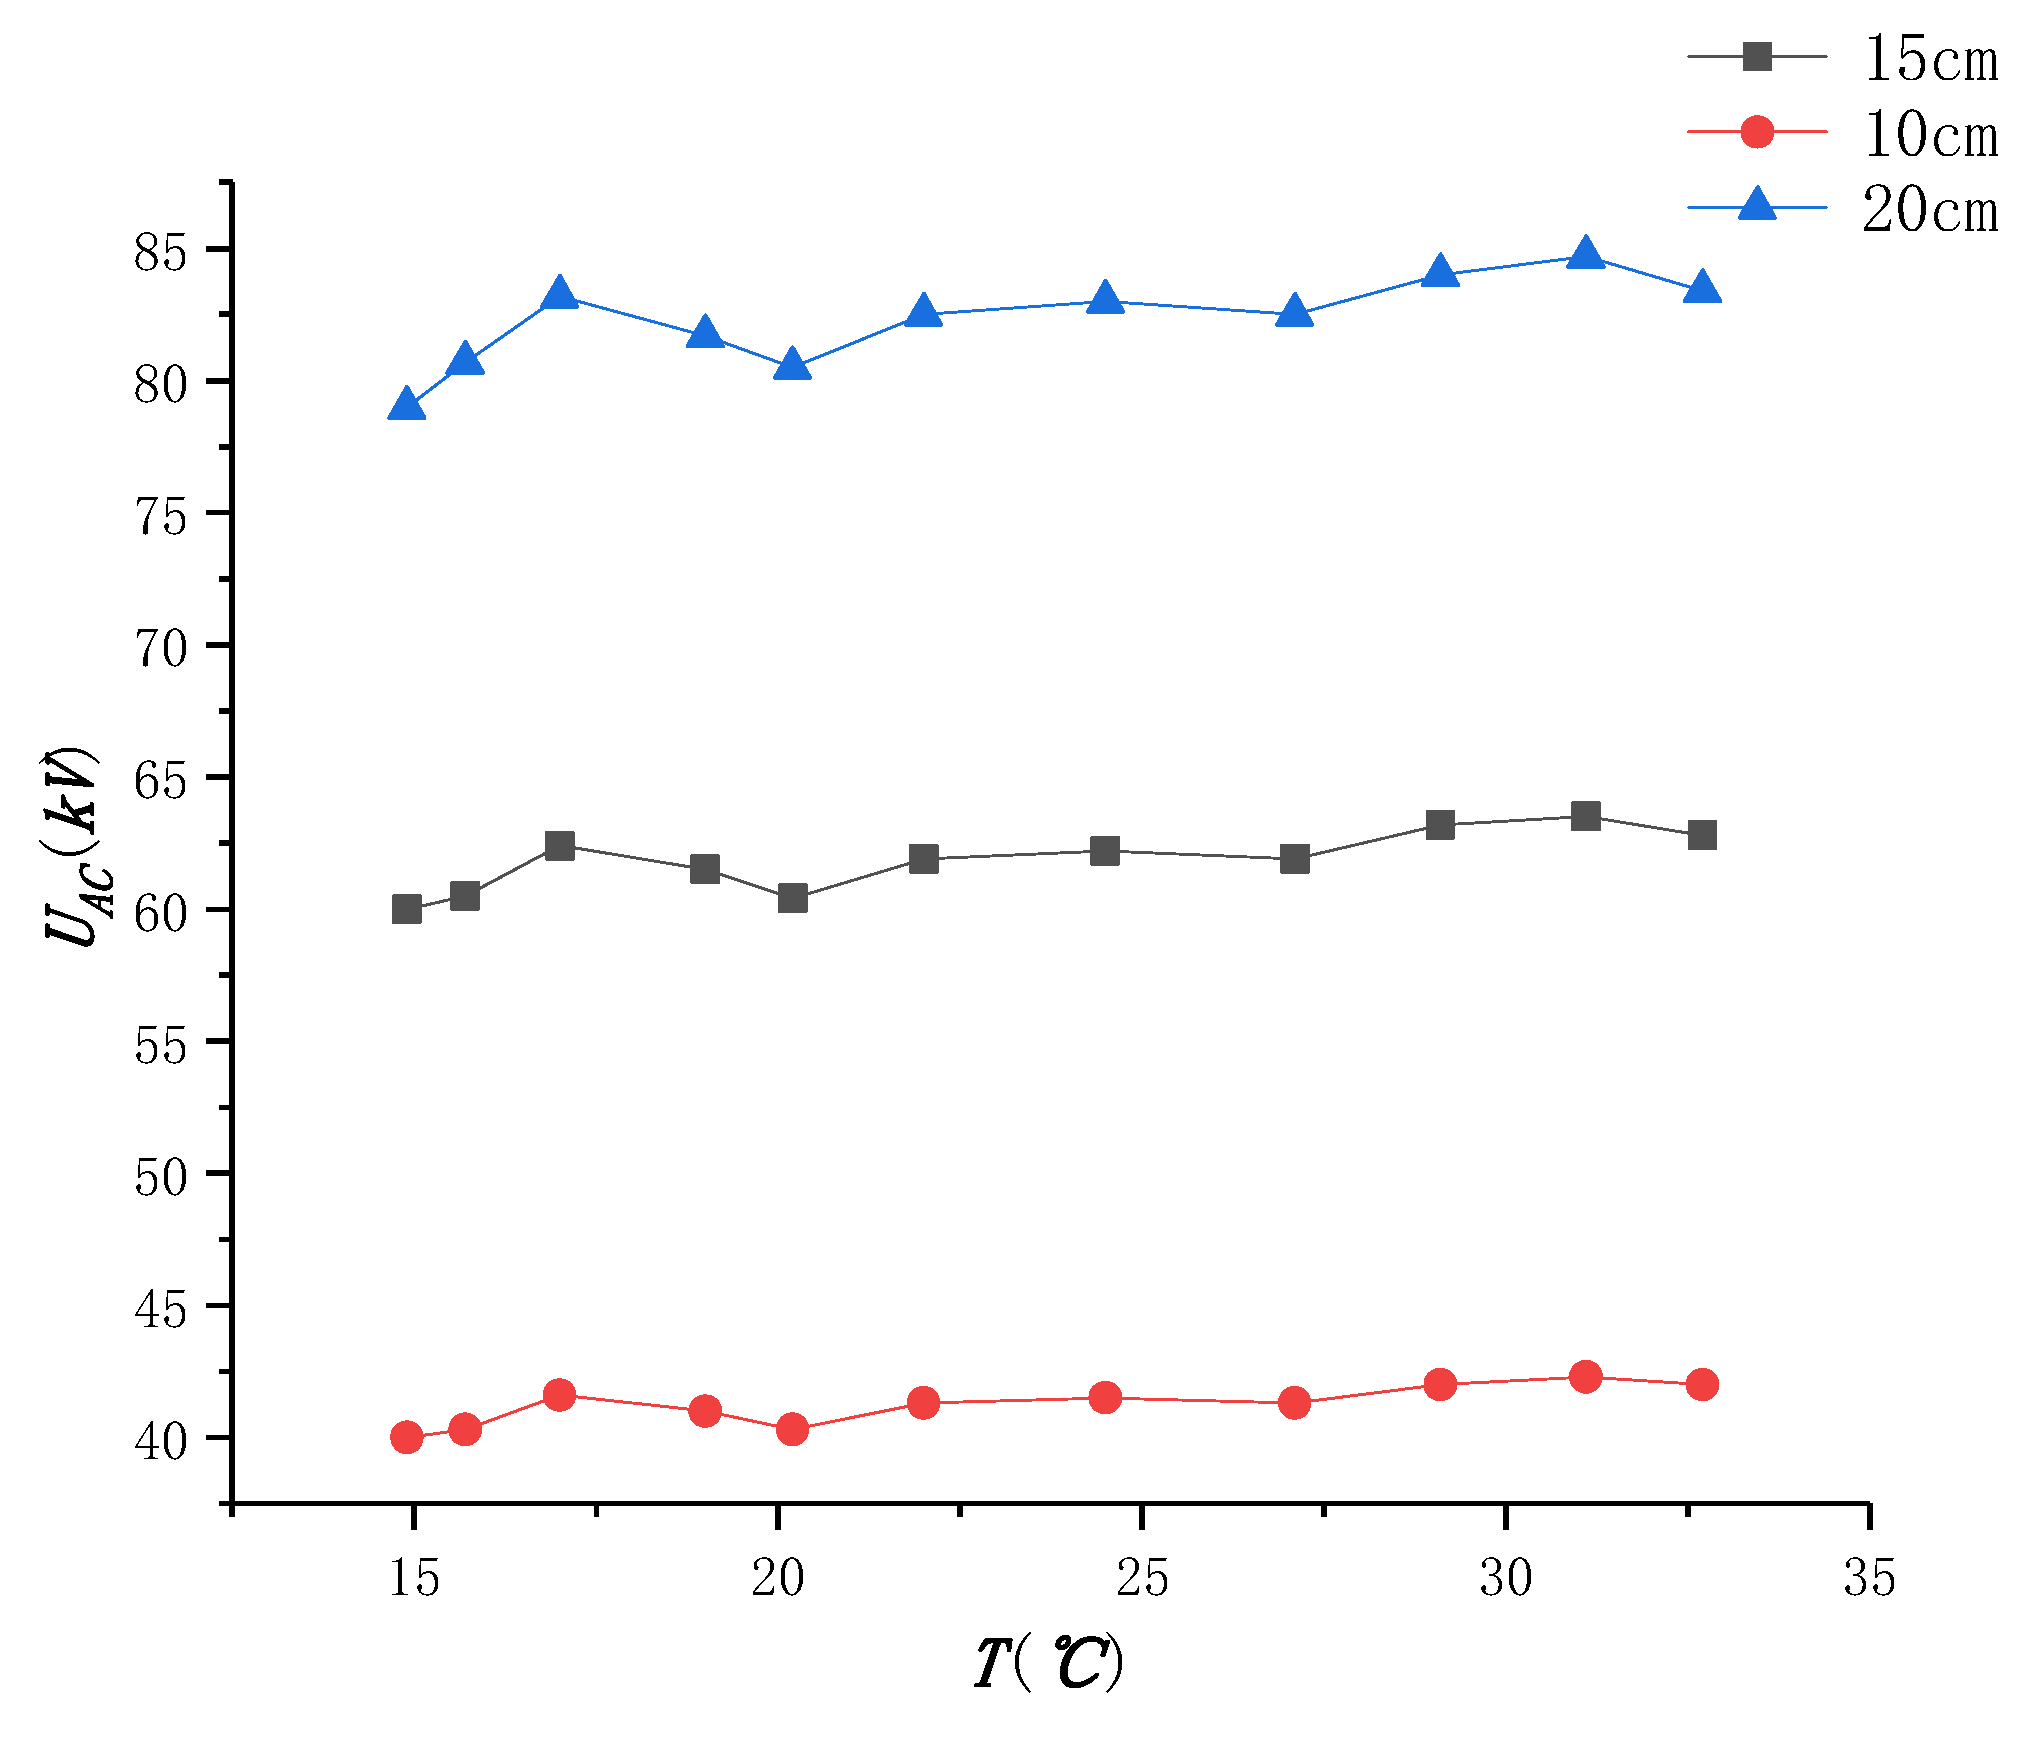
When studying the effect of temperature on breakdown voltage, the temperature and air pressure are kept constant, and the gap breakdown voltage UAC data at different temperatures T are measured, as shown in Figure 11.
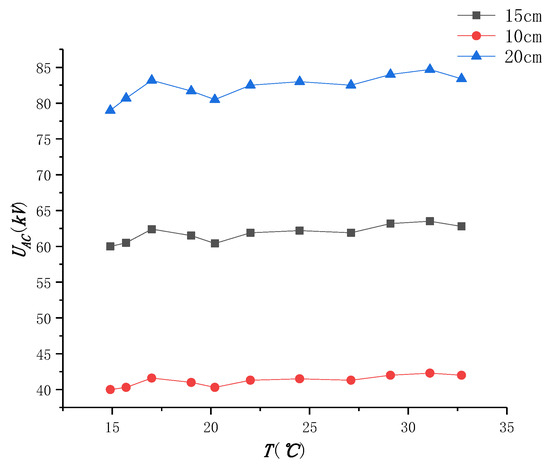
Figure 11.
Gap breakdown voltage at different temperatures.
The analysis of the test results shows that the gap breakdown voltage is not affected by the change of temperature. The change of temperature mainly affects the air density, thus changing the ionization coefficient and adhesion coefficient of discharge. However, within the test temperature range, the change of gas density with temperature is not obvious, so the change of the breakdown voltage is very small.
4.3. Analysis and Discussion
The influence of ambient atmospheric parameters on gap discharge is mainly three parameters: air pressure, humidity, and temperature. Microscopically, the changes of these parameters will affect the ionization coefficient and adhesion coefficient of gas, thus affecting the generation and development process of streamer, and then affect the breakdown voltage of the gap macroscopically.
The change of air temperature affects the discharge by affecting the air density, but its influence on the gas density is not significant within the variation range of atmospheric ambient temperature. It has little influence on the gas discharge parameters in the micro and little influence on the gap breakdown voltage in the macro.
The decrease of air pressure will significantly reduce the air density, increase the free path of electrons, increase the accumulated collision kinetic energy, and significantly increase the streamer development speed, which is conducive to the generation and development of discharge. Macroscopically, the gap breakdown voltage decreases significantly with the decrease of air pressure.
The influence of humidity on gap breakdown voltage is complex. On the one hand, the increase of water molecules will increase the ionization constant of gas; on the other hand, it will increase the adhesion constant of gas. At lower humidity, the former is dominant, and with the increase of humidity, it will promote the development of discharge. At higher humidity, the latter is dominant, and the increase of humidity will hinder the development of discharge. Macroscopically, the gap breakdown voltage decreases first and then increases from dry air to saturated wet air.
5. Conclusions
Based on the streamer theory and particle continuity equation of gas discharge, this paper establishes the simulation model of short gap streamer discharge, simulates and analyzes the influence of environmental parameters on the dynamic development process of streamer discharge, and tests the discharge characteristics of a short gap air gap in a self-made gas discharge chamber. The research conclusions are as follows:
- (1)
- At lower humidity (relative humidity <80%), with the increase of humidity, the electron density of the streamer channel increases, the field strength of the streamer head increases, the development speed of the streamer increases, and the gap breakdown voltage decreases. At higher humidity (relative humidity >80%), with the increase of humidity, the electron density of the streamer channel decreases, the field strength of the streamer head decreases, the development speed of the streamer slows down, and the gap breakdown voltage increases.
- (2)
- With the decrease of air pressure, the electron density of the streamer channel decreases, the field strength of the streamer head decreases, the development speed of the streamer accelerates, and the gap breakdown voltage decreases.
- (3)
- The temperature change has little effect on the streamer development process and gap breakdown voltage.
Author Contributions
Simulation analysis, X.R., X.J., and G.Y.; Test analysis, X.R., Y.H., J.W. and Z.Y. All authors have read and agreed to the published version of the manuscript.
Funding
This research was funded by [the National Natural Science Foundation of China], grant number [51637002], and [scientific research project of the Hunan Provincial Department of Education], grant no. [20C0047]. And The APC was funded by [the National Natural Science Foundation of China], grant number [51637002], and [scientific research project of the Hunan Provincial Department of Education], grant no. [20C0047].
Institutional Review Board Statement
Not applicable.
Informed Consent Statement
Not applicable.
Data Availability Statement
Not applicable.
Acknowledgments
The authors would like to express their gratitude to Chongqing University for their assistance with this research.
Conflicts of Interest
The authors declare no conflict of interest.
References
- Wan, Q.; Huo, F.; Xie, L.; Liu, Y.; Xu, T. Summary of research on flashover characteristics of long air gaps. High Volt. Eng. 2012, 38, 2499–2505. [Google Scholar]
- Chen, W.; Ceng, R.; He, H. Research progress of long air gap discharge. High Volt. Eng. 2013, 39, 1281–1295. [Google Scholar]
- Liu, C.; Zhou, X.; Zhuang, C. Experimental observation of UHV scale real engineering gap operation impulse discharge under two kinds of humidity. Trans. China Electrotech. Soc. 2019, 34, 2239–2246. [Google Scholar]
- Zheng, Y.; Ren, J.; Shu, S. Effect of air humidity on short gap breakdown characteristics under non-uniform AC electric field. High Volt. Eng. 2019, 45, 1352–1359. [Google Scholar]
- Meng, X.; Hui, J.; Bian, X. Study on streamer discharge characteristics at low pressure. Proc. CSEE 2011, 31, 139–149. [Google Scholar]
- Sima, W.; Ye, X.; Tan, W.; Yang, Q.; Luo, B.; Li, L.; Gao, C. Study on lightning impulse insulation coordination between insulator string and parallel gap of high altitude 220kV transmission line. Proc. CSEE 2012, 32, 23–168. [Google Scholar]
- Liao, Y.; Li, R.; Li, X. Experimental study on discharge voltage correction of typical air gap. Proc. CSEE 2012, 32, 171–176. [Google Scholar]
- Ding, Y.; Yao, X.; Wang, S.; Quda, Z.; Li, X. Operating impulse discharge characteristics and altitude correction of typical long air gap in high altitude area. High Volt. Eng. 2013, 39, 1441–1446. [Google Scholar]
- Opaits, D.F.; Shneider, M.N.; Howard, P.J.; Miles, R.B.; Milikh, G.M. Study of streamers in gradient density air: Table top modeling of red sprites. Geophys. Res. Lett. 2010, 37, L14801. [Google Scholar] [CrossRef] [Green Version]
- Nakano, Y.; Kojima, H.; Hayakawa, N.; Tsuchiya, K.; Okubo, H. Pre-discharge and flashover characteristics of impulse surface discharge in vacuum. IEEE Trans. Dielectr. Electr. Insul. 2014, 21, 403–410. [Google Scholar] [CrossRef]
- Fukuoka, Y.; Yasuoka, T.; Kato, K.; Okubo, H. Breakdown conditioning characteristics of long gap electrodes in a vacuum. IEEE Trans. Dielectr. Electr. Insul. 2007, 14, 577–582. [Google Scholar] [CrossRef]
- Bzaelyan, E.M.; Raizer, Y.P.; Aleksandrov, N.L. The effect of reduced air density on streamer-to-leader transition and on properties of long positive leader. J. Phys. D Appl. Phys. 2007, 40, 4133–4144. [Google Scholar] [CrossRef]
- Pancheshnyi, S.; Nudnova, M.; Starikovskii, A. Development of a cathode-directed streamer discharge in air at different pressures: Experiment and comparison with direct numerical simulation. Phys. Rev. E 2005, 71, 016407-1–016407-12. [Google Scholar] [CrossRef] [PubMed]
- Dhali, S.K.; Williams, P.F. Numerical simulation of streamer propaga-tion in nitrogen at atmospheric pressure. Phys. Rev. A 1985, 31, 1219–1222. [Google Scholar] [CrossRef] [PubMed] [Green Version]
- Vitello, P.A.; Penetrante, B.M.; Bardsley, J.N. Simulation of nega-tive-streamer dynamics in nitrogen. Phys. Rev. E 1994, 49, 5574–5598. [Google Scholar] [CrossRef] [PubMed]
- Morrow, R.; Lowke, J.J. Streamer propagation in air. J. Phys. D Appl. Phys. 1997, 30, 614–627. [Google Scholar] [CrossRef] [Green Version]
- Hu, J.; Zhao, Y.; Liu, J. Influence of altitude and humidity on phase to phase insulation corona starting voltage of motor stator winding and its correction test. Proc. CSEE 2020, 40, 7460–7469. [Google Scholar]
- Wang, P.; Xiao, Z.; Wang, X. Characteristics of discharge initiation delay under high altitude positive operating wave. High Volt. Eng. 2021, 34, 100–108. [Google Scholar]
- Wang, S.; Li, W.; Jiang, T.; Niu, L.; Lv, F.; Li, N. Experimental study on the influence of environmental factors on corona discharge ultraviolet imaging detection. High Volt. Eng. 2021, 47, 504–511. [Google Scholar]
- Mao, G.; Gao, L.; Zhang, M. SF_ (6)/N_ (2) Lightning impulse discharge characteristics and synergistic effect of mixed gas. High Volt. Eng. 2021, 16, 258–268. [Google Scholar]
- Lu, T.; Shen, N.; Su, Z. Review of research on ion flow field characteristics of HVDC transmission line considering the effects of altitude, humidity and particulate matter. China South. Power Grid Technol. 2021, 15, 46–58. [Google Scholar]
- Luo, B.; Wang, J.; Dai, D.; Jia, L.; Li, L.; Wang, T. Partial Discharge Simulation of Air Gap Defects in Oil-Paper Insulation Paperboard of Converter Transformer under Different Ratios of AC–DC Combined Voltage. Energies 2021, 14, 6995. [Google Scholar] [CrossRef]
- Duro, A.; Piccione, V.; Ragusa, M.A.; Veneziano, V. New enviromentally sensitive patch index—ESPI—for MEDALUS protocol. AIP Conf. 2014, 1637, 305–312. [Google Scholar]
- Association, K.S. High-Voltage Test Techniques-Part 1: General Definitions and Test Re-Quirements: IEC 60060-1: 2010; IEC: Geneva, Switzerland, 2010. [Google Scholar]
- Standards, S. Insulation Co-Ordination—Part 2: Application Guide; IEC: Geneva, Switzerland, 1996. [Google Scholar]
- Seeger, M.; Votteler, T.; Ekeberg, J.; Pancheshnyi, S.; Sanchez, L. Streamer and leader breakdown in air at atmospheric pressure in strongly non-uniform fields in gaps less than one metre. IEEE Trans. Dielectr. Electr. Insul. 2018, 25, 2147–2156. [Google Scholar] [CrossRef]
- XingMing, B.; JunYu, Z.; Wei, Y.; ShuWei, W.; Lei, Q.; XueBao, L.; HaiBing, L. The role of low air pressure in the variation of negative corona-generated space charge in a rod to plane electrode. High Volt. 2018, 3, 126–132. [Google Scholar] [CrossRef]
- Davies, A.J.; Davies, C.S.; Evans, C.J. Computer simulation of rapidly developing gaseous discharges. Proc. Inst. Electr. Eng. 1971, 118, 816–823. [Google Scholar] [CrossRef]


Publisher’s Note: MDPI stays neutral with regard to jurisdictional claims in published maps and institutional affiliations. |
© 2022 by the authors. Licensee MDPI, Basel, Switzerland. This article is an open access article distributed under the terms and conditions of the Creative Commons Attribution (CC BY) license (https://creativecommons.org/licenses/by/4.0/).