Abstract
Accurate prediction of building energy need plays a fundamental role in building design, despite the high computational cost to search for optimal energy saving solutions. An important advancement in the reduction of computational time could come from the application of machine learning models to circumvent energy simulations. With the goal of drastically limiting the number of simulations, in this paper we investigate the regression performance of different machine learning models, i.e., Support Vector Machine, Random Forest, and Extreme Gradient Boosting, trained on a small data-set of energy simulations performed on a case study building. Among the XX algorithms, the tree-based Extreme Gradient Boosting showed the best performance. Overall, we find that machine learning methods offer efficient and interpretable solutions, that could help academics and professionals in shaping better design strategies, informed by feature importance.
1. Introduction
Indoor heating and cooling of buildings are among the most energy consuming activities in Europe [1] and a few important laws, acts and regulations aim at reducing their environmental impacts [2]. A variety of approaches try to address this issue, such as the creation of new energy saving materials, the imposition of progressively stricter requirements, and the realisation of more efficient systems and equipment [3].
Among the most relevant ones, we find building energy simulations, characterizing different scales [4] and in different locations [5,6]. Computer programs like EnergyPlus [7] simulate different building configurations, returning precise and accurate results that take into account all variables affecting building energy consumption for the indoor climate control (e.g., envelope materials, orientation, systems, weather data). The simulations are often performed for decision making in the design phase, and given the high number of variables to consider, a huge number of simulations is usually necessary before identifying the most suitable and efficient solutions. Even though a single simulation is relatively fast (taking from a few seconds up to a couple of hours depending on the modelled building and the adopted computer), each simulation requires an operator who inserts, analyses, assesses, makes decisions, leading to a time consuming process that needs constant human supervision to avoid unintended effects [8,9,10].
As improvement, some authors automatised the exploration of all the possible configurations initially set. This method requires a limited preliminary work and it is efficient to both explore the field of possible solutions and to analyse the relationships among the different variables [11]. However, since the common aim is to identify the best performing solutions (such as the lowest energy consuming), a valid alternative method is represented by the introduction of optimisation algorithms. For example, procedures based on genetic algorithms [12] are proven to be solid and efficient results, limiting manual labour. This approach proved to be effective in a wide range of cases, such as for envelope optimisation [13], material choice [14], net-zero energy solutions [15], and even in multi-objective researches [16]. Genetic algorithms require time consuming exploratory work since several parameters must be evaluated and selected (e.g., number of individuals, number of generations, mutation and crossover coefficients). Both strategies—i.e., automatised code and algorithm—strongly reduce the need of the operator work per simulation [17]. However, in case of particular building configurations (e.g., presence or absence of particular material), these methods fail to ease the operator work.
An important source of help can come from the application of Machine Learning (ML) models for regression [18]. ML methods take advantage of automatic adjustments based on observations to approximate a target function [19]. The effectiveness of these methods relies upon the number and quality of available data, but they proved to be extremely effective in a wide series of cases, ranging from the agro-industrial sector [20], energy sector—even for inefficiencies [21], uncertainties [22] and prediction [23], computer vision [24], to pipeline engineering [25] or speech recognition and fraud detection [26,27], where it is unfeasible (or even impossible) to develop conventional algorithms.
In this work, the input features are the case study building characteristics summarised in Table 1, described in Section 2.1, while the target function is the yearly energy demand, provided by EnergyPlus simulations.

Table 1.
List of the features considered in the modeling. The first column reports the name of the variable, the second column shows the variable abbreviations (used hereinafter), the third column specifies if the variable is inserted by the user (U) or calculated by the software (S), the fourth column provides the variable unit.
Because both the input features and the target function are known, the framework of the study is called supervised learning, as opposed to unsupervised learning or reinforcement learning, where the target function is unknown.
This manuscript aims at investigating the effectiveness of the application of ML models to predict the energy consumption of specific building solutions, avoiding to directly run simulations with an energy software. As additional investigation, we show how ML feature importance can rank the impact of the different building variables on the energy need.
This approach can be considered an integration to the above said methods taking advantage of the huge number of simulations necessarily run by the algorithms.
As case study, we used the numerical model of a winery building, calibrated in a previous work [28].
Different features concerning the building envelope and the building orientation, have been considered as variables (see Table 1). The thermostat—established in the range 12 C–18 C—the location and the weather data, are the same for all the models and the simulations. The specific goal of the paper is to verify if linear and non-linear ML models can provide accurate evaluations of the building energy consumption, thus avoiding the time-consuming numerical simulations.
2. Materials and Methods
2.1. Case Study Description
The case study building considered in the present work is an agro-industrial building located in Toscanella di Dozza, in the countryside close to Bologna (Italy).
The case study facility is shown in Figure 1. Currently, it has two different uses: wine making process and wine bottle storage before the sale to the customers. The winery has plant dimensions of 20 m × 30 m, precisely longitudinal dimension equal to 27.75 m, transverse dimension equal to 18.50 m and has a double-arched cross section with variable height from 5.50 m to 7.00 m at the ridge line. Six reinforced concrete internal pillars (with 5.55 m of spacing) are positioned along the main axis and separating the main volume into two symmetrical portions divided by a line of wine tanks. The selected case study is a representative precast building of the Emilia-Romagna Region. In fact, facilities like the one described above are recurrent in the Emilia-Romagna territories in terms of dimensions, proportions, indoor volume and materials. The buildings is realised with traditional and poor materials characterised by low thermal performances. The perimeter envelope is realised by concrete bricks having 32 cm of thickness and plastered with cement-based mortar. The flooring reinforced concrete slab of the volume of the production activities is 30 cm thick. The roof of the winery is constituted by a non-insulated reinforced concrete slab connecting the various precast arches. The building is naturally ventilated and no air-conditioning or ventilation systems are present. Finally, the fixtures of the windows have very poor thermal performance since they are single glazed.
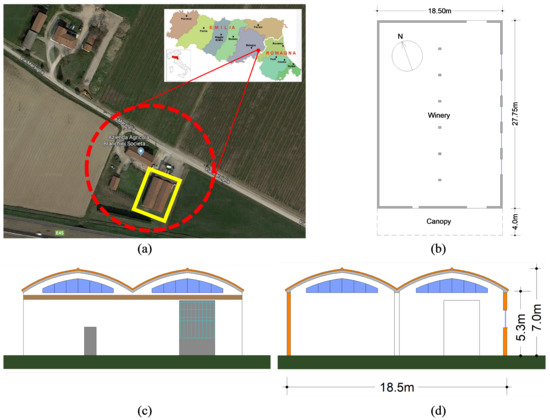
Figure 1.
The case study building: (a) the location of the case study at regional and national scale. (b) the layout of the building. (c,d) the South and North front of the building with the main measures.
2.2. Energy Modelling and Simulations
This work took advantage of building energy simulations performed by EnergyPlus 9.2 [7]. The base-model (see Figure 2) was created and experimentally validated in Barbaresi et al. [29]. To define the building envelope thermal performance, the software requires to insert wall and roof characteristics (constructions), window thermal transmittance (Ug) and air infiltration. The orientation can be inserted as an input data as well.
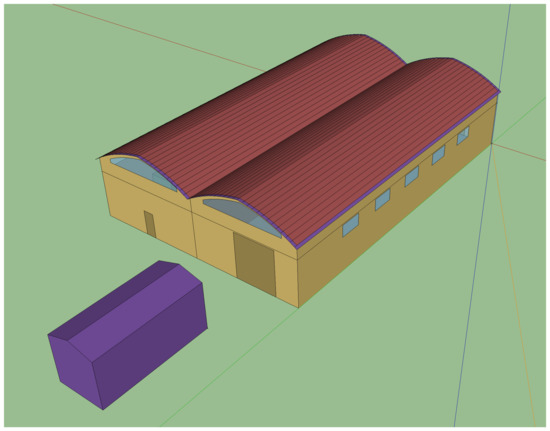
Figure 2.
A view of the base model created with the Sketch-Up plugin.
The constructions are defined by inputting the materials that physically make the element, and their characteristics (i.e., thickness, thermal resistance, density and specific heat). Other thermal characteristics (like thermal transmittance, superficial mass, thermal lag, attenuation) are calculated by the software and then used for the simulations.
To simplify the procedure and, at the same time, to explore a significant number of different envelope solutions, wall and roof constructions are built as one-material constructions (one for wall and one for roof) with thickness equal to 20 cm and with different thermal resistance, density and specific heat. Then, three properties for wall, three properties for roof, glaze transmittance, air infiltration and orientation were randomly extracted from continuous uniform distributions within boundary conditions defined by values of products on the market. The thermostat range was set at 12–18 C.
A significant number of models (5150) were created using a MatLab [30] code. The same code extracts the feature values and then elaborates the results of the simulations. At the end it returns the 19 values extracted for the features and used in the simulation and the ideal total energy needed to keep the temperature into the thermostat range.
2.3. Sensitivity Analysis
A sensitivity analysis was preliminary performed to provide indications on the most suitable features (i.e., regressors) to investigate. After the 5150 simulations were run, the distributions of the 19 input features were analysed and 10th, 25th, 50th, 75th and 90th percentiles were calculated and used for the sensitivity analysis.
A model using the values referred to the 10th percentile was created and a first sensitivity analysis was performed varying the feature one by one. The same procedure was repeated to perform a second sensitivity analysis on a model created using the 75th percentile.
Analysing the features separately, the graphs reported as a representative example in Figure 3 show, as expected, a clear non-linear relation between feature values and thermal need values for most of the variable features adopted in the study. On the other hand, comparing the two sensitivity analyses, the two sets of graphs highlight that the regression curve coefficients for the single feature strongly depend on the other features’ values (i.e., not negligible interactions exist between different features).
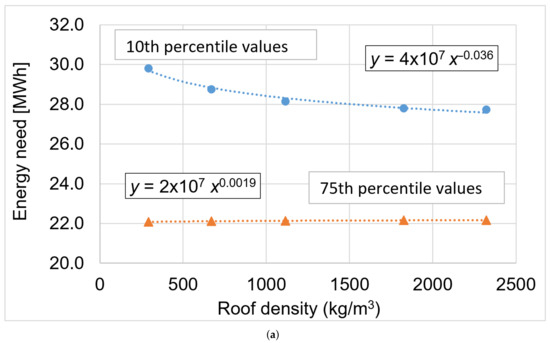
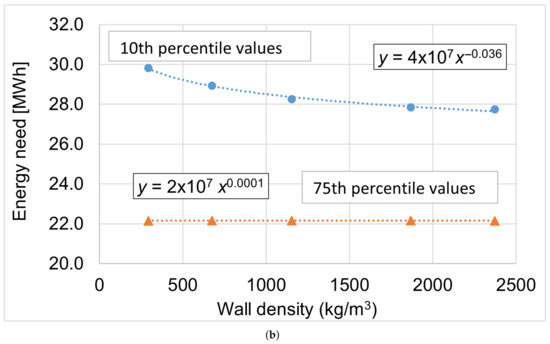
Figure 3.
Main results of the sensitivity analysis. (a) Trends of the energy need for different values of the roof density. (b) Trends of the energy need for different values of the wall density.
The results of the sensitivity analyses confirm the necessity to investigate multi-non-linear regressors besides the multi-linear one, that in some applications, e.g., when the problem is almost linear or when the analyses consider only a limited portion of whole domain, could return acceptable results. Anyway, multi-non-linear regressors are expected to be more precise.
2.4. Feature Selection
An important step in ML problems is the feature selection. Indeed, in many applications, it is common to deal with data set with a large number of features: depending on the task, this number can often be reduced in favour of a smaller space to learn, since the number of necessary training data grows exponentially with the feature space dimensionality [26]. This can be proven beneficial in a number of ways:
- the computational cost is reduced;
- the number of necessary training data is reduced;
- the redundant information are removed;
- fewer features often means simpler models and more explainable results.
The first part of the feature selection procedure involves removing constant features: even though they are essential to the software simulation with EnergyPlus, the ML model cannot learn anything from them. The second part of feature selection has been carried out by means of the analysis of the values in the Spearman correlation matrix (see Section 3.1), by removing features with correlation coefficient higher than and lower than , preferring the variables inserted by the users (labelled with U in the third column of the Table 1) with respect to those calculated by EnergyPlus (labelled with S in the third column of the Table 1). Finally, the 11 features chosen as input for the models are those summarised in Table 2.

Table 2.
Features selected for the regression models where: first column reports the variable considered in the work, the second column reports the variable abbreviations used hereinafter, the third column specifies if the variable is inserted by the user (U) or calculated by the software (S), the fourth column provides the variable unit.
2.5. Model Selection
The following step of the study was to select the best regression model for the task. Four models were trained and tested via nested cross-validation to avoid over-fitting and optimise the hyper-parameters [31]. The outer cross-validation was performed on 3-fold while the inner cross-validation on 5-fold. In the inner cross-validation section a grid-search for best values of hyper-parameters was performed. The best model was evaluated and compared in terms of four metrics: computational time, Mean Absolute Error (MAE), Mean Squared Error (MSE) and (see Section 3.2). Given a target vector y and a model output vector , the latter three metrics has been computed as:
The tested models were: Linear Regression (LR), Random Forest (RF), Support Vector Machine (SVM) and EXtreme Gradient Boosting (XGB), briefly described in the next paragraphs. During the analysis a Multi-Layer Perceptron (or Neural Network) was tested, but the large hyper-parameters space required too much time to be explored.
2.5.1. Linear Regression
Linear Regression (LR) is the most simple and explainable class of methods for fitting data. The general definition of a linear model is a linear combination of input features:
where the coefficients has been determined by minimising the sum of squared error between the observed targets and the values predicted by linear approximation (Ordinary Least Squared method), without any regularisation. Given the j-th target of the data-set, the j-th predicted value and by defining the error function as:
where M is the number of samples in the training set, then the values of with can be determined by solving the following equation:
It has been implemented using the LinearRegression object of the python library scikit-learn.
2.5.2. Random Forest
Random Forest (RF) is a supervised machine learning algorithm based on the concept of bagging. Bagging methods combine the predictions of multiple base model in order to improve the generalisation capabilities and the robustness over a single estimator [32]. A RF is composed of many Decision Trees (DT) each trained on the same set of data. In this way, the final prediction is not decided by a single estimator, but on the voting of multiple DTs. On average, a combined estimator is better than the single estimator because the variance of its decision is reduced. Again, RF has been implemented using the Random Forest Regressor object of scikit-learn.
2.5.3. Extreme Gradient Boosting
EXtreme Gradient Boosting (XGB) is a boosting supervised ML algorithm that has been successfully employed in many data mining competition with tabular data set. Boosting methods, similarly to Bagging methods, are composed of many base models, but instead of acting by votes, each base model learn the residuals of the previous one, and correct them. For XGB, the base model is again a DT. The full implementation of XGB is open-source and can be found in the original paper [33].
2.5.4. Support Vector Machine
Support Vector Machines (SVM) are kernel based algorithms for supervised regression or classification. Kernel based method are generally fast to train but slow at making predictions for test data point [26]. SVM are very flexible since different kernel can be specified as decision function and they work well even on very high dimensional spaces. Originally, SVMs were devised as classification algorithms able to find the decision boundary between two groups which maximises the perpendicular distance between this hyperplane and the closest of the data points. SVM can be generalized to regression problems and in this case is called Support Vector Regression (SVR). Training a linear SVR means solving:
subject to the constraints:
where is a free parameter used as a threshold and is a linear function as for Equation (2).
2.6. Model Validation
Given the results, XGB has been re-trained from scratch with a grid-search -fold cross-validation on of the data set (3862 experiments) and the best hyper-parameters has been tested on (1288 experiments), randomly selected. The results are presented in Section 3.2. The coefficient of determination has been computed as in Equation (1). The residuals were computed as:
for with N being the number of data in the test set, y being the target vector and the model output vector.
2.7. Feature Importance
Feature importance estimation is a fundamental step in model interpretability and validation. The impact of each feature on model output has been estimated using the python library SHAP (SHapley Additive exPlanations) [34]. SHAP is a game theoretic approach to interpret model output based on Shapley Values [35]. Shapley values are a system to distribute a reward in an n-persons game. Let’s call the characteristic function that maps subset of players into real numbers . If S is a coalition of players, is the total worth (or payoff) the coalition can obtain by collaboration. A Shapley value is the fair reward based of the contribution of each player to the coalition. For player i its reward can be computed as:
where N is a set of n players and the sum extends for each subset S of N which doesn’t contains player i. SHAP provide a model agnostic framework to compute features impact based on their contributions on the model output. SHAP values has been computed using the TreeExplainer for XGB [36] for each observation in the data set.
3. Results and Discussion
In the present Section the main results are reported and discussed. The first conducted analysis aims at identifying the features (i.e., the variables) that must be taken into account in the work (see Section 3.1). The ML models were used to return the building energy consumption for different building configurations. The quality of the ML models was assessed in terms of both precision and computing time (see Section 3.2). For this part 5150 simulations were used. The best performing model was validate in the Section 3.3. Finally, to show one of the possible use of the results of this paper, the selected model has been used to calculate the features’ importance in the Section 3.4.
3.1. Feature Selection
Figure 4 shows the features of the data set and summarises how they are correlated between them.
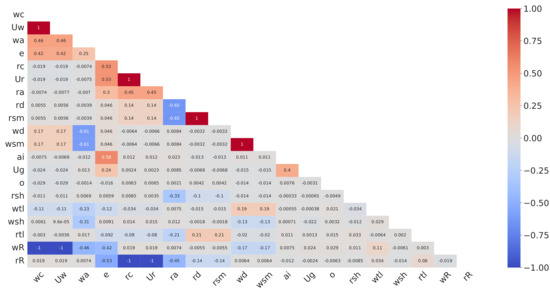
Figure 4.
Spearman correlation matrix. It shows how a variable is correlated with each other. Since it is symmetrical, only the lower triangle is shown. The feature dropped from the data set were: attenuation, superficial mass, transmittance and conductivity for both roof and wall elements.
Some features, i.e., attenuation, superficial mass, transmittance and conductivity resulted to be strongly correlated with other features, and for this reason they were excluded, for both roof and wall, from the following analyses. In this process, since the energy need is the target, it was maintained.
3.2. Model Selection
Figure 5 shows the results of a nested cross-validation on four regression models, namely Support Vector Regressor, Random Forest, Linear Regression and EXtreme Gradient Boosting. The comparison between different models is proposed in terms of MAE, MSE, coefficient of determination and computational time, computed on the test set:

Figure 5.
(a) Average MAE; (b) average MSE; (c) average and (d) average prediction time for the models, computed on each fold of the outer cross-validation.
From the graphs it can be seen that XGB outperforms all the other models in every metrics. Only for the Prediction Time metrics, XGB is the second fastest, behind the linear model. This was expected since the linear model prediction is obtained as weighted sum, a very fast operation from a computational point of view. Considering the whole results, the XGB algorithm was selected as the most suited for the task and it has been further validated and explored.
3.3. Model Validation
Figure 6 shows the plot of true vs. predicted energy values and the residual distribution as a function of the true energy values. The predicted vs. true energy plot shows that XGB predicts values well adhering to the line. This is confirmed by the high value of equal to 0.994. On the other hand, plot of residual values vs. true energy values highlights that errors increase with energy values, which may be attributed to a lower data density (in both training and test set).

Figure 6.
Results of the XGB model in the test set. (a) Predicted vs. True energy values and (b) Residuals vs. True energy values.
To further explore and validate the robustness of the model, we computed the SHAP (SHapley Additive exPlanation) values [34] allowing to score feature influence.
3.4. Feature Importance
To estimate feature importance is a fundamental task in model validation. Figure 7 shows the influence of each feature on the model outputs.
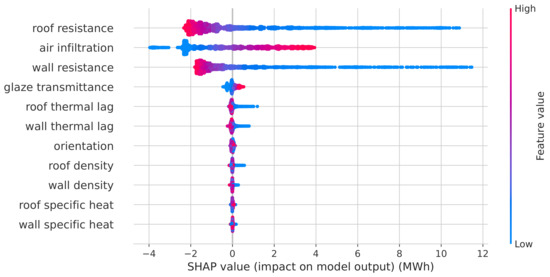
Figure 7.
SHAP values of each feature computed from all the observations in the data set. The different colours indicates the feature value, i.e., from low to high value.
The variables are ranked on the basis of their average absolute SHAP values obtained for each observation of the data set. This graph shows that in computing the energy need the model judges roof resistance, wall resistance and air infiltration as most influential features, since it attributes them the highest SHAP values. Moreover, it clearly shows trends between the feature values and their corresponding impact: lower values of roof resistance and wall resistance have a positive impact (it increases energy need) while high values have a negative impact (it lowers energy need). On the other hand, the air infiltration feature has an opposite behaviour on the energy balance of the building.
Moreover, it is worth to note that wall and roof resistance have a maximum negative impact on the energy behaviour of the building characterised by SHAP values about equal to (see in the figure the high concentration of points around that value). In order to better grasp the energy behaviour of the building, the next paragraphs investigate the relationship between impact on model outputs and feature values for the three most influential features.
In Figure 8 are shown the SHAP value trends for the roof resistance feature for the different values of wall resistance, which is the feature having more interactions with the roof resistance, in order to highlight the interactions between the two features.
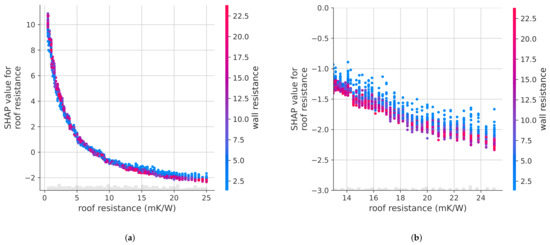
Figure 8.
Trends of roof resistance SHAP values vs. roof resistance values. The different colours represent different values of wall resistance. From left to right: (a) Whole range of the roof resistance values. (b) Detail of portion of the plot with the highest interactions between the two features.
As first, the plot of SHAP values shows that roof resistance has a negative impact on the predicted energy balance only for roof resistance values mK/W, while roof resistance has a positive impact for higher values. Moreover, the relationship is clearly non-linear. The gain of impact on predicted energy balance get progressively lower with the increase of the roof resistance value and the minimum value of the impact is about MWh. In addition, there are strong interactions between wall and roof resistance. e.g., for the same value of roof resistance the different SHAP values provided by the model can be attributed to the variations of wall resistance. Similar considerations can be provided for the wall resistance, as shown in Figure 9.

Figure 9.
Trend of wall resistance SHAP values vs. wall resistance values. The different colours represent different values of roof resistance. From left to right: (a) Whole range of roof resistance values. (b) Detail of portion of the plot with the highest interactions between the two features.
Again, the impact on the outputs of the model becomes negative for wall resistance values mK/W, whereas the interaction with roof resistance is considerable for wall resistance values mk/W. Also in this case, the maximum negative impact seems to approach the asymptotic SHAP value of MWh for the highest wall resistance values.
On the other hand, as shown in Figure 10, the relationship between air infiltration and its SHAP values is almost linear, and the scatter plot highlights a weak interaction with the roof resistance feature, even though the latter is the feature most interacting with air infiltration.
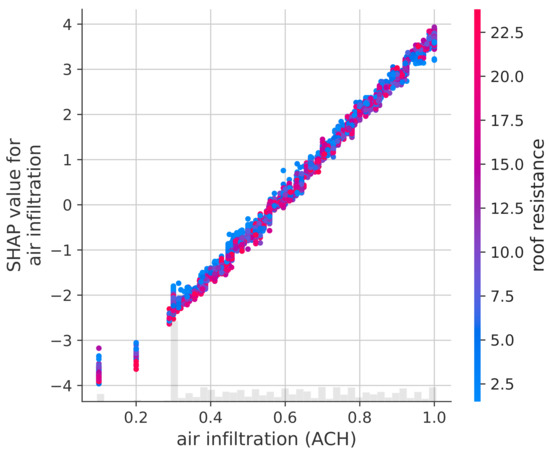
Figure 10.
Trend of air infiltration SHAP values vs. air infiltration values. The different colours represent different values of roof resistance.
The process of model selection (see Section 3.2) tested four regression models returning some important findings. First of all, even though the accuracy of linear model can be acceptable for rough predictions, the non-linear models perform better than linear model, as expected by the interpretation of the results of a preliminary sensitivity analysis (see Section 2.3). Moreover, analysing the simulation time, all the tested models take fractions of second to complete thousands of simulations. Comparing this result with the time taken by the EnergyPlus simulations (20 s for one simulation computed by the computer), it is possible to say that ML model predictions can be considered instantaneous for the user and therefore they eliminate the waiting time between simulations.
The model validation shows the high accuracy and precision achieved by the regression predictions. It is noteworthy that a reduction of precision can be seen for high-energy-need models (see Figure 6). This is probably due by the limited number of feature combinations that return high energy needs. Besides, considering the aim of most of the studies is to identify low-energy-need solutions, this reduction of the precision can be considered of minor importance for practical purposes.
Another remarkable finding concerns on the possibility to rank the investigated features according to their importance in the building energy need. SHAP can easily shows how any feature affects the final result, allowing the personnel involved in the building design to focus (or to invest) more on the most important features. Considering the rank can easily change even in the same building when some external factors change, e.g., weather data and/or thermostat settings, see [11], this result definitely helps to better drive the building design.
An insight of the same analysis shows how the importance of each feature is affected also by other features’ values, demonstrating one more time that building features can not be analysed as isolated characteristics but should be inserted in a model that consider the whole building.
Under this light, a prediction model based on machine learning procedure, can be a useful tool to have fast and precise energy need predictions, eliminating the operator waiting time and avoiding to use an energy simulation software. This method can be strongly needed when specific feature configurations must be tested. Besides, it can provide results in addition to the energy need, such as the rank of the features according to their importance. Obviously, to achieve a good precision, the proposed method needs high number of simulations that are run anyway by the optimisation algorithms.
4. Conclusions
Today, accurate and fast prediction of the building energy need is a crucial matter in the path towards low-energy or near-zero-energy buildings. This paper proved that an important advancement could come from the application of machine learning models for the regression of the results of energy simulations. In fact, starting from the outcomes of several energy simulations on a case study building, three machine learning models, i.e., Support Vector Machine, Random Forest, and Extreme Gradient Boosting, were explored and applied for the assessment of the energy need of the building under several configurations. The main findings of the paper are:
- The computational time for a prediction is basically instantaneous and substantially lower than the ones requested for a software energy simulation;
- The validation of the models shows the high accuracy and precision achieved by all the three models with the XGB providing the best results in terms of MAE, MSE and computational time;
- SHAP can easily provide a ranking of the most important features (characteristics) of the building envelope so helping the building design and optimisation;
- The importance of a feature is strongly affected by the values of the other features and then a building features must be studied with a global model that considers the whole building characteristics;
- The strong non-linearity of the problem provide limitations to the adoption of linear models, that can be acceptable only for a preliminary rough prediction.
- The method can be applied to both new and existing buildings. In particular for the latter, the study of feature importance can provide useful information directing retrofit interventions towards the most effective ones.
This work demonstrated the efficacy of the proposed method that proved to be a valid alternative to the simulations and an additional tool that can integrate optimisation algorithms.
Further developments will investigate the application of machine learning models to different case studies and with the addition of further building features and building characteristics in order to test the ability of the models to a larger set of buildings and scenarios.
Author Contributions
Conceptualization, A.B., M.B. and G.M.; methodology, A.B., M.B., M.C. and G.M.; software, A.B., M.C. and G.M.; validation, M.C.; formal analysis, M.C., A.B. and M.B.; investigation, A.B., M.B., M.C. and G.M.; resources, A.B., D.T. and P.T.; data curation, M.C.; writing—original draft preparation, M.C., A.B. and M.B.; visualization, M.C. and M.B.; supervision, A.B. and G.M.; project administration, D.T. and P.T.; funding acquisition, M.B., D.T. and P.T. All authors have read and agreed to the published version of the manuscript.
Funding
This research received no external funding.
Institutional Review Board Statement
Not applicable.
Informed Consent Statement
Not applicable.
Data Availability Statement
Data will be available under request.
Conflicts of Interest
The authors declare no conflict of interest.
Abbreviations
The following abbreviations are used in this manuscript:
| ML | Machine Learning |
| XGB | EXtreme Gradient Boosting |
| RF | Random Forest |
| LM | Linear Model |
| SVM | Support Vector Machine |
| SHAP | SHapley Additive exPlanations |
References
- European Commission. Energy Efficiency—Buildings; European Commission: Bruxelles, Belgium, 2018. [Google Scholar]
- United Nations. Kyoto Protocol to the United Nations Framework Convention on Climate Change; United Nations: Kyoto, Japan, 1998. [Google Scholar]
- Bot, K.; Santos, S.; Laouali, I.; Ruano, A.; Da Graça Ruano, M.; Cano-Ortega, A. Design of Ensemble Forecasting Models for Home Energy Management Systems. Energies 2021, 14, 7664. [Google Scholar] [CrossRef]
- Causone, F.; Scoccia, R.; Pelle, M.; Colombo, P.; Motta, M.; Ferroni, S. Neighborhood Energy Modeling and Monitoring: A Case Study. Energies 2021, 14, 3716. [Google Scholar] [CrossRef]
- Felix Benitez, J.M.; del Portillo-Valdés, L.A.; del Campo Díaz, V.J.; Martin Escudero, K. Simulation and Thermo-Energy Analysis of Building Types in the Dominican Republic to Evaluate and Introduce Energy Efficiency in the Envelope. Energies 2020, 13, 3731. [Google Scholar] [CrossRef]
- Alajmi, T.; Phelan, P. Modeling and Forecasting End-Use Energy Consumption for Residential Buildings in Kuwait Using a Bottom-Up Approach. Energies 2020, 13, 1981. [Google Scholar] [CrossRef] [Green Version]
- U.S. Department of Energy. Energy Plus 9.6. 2021. Available online: https://energyplus.net (accessed on 29 November 2021).
- Ferrari, S.; Zagarella, F.; Caputo, P.; Dall’O’, G. A GIS-Based Procedure for Estimating the Energy Demand Profiles of Buildings towards Urban Energy Policies. Energies 2021, 14, 5445. [Google Scholar] [CrossRef]
- Tsoka, S.; Velikou, K.; Tolika, K.; Tsikaloudaki, A. Evaluating the Combined Effect of Climate Change and Urban Microclimate on Buildings’ Heating and Cooling Energy Demand in a Mediterranean City. Energies 2021, 14, 5799. [Google Scholar] [CrossRef]
- Blumberga, A.; Bazbauers, G.; Vancane, S.; Ijabs, I.; Nikisins, J.; Blumberga, D. Unintended Effects of Energy Efficiency Policy: Lessons Learned in the Residential Sector. Energies 2021, 14, 7792. [Google Scholar] [CrossRef]
- Barbaresi, A.; Bovo, M.; Torreggiani, D. The dual influence of the envelope on the thermal performance of conditioned and unconditioned buildings. Sustain. Cities Soc. 2020, 61, 102298. [Google Scholar] [CrossRef]
- Holland, J.H. Adaptation in Natural and Artificial Systems; MIT Press: Cambridge, UK, 1975. [Google Scholar]
- Ramos Ruiz, G.; Fernández Bandera, C.; Gómez-Acebo Temes, T.; Sánchez-Ostiz Gutierrez, A. Genetic algorithm for building envelope calibration. Appl. Energy 2016, 168, 691–705. [Google Scholar] [CrossRef]
- Barbaresi, A.; Menichetti, G.; Santolini, E.; Torreggiani, D.; Tassinari, P. Two-Step Optimization of Envelope Design for the Reduction of Building Energy Demand. In Proceedings of the Building Simulation 2019, Rome, Italy, 2–4 September 2019; IBPSA: Rome, Italy, 2019; pp. 3055–3062. [Google Scholar] [CrossRef]
- Charron, R.; Athienitis, A. The use of genetic algorithms for a net-zero energy solar home design optimisation tool. In Proceedings of the PLEA 2006—23rd International Conference on Passive and Low Energy Architecture, Conference Proceedings, Geneva, Switzerland, 6–8 September 2006. [Google Scholar]
- Deb, K.; Pratap, A.; Agarwal, S.; Meyarivan, T. A fast and elitist multiobjective genetic algorithm: NSGA-II. IEEE Trans. Evol. Comput. 2002, 6, 182–197. [Google Scholar] [CrossRef] [Green Version]
- Stavrakakis, G.M.; Katsaprakakis, D.A.; Damasiotis, M. Basic Principles, Most Common Computational Tools, and Capabilities for Building Energy and Urban Microclimate Simulations. Energies 2021, 14, 6707. [Google Scholar] [CrossRef]
- Abdelaziz, A.; Santos, V.; Dias, M.S. Machine Learning Techniques in the Energy Consumption of Buildings: A Systematic Literature Review Using Text Mining and Bibliometric Analysis. Energies 2021, 14, 7810. [Google Scholar] [CrossRef]
- Singh, U.; Rizwan, M.; Alaraj, M.; Alsaidan, I. A Machine Learning-Based Gradient Boosting Regression Approach for Wind Power Production Forecasting: A Step towards Smart Grid Environments. Energies 2021, 14, 5196. [Google Scholar] [CrossRef]
- Bovo, M.; Agrusti, M.; Benni, S.; Torreggiani, D.; Tassinari, P. Random Forest Modelling of Milk Yield of Dairy Cows under Heat Stress Conditions. Animals 2021, 11, 1305. [Google Scholar] [CrossRef] [PubMed]
- Talei, H.; Benhaddou, D.; Gamarra, C.; Benbrahim, H.; Essaaidi, M. Smart Building Energy Inefficiencies Detection through Time Series Analysis and Unsupervised Machine Learning. Energies 2021, 14, 6042. [Google Scholar] [CrossRef]
- Gholami, M.; Torreggiani, D.; Tassinari, P.; Barbaresi, A. Narrowing uncertainties in forecasting urban building energy demand through an optimal archetyping method. Renew. Sustain. Energy Rev. 2021, 148. [Google Scholar] [CrossRef]
- Mounter, W.; Ogwumike, C.; Dawood, H.; Dawood, N. Machine Learning and Data Segmentation for Building Energy Use Prediction—A Comparative Study. Energies 2021, 14, 5947. [Google Scholar] [CrossRef]
- Tassinari, P.; Bovo, M.; Benni, S.; Franzoni, S.; Poggi, M.; Mammi, L.M.E.; Mattoccia, S.; Di Stefano, L.; Bonora, F.; Barbaresi, A.; et al. A computer vision approach based on deep learning for the detection of dairy cows in free stall barn. Comput. Electron. Agric. 2021, 182, 106030. [Google Scholar] [CrossRef]
- Lu, H.; Asce, A.M.; Xu, Z.D.; Iseley, T.; Asce, P.E.M.; Matthews, J.C. Novel Data-Driven Framework for Predicting Residual Strength of Corroded Pipelines. J. Pipeline Syst. Eng. Pract. 2021, 12, 04021045. [Google Scholar] [CrossRef]
- Bishop, C.M. Pattern Recognition and Machine Learning; Springer: Berlin/Heidelberg, Germany, 2006. [Google Scholar]
- Hastie, T.; Tibshirani, R.; Friedman, J. The Elements of Statistical Learning: Data Mining, Inference and Prediction, 2nd ed.; Springer: Berlin/Heidelberg, Germany, 2009. [Google Scholar]
- Torreggiani, D.; Barbaresi, A.; Dallacasa, F.; Tassinari, P. Effects of different architectural solutions on the thermal behaviour in an unconditioned rural building. The case of an Italian winery. J. Agric. Eng. 2018, 49, 52–63. [Google Scholar] [CrossRef] [Green Version]
- Barbaresi, A.; Dallacasa, F.; Torreggiani, D.; Tassinari, P. Retrofit interventions in non-conditioned rooms: Calibration of an assessment method on a farm winery. J. Build. Perform. Simul. 2017, 10, 91–104. [Google Scholar] [CrossRef]
- Mathworks. Matlab. 2021. Available online: https://it.mathworks.com/products/matlab.html (accessed on 29 November 2021).
- Cawley, G.C.; Talbot, N.L.C. On Over-fitting in Model Selection and Subsequent Selection Bias in Performance Evaluation. J. Mach. Learn. Res. 2010, 11, 2079–2107. [Google Scholar]
- Pedregosa, F.; Varoquaux, G.; Gramfort, A.; Michel, V.; Thirion, B.; Grisel, O.; Blondel, M.; Prettenhofer, P.; Weiss, R.; Dubourg, V.; et al. Scikit-learn: Machine Learning in Python. J. Mach. Learn. Res. 2011, 12, 2825–2830. [Google Scholar]
- Chen, T.; Guestrin, C. XGBoost: A Scalable Tree Boosting System. In Proceedings of the ACM SIGKDD International Conference on Knowledge Discovery and Data Mining, San Francisco, CA, USA, 13–17 August 2016; pp. 785–794. [Google Scholar] [CrossRef] [Green Version]
- Lundberg, S.M.; Lee, S.I. A Unified Approach to Interpreting Model Predictions. In Advances in Neural Information Processing Systems 30; Guyon, I., Luxburg, U.V., Bengio, S., Wallach, H., Fergus, R., Vishwanathan, S., Garnett, R., Eds.; Curran Associates, Inc.: Red Hook, NY, USA, 2017; pp. 4765–4774. [Google Scholar]
- Shapley, L.S. 17. A Value for n-Person Games. Contributions to the Theory of Games (AM-28); Princeton University Press: Princeton, NJ, USA, 2016; Volume II, pp. 307–318. [Google Scholar] [CrossRef]
- Lundberg, S.M.; Erion, G.; Chen, H.; DeGrave, A.; Prutkin, J.M.; Nair, B.; Katz, R.; Himmelfarb, J.; Bansal, N.; Lee, S.I. From local explanations to global understanding with explainable AI for trees. Nat. Mach. Intell. 2020, 2, 2522–5839. [Google Scholar] [CrossRef] [PubMed]
Publisher’s Note: MDPI stays neutral with regard to jurisdictional claims in published maps and institutional affiliations. |
© 2022 by the authors. Licensee MDPI, Basel, Switzerland. This article is an open access article distributed under the terms and conditions of the Creative Commons Attribution (CC BY) license (https://creativecommons.org/licenses/by/4.0/).