Abstract
In this manuscript, a novel topology is proposed to integrate on-grid and off-grid PV systems supplying the same load premises. The load side is investigated and analyzed, and critical and non-critical loads are separated in terms of power supply. Critical and seasonal loads usually place stress on the grid’s point of common coupling (PCC). In the proposed topology, they are supplied by a novel topology for an off-grid solar pump PV system that lacks energy storage integration. The lack of energy storage batteries requires a novel design and sizing scheme for the off-grid PV system, and a methodology is proposed in this manuscript. The on-grid PV system is conventionally designed and coupled with the storage-less off-grid PV system to maintain load supply. The proposed methodology minimizes the ratings of the PCC and hence relieves stress on congested grids with renewable energy penetration, especially in condensed urban areas. The proposed structure enables the operation of microgrids with high penetration levels of renewable energy resources and minimizes dependance on storage batteries for off-grid systems. A case study is presented and thoroughly analyzed with the proposed methodology. The outcomes of the design process are evaluated economically and were found to be feasible, as is detailed and supported with simulation results.
1. Introduction
Global demand and consumption of energy are increasing rapidly as a consequence of population and economic growth. At this time, a huge portion of power is being generated using fossil fuels. However, fossil fuels are expensive and are known to have harmful impacts on the environment due to the greenhouse gasses (GHG) they release, which play a major role in global warming. In addition, conventional fuel resources are being overused and are not anticipated to meet the rising demand. Consequently, an added barrier that has arisen is that over one billion people worldwide are still left with no access to electricity [1]. These problems have created an opportunity for more investments in the non-conventional and renewable energy sources (RES) [2]. Thus, the quest is ongoing to find and utilize greener, reliable, and cheaper alternatives to these conventional fuel sources.
Currently, continuous efforts are being made to develop and utilize RES, resulting in increases of their share of the energy mix each year [3]. One type of these renewables is solar energy, which is available to the ultimate extent, clean, sustainable, and endless [4]. Photovoltaic (PV) systems are one of the most promising and continuously evolving technologies, since their levelized cost of electricity (LCOE) is dropping below the cost of the government’s electricity tariffs from conventional power generation units, especially for customers with high consumption. In fact, they are now the cheapest source of electricity in most countries as a result of low-cost financing. Their capacity is also expected to triple by 2030 under the existing and proposed worldwide policies [2]. They are usually deployed in the field as on-grid or off-grid energy systems.
On-grid systems are one type of PV systems where the system is connected to the utility grid, which enables the consumption of energy from the grid. Thus, the energy produced by the system does not necessarily need to meet the entire demand, since shortages can be supplied from the utility grid and surplus can be exported back to the grid [5]. These systems cause disturbances to power systems and have an unpredictable output that is affected by the weather conditions such as morning fog and wind speed. Several studies have investigated irregular power generation from PV systems caused by the environmental conditions, such as [6,7], where a 2 MW PV system was examined and its generated power was measured and documented every 5 minutes. The results showed severe power fluctuations, which are one of the main factors responsible for causing some major operational troubles for the utility grid. The authors of [8,9] acknowledged that these fluctuations may also result in severe frequency variations in the electrical network, causing voltage fluctuations that in return may lead to voltage variations outside the regulation limits.
The second type of PV systems installation is the off-grid system, which is independent of the utility grid and must deliver sufficient energy to meet the demand of the load [5]. However, off-grid systems are incapable of providing constant energy supply and may cause an unbalance between generation and demand, particularly during the on-peak and off-peak periods, when the PV generation is either less than or greater than the actual demand, respectively. Therefore, energy storage is mandatory to match the generation and load profiles, as well as to address the intermittency behavior of RESs [10,11]. Energy-storing devices face some technological and economical obstacles. The process of developing energy storage elements is a detailed and complex process due to the high standards required. Moreover, high efficiency accompanied by maintaining a low cost and having a long lifespan are all design concerns [12]. Another problem associated with energy storing devices is their negative impact on the environment due to the toxicity of their waste, yet another major concern the researchers are considering [13].
Due to the unpredictable and rapid changes in electricity generation and sudden loss of power production, the idea of hybrid systems arisen and became one of the most used solutions. Hybrid systems are also useful in remote areas with weak power grids, as they can enhance the quality and consistency of their power supply [14,15]. Hybrid systems can have one or more RESs, conventional power generation units, with or without an energy storage component. Hybrid systems incorporating storage devices along with the RE supply enable consistent power dispatch and increase the reliability of these power sources [16]. However, for urban installations, the utilization of hybridized systems with storage devices is not common and grid regulations usually hinder such integration. Microgrids were introduced as a solution in [17]. Since electrical grids are usually operating near their critical capacity, any small problem in a small part of the system can lead to more serious problems, which can take down the whole electrical grid. Therefore, the usage of microgrids is important, since it can effectively incorporate renewable energy generation in a local energy supply system. In addition, microgrids can reduce risk by dividing the grid into smaller efficient sections that can be islanded and work independently. Islanding can sometimes occur due to disturbances, such as faults or preplanned switching events. A microgrid should be able to operate independently even after islanding has occurred in order to meet the subsequent load demands. In general, there are three types of microgrids: DC, AC, and a combination of both (hybrid). DC microgrids are cheaper than AC microgrids in the case when all the loads are DC loads, and vice versa [18,19], and currently they are receiving substantial attention due to their merits over AC microgrids [20,21]. In the case of hybrid microgrids, conversion losses are minimal [22].
To enable DC microgrid operation, intervention at the DC link is necessary where it interfaces with variable sources and loads. The concept of the DC microgrid has been utilized recently to develop more independent solutions to supply loads from intermittent RESs with minimum support of the available grid; solar-powered water pumping is an active example in literature [23,24]. Contrary to standalone powered loads, the microgrid-based solutions involve a connection with the grid as complimentary source, while not fully exploiting the point of common coupling. The basic idea is to couple the output of the solar PV system at the common DC link with the rectified grid input. Both sources interactively supply the load demand without the need for an energy storage element to stabilize the solar profile, and at the same time minimize the interaction with the grid, thereby minimizing grid power consumption and preventing grid disturbances from propagating to the load side. A common design approach for PV-supported DC microgrids is to have a bidirectional power converter interfacing with the grid, which allows reverse power flow in case the PV generation exceeds the load demand, thereby fully utilizing the PV potential [25,26,27].
Grid-connected PV systems, while very intuitive and desirable from an energy consumption point of view, are designed to cover the load demand while engaging the solar PV generation as a current source in order to limit the energy consumed from the grid, but not the power. Full power exchange is allowed between the grid and the PV system or load under extreme loading conditions (null to full). The possibility of full reverse power flow to the grid requires the capability of the utility network to handle this power exchange, which, if maximized, will compromise the grid power quality and stress the point of common coupling (PCC). This has led utility operators to limit the penetration of RES as grid-connected systems to preserve essential functionalities of the network under extreme conditions. Due to this, many on-grid PV systems are being denied approval due to localized limitations of the network, such as limited distribution transformer ratings, reactive power demand limitations, infrastructure-related limitations (cables, connection points, thermal stresses, etc.), and power quality issues (total harmonic distortion (THD) levels) [28,29,30]. All of this has curbed the deployment of this technology, especially in condensed urban areas where high power demand density is contradicted by limited RESs penetration, despite these areas needing it the most.
To enhance the market share of renewables and address the limiting factors of integrating RESs with the grid, novel design and integration approaches are subjects of intensive research. In this manuscript, a new design strategy is proposed to alleviate the induced limitations of integrating RESs with the grid. The shortcomings of energy storage systems are avoided by proposing an energy-storageless topology. The basic idea behind the proposed strategy is to classify the load shares at certain point of common coupling (PCC) as critical and non-critical loads, in which the critical load indicates energy intensive loads such as heating, ventilation, and air conditioning (HVAC) systems. Non-critical loads indicate distributed loads with small shares of energy consumption, such as lighting, small appliances, low power chargers, etc. The non-critical loads are supplied by the conventional on-grid PV system. In this case, the dynamic exchange of power with the grid ensures time-independent continuous power supply to the load, and reverse power flow from the PV plant to the grid is allowed. This component contributes to the stress on the grid and the PCC; however, the stress is minimized due to the removal of the bulk load (critical load) from the power exchange dynamics. The critical load is managed through a separate PV-supported power supply system such as a solar pump, but uses a unidirectional grid front-end converter to prevent reverse power flow to the grid and to remove any contribution to the PCC limitations. The critical load PV-system (referred to as solar pump hereafter) does not include energy storage and hence, energy generated from the PV may be wasted if light load conditions persist, and grid contribution is needed in case of heavy load operation. In these two scenarios, the energy management is not optimized to minimize the electricity bill and hence, the system size is optimized to minimize the energy wasted. The novel system structure compromises energy harvesting potential to enable semi-micro grid operation and to minimize the interaction with the grid. If the critical load profiles are daytime-type, it will be perfectly suited in the proposed topology. Thus, business buildings in urban areas are targeted by this study. A case study load was selected and analyzed, and classification of critical and non-critical loads was carried out. The conventional on-grid PV system was designed to cover the energy needs of the non-critical load, and the solar pump system coupled with the grid is assumed to cover the critical load. Energy analysis of the solar pump was carried out to optimize the size of the PV system while minimizing the energy losses. Environmental and financial impact analysis was carried out for the optimized system design.
2. Proposed System Layout and Control Methodology
The proposed PV system layout is shown in Figure 1. The load side depicts a residential, business, or small-scale normal load. The load is classified into critical and non-critical loads. The critical loads are energy intensive loads such as HVAC systems, which are the most demanding loads in business buildings in urban areas (the focus of this study). The non-critical loads are light ones with no intensive power demand, such as lighting and small appliances.
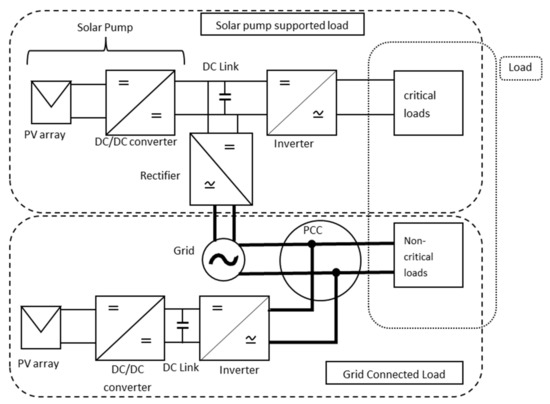
Figure 1.
Proposed system layout.
The conventional topology for integrating PV systems into the supply chain of the load is shown in the bottom part of Figure 1 and is referred to as the grid connected load. The PV array generates the energy and the converter/inverter interface injects the power into the PCC connection. The net load demand (actual demand minus the PV generated power) is directly compensated for by the grid connection. This part of the RES system is designed conventionally to meet the annual energy demand of the load and uses the grid connection to export and import energy as needed by the load. The DC/DC converter of the grid-connected system is controlled under maximum power point (MPPT) mode, and the inverter is controlled to maintain the DC link at the rated value, thus delivering maximum power to the PCC. The inverter interfacing with this DC link (bottom part of Figure 1) is responsible for fixing this DC link to a certain voltage (usually 450V for single phase), and any excess power will be delivered to the load side (PCC in this case). The action of the inverter is always buck in this case.
Critical loads with high power density are supplied from a separately designed PV system, with the grid connected to the DC side (not at the PCC) through a rectifier stage such that the grid utilization is reduced by the instantaneous available energy from the PV system. When the PV does not supply energy (during winter days or nighttime for example), the load is completely supplied by the grid. When the load is not consuming power, the available PV energy is not exported to the grid, which limits the utilization of the available PV energy, but minimizes the grid interaction. The DC/DC converter in the solar pump is controlled under MPPT mode such that the DC link voltage does go over a certain maximum value. The rectifier interfacing the grid with the DC link is controlled to fix the DC link voltage at the rated value. The load inverter is controlled to always meet the load demand. When the load demands more power than what the PV can supply, the rectifier compensates the deficit from the grid; the DC link voltage loop control governs the energy injection in this case. When light load conditions exist, the DC/DC converter control shifts away from the MPPT to keep the DC link voltage under the rated maximum, while the rectifier is turned off in this scenario. In this case, the PV is the only source of energy for the load and does not fully supply maximum power, which gives the system enough margin of stability under fast varying generation conditions such as partial shading and cloudy environments.
The non-critical load is still supplied through the PCC where the G59 is in place, and thus undergoes normal operation. The critical loads are supplied through the common DC link that receives energy from both the PV solar pump and the grid; however the interfacing inverter decouples any disturbances and none are transferred to the load side, no matter the condition of operation.
The proposed strategy achieves two main targets. The first one is minimizing the ratings of the PCC, which limits the peak reverse power flow to the grid during peak power generation from PV and accordingly allows the operator to permit more grid-connected systems with lower ratings without compromising the grid operation. The second target is utilizing RESs to supply critical and high power-density loads, which contributes to the increased penetration of RES in the network operation with minimal downsides.
The design and sizing for the on-grid component of the PV system is conventional and based on the total energy consumed annually versus the total energy generated by the PV system. Specific energy yield for the PV system in a specific geographical area was used to properly size the system. PVsyst simulations were also utilized to generate exact design specifications for specific load information, as will be detailed in the design section below.
The off-grid component or solar pump PV system does not follow conventional design assumptions in this manuscript; rather, a novel design strategy is proposed based on the total energy wasted as a result of adopting this strategy. Figure 2 shows typical daily PV generation and load profiles of a day-time business office, where it clearly shows that the peak load is not concurrent with the peak PV generation, making them non-complementary and creating a need for a grid connection or energy storage element in the on-grid and off-grid cases, respectively.
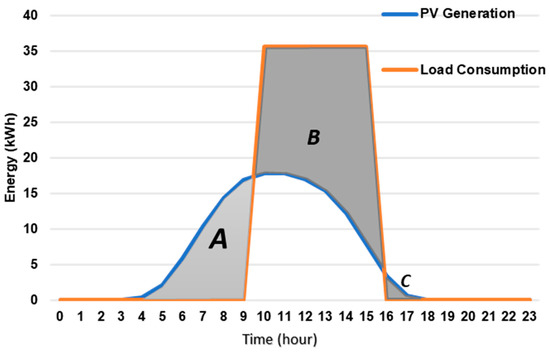
Figure 2.
Typical daily PV generation and load profiles of a day-time business office.
In the proposed solar pump component in Figure 1, the PV system is not coupled with the grid or energy storage for excess energy recovery. This entails the waste of potential energy in areas A and C in Figure 2, and the need for energy supply from the grid to cover area B. In the proposed design, all mismatched areas (A, B, and C) are considered as energy losses (whether it is potential energy wasted or energy paid for from the grid). In this context, the solar pump PV subsystem cannot be oversized as that will enlarge the mismatch areas A and C. On the other hand, undersizing causes a larger mismatch in area B. Thus, optimum PV size should be considered to alleviate the impact of both scenarios. The objective function for this optimization problem is to minimize the sum or mismatch areas A, B, and C, subject to specific load and PV generation profiles. No energy storage elements are considered in the design process.
The proposed topology is converted to a non-conventional design problem that does not follow the standard procedure of sizing. Thus, performing optimization on energy utilization is not intuitive in this case. Alternatively, non-useful energy is quantified and defined as potential energy from the PV generator and not utilized directly, energy is imported from the grid in case the PV generator does not satisfying the load demand. The design objective is to minimize this non-useful energy as clarified with the aid of Figure 2.
3. Load Profile and PV System Design
The energy demand of buildings is non-linear and varies with time due to the variation of occupants’ activities. It is very difficult to predict energy consumption with accuracy, which itself has become a popular research area. In terms of building category, non-residential buildings such as education buildings, commercial buildings, and business facilities make up a large portion of building stock. On the other side, a PV system’s output changes with variations of weather conditions such as irradiation, temperature, and cloud shading during the daytime. PV system output is zero at nighttime and early morning due to zero or low-level sun insolation. The evaluation of building consumption and PV system generation is important for the development of this work.
This study focuses on a commercial building in Jordan that has considerable energy consumption due to the installation of large heating, ventilation, and air conditioning (HVAC) units. For the investigation of electric load demand, this study utilizes year-round collected electricity bills for a governmental building for a more reliable and meaningful evaluation. Due to the absence of preinstalled smart meters, some assumptions were made for daily and hourly consumption. Moreover, the work in this section used software simulations to evaluate the variation of PV system output and yearly data on weather conditions, thereby creating a daily solar generation simulation [31].
3.1. Load and Solar PV Profiles
To conduct this research, a daytime consumption load must be considered with the purpose of minimizing daily net-metering between the day and night. Such loads can be found in the governmental sector, educational institutes, and most 8:00 a.m. to 5:00 p.m. office buildings. Therefore, the chosen subject building consists of six stories and an area of 2400 m2, with 80 employees working daily from Sunday to Thursday, opening at 8:00 a.m. and closing at 3:00 p.m.
Figure 3 shows the monthly energy consumption of the building for one full year. The load demand varies considerably depending on the season due to varying temperatures and the scattered need for the HVAC systems in winter and summer seasons. This seasonal distinction makes it more difficult to plan an optimal PV system in terms of balancing between the variation in consumption and the PV generation over the year with minimum losses and reverse power flow to the grid.
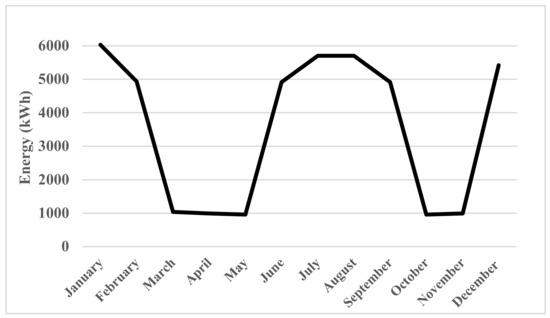
Figure 3.
Building’s consumption over 2021.
With a total size of 35.5 tons of DC inverters and conventional AC units, HVAC systems consume 76% of the building’s overall consumption. Small electrical appliances in commercial buildings including lighting, computers, servers, and small appliances account for a small constant portion of the building’s total consumption over the year. Variable weather conditions impact is significant for load demand size, especially with varying temperatures as the current case is shown in Table 1 [32]. Significant changes in the temperatures are partly due to the location of the country within the solar belt [33]. For non-residential buildings, weather conditions have a much lower influence on load demand profile than the occupants’ activity inside the building [34]. Nonetheless, it is essential to study the seasonal changes in weather as illustrated in Table 1 and their impact on the consumption of air conditioning units. The weather data in Amman was collected using the Photovoltaic Geographical Information System (PVGIS) website [35]. Jordan’s climate is hot and dry, with long, hot, dry summers and short, cool winters. The coldest month is January, with temperatures ranging from 5 °C to 10 °C, and the hottest month is August, with temperatures ranging from 20 °C to 35 °C, with some days reaching 40 °C or higher peak temperatures [36]. Furthermore, Jordan has incredibly huge solar energy potential because it is located within the world’s solar belt; it has one of the highest annual daily average solar radiations in the world, ranging from 4 to 8 kWh/m2 as shown in Figure 4, which makes the country a strategic location for PV projects [37].

Table 1.
Temperature data in Amman, 2021 [32].
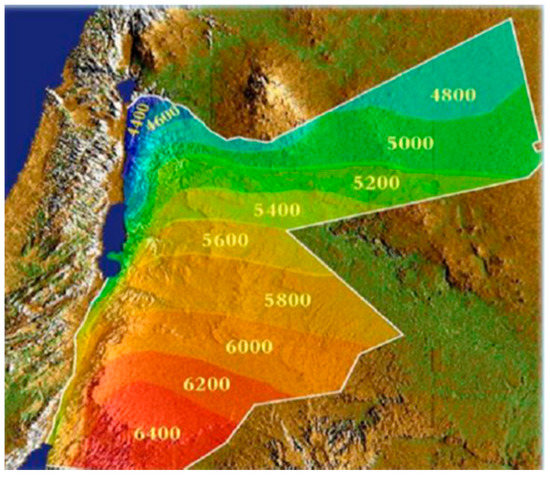
Figure 4.
Jordan’s solar map (kWh/m2/day) [33].
In office buildings, the working routine is the same during weekdays, which means that the working conditions and occupants’ behavior that affect electricity consumption are constant. Nevertheless, to simplify the process, the standby electricity consumption of the small appliances is neglected. Importantly, for the purpose of creating the daily load profiles, two critical assumptions were made. First, the weather conditions were assumed to be the same over each month separately over the year to simplify the generation and thus, the sizing modeling. Second, the AC unit demand varies over the day depending on several variables including the ambient temperature; however, they are operated constantly in winter and summer months, but not the case in the spring and autumn seasons. The daytime loads in the sample building case study were classified as critical and non-critical loads. Critical loads are defined as loads that account for most of the building’s energy consumption; in this case, these are the air conditioning units (ACs). According to the building’s load classification, the months are also separated into critical and non-critical months based on the peak usage of critical loads. The consumption of critical loads is calculated by assuming that they operate from 5 to 6 hours daily depending on the month, excluding weekends, and that consumption varies between heating and cooling because heating consumes more energy than cooling. The breakdown of load energy consumption per month is shown in Table 2 and the critical load energy profile is depicted separately in Figure 5. The monthly consumption analysis is broad in scope and lacks specificity because it does not provide an accurate indication of the building’s behavior and energy consumption, necessitating a more accurate representation since there are some factors that should be taken into consideration. An hourly load profile provides the closest indicator of the building’s behavior. The hourly consumption is visualized in January and August as shown in Figure 6 and Figure 7, respectively. Generally, the critical loads are the ones with high-energy consumption with power demand profiles correlated with PV generation (during the day), while the non-critical loads are the small loads with continuous and semi-fixed power consumption behavior, such that their profile is predictable and does not present critical interaction with the grid.
Table 2.
Monthly consumption of the building’s loads (2021).
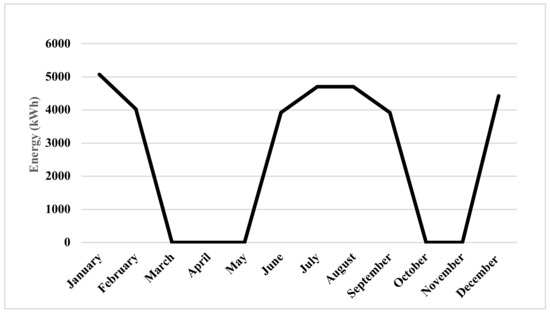
Figure 5.
Critical loads annual consumption.
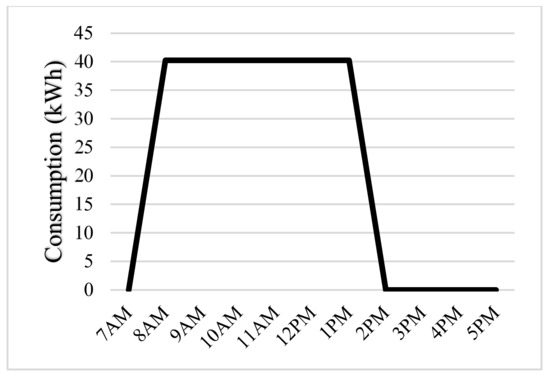
Figure 6.
Hourly consumption in January.
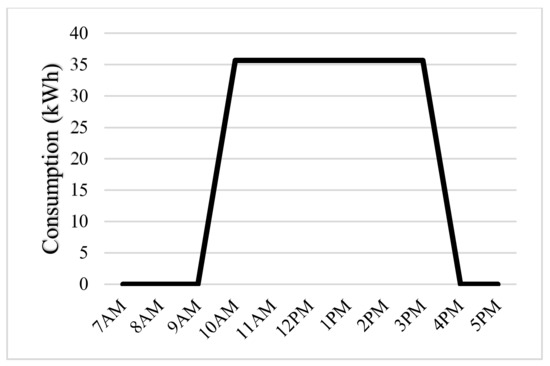
Figure 7.
Hourly consumption in August.
3.2. Photovoltaic System Design
As mentioned previously, the AC units’ demand is separated from the other loads and are called “critical loads”. These cause significant differences in the building’s consumption throughout the year as discussed in the load profile section. This variation makes it more difficult to plan an optimum PV system. Since the target is to minimize PV power penetration into the grid, a semi-on grid topology was developed. Its sizing objective is not based on full demand coverage as in conventional on-grid systems, because it will necessitate the presence of net metering or an energy storage system to supply the AC units when the generation is not enough. Therefore, the PV system is undersized to use all the available power from the PV arrays, and the deficit between the demand and the PV supply will be covered from the utility grid simultaneously. This operation is known as load sharing. However, in practice, it is not as simple. By comparing the load demand and PV generation profiles, it may be noted that there are two types of losses. First, during the day, the generation profile may start from 6–5 pm and the loads are turned on from 8–5 pm; the mismatch between these two profiles is called “mismatch losses”. Second, the generation on weekends, holidays, and during non-critical months where the AC units demand is zero will not be used anywhere in the DC microgrid, since the critical and non-critical loads do not interfere with each other. These losses are known as “generation without consumption losses”.
For the non-critical loads, a conventional grid-tied PV system was designed. Equation (1) gives the system’s power capacity in kilowatt peak (kWp) [34].
Peak sun hours (PSH), are identified as the hours of the day when the incident solar radiation is 1000 W/m2, as seen in Figure 8.
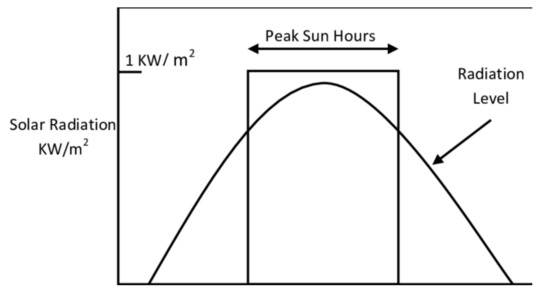
Figure 8.
Peak sun hours.
Additionally, PV modules work more effectively during the PSH. The PSH in Amman, Jordan were obtained using the PVWatts calculator software [38], developed by the National Renewable Energy Laboratory. As shown in Table 3, the average number of daily peak sun hours in Jordan is 6 h. This are amongst the highest in the world; therefore Jordan is a strategic location where many large-scale PV projects are now being introduced.
Table 3.
Peak sun hours in Jordan.
Finally, the PV output power value will not be equal to the rated output power due to many variables that influence the output [39]. These operational losses are represented by a factor known as the “safety factor” (SF). They include the following: disparity due to not working under standard test conditions (STCs), but rather under normal operating conditions (NOCs); dirt and dust accumulation [40], mismatch and wiring losses, and DC to AC conversion losses. Also, some previous research indicated that change in the PV modules output might be due to unforeseen microcracks or physical conditions and impairments of the installation [41]. The SF value was taken as 1.25. In Jordan, it is common to simply divide the average monthly consumption over the year and divide it by 130; this value covers the sun peak hours and the losses for each month; it represents the average energy produced per PV peak installed capacity and has been proven by many designs in the area [42]. Consequently, the sizes for each load category and the whole building are calculated as below:
The PVsyst software offers a comprehensive contextual menu that is employed in modeling and simulating PV systems. There is the option to simulate either grid-tied systems or standalone systems. The semi-on grid proposed topology (solar pump component) is simply a grid-tied system with unidirectional flow from the grid. PVsyst does not have the flexibility to eliminate reverse power flow to the grid. The only way to do so is to use an off-grid system simulation with very small (almost none) energy storage capacity. In Jordan, the tilt angle is fixed at 30° and the azimuth angle is 0° [43]. In addition, PVsyst imports metrological location data, including the radiation data shown in Table 4, thus making the simulation more realistic. The PV modules selected were Jinko solar, model JKM 370M-72, China, and the DC-AC inverter from the ABB company, Italy, with different ratings that will be mentioned later.
Table 4.
Radiation data in Jordan.
The design of the PV system for the solar pump component does not follow same procedure and the sizing is the main challenge. The optimum PV size satisfies the objective function:
where the areas A, B, and C represent the value of the power mismatch as explained in Figure 2. The constraints of the function include the size of the proposed off-grid PV system and the specific energy yield at the location of implementation, which was conservatively assumed to be 130 kWh/kWp for the case of Jordan.
As a consequence, different sizes of PV systems were configured from 16.65 kWp to 27.38 kWp (the range is scanned to locate the optimum solar pump size), and their hourly generation was then extracted over the whole year and compared with the hourly load profile as illustrated in Figure 9 & Figure 10, for example. In addition, areas of mismatch and areas of losses were calculated from the interruption of the hourly load profile with the hourly PV generation. The yearly cumulative losses were then found, which implies the summation of areas of mismatch and areas of losses. The losses are shown in Table 5 for the entire year.
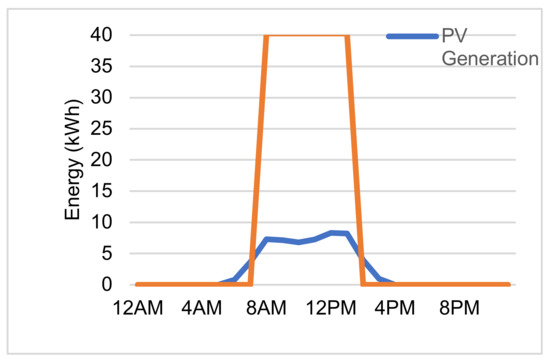
Figure 9.
Hourly profile of 2 January (assumed PV system size of 25.9 kWp).
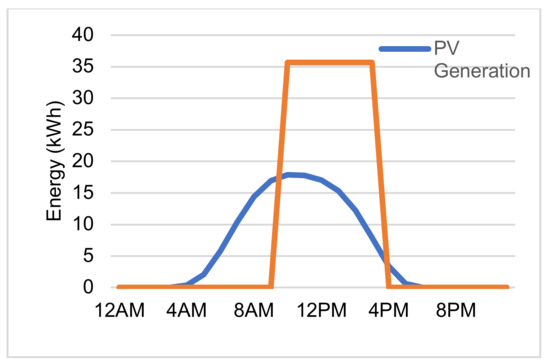
Figure 10.
Hourly profile of 1 August (assumed PV system size of 25.9 kWp).
Table 5.
Losses analysis.
Table 5 shows that the size 16.65 kWp has the minimum losses and the maximum mismatch areas, while the size 27.38 has maximum losses and minimum mismatch areas, and this trend stays fixed for larger or smaller PV sizes as depicted in Figure 11 and Figure 12. Figure 11 shows the potential energy generation from the PV system, but without utilization from the load side due to seasonal behavior. The larger the PV system is, the more the wasted energy potential will be. Contrary to this, Figure 12 shows the energy requirements from the grid to support the load during times of PV power shortage, and apparently, as the designed system grows larger in size, less contribution from the grid is needed. Figure 13 shows the total system-defined energy losses against the designed PV system size. The total losses include data from both Figure 11 and Figure 12, cumulatively. Clearly, the figure shows multiple convexities that can be utilized for optimum design choice. Applying the optimization relation in (5) for the selection of the proper size and plotting the total system losses (areas A, B, and C) in Figure 13 shows that the optimum PV system size that satisfies (5) is .
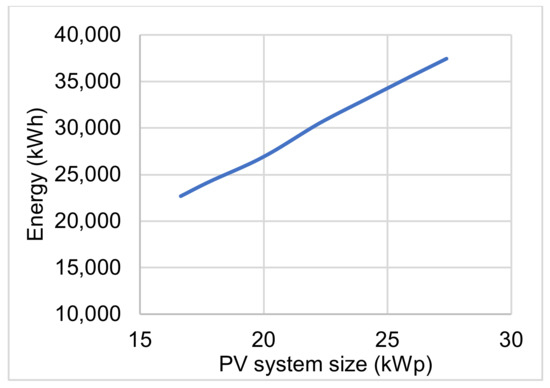
Figure 11.
Generation without consumption losses.
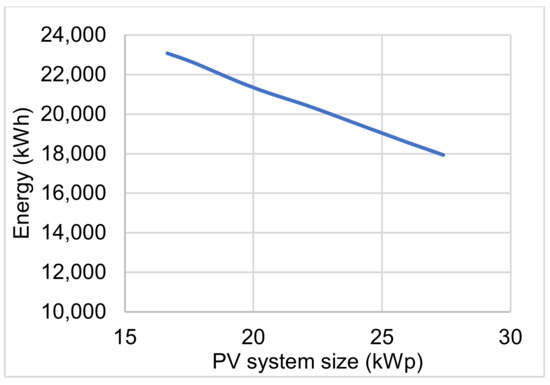
Figure 12.
Mismatch losses.
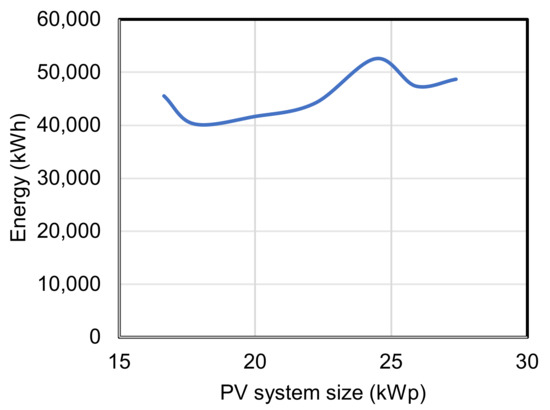
Figure 13.
Total losses vs. size with coupling.
As illustrated in Table 6, the losses vary over the year due to variations in consumption because the consumption of critical loads in non-critical months is almost zero, resulting in zero mismatch losses and an increase in the generation without consumption losses. As the non-critical loads follow conventional design strategy, the needed on-grid PV system size was designed and simulated using PVsyst (developed by the University of Geneva, Switzerland); a PV system of 5.18 kWp is needed to cover the estimated energy demand of these loads. Table 7 shows the monthly flow of energy with the on-grid system in place to support the non-critical loads only.
Table 6.
17.76 kWp solar pump PVsystem loss analysis.
Table 7.
Energy flow analysis for the 5.18 kWp grid-connected system.
4. Economic Analysis
To evaluate the economic impact of the proposed topology as opposed to conventional design strategies of on-grid and off-grid solutions, the levelized cost of energy (LCOE) was utilized. The LCOE, also referred to as the levelized cost of electricity or the levelized energy cost (LEC), is a measurement used to assess and compare alternative methods of energy production. The LCOE of an energy generating asset can be thought of as the average total cost of building and operating the asset per unit of total electricity generated over an assumed lifetime, and can be calculated as in (6) and (7) [42,44].
where —investment expenditures in the year , —operations and maintenance expenditures in the year , —fuel expenditures in the year , —electrical energy generated in year , —discount rate, —expected lifetime of the system.
For the case of Jordan, the discount rate is equal to 8%. For the case of a renewable energy system, the expected lifetime of the system is equal to 25 years. The investment cost of the on-grid system was found by calculating the yearly average bill of the system. Manual calculations were made for the purpose of separating the targeted non-critical load yearly average bill from the total bill including the critical load obtained for the case study. The net energy was found by subtracting the energy generated from the PV system from the energy consumed from the utility grid, this is known as a net metering system. The on-grid system part equal to 5.18 kWp is considered a small industry system, since it is smaller than 10 kWp; according to the Jordanian electric company [45], small industry systems have the following consumption tariffs in Table 8:
Table 8.
Tariffs for small industry.
The annual bill is calculated as follows:
Since the off-grid system does not consume energy from the grid, its investment expenditure was found by calculating the cost of the initial installation divided by the life expectancy, which is equal to 25 years. Starting from 2021 [46], the cost of each one-watt peak of a PV system in the Jordanian market became equal to USD 3.01, with an investment tax credit of 26%. In the case of this project, the size of the PV system was equal to 17.76 kWp; the following calculations were made to calculate the investment expenditure:
Maintenance costs were calculated by multiplying the cost of the component by the probability that a failure will occur at that specific year. This probability is mostly calculated using a Weibull distribution and log-normal distribution. The annual maintenance cost varies from one country to another due to different pricing and market values. According to a previous study in [47], the annual maintenance cost in Jordan was found to be equal to 24 $ per kWp rating. For the on-grid system, the total maintenance cost is calculated as follows:
For the second off-grid system, the total cost is calculated as:
The levelized cost of energy for the on-grid part of the system was found to be equal to 0.0348 $/kWh; for the solar pump PV system of size 17.76 kWp, the LCOE is 0.0628 $/kWh. Similarly, the levelized cost of energy was calculated for different off-grid system sizes within a defined range in the interest of deciding which off-grid system rating has the lowest LCOE; the results are tabulated in Table 9.
Table 9.
Values of kWh generated per year for each off-grid system size.
The LCOE is also a common tool to evaluate the feasibility of different options for the sizing of the solar pump PV system. As indicated in Table 9, the LCOE is minimum for the 25.9 kWp system. Since there is no storage proposed utilizing the grid or energy storage batteries, the definition of optimum size for the solar pump component does not follow conventional sizing options. In this work, two alternative methods are proposed, the first based on minimizing the losses and the second one based on utilizing the LCOE. However, if environmental impact is taken into account, the LCOE method is counterintuitive and the minimum loss design method prevails, especially as the variations in the LCOE are marginal.
5. Conclusions
In highly congested grids with RESs, the penetration of additional RE plants is limited by the capacity of the grid in the region of deployment. This leads to limiting the penetration of RESs. On the other hand, off-grid PV systems are usually not preferred in urban areas due to the added cost and hazards of the storage batteries needed. In this manuscript, a tradeoff design methodology is presented for a novel PV system structure comprising on-grid and off-grid components. The off-grid solar pump component does not utilize storage batteries, but rather utilizes integration with the grid to compensate for low energy yield periods and does not inject reverse current into the grid during high energy generation times. This mechanism helps to mask the PV source from the grid and enables RE harvesting towards the load demand. Due to the absence of energy storage batteries, the off-grid PV system design does not follow conventional design procedures. A new design methodology is proposed based on minimizing energy losses, where energy losses include the potential energy lost due to the lack of storage devices and grid imported energy. The non-critical load component was assumed to be fed by a conventional on-grid PV system. The proposed strategy was verified and tested on a case study for an urban business building with realistic loading conditions in which energy balance was ensured and technical feasibility was proven. Economic impact analysis was carried out on the new design and the LCOE was calculated, representing another metric for the evaluation of design sizing. The minimum energy losses method rendered a different sizing option than the LCOE-based method, which gives the designer two aspects to take into consideration. The first is environmental, where the minimum energy loss option is preferred and the second is economic, where the LCOE is preferred. The manuscript presents a novel methodology for taking design parameters into consideration compared to conventional design procedures for on-grid and off-grid systems.
Author Contributions
Conceptualization, Z.M.D., S.Z.A., D.R.K. and L.H.A.; methodology, Z.M.D., S.Z.A., D.R.K. and L.H.A.; software, S.Z.A., D.R.K. and L.H.A.; validation, S.Z.A., D.R.K., L.H.A. and M.A.-A.; formal analysis, Z.M.D., S.Z.A., D.R.K., L.H.A. and M.A.-A.; investigation, S.Z.A., D.R.K., L.H.A. and M.A.-A.; resources, S.Z.A., D.R.K. and L.H.A.; data curation, S.Z.A., D.R.K., L.H.A., N.B. and M.A.-A.; writing—original draft preparation, Z.M.D.; writing—review and editing, Z.M.D., M.A.-A. and N.B.; visualization, S.Z.A., D.R.K., L.H.A. and Z.M.D.; supervision, Z.M.D. and M.A.-A.; project administration, Z.M.D.; funding acquisition, Z.M.D., N.B. and M.A.-A. All authors have read and agreed to the published version of the manuscript.
Funding
We acknowledge support by the German Research Foundation and the Open Access Publication Fund of TU Berlin.
Data Availability Statement
Not applicable.
Acknowledgments
This work is supported by the deanship of scientific research at the German Jordanian University.
Conflicts of Interest
The authors declare no conflict of interest.
References
- State of Electricity Access Report 2017 (Vol. 2): Full Report (English); World Bank Group: Washington, DC, USA; Available online: Http://Documents.Worldbank.Org/Curated/En/364571494517675149/Full-Report (accessed on 3 February 2021).
- International Energy Agency. World Energy Outlook 2020; IEA: Paris, France, 2020. [Google Scholar]
- Rehmani, M.H.; Reisslein, M.; Rachedi, A.; Erol-Kantarci, M.; Radenkovic, M. Integrating Renewable Energy Resources Into the Smart Grid: Recent Developments in Information and Communication Technologies. IEEE Trans. Ind. Inform. 2018, 14, 2814–2825. [Google Scholar] [CrossRef]
- Hosenuzzaman, M.; Rahim, N.A.; Selvaraj, J.; Hasanuzzaman, M.; Malek, A.B.M.A.; Nahar, A. Global Prospects, Progress, Policies, and Environmental Impact of Solar Photovoltaic Power Generation. Renew. Sustain. Energy Rev. 2015, 41, 284–297. [Google Scholar] [CrossRef]
- Algaddafi, A.; Alshahrani, J.; Hussain, S.; Elnaddab, K.; Diryak, E.; Daho, I. Comparing the Impact of the Off-Grid System and on-Grid System on a Realistic Load. In Proceedings of the 32nd European Photovoltaic Solar Energy Conference and Exhibition, Munich, Germany, 20–24 June 2016; pp. 2144–2150. [Google Scholar] [CrossRef]
- Farhoodnea, M.; Mohamed, A.; Shareef, H.; Zayandehroodi, H. Power Quality Impact of Grid-Connected Photovoltaic Generation System in Distribution Networks. In Proceedings of the 2012 IEEE Student Conference on Research and Development (SCOReD), Pulau Pinang, Malaysia, 5–6 December 2012; IEEE: Pulau Pinang, Malaysia, 2012; pp. 1–6. [Google Scholar]
- Enslin, J.H.R. Network Impacts of High Penetration of Photovoltaic Solar Power Systems. In Proceedings of the IEEE PES General Meeting, Minneapolis, MN, USA, 25–29 July 2010; IEEE: Minneapolis, MN, USA, 2010; pp. 1–5. [Google Scholar]
- Hoff, T.E.; Perez, R. Quantifying PV Power Output Variability. Sol. Energy 2010, 84, 1782–1793. [Google Scholar] [CrossRef]
- Pezeshki, H.; Wolfs, P.J.; Ledwich, G. Impact of High PV Penetration on Distribution Transformer Insulation Life. IEEE Trans. Power Deliv. 2014, 29, 1212–1220. [Google Scholar] [CrossRef]
- Abeywardana, D.B.W.; Hredzak, B.; Agelidis, V.G.; Demetriades, G.D. Supercapacitor Sizing Method for Energy-Controlled Filter-Based Hybrid Energy Storage Systems. IEEE Trans. Power Electron. 2017, 32, 1626–1637. [Google Scholar] [CrossRef]
- Herrera, V.I.; Gaztañaga, H.; Milo, A.; Saez-de-Ibarra, A.; Etxeberria-Otadui, I.; Nieva, T. Optimal Energy Management and Sizing of a Battery--Supercapacitor-Based Light Rail Vehicle With a Multiobjective Approach. IEEE Trans. Ind. Appl. 2016, 52, 3367–3377. [Google Scholar] [CrossRef]
- Yao, L.; Yang, B.; Cui, H.; Zhuang, J.; Ye, J.; Xue, J. Challenges and Progresses of Energy Storage Technology and Its Application in Power Systems. J. Mod. Power Syst. Clean Energy 2016, 4, 519–528. [Google Scholar] [CrossRef]
- Dehghani-Sanij, A.R.; Tharumalingam, E.; Dusseault, M.B.; Fraser, R. Study of Energy Storage Systems and Environmental Challenges of Batteries. Renew. Sustain. Energy Rev. 2019, 104, 192–208. [Google Scholar] [CrossRef]
- Varetsky, Y.; Konoval, V.; Seheda, M.; Pastuh, O. Studying Voltage Fluctuations in Microgrid with Hybrid Renewable Energy System. In Proceedings of the 2019 IEEE 6th International Conference on Energy Smart Systems (ESS), Kyiv, Ukraine, 17–19 April 2019; IEEE: Kyiv, Ukraine, 2019; pp. 239–242. [Google Scholar]
- Paska, J.; Biczel, P.; Kłos, M. Hybrid Power Systems—An Effective Way of Utilising Primary Energy Sources. Renew. Energy 2009, 34, 2414–2421. [Google Scholar] [CrossRef]
- Roy, P.K.S.; Karayaka, H.B.; Yan, Y.; Alqudah, Y. Investigations into Best Cost Battery-Supercapacitor Hybrid Energy Storage System for a Utility Scale PV Array. J. Energy Storage 2019, 22, 50–59. [Google Scholar] [CrossRef]
- Shimomachi, K.; Hara, R.; Kita, H. Comparison between DC and AC Microgrid Systems Considering Ratio of DC Load. In Proceedings of the 2015 IEEE PES Asia-Pacific Power and Energy Engineering Conference (APPEEC), Brisbane, QLD, Australia, 15–18 November 2015; IEEE: Brisbane, QLD, Australia, 2015; pp. 1–4. [Google Scholar]
- Kumar, D.; Zare, F.; Ghosh, A. DC Microgrid Technology: System Architectures, AC Grid Interfaces, Grounding Schemes, Power Quality, Communication Networks, Applications, and Standardizations Aspects. IEEE Access 2017, 5, 12230–12256. [Google Scholar] [CrossRef]
- Justo, J.J.; Mwasilu, F.; Lee, J.; Jung, J.-W. AC-Microgrids versus DC-Microgrids with Distributed Energy Resources: A Review. Renew. Sustain. Energy Rev. 2013, 24, 387–405. [Google Scholar] [CrossRef]
- Dragičević, T.; Lu, X.; Vasquez, J.C.; Guerrero, J.M. DC Microgrids—Part II: A Review of Power Architectures, Applications, and Standardization Issues. IEEE Trans. Power Electron. 2016, 31, 3528–3549. [Google Scholar] [CrossRef]
- Boroyevich, D.; Cvetković, I.; Dong, D.; Burgos, R.; Wang, F.; Lee, F. Future Electronic Power Distribution Systems a Contemplative View. In Proceedings of the 2010 12th International Conference on Optimization of Electrical and Electronic Equipment, Brasov, Romania, 20–22 May 2010; pp. 1369–1380. [Google Scholar]
- Jiang, Z.; Yu, X. Hybrid DC- and AC-Linked Microgrids: Towards Integration of Distributed Energy Resources. In Proceedings of the 2008 IEEE Energy 2030 Conference, Atlanta, GA, USA, 17–18 November 2008; IEEE: Atlanta, GA, USA, 2008; pp. 1–8. [Google Scholar]
- Mishra, A.K.; Singh, B. Grid Interactive Single-Stage Solar Powered Water Pumping System Utilizing Improved Control Technique. IEEE Trans. Sustain. Energy 2020, 11, 304–314. [Google Scholar] [CrossRef]
- Kumar, R.; Singh, B. Grid Interactive Solar PV-Based Water Pumping Using BLDC Motor Drive. IEEE Trans. Ind. Appl. 2019, 55, 5153–5165. [Google Scholar] [CrossRef]
- Hadley, B.; Mirafzal, B.; Ionel, D. On Power-Sharing of Solar-Based Hybrid Motor-Drive Systems. In Proceedings of the 2010 IEEE Energy Conversion Congress and Exposition, Atlanta, GA, USA, 12–16 September 2010; pp. 695–701. [Google Scholar]
- Kumar, S.; Patel, L.N.; Singh, B.; Vyas, A.L. Self-Adjustable Step-Based Control Algorithm for Grid-Interactive Multifunctional Single-Phase PV-Battery System Under Abnormal Grid Conditions. IEEE Trans. Ind. Appl. 2020, 56, 2978–2987. [Google Scholar] [CrossRef]
- Singh, B.; Murshid, S. A Grid-Interactive Permanent-Magnet Synchronous Motor-Driven Solar Water-Pumping System. IEEE Trans. Ind. Appl. 2018, 54, 5549–5561. [Google Scholar] [CrossRef]
- Gandhi, O.; Kumar, D.S.; Rodríguez-Gallegos, C.D.; Srinivasan, D. Review of Power System Impacts at High PV Penetration Part I: Factors Limiting PV Penetration. Sol. Energy 2020, 210, 181–201. [Google Scholar] [CrossRef]
- Kumar, D.S.; Gandhi, O.; Rodríguez-Gallegos, C.D.; Srinivasan, D. Review of Power System Impacts at High PV Penetration Part II: Potential Solutions and the Way Forward. Sol. Energy 2020, 210, 202–221. [Google Scholar] [CrossRef]
- Barutcu, I.C.; Karatepe, E.; Boztepe, M. Impact of Harmonic Limits on PV Penetration Levels in Unbalanced Distribution Networks Considering Load and Irradiance Uncertainty. Int. J. Electr. Power Energy Syst. 2020, 118, 105780. [Google Scholar] [CrossRef]
- Li, B. Evaluation of Building Demand and PV System Output in Order to Devise an Improved Tariff and Operational Strategy for Sharing PV Power. 192. Master of Philosophy Thesis, School of Electrical, Computer and Telecommunications Engineering, University of Wollongong, Wollongong, Australia, 2017. Available online: https://ro.uow.edu.au/theses1/284 (accessed on 6 March 2021).
- Skunpong, R.; Plangklang, B. A Practical Method for Quickly PV Sizing. Procedia Eng. 2011, 8, 120–127. [Google Scholar] [CrossRef][Green Version]
- PVGIS. Available online: https://re.jrc.ec.europa.eu/pvg_tools/en/#MR (accessed on 6 March 2021).
- Climate in Jordan. Available online: https://www.weatheronline.co.uk/reports/climate/Jordan.htm#:~:text=Jordan%20has%20a%20hot%2C%20dry,of%20the%20eastern%20Mediterranean%20area (accessed on 6 March 2021).
- Alrwashdeh, S.S. Comparison among solar panel arrays production with a different operating temperatures in Amman-Jordan. Int. J. Mech. Eng. Technol. 2018, 9, 420–429. [Google Scholar]
- Climate Data. Available online: https://weather-and-climate.com/average-monthly-Rainfall-Temperature-Sunshine,Amman,Jordan (accessed on 6 March 2021).
- Alrwashdeh, S.S.; Alsaraireh, F.M.; Saraireh, M.A. Solar Radiation Map of Jordan Governorates. Int. J. Eng. Technol. 2018, 7, 1664. [Google Scholar] [CrossRef]
- Peak Sun Hours. Available online: https://pvwatts.nrel.gov/ (accessed on 6 March 2021).
- California Energy Commission Energy Technology Development Division 1516 Ninth Street Sacramento, California 95814. 2001. Available online: https://www.energy.ca.gov/contact (accessed on 2 January 2022).
- Darwish, Z.A. Effect of Dust on Photovoltaic Performance Review and Research Status. Latest Trends Renew. Energy Environ. Inform. 2013, 34, 193–199. [Google Scholar] [CrossRef]
- Bdour, M.; Dalala, Z.; Al-Addous, M.; Radaideh, A.; Al-Sadi, A. A Comprehensive Evaluation on Types of Microcracks and Possible Effects on Power Degradation in Photovoltaic Solar Panels. Sustainability 2020, 12, 6416. [Google Scholar] [CrossRef]
- Al-Zoubi, H.; Al-Khasawneh, Y.; Omar, W. Design and Feasibility Study of an On-Grid Photovoltaic System for Green Electrification of Hotels: A Case Study of Cedars Hotel in Jordan. Int. J. Energy Environ. Eng. 2021, 12, 611–626. [Google Scholar] [CrossRef]
- Altarawneh, I.S.; Rawadieh, S.I.; Tarawneh, M.S.; Alrowwad, S.M.; Rimawi, F. Optimal Tilt Angle Trajectory for Maximizing Solar Energy Potential in Ma’an Area in Jordan. J. Renew. Sustain. Energy 2016, 8, 033701. [Google Scholar] [CrossRef]
- Nieto-Díaz, B.A.; Crossland, A.F.; Groves, C. A Levelized Cost of Energy Approach to Select and Optimise Emerging PV Technologies: The Relative Impact of Degradation, Cost and Initial Efficiency. Appl. Energy 2021, 299, 117302. [Google Scholar] [CrossRef]
- Nationl Electric Power Company—NEPCO HomePage. Available online: https://www.nepco.com.jo/en/electricity_tariff_en.aspx (accessed on 6 March 2021).
- Solar Panels in Jordan: 2021 Cost and Companies|EnergySage. Available online: https://www.energysage.com/local-data/solar-panel-cost/mn/scott-county/jordan/ (accessed on 6 March 2021).
- Ghussain, L.A. Economic Assessment of PV Investments in Jordan. Innov. Energy Res. 2017, 6, 1–11. [Google Scholar] [CrossRef]


Publisher’s Note: MDPI stays neutral with regard to jurisdictional claims in published maps and institutional affiliations. |
© 2022 by the authors. Licensee MDPI, Basel, Switzerland. This article is an open access article distributed under the terms and conditions of the Creative Commons Attribution (CC BY) license (https://creativecommons.org/licenses/by/4.0/).