Article

Numerical Feasibility Study of Self-Regulating Radiant Ceiling in Combination with Diffuse Ceiling Ventilation

by
Marie Rugholm Krusaa
1,2,* and
Christian Anker Hviid
1
1
Department of Civil Engineering, Technical University of Denmark, Brovej, Building 118, DK-2800 Kgs. Lyngby, Denmark
2
Saint-Gobain Nordic A/S, Robert Jacobsensvej 62A, DK-2300 København, Denmark
*
Author to whom correspondence should be addressed.
Energies 2022, 15(4), 1319; https://doi.org/10.3390/en15041319
Submission received: 18 October 2021 / Revised: 2 February 2022 / Accepted: 4 February 2022 / Published: 11 February 2022
(This article belongs to the Special Issue What’s Next for Building Energy Efficiency?)

Abstract

:
A focus on indoor comfort and tightening targets for energy savings in buildings presents new opportunities for heating, ventilation, and air-conditioning products (HVAC). This paper presents a novel comfort solution that integrates a suspended radiant ceiling with diffuse ventilation, dubbed HVACeiling. In combination with the concrete slab, the HVACeiling has the potential to provide thermal comfort with minimal temperature offset, which supports operation of the heating and cooling system at temperatures very close to the room comfort temperature. The paper presents a parametric numerical study of the concept in a simplified two-pipe layout with fixed flow and fixed temperatures. First, the analysis was focused on different internal and solar loads, heat losses, and climatic locations with the aim of assessing the potential of self-regulation, i.e., no active controls, thermal comfort, ability to reduce peak loads and the consequential building design considerations. Secondly, the purpose was to analyse the concept in a generic office building with five offices and one meeting room and compare it to other HVAC solutions. The whole-year analyses of heating, cooling, energy performance, and thermal comfort were done using the building performance simulation software IDA ICE. It was found that it was possible to create thermal comfort in Paris, Munich, and Copenhagen with water circulating constantly with fixed temperatures of 20–24 °C without controls and with window sizes from 15 to 30% of the floor area. The studies showed that the HVACeiling reduced the operative peak temperatures on the warmest days in comparison with a standard radiant ceiling with mixing ventilation by 1 K. Compared to all-air solutions, the HVACeiling reduced the yearly energy consumption by 20–30% and the peak power in summer up to 69%. This study indicates that thermal comfort is achievable in a European context even at very small temperature offsets, which supports the use of more renewable energy sources.

1. Introduction

1.1. Motivation

The need to reduce greenhouse gas emissions has increased in recent years, often driven by tightened targets for energy efficiency and promoting energy sources with a net reduction of CO2-emissions [1]. This has translated into more well-insulated and airtight buildings, better HVAC components, and a focus on increasing the share of renewable energy [2]. As buildings become more well-insulated, heating demand decreases and cooling demand increases [3]. Furthermore, the past years have increased the focus on indoor comfort and occupants productivity [4,5], which has led to increasing demands for comfortable heating, cooling, and ventilation systems.
To heat and cool buildings sustainably and meet comfort criteria, new developments of indoor comfort systems are needed. One common design criterion for these developments that supports the integration of renewable sources, more use of free sources, and the lowering of peak loads and high comfort, is to design systems that operate with temperatures close to the room temperature. This is sometimes referred to as low-temperature heating and high-temperature cooling (LTH-HTC) solutions. LTH-HTC systems are, in addition, potentially self-regulating systems that exploit how a change in the room temperature creates a proportional change in the heat exchange with the room. Self-regulation means that the system operates without any active control of the system [6,7,8]. The self-regulation effect is more prominent in buildings with a low heating and cooling demand, where it is often enough to control the indoor temperature.
The authors have introduced an integrated concept with suspended radiant ceiling panels and diffuse ceiling ventilation under the name ‘HVACeiling’ [9,10,11]. Diffuse ceiling ventilation uses the perforated or porous suspended ceiling as the supply inlet to the room. The ducts supply the air to the plenum void (above the suspended ceiling), and by overpressure the air diffuses with low velocity down to the room [12,13,14,15]. The suspended radiant ceiling applies heating and cooling to the plenum and the room below. Consequently, the ventilation air is pre-cooled/-heated in the plenum before it enters the room (Figure 1). In combination with a concrete slab, as depicted in Figure 1, the slab may be exploited as a thermal buffer to offset peak loads and reduce peak temperatures.

1.2. Literature Review

Heating, cooling, ventilation, and acoustics are key services for the indoor environment. Often these services are perceived as separate services that must be installed to form the indoor environment and subsequently, the systems must be operated with minimal energy use. Some convective solutions integrate heating, cooling, and ventilation, such as fan coils and active chilled beams; though these systems lack the integration of room acoustics and their high impulse air supply may be a source of draught and turbulent noise. In comparison, hydronic radiant systems prove superior in acoustics, thermal comfort, and draught [16]. Hydronic radiant systems have many variants in the literature [10,17,18,19,20]. Hydronic radiant systems utilize floor, ceiling, and wall surfaces to provide heating and cooling with Low Temperature Heating and High Temperature Cooling (LTH-HTC) [21,22,23]. The hydronic radiant systems can be embedded or separated from the building structure [17,21]. Thermally Active Building Systems (TABS) have pipes embedded in the building structure, which activates the thermal storage capacity but has a slow reaction time. The majority of previous studies [6,17,19,24,25,26,27] mainly focused on the energy performance of TABS or ventilation-assisted TABS. A few studies combined TABS with the ceiling fully covered with acoustic panels [26,28]. However, the heat transfer from TABS is blocked when the ceiling is fully covered [29], and studies show that even 50% coverage impacts the heat transfer significantly [17,29].
Suspending the radiant ceiling system from the building structure promises more efficient heat transfer and integrated acoustics [30,31]. Integrating with diffuse ventilation potentially increases the heat transfer [10] and reduces the risk of draught and noise compared to mixing ventilation and displacement ventilation [12,32]. Yu et al. [27] and Zhang et al. [19,33] studied diffuse ceiling ventilation in combination with TABS. These studies show a decreased cooling capacity when the TABS are fully covered by the suspended ceilings, reducing the radiant heat transfer from the slab to the room.
The hydronic radiant ceiling is able to transfer heat with low temperature offset because of the large heat transferring surface. The standard radiant system is controlled with a thermostatic control valve to regulate the mass flow based on the measured room temperature and the setpoint. At a very low temperature offset, the self-regulation makes the thermostatic valves, temperature sensors, and control systems obsolete. The conditioning fluid (water) can circulate in a cost-effective two-pipe layout, one supply and one return pipe, with fixed mass flow and fixed temperature to all the rooms (Figure 2). This potentially simplifies the construction process.
The HVACeiling can reduce the number of separate control systems and the associated errors in our buildings due to complex components.
This was proposed and tested with active chilled beams, which have a high capacity due to the recirculation of the room air through the chilled beam. This system was developed with a temperature offset (the temperature difference between supply air and room air) of ±3 °C and has shown an energy-saving potential of 3–6% [30,31,34,35,36,37] and average temperature rise below 2.4 K in 90% of the working hours [34].
The aim of this paper was to investigate the potential of applying the HVACeiling in an office setting with a two-pipe layout and no active controls. The HVACeiling combines heating, cooling, ventilation, and thermal storage in the concrete slab, to achieve thermal comfort, lowered energy consumption, and reduced peak loads.
The research objectives were:
  • Analyse the combination of HVACeiling, concrete slab and two-pipe layout parametrically in individual office spaces using a small temperature offset of 2–6 °C;
  • Synthesize the parametric analysis into a design guide that illustrates the feasible parameter combinations in terms of thermal comfort and daylight criteria;
  • Assess the applicability of the combined solution in a generic office building with regard to thermal comfort, energy use, and day/night peak power and compare it to other solutions.

1.3. Novelty

The HVACeiling in combination with the thermal buffering capacity of the slab combines multiple benefits in terms of acoustics, thermal comfort, simplification of the installation process, the potential to use renewable energy sources, and to reduce peak loads. The solution operates through complex heat transfer processes, partly driven by the temperature difference between the plenum and the temperature in the ceiling layer and partly by the temperature difference between the room and the surface of the radiant ceiling. The novelty of this study is the rigorous numerical whole-year analysis of this concept in relation to building design, climate, thermal comfort, energy use, and peak loads.

1.4. Organization of Paper

The paper is structured in the following way: Section 1 motivates and creates relations to the literature, Section 2.1 and Section 2.2 describe the numerical methods, references, and input. Section 2.3 outlines the parametric analysis of individual spaces and Section 2.4 outlines a generic office building that combines six individual spaces to represent a realistic operation of a building. Section 3 presents the results, subdivided into Section 3.1 Daylight, Section 3.2 Feasibility Guide, and Section 3.3 Generic Office Building. Section 4 discusses the results and shortcomings, and Section 5 concludes the paper.

2. Numerical Method

2.1. Simulation Model

The investigation of the HVACeiling solution was conducted in the dynamic building simulation software, IDA Indoor Climate and Energy (IDA ICE), version 4.7 [38]. The approach was to create a generic enclosure typical of an office building with a net floor area of 21.6 m2 that could function as a meeting room and a space for workstations. The modelling approach was to simultaneously simulate the meeting room and workstation space for both South- and North-orientation (Figure 3a). The climatic year was divided into heating season and cooling season. The heating season was from November to March and the cooling season was from April to October. The enclosure was divided into two zones; the “office” and the “plenum” (Figure 3b) to represent the suspended radiant ceiling with diffuse ceiling ventilation in the plenum. An intentional leak between the zones made it possible for air to diffuse from the plenum to the room. The suspended ceiling was implemented as a shared construction between zones: the ceiling in the room and the floor of the plenum. All of the construction details are found in Table 1. The model for the water pipes embedded in the ceiling is described in Section 2.2.3. The upper and lower bounds of the model was constructed as “Floor separation” in order to emulate similar office spaces above and below. The external wall had a U-value of 0.09 W/m2K and the airtightness was set to 0.5 l/(s m2 floor) at a pressure difference of 50 Pa. This complies with the Danish Building Code implementation of a near-zero energy building.
The windows had a U-value of 0.8 W/m2K with a g-value/light transmittance of 25/54–31/63–53/74%, respectively. A solar-coated glazing was chosen over external shading as a preferred non-mechanical shading solution with minimal maintenance costs. To supplement the solar-coated glazings, internal blinds were applied for glare protection. The internal blinds were activated when the solar radiation gain was above 100 W/m2 on the internal side of the glazing. Because of the solar-coated glazings, this threshold only activated the blinds for short periods.
The standards EN 16798-1 [39] and DS 474 [40] were used to determine thermal comfort criteria in the room. According to category IEQII, the operative temperature during working hours should always be above 20 °C and below 26 °C for a maximum of 100 h. However, room temperatures of 20 °C are often perceived as too cold in office buildings; thus, we strive for a minimum temperature of 21 °C in the office [41]. Yearly simulations were conducted for the year 2010.

2.2. Comfort Systems and Internal Gains

Different variations of window properties, water flow rate, and internal gains were all chosen to investigate the performance of the HVACeiling. An office space for 3 workstations and a meeting room for 10 people were tested. It was assumed that not everyone would be present at all times, and a diversification factor of 80% was used. Internal loads during the office hours (7–17) each weekday were as shown in Figure 4 below. The loads include equipment, lighting, and occupancy and represent peak internal loads in the range of 21–43 W/m2. The mechanical ventilation was only active during occupancy with 20 °C inlet air temperature in all simulations. The heating and cooling systems were constantly running with fixed mass flow rate and fixed water supply temperature.
The conditioning water temperature was produced by the default heat pump/chiller model in IDA ICE with ambient heat exchange to air. The machine operated as a reversible heat pump connected to two buffering tanks. The setpoint of the tanks was the same in order to emulate the fixed supply water temperature, but the heat pump was operated with a dead band of 0.1 K between 21.5 and 21.6 °C. The small dead band separates the heating and cooling mode and was necessary for IDA ICE to accept the concept of one conditioning supply temperature. The reported energy use throughout the paper is in the form of electricity supplied to the heat pump.

2.2.1. Ventilation

The ventilation in the office was supplied with outdoor air from the air handling unit (AHU) to keep the CO2 concentration below 950 ppm during office hours. The AHU was equipped with heat recovery and a heating coil, which was controlled to heat the supply ventilation air to a constant 20 °C. The water for the ventilation heating coil had the same temperature as was supplied to the radiant ceiling. This was a deliberate design choice to support the concept of one conditioning water temperature to all systems. The ventilation temperature was achieved to the extent that the capacity was available, i.e., if the heat recovery unit, the heating coil size, and supply temperature was enough. The AHU did not have any cooling coil, i.e., the cooling load was fully on the radiant ceiling. The heat recovery was set to an effectiveness of 85%, and the Specific Fan Power (SFP) for the AHU was set to 1200 W/(m3/s) at a nominal ventilation flow rate. The ventilation flow rate to offices and meeting rooms were defined according to ISO 17772-2 [42] Category I, which corresponds to 10 L/s per person, with an additional 1 L/s per m2 of the zone area to ventilate for background pollution. The total ventilation rate for offices and meeting rooms was 46 L/s and 102 L/s, respectively, with Constant Air Volume (CAV) control.

2.2.2. Leakage

The air passage between the plenum and office was modelled by utilising the IDA ICE leak component model. The leak component had an Equivalent Leakage Area (ELA) of 21.6 m2 (the whole ceiling) and represented a fixed pressure drop of 4 Pa between the two zones [43]. The fixed pressure drop in the ceiling and the pressure drop in the ductwork and in the AHU were included in the estimated specific fan power for the ventilation system. The leakage model or pressure drop of the ceiling did not influence the ventilation flow rate.

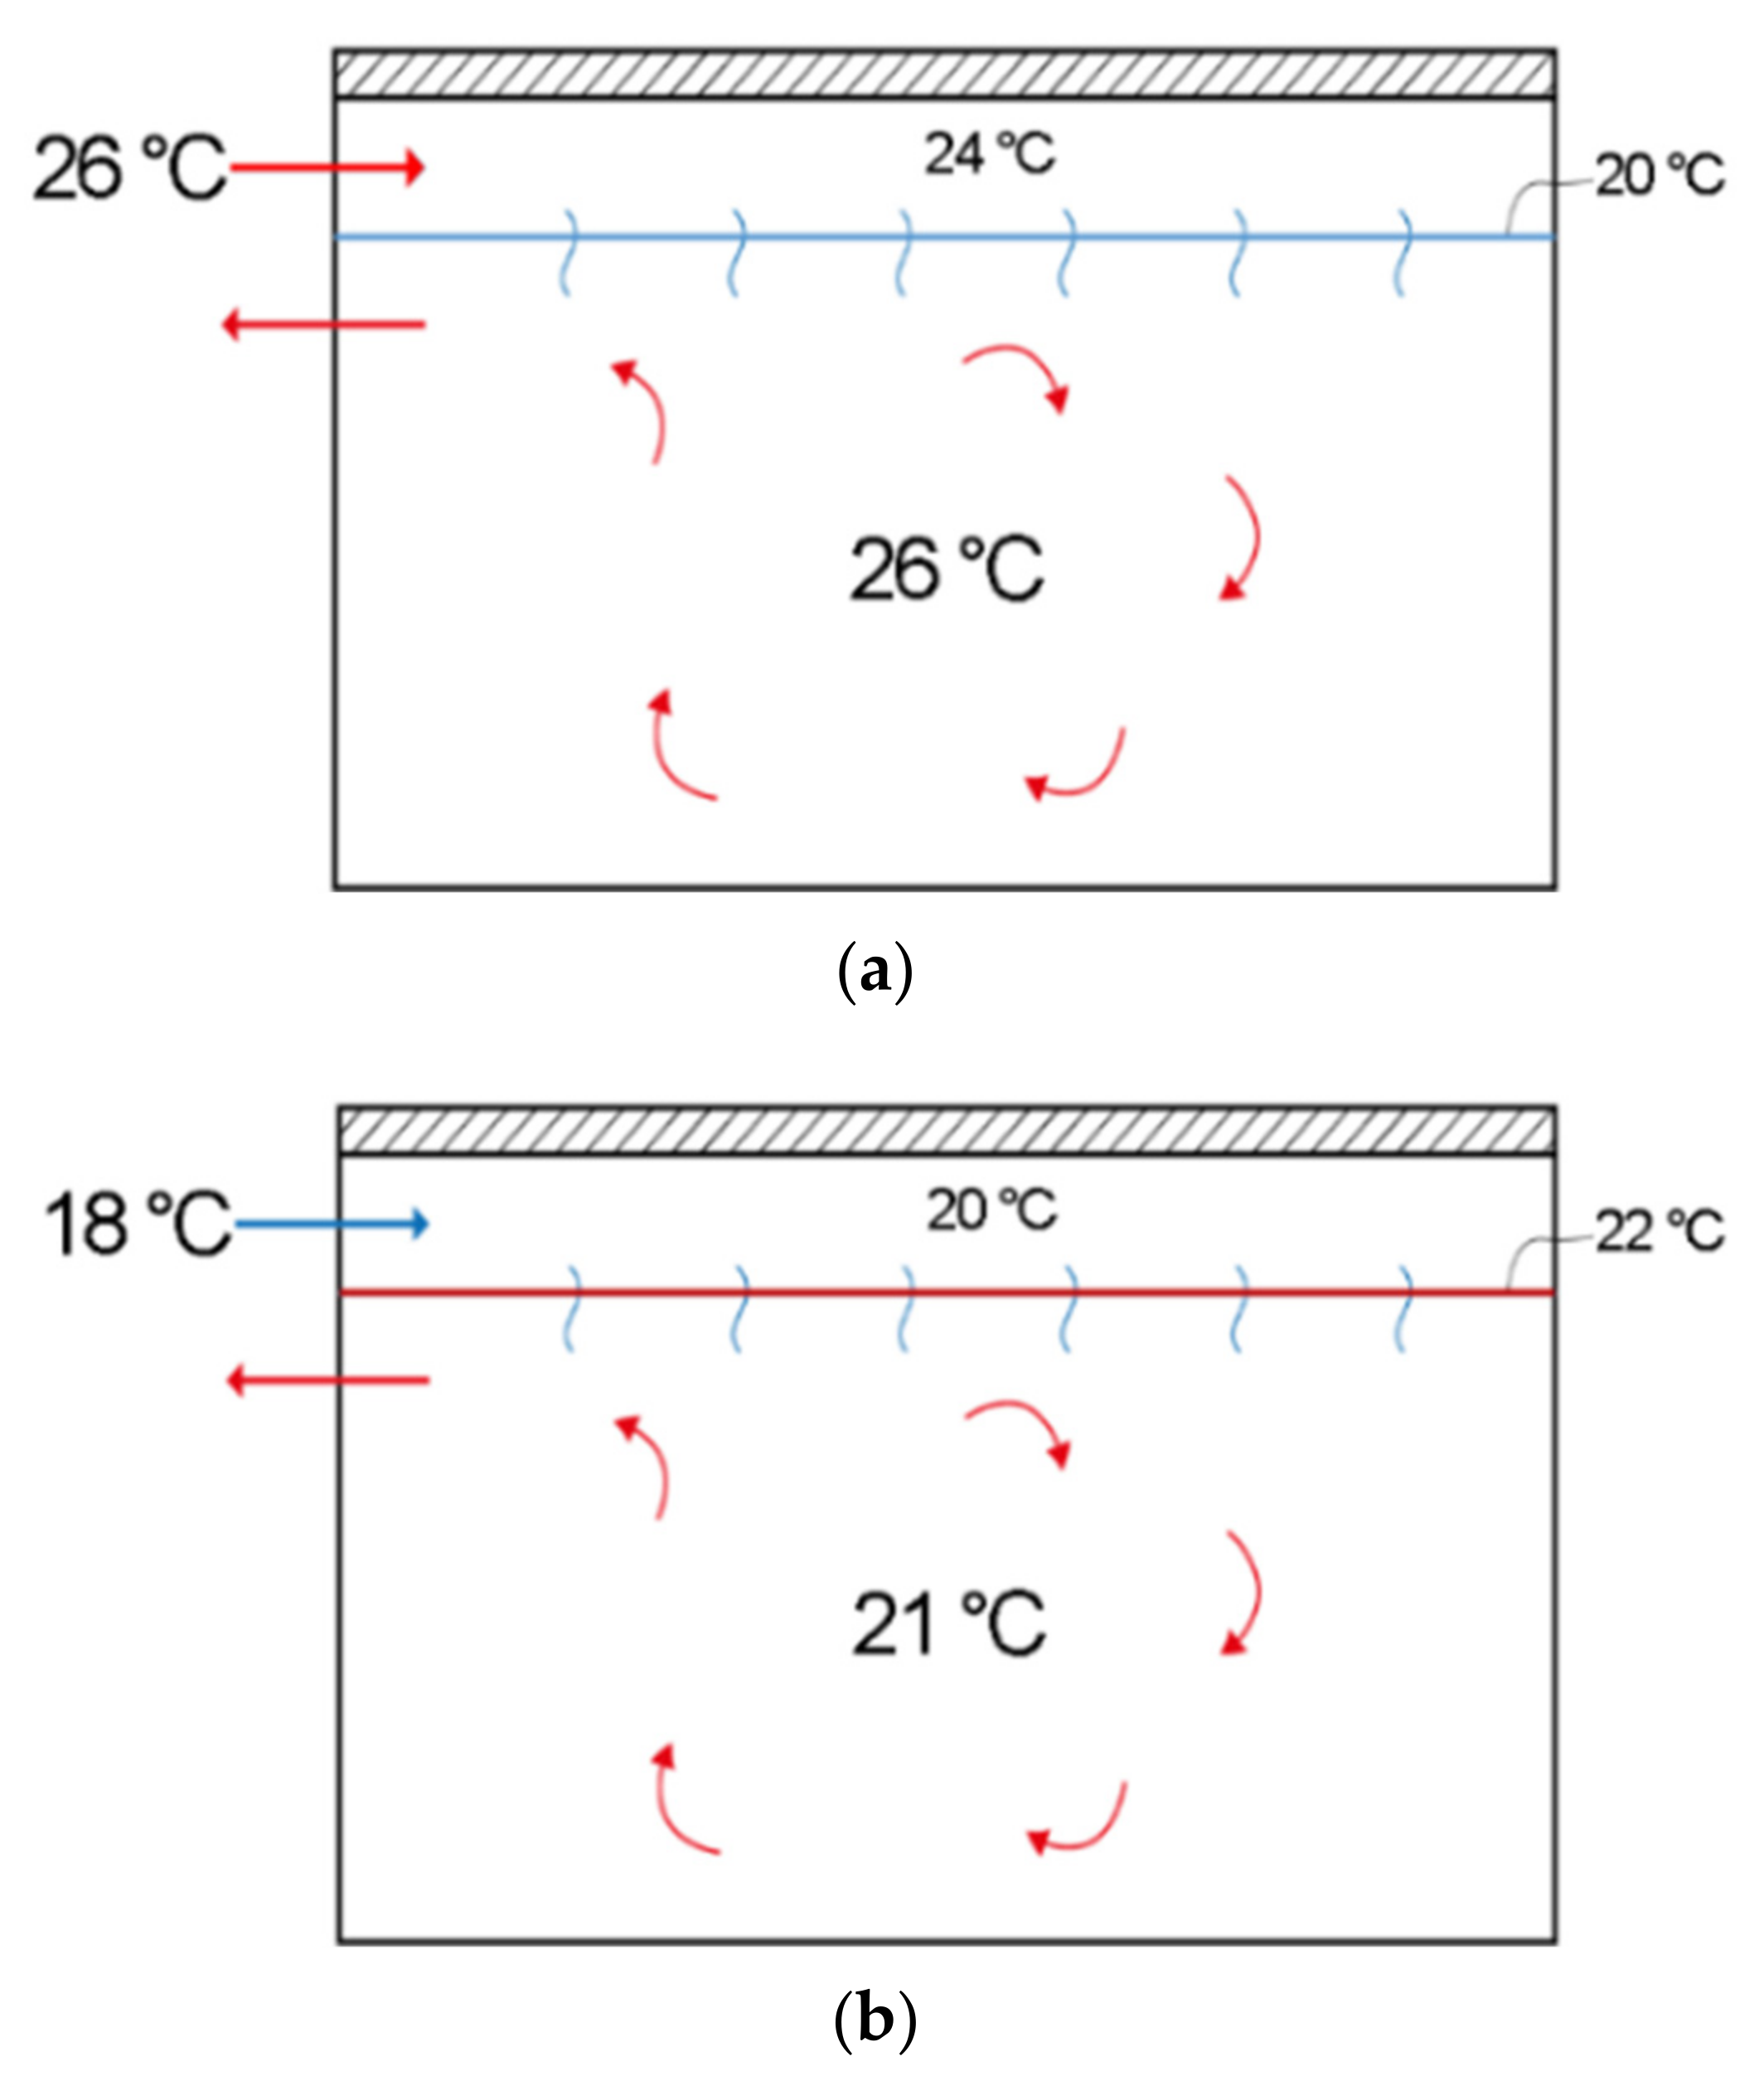
2.2.3. Radiant Heating and Cooling Ceiling Model

The HVACeiling was modelled using the IDA ICE component model ‘heating/cooling floor’ for embedded heating/cooling systems [44]. The IDA ICE component model represented an idealised heat-conducting plane with a uniform temperature inside the suspended ceiling. The heat transfer from the water in the embedded pipes and to the heat conducting plane (or “fin”) was represented by a water-to-fin heat transfer coefficient, Hwpf, which in this study was set to 10 W/m2K. This value was derived from finite-element simulations of the heat flows in a ceiling prototype [45]. The authors investigated the surface heat transfer coefficients in a previous study [10] and used them in the model (Table 2).
The mass flow was constant and always on. The design powers were 58.5 W/m2 [46] and 45.7 W/m2 [21] at ΔT = 10 K between supply and return pipe. The fixed mass flows were defined by the software at ΔT of 5 and 8 K, resulting in mass flows of 0.060 and 0.038 kg/s. For these mass flows, the pressure drop was 750 and 480 Pa/m, as the IDA ICE component used a pipe diameter of 10 mm. These are reasonable pressure drops close to practical installations.

2.3. Feasibility Study

For the first part of this investigation of the HVACeiling several parameters were tested in a feasibility study. The locations were the following with the corresponding weather file sources:
  • Copenhagen, Denmark; the Danish “Design Reference Year” (DRY) weather file [47];
  • Paris, France; weather file from ASHRAE IWEC2 [48];
  • Munich, Germany; weather file from ASHRAE IWEC2 [48].
Three different window sizes were tested with three different kinds of glazings to investigate window sizes and solar-coatings, including their impact on daylight. IDA ICE was used to simulate daylight. All combinations were tested with three different water temperatures to see which were able to maintain thermal comfort in the different room types, orientations, and locations. This led to 1296 combinations. The different parameters and values are listed in Table 3.
The simulated results from the combinations are formed into a design guide that illustrates the feasibility of combinations in terms of energy use, peak heating and cooling demand, thermal comfort, and daylight. The guide provides advice for the early design stage where design decisions are crucial for successful design and implementation of the self-regulating HVACeiling.

2.4. Generic Office Building

The second part of the investigation uses a generic office building located in Copenhagen to assess the HVACeiling and two-pipe layout in a more practical setting and to quantify the energy savings and peak power in comparison to the other solutions. The office building included six rooms, three offices towards the South, two offices and one meeting room towards the North, see Figure 5. The feasibility guide was used to select the optimal combination of parameters. This meant a window to floor area of 15% in the rooms towards South; towards North the window to floor area was recommended to be 22%. The following parameters in bold were used:
  • Climate: Copenhagen–Paris–Munich;
  • Window to floor area: 15%–22%–30%;
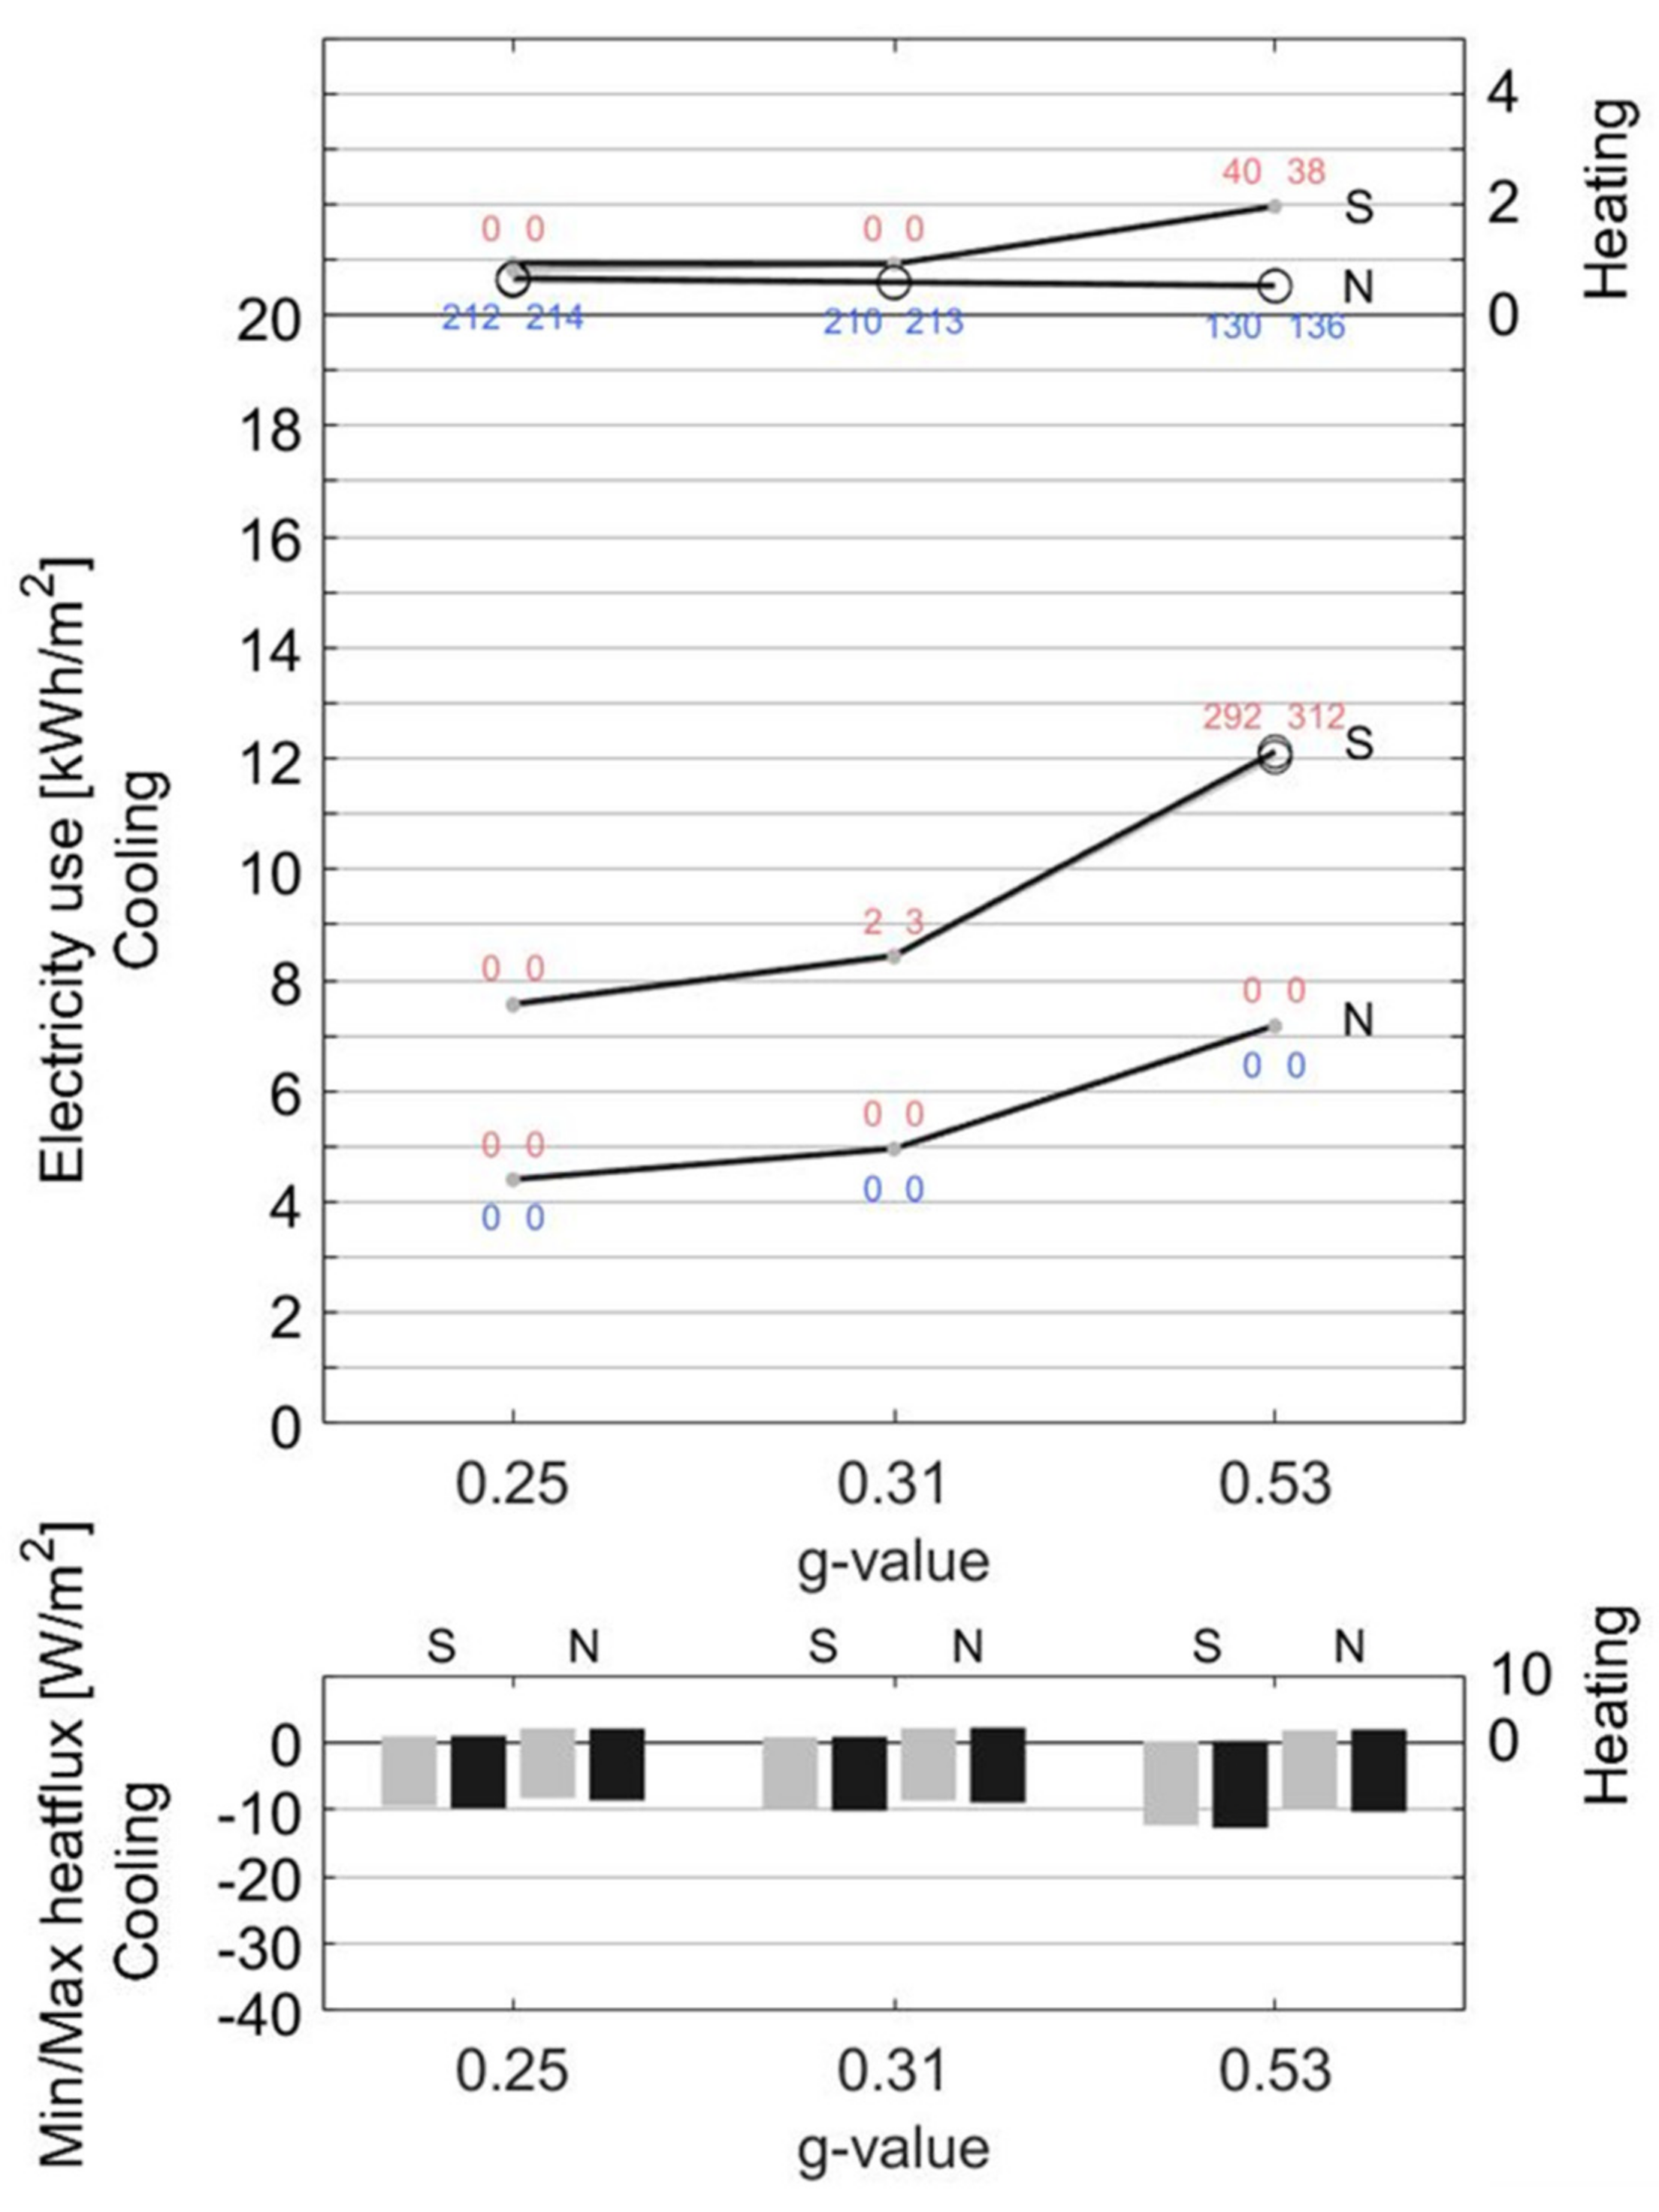
  • g-value of glazing: 0.25–0.31–0.53;
  • Water supply temperature: 20 °C–22 °C (summer)–24 °C (winter);
  • Water flow to each room: 0.038 kg/s–0.060 kg/s.
The generic office building was tested as described above with diffuse ventilation and compared with other indoor comfort solutions that are common on the European continent. The tested systems are listed here:
  • HVACeiling: Two-pipe layout, radiant ceiling with diffuse ventilation through the plenum;
  • Radiant ceiling + CAV: same as above, but the ventilation is supplied directly to the occupied room; for direct assessment of the impact from diffuse ventilation;
  • Fancoil + Convector: Cooling pipes to the fan coil unit and heating pipes to convectors; ventilation by CAV mixing;
  • VAV + Convector: VAV controlled mixing ventilation for cooling and heating pipes to convectors for heating.
The radiant ceiling with mixing ventilation had the same input parameters as the HVACeiling, but the air was supplied directly to the room instead of the plenum. The fan coil case used mixing ventilation with CAV to supply air to the room. A recirculating fan coil was installed for cooling. The Daikin fan coil, FWF03BF, with an airflow of 366 m3/h, had a nominal cooling capacity of 2.3 kW and a corresponding SFP of 610 W/(m3/s). The fan coil was only operating during occupied hours. The fan coil case and the VAV case had a fixed water supply temperatures of 16 °C for cooling and 55 °C for heating. A convector of 500 W supplied the heating in each room in these cases. The ventilation air supply temperature was 18 °C in the two latter cases. The VAV case supplied air to the room on weekdays during the occupied hours. The CAV cases had a constant SFP of 1200 W/(m3/s) the VAV case had a SFP of 1500 W/(m3/s) at peak flow rate. The ventilation air supply operated with minimum of 46 L/s (office spaces) and 102 L/s (meeting room) and maximum of 130 L/s and 260 L/s.

3. Results

The results section presents the feasibility guide, followed by results from the generic office building. The guide starts by verifying the applicability of the different window sizes and solar-coatings in accordance to the daylight requirements.

3.1. Daylight

It is essential to apply effective solar control to reduce the cooling load and increase the thermal comfort in buildings. However, solar coatings reduce the light transmittance of the glazing and subsequently the exposure to daylight for the occupants inside. The level of daylight in a room recommended for vertical openings are described in EN 17037 [49]. The minimum requirement states that there should be 300 lux in 50% of the reference plane in 50% of the daylight hours over the year. In the office spaces simulated here, the reference plane was assumed to be the entire room. According to the standard, the minimum requirement can be translated into daylight factor, which in Copenhagen corresponds to 2.1%, and Munich and Paris corresponds to 1.9% [49]. This means that a combination of window size and light transmittance that is acceptable in Copenhagen is also sufficient in Munich and Paris.
Figure 6 shows the fraction of daylight hours in Copenhagen above 300 lux for all window types and orientations. The simulated fractions are valid for the central point (shifted slightly away from the window to compensate for the daylight arc) of the room, i.e., 50% of the reference plane. We may deduce from this figure that almost all combinations of window-to-floor ratio and g-values are acceptable, except the window-to-floor ratio of 15% towards North with a g-value of 0.25.

3.2. Feasibility Guide

The parametric study for this investigation resulted in 1296 simulations, where several solutions for both offices and meeting rooms were feasible in the sense that the thermal comfort and daylight criteria were respected. The results from these simulations were collected into a feasibility guide. The objective of the guide is to illustrate the feasible solutions in an office setting for the HVACeiling operating with only a small temperature offset.
The core diagram of the guide is depicted in Figure 7. The upper part of the diagram with four solid lines illustrates total electricity use (in kWh/m2) for the cooling and heating seasons for three g-values (0.25–0.31–0.53) and for two orientations (North and South). Each of the four solid lines is in fact two lines for different mass flow rates, but in many scenarios these curves coincide.
The red and blue numbers are cumulative hours above and below the thermal comfort thresholds of 26 and 21 °C. Vertically adjacent blue or red numbers correspond to two, often coinciding, mass flow rates. The cumulative hours are only depicted when it is of value considering season and orientation. Solutions that exceed the thermal comfort thresholds are infeasible and marked with a big ring (O).
The lower diagram part with bars illustrates peak heat fluxes during heating (positive) and cooling mode (negative). The diagram shows significantly higher peak heat flux in the cooling season. This is reflected in the upper diagram where electricity use (for the reversible heat pump) is high in the cooling season.
In the guide there is one core diagram, such as Figure 7, for each window-to-floor ratio and each water supply temperature, which sums up to nine figures. This set of figures is given for the workstation space (denoted as the office) and the meeting room, representing two levels of internal heat gains and for each of the three climates. In total, Appendix A contains 54 core diagrams.
Figure 8 describes how to use the guide and each step is described in detail below Figure 8. In shorter words, the guide starts by focusing on the cooling season. The process then identifies the right window size, glazing, and water temperature combination given the thermal comfort criteria. Then, the envelope combination is tested in the heating season and the heating water temperature is found, again given the thermal criteria. When all room types are settled, the minimum and maximum water temperatures that satisfy all rooms and the total energy use can be determined.
The guide contains 17 steps. Each step is easy to follow and together the steps form a coherent guide for self-regulating HVACeiling installations in buildings. It would be straightforward to computerize the guide.
Step 1 is to find a climatic location for the building similar to one of the three simulated climatic conditions: Copenhagen, Paris, or Munich. In step 2, the room type is selected: either meeting room or office space. The main difference between the two is the internal heat load. Later, the guide can be repeated several times to cover both room types and those in between.
Then the initial window size (step 3) and orientation (step 4) must be determined. To determine the cooling need, the cooling curves should be found (step 5): find the point across all cooling curves where thermal comfort is acceptable and energy use is low. Note the g-value and check that daylight is sufficient with (step 6). Then lock the g-value (step 7). If daylight is insufficient, iterate between steps 6 and 7 to find the optimum. Take a note of the water temperature (step 8), energy use, and overheating (red numbers, step 9).
To determine the necessary water supply temperature for heating, locate the heating curves for the locked g-value (step 10) and find the point with the lowest energy consumption and first thermal comfort (blue numbers above 0, step 11). Then take a note of the water temperature (step 12) and note the energy consumption (step 13). In step 14, the heating and cooling energy consumption as well as overheating should be summed.
If the building contains several room types, go through the 13 steps again (step 15) and find the minimum temperature for water in the cooling scenarios and the maximum water temperature for the heating (step 16) and lastly, recalculate the total energy use and overheating with the new temperatures (step 17). The total amount of overheating should not exceed 100 h [40] (red numbers). In addition, there should not be any hours with insufficient heating (blue numbers).

3.3. Generic Office Building

The design guide was used to find a suitable parameter combination for the Danish climate. To test the performance of the HVACeiling the solution was set up in a generic office building with six rooms and compared to other conditioning solutions.
The study presents the yearly cumulated electricity use and boxplots of thermal comfort. Time-series from one cold week and one warm week illustrate electricity loads and how the HVACeiling exploits the upper concrete slab as thermal buffering capacity better than the other solutions.

3.3.1. Yearly Summary

A boxplot of the yearly operative temperatures is given in Figure 9 for the occupied hours. The box marks the first and the third quartiles and the whiskers mark the minimum and maximum values. Crosses mark average values. Dots mark outliers, i.e., rare events.
The HVACeiling and radiant ceiling operated without controls, only with a fixed water supply of 24 °C in the heating season (November–March) and 22 °C in the transition- and cooling seasons (April–October). The fan coil and VAV option had control systems that started heating below 21.5 °C and cooling above 24 °C.
Figure 9 shows that the four solutions maintain the same indoor temperature for the majority of the occupied hours. The HVACeiling shows a few outliers, indicating a few solitary hours with inadequate thermal comfort. The South oriented offices had 10–17 h above 26 °C, no hours below 20 °C, but 10–60 h below 21 °C. The meeting room had no hours below 21 °C, but 63 h above 26 °C. The radiant ceiling had 55–65 h above 26 °C in the offices towards South and 91 h in the meeting room. The North oriented office with two façade walls showed in both cases 5 h below 20 °C. This shows that thermal comfort will benefit from a momentary supply temperature raise during the coldest periods, e.g., from 24 to 26 °C. The supply temperature could likewise be lowered from 22 to 20 °C during the warmest periods.
Assessment of thermal comfort was supplemented with analyses of energy usage and peak power to provide comprehensive evaluation. Therefore, the yearly primary energy for cooling, heating, and fan power is shown in Figure 10. The stacked bars show that the HVACeiling reduced the total primary energy by 20–30% compared to standard fan coil and VAV solution. The total energy use of the HVACeiling and the radiant ceiling was within ±5%, as the systems are very similar and provide heating and cooling by circulation of water. Because of the small deadband in the radiant cases, a distinction between heating and cooling does not make sense. In this perspective, it is remarkable that the radiant systems used the same amount of heating + cooling energy as the fan coil case, which had a bigger deadband. The same figure also shows that cooling by transport of air is quite energy consuming.

3.3.2. Weekly Time-Series

This section contains weekly time-series from one cold and one warm week. Figure 11 shows the operative temperatures in the most critical rooms for the warm week and cold week. The most critical room in the warm week was a South-facing office space (office S1). During the cold week, it was a North-facing corner office (office N3). The heat loss from the corner office is significantly bigger, especially during the extra cold week depicted. This means the water supply temperature was raised during this week to 26 °C to cover the heat loss and avoid that the temperature in the HVACeiling case dropped below 20 °C. It was above 21 °C during all occupied hours.
The fan coil and VAV case started the week with higher temperatures as no cooling was provided during the weekends; the radiant solutions started almost 2 °C lower. The operative temperature was very stable around 24–25 °C in the fan coil and VAV cases due to the cooling setpoint of 24 °C and high capacity. The radiant solutions fluctuated more, allowing the thermal mass to be activated. Comparing the HVACeiling to the radiant + CAV solution, the peak operative temperature in the HVACeiling case was 1 °C lower, which is similar to a previous study by the authors [10]. For the cold week, the radiant solutions showed that the temperature on Monday morning (hour 6) and Tuesday morning (hour 31) is 20 °C, as the temperatures drop during the weekends.
Figure 12 shows a warm week, for all rooms, the cumulative electric cooling and fan power, where it is evident that the radiant solutions operate with much lower peaks. The electricity use for cooling for this warm week for the HVACeiling was 29.1 kWh, with a peak of 400 W, where the fan coil and VAV had an electrical energy use of 26.3 and 21.1 kWh, respectively. However, the peak powers were 1300 W and 1100 W, which was three times that of the HVACeiling. Higher peak power requires a larger cooling unit, which is more expensive in installation and runs more inefficiently under part-load. The fan power for the same period was 73–92% larger for the fan coil and VAV, where the peak power reached the same as for the cooling. Under the fan power, there was, therefore, a significant energy saving potential by using the HVACeiling.
Figure 13 shows for all rooms the cumulated electric heating and fan power for a cold week in March. Where the warm week showed clear tendencies regarding cooling load, the heating does not show any significant difference between systems. The total heating consumption between the solutions was ±10%. All systems had high heating peak power in the morning, which was due to the sudden extra heat losses when the ventilation was started. The fan power showed the same tendency as the fan power in the warm week, where the fan coil and VAV solution is 74% and 44% higher than the HVACeiling.
Figure 14 and Figure 15 show the selected heat fluxes in the warm and cold weeks to identify the origin of the resulting indoor temperature. The heat fluxes from the construction surfaces (which includes the embedded pipes) were significantly higher in the radiant systems. In Figure 14 the radiant systems were responsible for a substantial amount of the total cooling to the room (blue curves: 400–600 W). In comparison, the fan coil and VAV solutions transferred heat only by airflow (600–800 W). The thermal buffering effect of the upper concrete slab is apparent as the yellow curve showing charge and discharge in every 24 h cycle. The slab absorbed heat during the day and emitted heat at night, consequently pre-cooling the ventilation supply air. While the charging/discharging seemed to be more efficient with the HVACeiling in the cooling season, there was no benefit in the heating season (Figure 15).
Table 4 summarizes the total charge/discharge of the concrete slab during the warm and cold weeks. The absorbed and emitted heat does not balance, because heat was transferred also through the façade in the plenum. The values show that the HVACeiling, by combining diffuse ventilation and concrete slab, stored more energy in the slab, especially during the cooling season.

4. Discussion

The feasibility study shows that several combinations of building design and HVACceiling parameters create feasible solutions, i.e., the thermal comfort is acceptable, even with no active controls but a central control of the water supply temperature. However, the investigations in the generic office building showed that in critical rooms with higher heat loss there would be temperatures below 21 °C. It should be made clear in the construction process if a minimum temperature of 20 or 21 °C is aimed for. A minimum temperature of 21 °C will require 26 °C water supply temperature during cold periods in Denmark, the Northern-most climate analysed. In addition, a few hours below 21 °C in the morning should be tolerated.
In general, all four conditioning solutions provided thermal comfort in the occupied hours except for a few hours, however, the radiant solutions drifted much more during the working day. The accurate control and high capacity of the fan coil and VAV solutions ensured very little temperature drift, but this required a higher energy use. The temperature drift activated the thermal mass in the concrete slab, where the accurate control of the fan coil and VAV almost makes the thermal mass inactive. The benefit is a very stable indoor temperature, but the ‘cost’ is much higher energy use, peak loads, and complex control systems. The peaks could be reduced with optimum start-stop strategy, but that would require very sophisticated sensing and control systems.
In comparison, the radiant options can provide adequate thermal comfort with no controls and less energy use. The simulations also showed that the HVACeiling performs slightly better by activating the thermal mass than the radiant ceiling option and achieves lower peak temperatures. Stratification of the temperatures through the room as well as the risk of draught was not investigated. However, with a VAV supply of 6 L/s m2, the ventilation inlet should be designed with caution. The same can be stated for the fan coil, which operated with 4.7 L/s m2.
A control of the supply water temperature to the building depending on the outdoor temperature or based on logged data from the rooms would be beneficial for the thermal comfort for the most extreme periods of cold or warm outdoor conditions. This control was not implemented in the simulations presented here. Negative impact of this control may happen in some cases, e.g., in very cold periods with high solar gain, where the control raises the supply momentarily to cover the heating demand in North-oriented rooms but does not cover the cooling demand in the South-oriented rooms. However, in such a case, timed opening of the windows will effectively remove any overheating.
The feasibility results also showed that rooms with high internal gains (meeting rooms) should be placed towards North to avoid concurrent internal and solar gains. Even if the usage of the meeting rooms is lower than anticipated in this study and temperature may drop as a result of that, over-heating is still the biggest concern in near-zero energy buildings.
The internal gains were almost sufficient as heating sources in the daytime, and only a limited amount of heating was necessary. However, to prove compliance with heating codes at minimum design outdoor temperature, the internal gains or solar gains cannot be taken into account. However, to prove compliance, the water supply temperature can simply be raised by some degrees. The self-regulation will suffer, but without people present, it is a hypothetical problem. A more realistic problem is that during long periods of non-occupancy or if only parts of the building are operating/active, then using a fixed water supply temperature to the entire building could have implications on the performance of the active parts of the building. Therefore, further investigations should be performed with more focus on the heating season.
The daylight investigations showed sufficient daylight according to standard EN 17037 except for the smallest window size and lowest g-value in the North-oriented workspace. The investigation only included simple rectangular windows, yet further examinations of different shapes and other sizes should be conducted. In general, it is recommended to use combinations of windows and g-value/light transmittance that just meet the daylight criteria.

5. Conclusions

This paper presented a parametric numerical study of the self-regulating HVACeiling concept, combining diffuse ventilation, a suspended radiant ceiling, a two-pipe layout, and the thermal effect of the concrete slab in the plenum. The research objectives from Section 1.2 were to analyse the HVACeiling parametrically, to synthesize the analysis into a design guide and to assess the applicability in a generic office building. From the investigation, it can be concluded that:
  • From the parametric analysis it was possible to find multiple feasible building and system parameter combinations where the HVACeiling in a European climatic context would provide acceptable thermal comfort;
  • Thermal comfort was achieved even with almost no active control systems exploiting the self-regulating effect with fixed mass flow and fixed supply temperature;
  • During a warm week, the HVACeiling peak power was 64–69% lower than all-air solutions. During a cold week, peak power was ±10%. Yearly energy savings were 20–30% on primary energy;
  • The HVACeiling benefitted more from activation of the thermal capacity in the concrete slab than did the radiant solution with ordinary mixing ventilation supply, in effect reducing the peak operative temperature by 1 °C;
  • The HVACeiling with a two-pipe layout was able to sustain thermal comfort in a Danish climate in all workspaces in a generic office building with 22 °C water supply in summer and 24 °C in winter;
  • The central water supply temperature should be adjusted up to 26 °C during the coldest week.
The results showed that in a Danish climate the heating temperature should be raised on the coldest days so that the workspace would not be colder than 21 °C in the morning. The results also showed that the thermal storage capacity was exploited in the conditioning of the room. The study was based on numerical analyses, which makes parametric analyses easier. It should, however, be investigated further and verified by experimental analyses.
Finally, the numerical performance presented here shows that the HVACeiling as an integrated solution reduces the energy use compared to all-air systems and sustains thermal indoor comfort even with a small temperature offset, which supports the agenda of making the building and energy sector more sustainable.

Author Contributions

M.R.K.: Conceptualization, Methodology, Investigation, Writing original draft & editing. C.A.H.: Conceptualization, Supervision, Project administration, Writing and review & editing. All authors have read and agreed to the published version of the manuscript.

Funding

Innovation Fund Denmark (grant: 5189-00088A) and Saint-Gobain Nordic A/S.

Institutional Review Board Statement

Not applicable.

Informed Consent Statement

Not applicable.

Data Availability Statement

The data presented in this study is available on request from the corresponding author.

Conflicts of Interest

The authors declare no conflict of interest. The funders had no role in the design of the study; in the collection, analyses, or interpretation of data; in the writing of the manuscript, or in the decision to publish the results.

Appendix A

Appendix contains results from parametric analysis of workspaces in terms of energy consumption, thermal comfort, and heating/cooling peak heat flux for workspaces with North and South orientation. The office space results are structured in Figure A1, Figure A2 and Figure A3 for three geographic locations, and the meeting room results are likewise structured in Figure A4, Figure A5 and Figure A6.
Figure A1. Copenhagen office.
Energies 15 01319 g0a1aEnergies 15 01319 g0a1b
Figure A2. Munich office.
Energies 15 01319 g0a2aEnergies 15 01319 g0a2b
Figure A3. Paris Office.
Energies 15 01319 g0a3aEnergies 15 01319 g0a3b
Figure A4. Copenhagen meeting.
Energies 15 01319 g0a4aEnergies 15 01319 g0a4b
Figure A5. Munich meeting.
Energies 15 01319 g0a5aEnergies 15 01319 g0a5b
Figure A6. Paris meeting.
Energies 15 01319 g0a6aEnergies 15 01319 g0a6b

References

  1. Clean Energy for All Europeans Package|Energy. Available online: https://ec.europa.eu/energy/topics/energy-strategy/clean-energy-all-europeans_en (accessed on 13 October 2021).
  2. Hepbasli, A. Low exergy (LowEx) heating and cooling systems for sustainable buildings and societies. Renew. Sustain. Energy Rev. 2012, 16, 73–104. [Google Scholar] [CrossRef]
  3. Nearly Zero-Energy Buildings-European Commission. Available online: https://ec.europa.eu/energy/en/topics/energy-efficiency/buildings/nearly-zero-energy-buildings (accessed on 3 July 2018).
  4. Wargocki, P.; Wyon, D.P. Ten questions concerning thermal and indoor air quality effects on the performance of office work and schoolwork. Build. Environ. 2017, 112, 359–366. [Google Scholar] [CrossRef] [Green Version]
  5. Allen, J.G.; Macnaughton, P.; Satish, U.; Santanam, S.; Vallarino, J.; Spengler, J.D. Associations of Cognitive Function Scores with Carbon Dioxide, Ventilation, and Volatile Organic Compound Exposures in Office Workers: A Controlled Exposure Study of Green and Conventional Office Environments. Environ. Health Perspect. 2016, 124, 805–812. [Google Scholar] [CrossRef] [PubMed] [Green Version]
  6. Meierhans, R.A. Slab cooling and earth coupling. ASHRAE Trans. 1993, 99, 511–518. [Google Scholar]
  7. Karlsson, H. Self-Regulating Floor Heating Systems in Low Energy Buildings. In Proceedings of the 8th Symposium on Building Physics in the Nordic Countries, Copenhagen, Denmark, 16–18 June 2008; pp. 519–526. [Google Scholar]
  8. Karlsson, H. Thermal Modelling of Water-Based Floor Heating Systems. Ph.D. Thesis, Chalmers University of Technology, Gothenburg, Sweden, 2010. Available online: http://citeseerx.ist.psu.edu/viewdoc/download?doi=10.1.1.459.4627&rep=rep1&type=pdf (accessed on 15 December 2021).
  9. Krusaa, M.R.; Hviid, C.A.; Kolarik, J. Numerical analysis of the potential of using light radiant ceilings in combination with diffuse ventilation to achieve thermal comfort in NZEB buildings. In Proceedings of the 38th AIVC Conference, Nottingham, UK, 13–14 September 2017. [Google Scholar]
  10. Krusaa, M.R.; Hviid, C.A. Combining suspended radiant ceiling with diffuse ventilation–Numerical performance analysis of low-energy office space in a temperate climate. J. Build. Eng. 2021, 38, 102161. [Google Scholar] [CrossRef]
  11. Krusaa, M.R.; Hviid, C.A. Reduced-scale experiments of heat transfer from integrated radiant ceiling panel and diffuse ceiling ventilation. Appl. Therm. Eng. 2021, 197, 117348. [Google Scholar] [CrossRef]
  12. Hviid, C.A.; Svendsen, S. Experimental study of perforated suspended ceilings as diffuse ventilation air inlets. Energy Build. 2013, 56, 160–168. [Google Scholar] [CrossRef]
  13. Yang, H. Experimental and Numerical Analysis of Diffuse Ceiling Ventilation. Master’s Thesis, Technical University of Denmark, Kgs. Lyngby, Denmark, 2011. [Google Scholar]
  14. Lestinen, S.; Kilpeläinen, S.; Kosonen, R.; Jokisalo, J.; Koskela, H.; Melikov, A. Flow characteristics in occupied zone—An experimental study with symmetrically located thermal plumes and low-momentum diffuse ceiling air distribution. Build. Environ. 2018, 128, 77–88. [Google Scholar] [CrossRef]
  15. Lestinen, S.; Kilpeläinen, S.; Kosonen, R.; Jokisalo, J.; Koskela, H. Experimental study on airflow characteristics with asymmetrical heat load distribution and low-momentum diffuse ceiling ventilation. Build. Environ. 2018, 134, 168–180. [Google Scholar] [CrossRef] [Green Version]
  16. Rhee, K.-N.; Kim, K.W. A 50 year review of basic and applied research in radiant heating and cooling systems for the built environment. Build. Environ. 2015, 91, 166–190. [Google Scholar] [CrossRef]
  17. Olesen, B.W. Using building mass to heat and cool. ASHRAE J. 2012, 54, 44–52. [Google Scholar]
  18. Weng, W.B.; Yu, J.; Zhang, T.K. Characteristic Analysis of Ceiling Radiant Heating of Capillary Tube. Adv. Mater. Res. 2011, 383–390, 6042–6047. [Google Scholar] [CrossRef]
  19. Zhang, C.; Heiselberg, P.K.; Pomianowski, M.; Yu, T.; Jensen, R.L. Experimental study of diffuse ceiling ventilation coupled with a thermally activated building construction in an office room. Energy Build. 2015, 105, 60–70. [Google Scholar] [CrossRef]
  20. Zhang, C.; Heiselberg, P.K.; Chen, Q.; Pomianowski, M.Z. Numerical analysis of diffuse ceiling ventilation and its integration with a radiant ceiling system. Build. Simul. 2016, 10, 203–218. [Google Scholar] [CrossRef] [Green Version]
  21. Babiak, J.; Olesen, B.W.; Petras, D. Low Temperature Heating and High Temperature Cooling: REHVA Guidebook No. 7; REHVA: Brussels, Belgium, 2013. [Google Scholar]
  22. Kazanci, O.B.; Olesen, B.W. IEA EBC Annex 59-Possibilities, Limitations and Capacities of Indoor Terminal Units. Energy Procedia 2015, 78, 2427–2432. [Google Scholar] [CrossRef] [Green Version]
  23. Liu, X.; Zhang, T.; Tang, H.; Jiang, Y. IEA EBC Annex 59: High temperature cooling and low temperature heating in buildings. Energy Build. 2017, 145, 267–275. [Google Scholar] [CrossRef]
  24. Koschenz, M.; Lehmann, B. Thermoaktive Bauteilsysteme Tabs. Eidgenössische Materialprüfungs- und Forschungsanst, Zentrum für Energie und Nachhaltigkeit, Schweitz, Department für Umwelt. 2000. [Google Scholar]
  25. Olesen, B.W.; Liedelt, D.F. Cooling and Heating of Buildings by Activating Their Thermal Mass with Embedded Hydronic Pipe Systems. In Proceedings of the ASHRAE-CIBSE, Dublin, Ireland, 3–4 April 2001. [Google Scholar]
  26. Yu, T.; Heiselberg, P.; Lei, B.; Pomianowski, M.; Zhang, C. A novel system solution for cooling and ventilation in office buildings: A review of applied technologies and a case study. Energy Build. 2015, 90, 142–155. [Google Scholar] [CrossRef]
  27. Yu, T.; Heiselberg, P.; Lei, B.; Pomianowski, M.; Zhang, C.; Jensen, R. Experimental investigation of cooling performance of a novel HVAC system combining natural ventilation with diffuse ceiling inlet and TABS. Energy Build. 2015, 105, 165–177. [Google Scholar] [CrossRef]
  28. Zhang, C.; Yu, T.; Heiselberg, P.K.; Pomianowski, M.Z. Experimental Study of an Integrated System with Diffuse Ceiling Ventilation and Thermally Activated Building Constructions, DCE Tech. Rep. No. 182., Department of Civil Engineering, Aalborg University 2014. Available online: https://vbn.aau.dk/ws/portalfiles/portal/207597383/Experimental_Study_of_an_Integrated_System_with_Diffuse_Ceiling_Ventilation_and_Thermally_Activated_Building_Constructions.pdf (accessed on 15 December 2021).
  29. Langner, N.; Bewersdorff, D. Thermal and acoustical simulation of open space working areas in commercial buildings equipped with thermally activated building systems. In Proceedings of the BS2015: 14th Conference of International Building Performance Simulation Association, Hyderabad, India, 7–9 December 2015; pp. 736–742. [Google Scholar]
  30. Maccarini, A.; Wetter, M.; Afshari, A.; Hultmark, G.; Bergsøe, N.C.; Vorre, A. Energy saving potential of a two-pipe system for simultaneous heating and cooling of office buildings. Energy Build. 2017, 134, 234–247. [Google Scholar] [CrossRef] [Green Version]
  31. Maccarini, A.; Hultmark, G.; Bergsøe, N.C.; Rupnik, K.; Afshari, A. Field study of a self-regulating active beam system for simultaneous heating and cooling of office buildings. Energy Build. 2020, 224, 110223. [Google Scholar] [CrossRef]
  32. Kristensen, M.H.; Jensen, J.S.; Heiselberg, P.K. Field study evaluation of diffuse ceiling ventilation in classroom during real operating conditions. Energy Build. 2017, 138, 26–34. [Google Scholar] [CrossRef]
  33. Zhang, C.; Kristensen, M.; Jensen, J.S.; Heiselberg, P.K.; Jensen, R.L.; Pomianowski, M. Parametrical analysis on the diffuse ceiling ventilation by experimental and numerical studies. Energy Build. 2016, 111, 87–97. [Google Scholar] [CrossRef]
  34. Filipsson, P.; Trüschel, A.; Gräslund, J.; Dalenbäck, J.-O. Performance evaluation of a direct ground-coupled self-regulating active chilled beam system. Energy Build. 2019, 209, 109691. [Google Scholar] [CrossRef]
  35. Kretz, M. Huset Med Självreglerande Klimatsystem, Energi & Miljö. 2016. Available online: http://www.energi-miljo.se/sites/default/files/energimilj_0010_low_sid_16-20.pdf (accessed on 2 June 2017).
  36. Maccarini, A.; Afshari, A.; Bergsøe, N.C.; Hultmark, G.; Jacobsson, M.; Vorre, A. Innovative two-pipe active chilled beam system for simultaneous heating and cooling of office buildings. In Proceedings of the 13th International Conference on Indoor Air Quality and Climate, Indoor Air 2014, Hong Kong, China, 8–12 July 2014. [Google Scholar]
  37. Afshari, A.; Norouzi, R.G.; Hultmark, G.; Niels, C. Two-Pipe Chilled Beam System for Both Cooling and Heating of Office Buildings. In Proceedings of the CLIMA 2013: 11th REHVA World Congress & 8th International Conference on IAQVEC, Prague, Czech Republic, 16–19 June 2013. [Google Scholar]
  38. EQUA. IDA Indoor Climate and Energy; EQUA Simulation AB: Zug, Switzerland, 2017; Available online: http://www.equa.se/en (accessed on 20 June 2017).
  39. EN 16798-1; Energy performance of buildings–Ventilation for buildings–Part 1: Indoor environmental input parameters for design and assessment of energy performance of buildings addressing indoor air quality, thermal environment, lighting and acoustics–Module M1. Slovenski Standard: Ljubljana, Slovenia, 2019.
  40. DS 474; Norm for specifikation af termisk indeklima. Dansk Standard: Copenhagen, Denmark, 1993.
  41. Vorre, M.H.; Wagner, M.H.; Maagaard, S.E.; Noyé, P.; Lyng, N.L.; Motensen, L. Branchevejledning for Indeklimaberegninger; Aalborg University: Aalborg, Denmark, 2017. [Google Scholar]
  42. ISO 17772-2; Energy Performance of Buildings—Overall Energy Performance Assessment Procedures—Part 2: Guideline for Using Indoor Environmental Input Parameters for the Design and Assessment of Energy Performance of Buildings. ISO: Geneva, Switzerland, 2018. Available online: https://cdn.standards.iteh.ai/samples/68228/0d787d2690d643b392e01dddf73d4696/ISO-TR-17772-2-2018.pdf (accessed on 15 December 2021).
  43. Edwards, R. Handbook of Domestic Ventilation; CRC Press: Boca Raton, FL, USA, 2005. [Google Scholar]
  44. EQUA, User Manual IDA Indoor Climate and Energy. 2013. Available online: http://www.equaonline.com/iceuser/pdf/ice45eng.pdf (accessed on 15 December 2021).
  45. Krusaa, M.R.; Hviid, C.A.; Magnes, J.; Kolarik, J. Radiant ceilings combined with diffuse ventilation—A numerical parametric study of cooling performance. CLIMA J. 2019, 15–23. Available online: https://www.rehva.eu/rehva-journal/chapter/default-cb84adc317-1 (accessed on 30 November 2020).
  46. Magnes, J. Product Development and Simulations of Hydronic Radiant Ceiling with Diffuse Ventilation. Master’s Thesis, Technical University of Denmark (DTU), Kgs. Lyngby, Denmark, 2019. [Google Scholar]
  47. Wang, P.G.; Scharling, M.; Nielsen, K.P.; Witchen, K.B.; Kern-Hansen, C. 2001–2010 Danish Design Reference Year; Danish Meteorological Institute: Copenhagen, Denmark, 2013. [Google Scholar]
  48. ASHRAE IWEC 2, EQUA Climate Data Download Center. 2001. Available online: http://www.equaonline.com/ice4user/indexIWEC2.html (accessed on 1 March 2019).
  49. DS/EN 17037; Daylight in Buildings. Dansk Standard: Charlottenlund, Denmark, 2018; pp. 1–57. Available online: https://velcdn.azureedge.net/~/media/marketing/ee/professional/28mai2019%20seminar/veluxen17037tallinn28052019.pdf (accessed on 15 December 2021).
Figure 1. The HVACeiling concept [10] for (a) cooling mode; (b) heating mode.
Energies 15 01319 g001
Figure 2. Pipe layout of (a) a standard heating and cooling solution with four pipes and controls; (b) a two-pipe layout with simultaneous heating and cooling.
Energies 15 01319 g002
Figure 3. Parametric simulation model (a) contains 2 × 2 enclosures to simultaneously simulate meeting room and workstation space for two orientations; (b) division of enclosure into plenum zone and office zone.
Energies 15 01319 g003
Figure 4. Internal heat loads in (a) office room; (b) meeting room.
Energies 15 01319 g004aEnergies 15 01319 g004b
Figure 5. Generic office building with room names and layout of two-pipe water supply. Both South and North-oriented spaces are supplied with the same water temperature and the same flow rate. Offices N3 and S3 are corner rooms with a higher heat loss due to more external wall surface.
Energies 15 01319 g005
Figure 6. Percentage of daylight hours above 300 Lux on 50% of the reference plane in all room types.
Energies 15 01319 g006
Figure 7. Core diagram of the feasibility guide showing parameter relations. Upper part: cooling (left axis) and heating usage (right axis) depending on the glazing g-value. Solid lines for North (N) and South-oriented (S) windows as well as two mass flow rates, which are coinciding here. Red and blue numbers indicate cumulative hours above and below thermal comfort thresholds (26 °C and 21 °C). Lower part: peak heat flux in cooling mode (negative values) and heating mode (positive values).
Energies 15 01319 g007
Figure 8. Diagram for feasibility guide for energy and comfort.
Energies 15 01319 g008
Figure 9. Operative temperatures in all the rooms for the HVACeiling, radiant ceiling, FanCoil, and VAV during office hours 7:00 a.m. to 17:00 p.m.
Energies 15 01319 g009
Figure 10. Primary energy use of heating, cooling, and ventilation installations through the year for four different types of systems.
Energies 15 01319 g010
Figure 11. Operative temperatures (Top) for a warm week in July (12th−18th) and a cold week in March (8th−14th).
Energies 15 01319 g011
Figure 12. Peak electric cooling and fan power in a warm week of July (12th–18th). Sum of hourly values for all six rooms over one week.
Energies 15 01319 g012
Figure 13. Peak electric heating and fan power in a cold week of March (8th−14th). Sum of hourly values over one week. The peaks are high for all systems.
Energies 15 01319 g013
Figure 14. Heating/cooling from constructions, airflows, and heating/cooling units in a warm week in July (12th−18th) for office S1. Hourly time-series over one week. The sign convention is positive for heat transferred into the room and negative for heat removed from the room.
Energies 15 01319 g014
Figure 15. Heating/cooling from constructions, airflows, and heating/cooling units in a cold week in March (8th−14th) for office N1. Time-series over week hours. The sign convention is positive for heat transferred into the room and negative for heat removed from the room. Net heat transfer is the absolute sum of heat fluxes.
Energies 15 01319 g015
Table 1. Layers of the constructions in the model from the inside (top) to outside (bottom).
ConstructionMaterialParameters
Suspended ceiling19 mmGypsum 19 mmρ = 970 kg/m3
cp = 1090 J/kgK
Floor separation224 mmFloor coating 4 mm
Screed 20 mmρ = 500 kg/m3
cp = 1050 J/kgK
Hollow-core slab
200 mm
ρ = 1800 kg/m3
cp = 880 J/kgK
Internal wall100 mmGypsum 26 mmρ = 970 kg/m3
cp = 1090 J/kgK
Insulation 48 mmρ = 20 kg/m3
cp = 750 J/kgK
Gypsum 26 mmρ = 970 kg/m3
cp = 1090 J/kgK
External wall486 mmGypsum 26 mmρ = 970 kg/m3
cp = 1090 J/kgK
Insulation (10% wood) 400 mmρ = 20 kg/m3
cp = 750 J/kgK
Gypsum 10 mmρ = 970 kg/m3
cp = 1090 J/kgK
Air gap 30 mm
Tombak 20 mmρ = 8940 kg/m3
cp = 395 J/kgK
Table 2. Convective heat transfer coefficients used in IDA ICE.
W/m2KCFD Study [10]Rehva [21]
SumWinSumWin
PlenumSlab3.61.9--
Ceiling2.44.2--
RoomCeiling--6.01.0
Slab--0.90.9
Table 3. Parametric study values used in IDA ICE.
ParameterValues
ClimateCopenhagenParisMunich
Internal gainsMeeting roomOffice space
OrientationNorthSouth
SeasonHeatingCooling
Window to floor area15%22%30%
Water supply temperature20 °C22 °C24 °C
Water flow0.038 kg/s0.060 kg/s
g-value of glazings0.250.310.53
Table 4. Heat emitted or absorbed from the concrete slab in the warm or cold week, in Wh/m2.
Warm WeekCold Week
AbsorbedEmittedAbsorbedEmitted
HVACeiling112967675
Radiant ceiling + CAV79644344
Fan coil + convector48315151
VAV + convector46314847
Publisher’s Note: MDPI stays neutral with regard to jurisdictional claims in published maps and institutional affiliations.

