Article

Implementation of the Improved Active Frequency Drift Anti-Islanding Method into the Three-Phase AC/DC Converter with the LCL Grid Filter

by
Krzysztof Dmitruk
* and
Andrzej Sikorski
Faculty of Electrical Engineering, Bialystok University of Technology, Wiejska 45D, 15-351 Bialystok, Poland
*
Author to whom correspondence should be addressed.
Energies 2022, 15(4), 1323; https://doi.org/10.3390/en15041323
Submission received: 15 December 2021 / Revised: 25 January 2022 / Accepted: 7 February 2022 / Published: 11 February 2022
(This article belongs to the Special Issue Power Electronics in Renewable, Storage, and Charging Systems)

Abstract

:
The article presents a modified standard Active Frequency Drift (AFD) method used to detect unintentional island operation in converters generating electricity from renewable energy sources to the power grid. The primary aim of each of the island operation detection methods is the possibility of shortening the energising of a separate part of the power grid. The proposed method eliminates fragments of the reference current signal when it reaches a constant value for a particular time. This part of the signal is replaced with the hyperbolic sine function. It allows reducing the value of Total Harmonic Distortions (THD) while maintaining the same effectiveness of island operation detection. The article contains a detailed description of the newly proposed type of disturbance generation. The proposed solution is verified by conducting simulation and laboratory tests. The possibility of shortening the island operation detection time is proven by increasing the maximum distortion introduced into the current without exceeding the permissible THD limit for converters connected to the power grid.

1. Introduction

Global ecological trends cause the industry’s dynamic development in obtaining electricity from Renewable Energy Sources (RES) [1,2]. In various parts of the world, changes in the immediate environment are noticeable, and there are more wind turbines or photovoltaic panels. The growing interest in the subject is caused by the political and economic situation [3]. In highly developed countries, electricity consumers are encouraged to become electricity producers by co-financing the construction of home mini-power plants. Due to their profitability, there are also large-scale investments (larger power plants). Such a rapid and dynamic development of the electricity production market from renewable sources forces the manufacturers of voltage converters to apply additional safeguards. They are obliged to implement islanding detection algorithms [4,5,6]. The voltage converter operates in the unintentional islanding operation when electric power from a renewable energy source is fed into the separated part of the power grid. This separate grid part contains a voltage converter and electric energy consumers (Figure 1b).
The problem occurs when the amount of electricity produced by the RES matches the demand by electric energy consumers connected to it (e.g., households) [7,8,9,10]. Among the possible reasons for the islanding of part of the power grid, the following reasons can be indicated [11]:
  • Opening of the power switch as a result of faults in the power grid.
  • Accidental opening of the power switch during regular power grid operation.
  • A deliberate shutdown of the power grid to service the power infrastructure.
  • As a result of human error.
  • As a result of the action of the forces of nature.
Regardless of the reason for the islanding of a part of the power grid containing the electric source and loads, the following undesirable effects may occur:
  • The presence of a severe threat to health and/or the life of power line workers.
  • Damage to load inside the island area.
  • Damage to power grid equipment and infrastructure as a result of insufficient short-circuit power of the energy source.
  • Damage to the converter coupling the RES with the power grid.
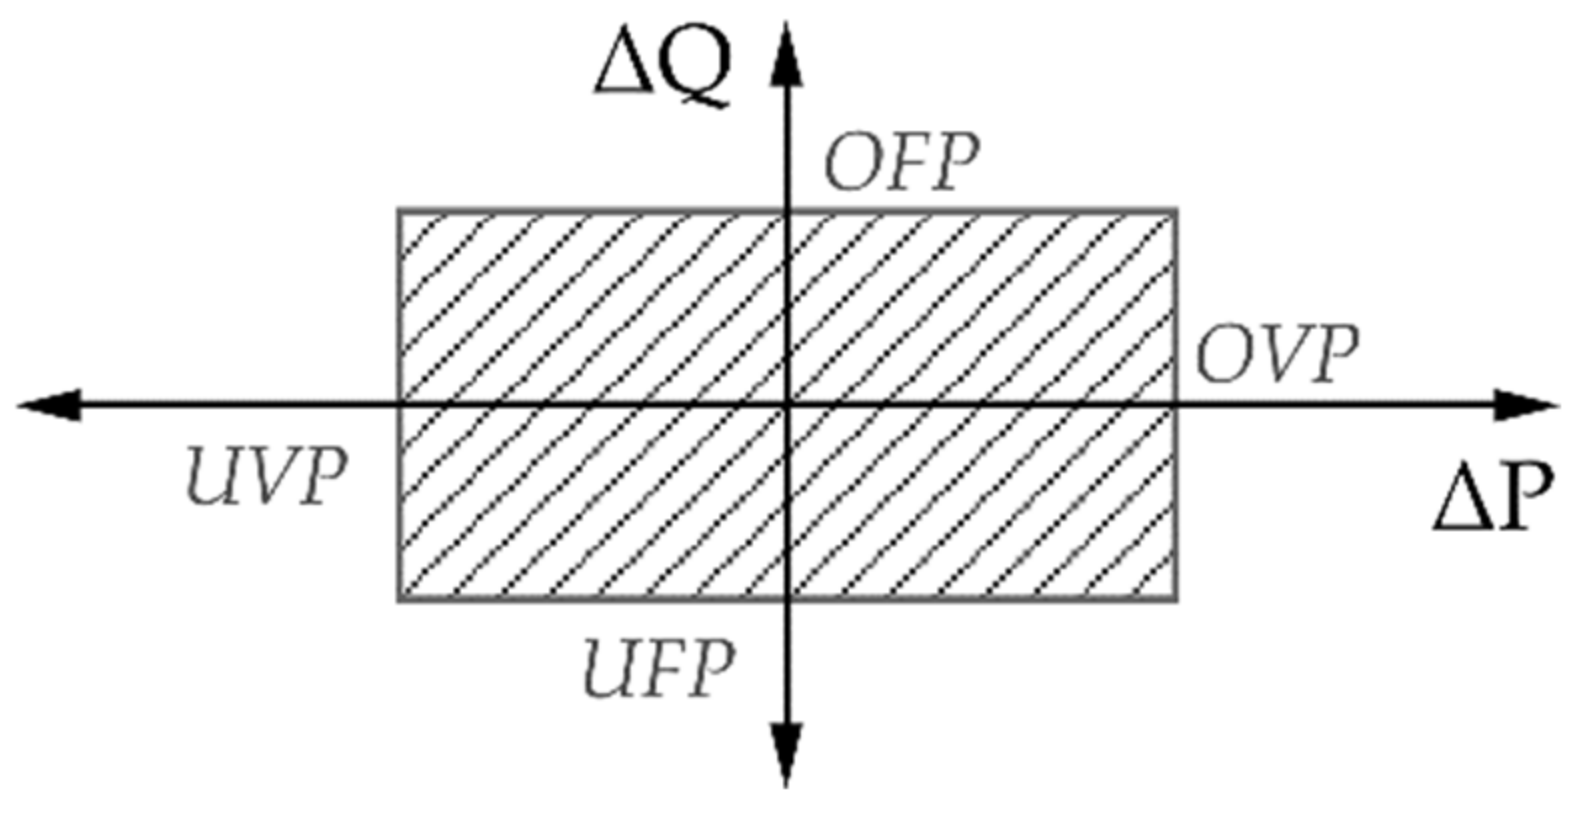
Anti-islanding detection is used to prevent this type of situation. In the literature, these methods are classified into passive, active and based on power line communication [12,13,14]. The first group, called passive methods, is based on the power grid’s nominal limits of voltage and frequency parameters. The main principle is to use elements detecting too high or too low voltage and/or frequency in the power grid, or to calculate the rate of the change of the grid parameters [15,16,17]. Nevertheless, the electrical parameters in an islanded part of the power grid depend on the power balance between the electrical source and the loads. Maintaining the power grid parameters within the tolerance limits is possible with a low probability. In this case, no islanding detection will occur, and the grid will be energised. When such disconnection occurs, it is perilous to carry out service works on power lines, and power line workers, unaware of the risk, try to reach the conductive parts of the power infrastructure. To eliminate the Non-Detection Zone (NDZ) [18], the authors of many publications have proposed various solutions to introduce some disturbance to the current generated to the power grid [19,20]. The introduction of disturbing signals to the set signals of the converter grid currents forces an inevitable change of the selected parameter. Such activities aimed at detecting island phenomena are classified as active methods.
The parameters ultimately to be changed are the frequency and/or RMS (Root Mean Square) voltage in a separate part of the supply network. The distortion of the current generated to the grid causes the injection of additional components with higher frequencies, apart from the fundamental harmonic of the current, into the grid. As active power is related to the first harmonic, additional components in the current spectrum increase the proportion of reactive power. The NDZ depends on the active and reactive energy balance produced and absorbed by devices (local loads) in islanded part of the supply network. The following equation describes the correlation between the local load parameters and the voltage and frequency in the islanded part of the network [21].
Pload = 3(U2GridRMS/R)
Qload = 3(U2GridRMS/(2πfL) − U2GridRMSfC)
When an islanded part of the supply network appears, its substitute parameters R, L and C are considered as constant—see parallel RLC block in Figure 3. Suppose the active and reactive power generated in the converter differs from the load demand for power at rated voltage parameters (PinvPload and QinvQload). Then, according to Equation (1), the voltage RMS and frequency f values of UGridRMS must change (Figure 2).
Because we can influence the generated active and reactive power from the converter side, we can shift the operating point lying inside the NDZ zone toward its external borders. When this point is on the border of the NDZ zone area, the appropriate protection against voltage and/or frequency limits will be activated by over/under voltage protection (OVP/UVP) or over/under frequency protection (OFP/UFP). In this way, unintentional islanding operations will be detected.
One of the solutions developed to detect unintentional islanding uses the introduction of additional harmonics to the generated current. Then, based on the presence of these harmonics in the voltage, the impedances for particular frequencies are calculated. The disadvantage of this method is the sensitivity to the parameters of the load in the occurred island. Additional problems may be caused by non-linear control methods of the converter, which are characterised by a variable switching frequency, which may affect the results of the calculated impedances [22,23]. The second example of an active island detection method is a positive feedback method that changes the phase angle of the generated current as a function of frequency. These methods change the frequency in the island part of the power grid to the maximum or minimum frequency value limit. Popular among the literature is the Active Frequency Drift (AFD) method, which uses a unique form of the generated current waveform where, for a fraction of the time of the supply voltage period, the current is 0 [24,25]. However, when there is no island operation, this method reduces the amount of energy fed to the grid and significantly lowers the quality of the generated current (more significant harmonic distortion). The solution to this problem is the use of methods that cause periodic generation of disturbances, which does not eliminate the problem of reducing the amount of energy supplied to the grid during the normal operating state of the power grid [26].
Therefore, an improvement of the detection of the islanding mode in the AFD method can be made. The amount of active energy transferred in detection standby mode can be increased. In addition, it is possible to keep the detection time short and improve the spectrum of the generated current. The authors developed an improved AFD method, which introduces a new type of disturbance to the sinusoidal waveform of the converter current signal. The distorted current signal waveform in the standard AFD method can be divided in the time domain into two parts. The first part contains a sinusoidal waveform with a slightly higher frequency than the network’s nominal frequency. As a result, during one period of the mains voltage, the set signal of the mains current of the converter reaches the end of its period slightly earlier than the mains voltage (Figure 4b). The second part of the current waveform is when it goes to zero at the end of its period and is held at zero until the line voltage becomes zero. The proposed method novelty replaces the period when the set current maintains the value zero with the course of the hyperbolic sine function. The article contains a detailed description of the implementation of the proposed solution. The authors present the results of laboratory and simulation tests. The newly proposed type (shape) of the introduced disturbance improves the THD40 coefficient while maintaining the same time of the introduced disturbance. The THD40 is defined as the root mean square value of the first 40 harmonics of the signal, divided by the RMS value of its fundamental signal [27].
THD40 = sqrt(I22 + I32 + I42 + + I402)/I1 · 100%
A detailed description of the AFD methods, standard and proposed, can be found in the following chapters.

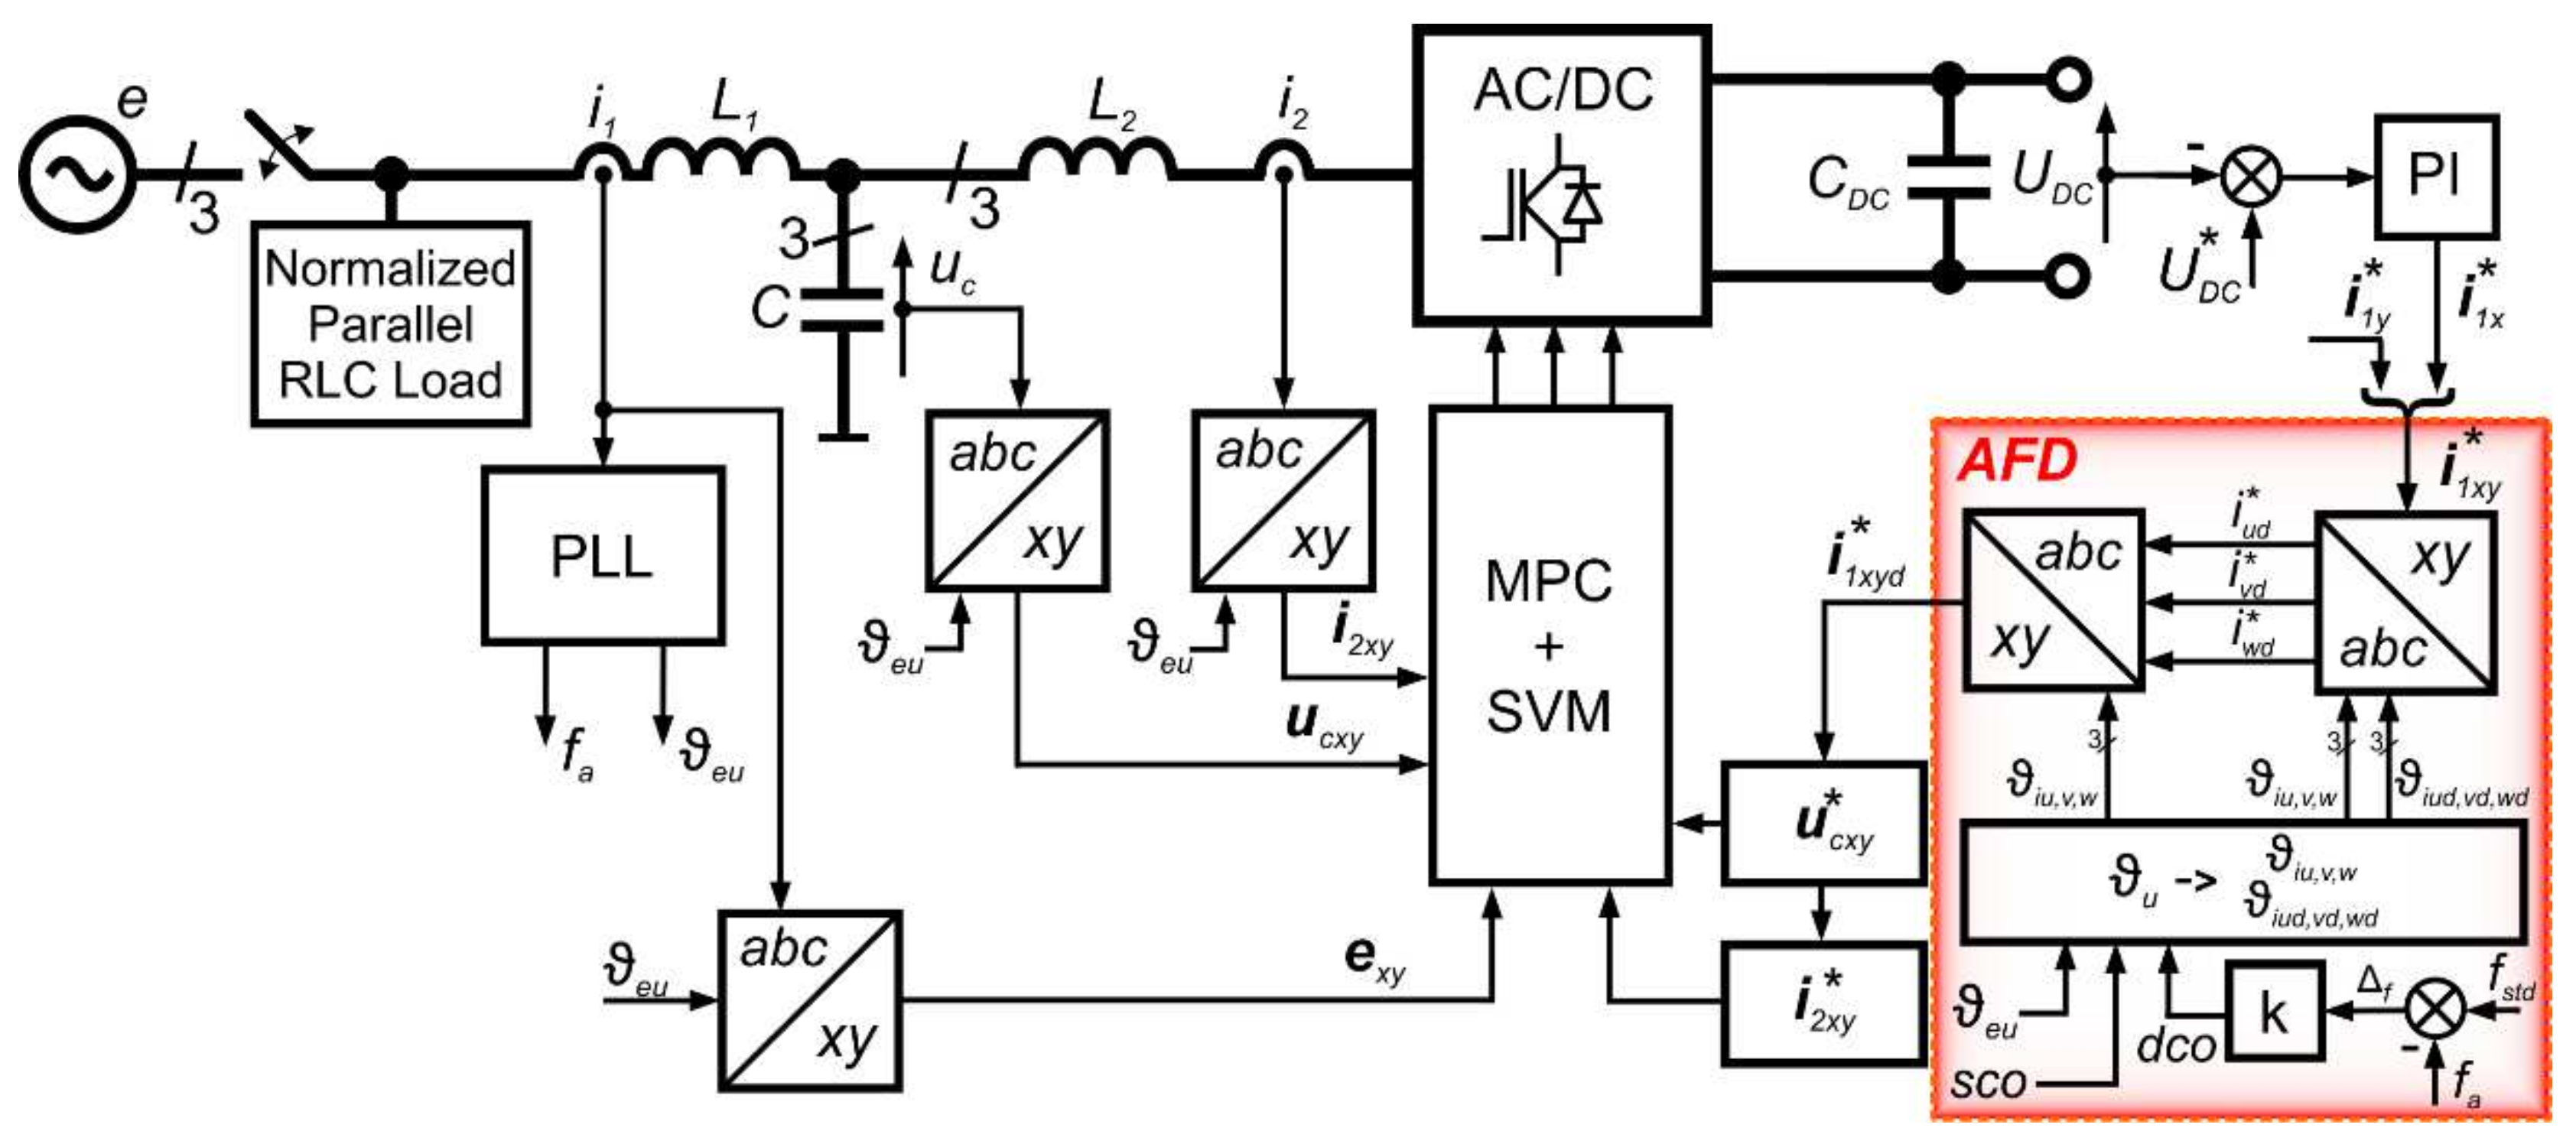
2. Description of Three-Phase Standard AFD Method

The original rules of distorting the generated power grid current using the AFD method were related to single-phase systems [28]. However, to switch to the three-phase supply system, it was necessary to slightly modify the control system in which the current distortion is calculated [25]. One of the most important physical quantities in the control system presented in Figure 3 is the phase angle ϑeu signal of the voltage vector of the supply network.
This signal is calculated in the Phase-Locked Loop block (PLL). It is used to convert the three-phase signals into a vector placed on a plane of the rotating reference frame aligned with power grid voltage vector (and vice versa). Moreover, it is used in the block that distorts the set current vector i1xy* of the AC/DC converter. In a separate part of the diagram marked AFD, based on information about the phase voltage vector angle ϑeu, phase angles ϑiu,v,w of the grid current waveforms i1 are generated.
ϑiu(t) = ϑeu(t)
ϑiv(t) = ϑeu(t) − 2π/3
ϑiw(t) = ϑeu(t) + 2π/3
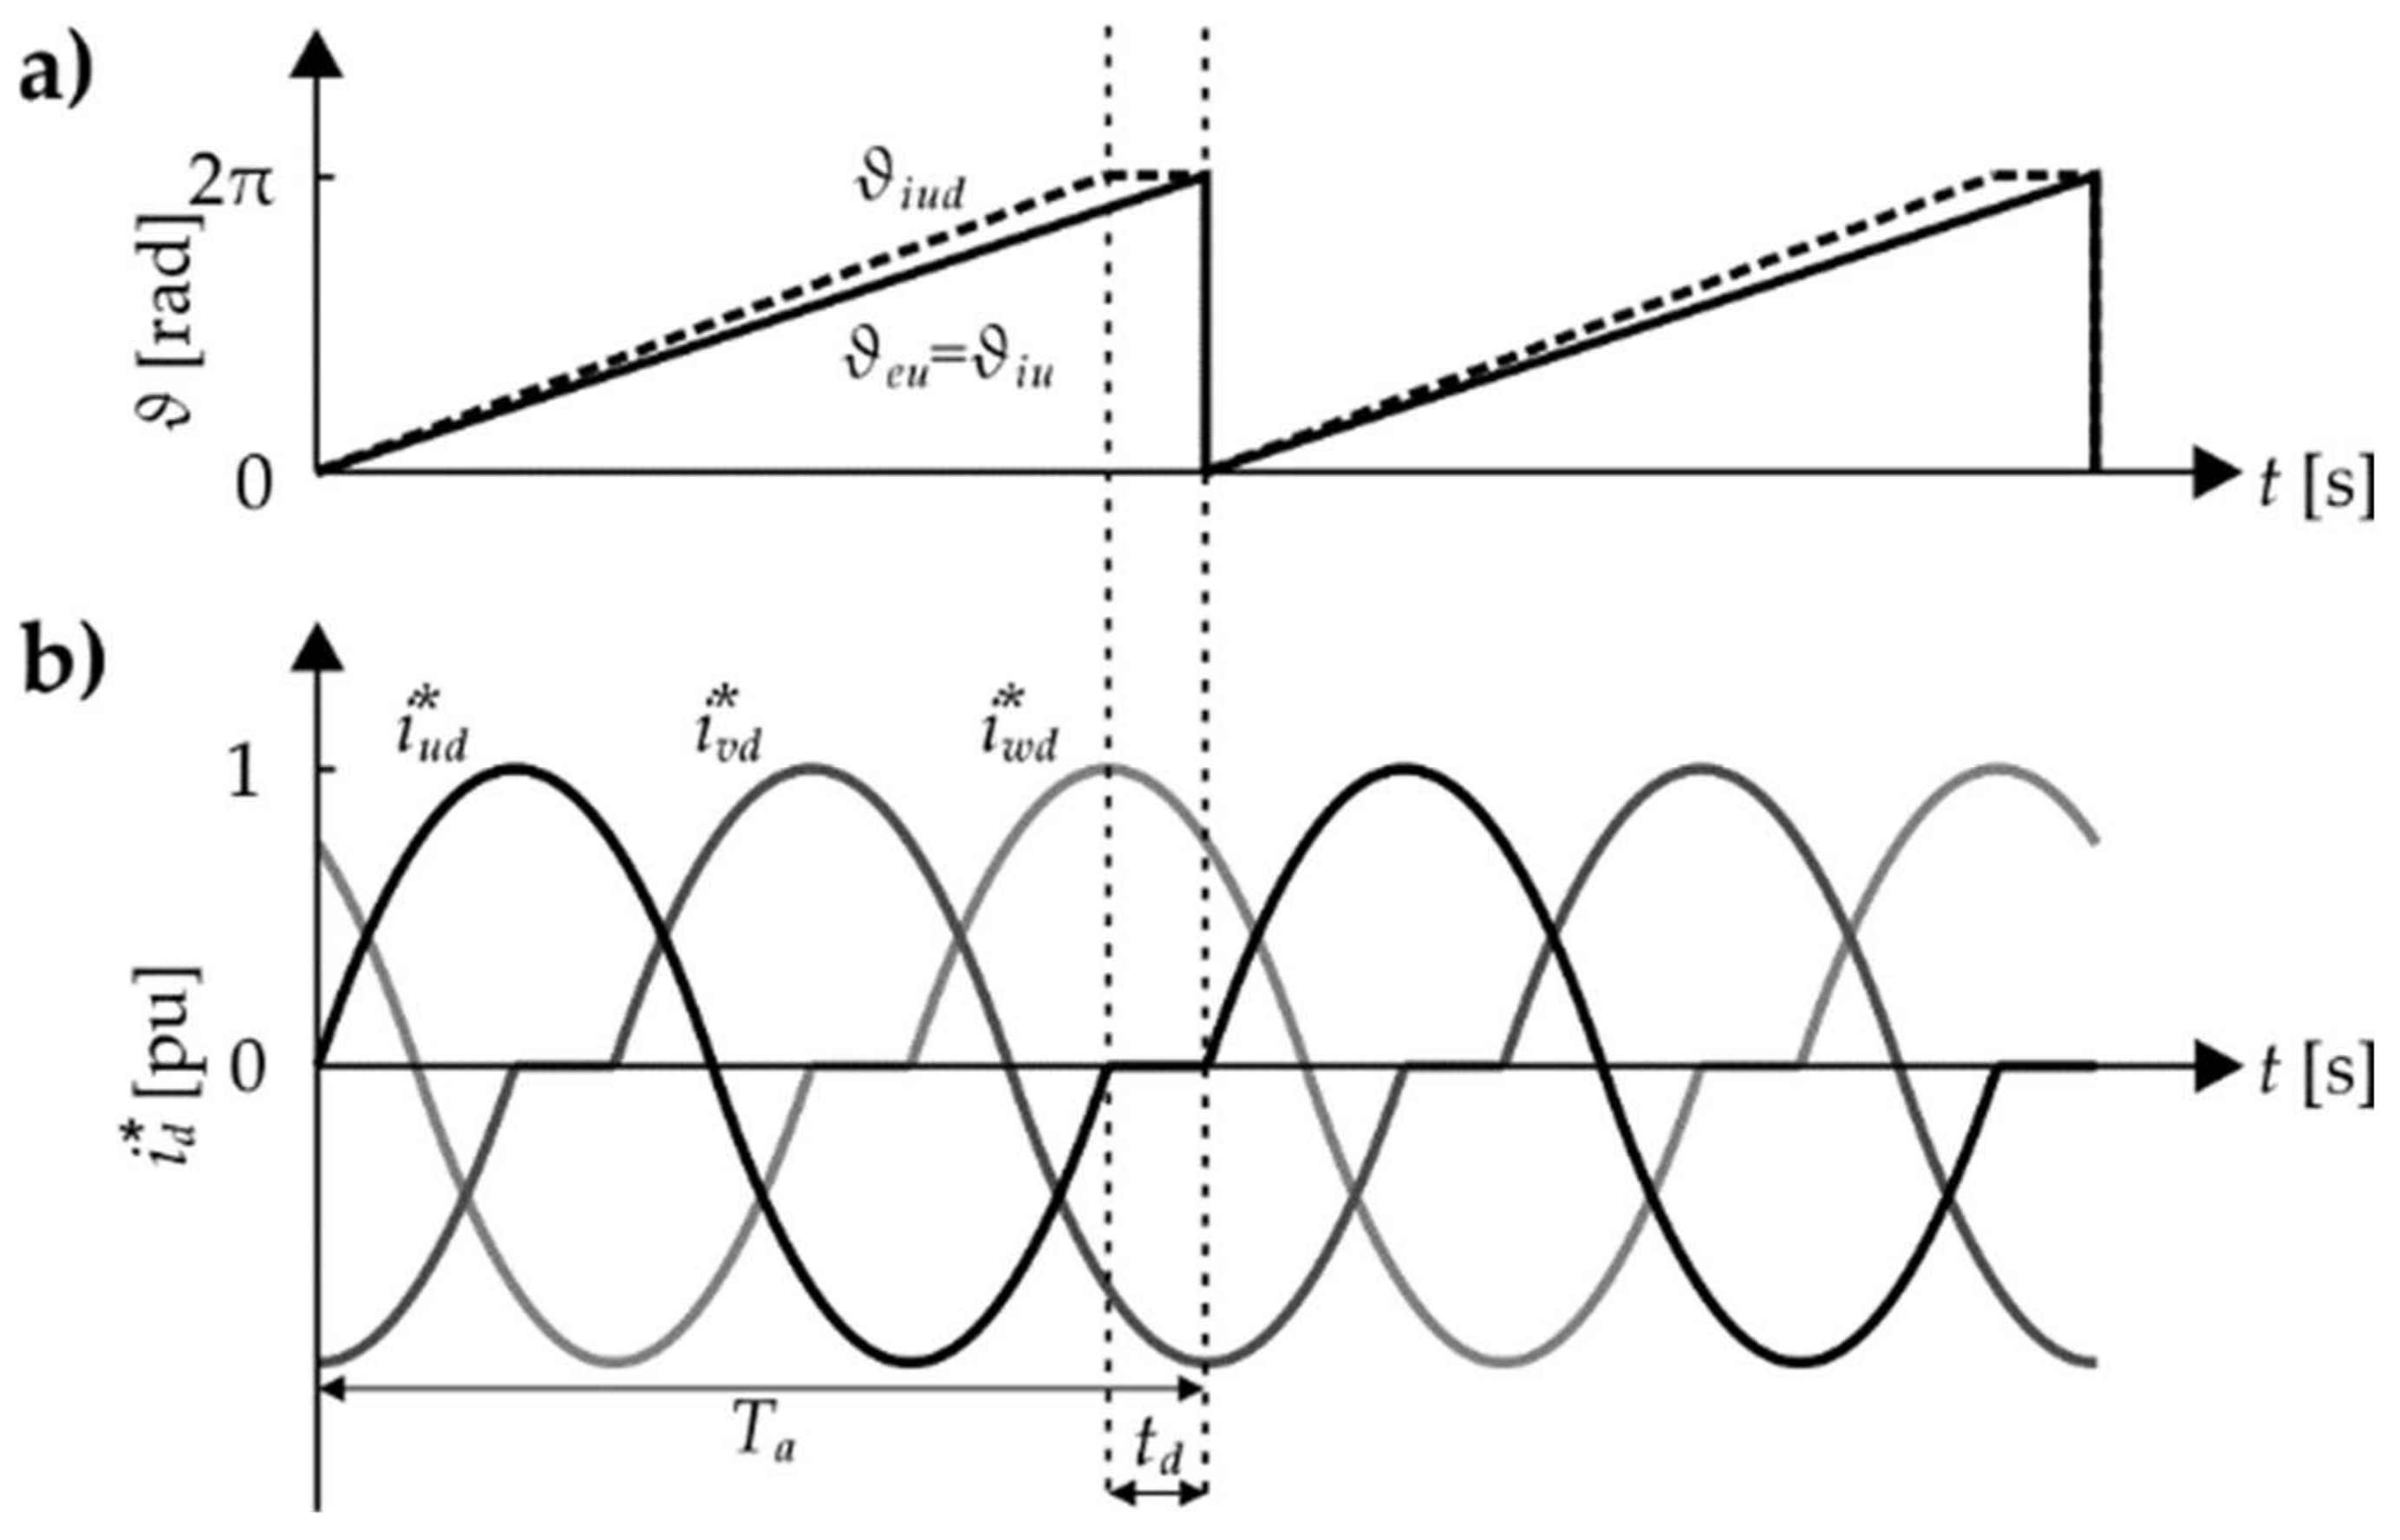
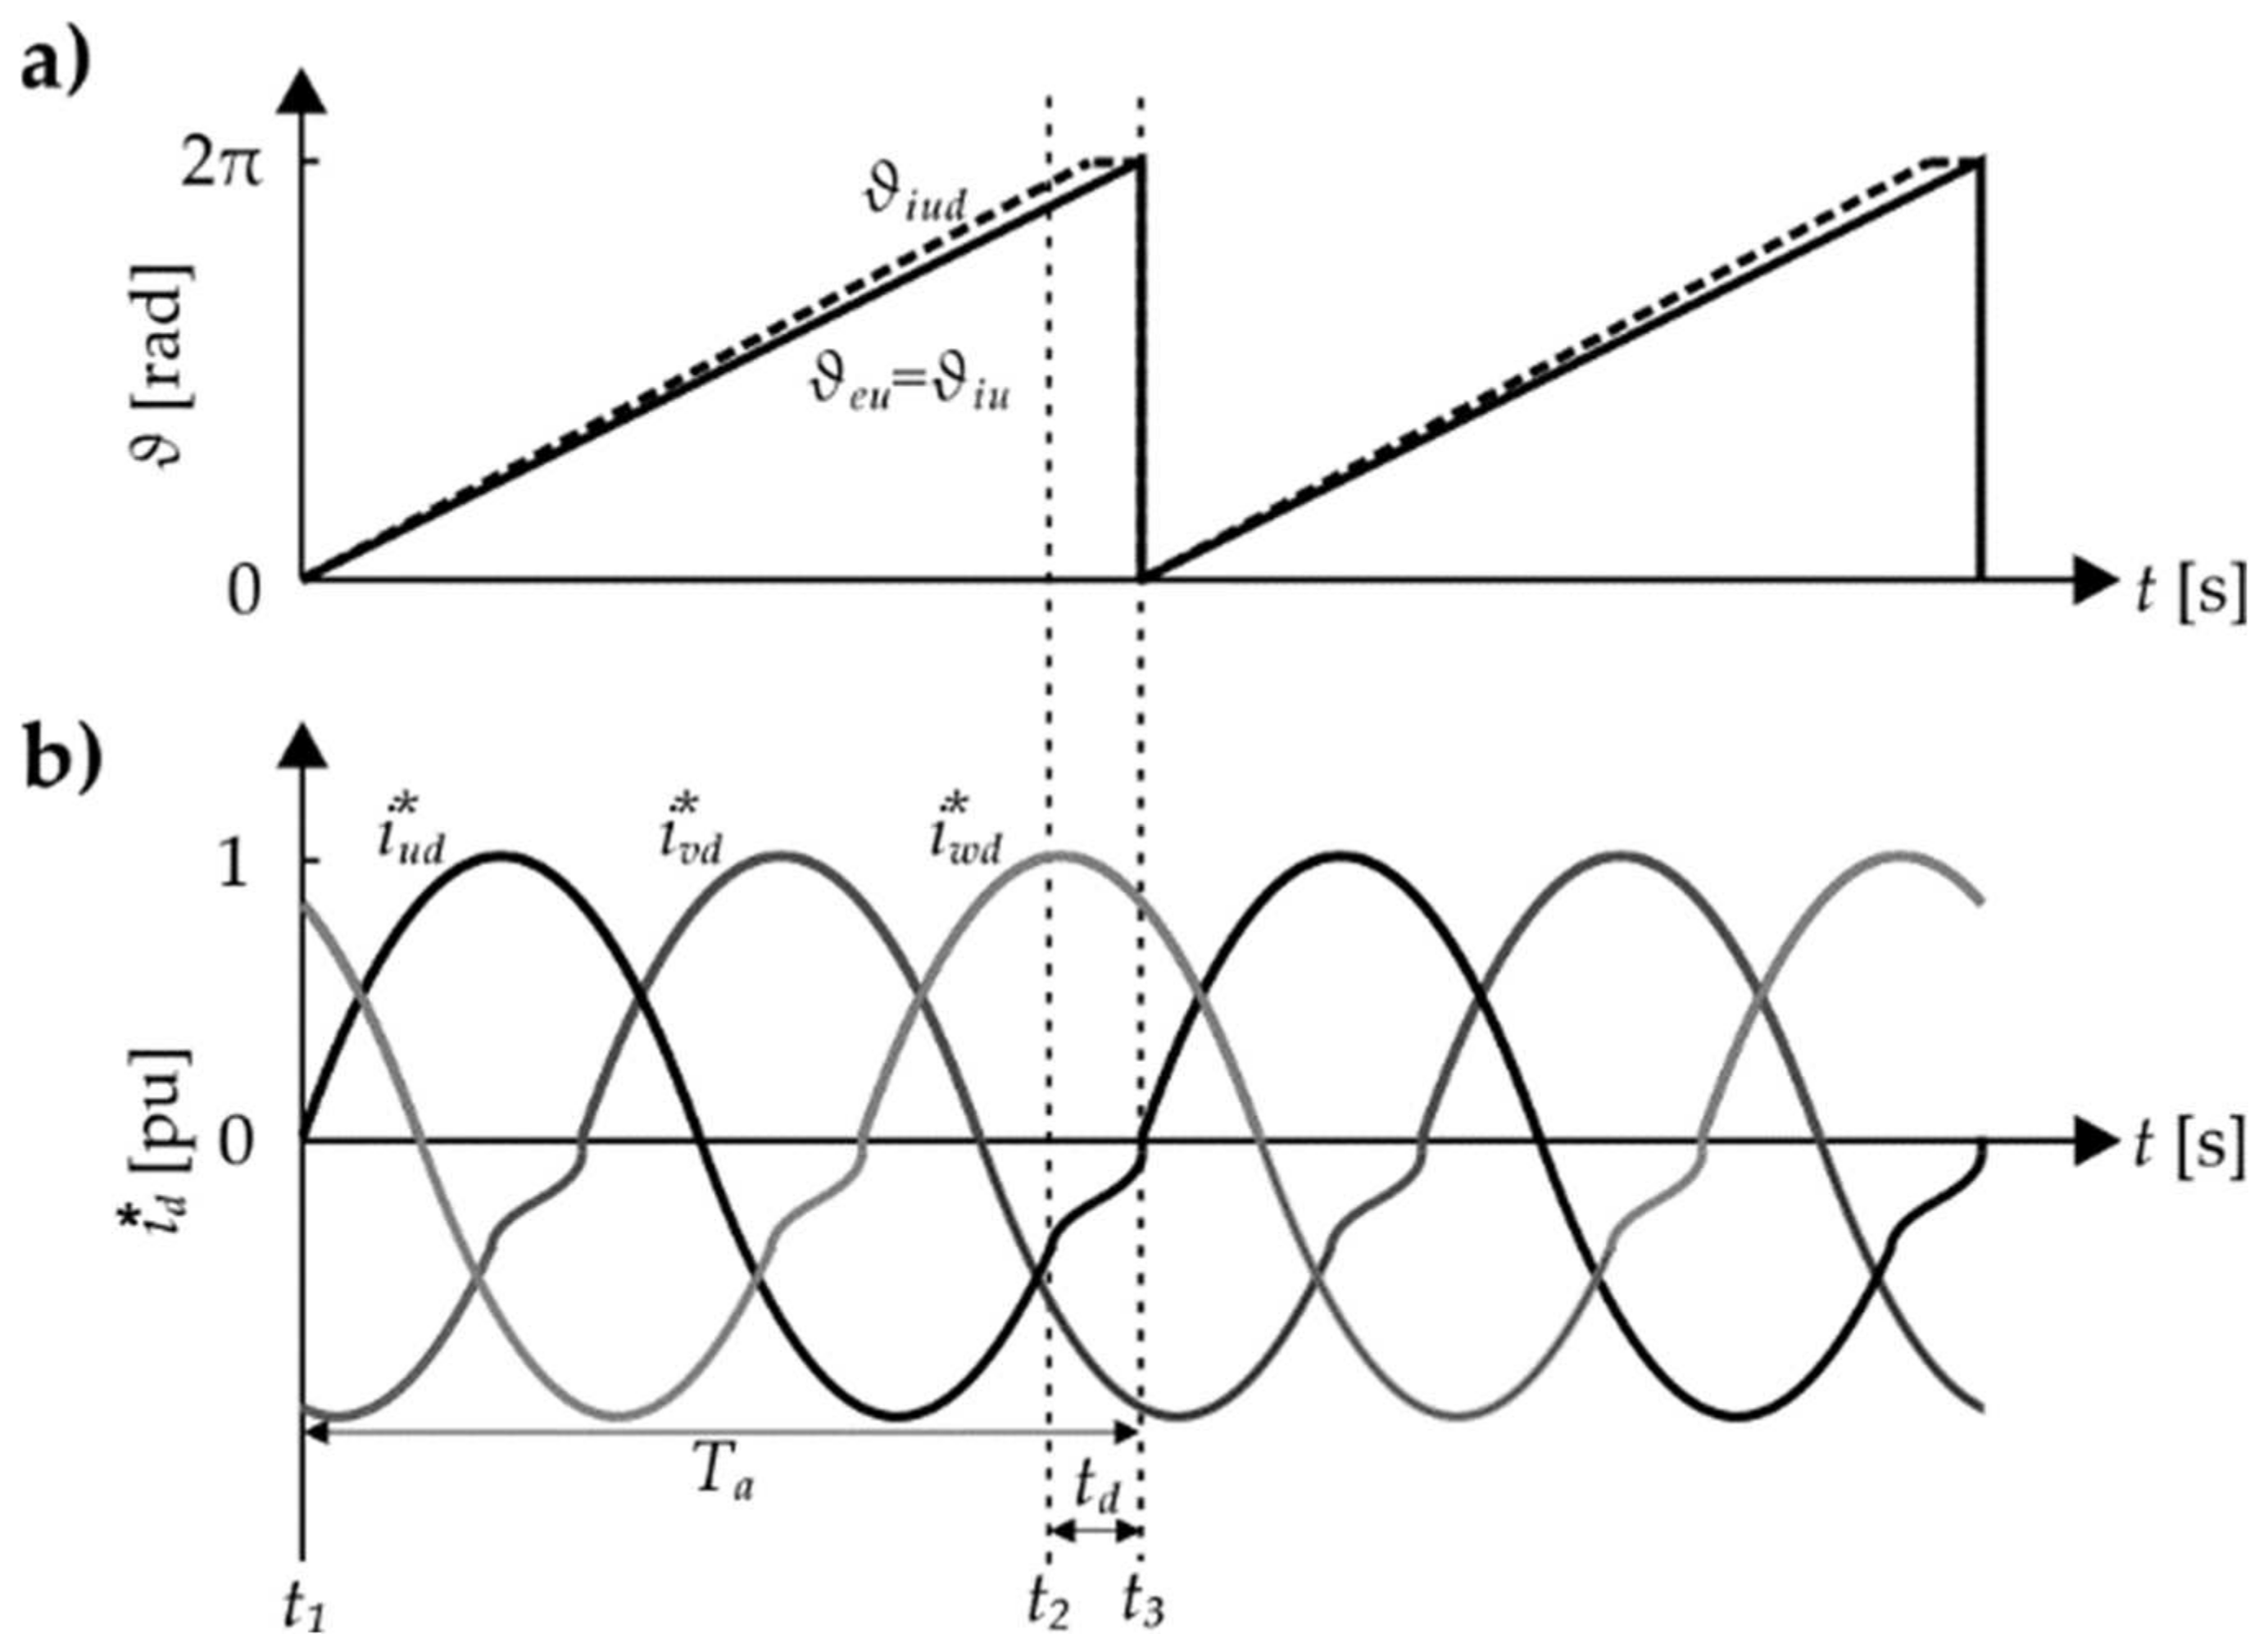
It is assumed that the range of changes of the angles ϑiu,v,w is normalised within the limits of 0.2π. The calculation of phase angles used to generate the distorted waveforms for the anti-islanding function requires additional input parameters: the static coefficient (sco) and dynamic coefficient (dco). The sco parameter is equivalent to the chopping fraction (cf) in the original description of the AFD method. It is a coefficient related to the time the grid current waveform remains at the value 0 (see Figure 4b) in a static state, i.e., no island operation occurs. The static coefficient is assumed to be constant. On the other hand, the value of the dynamic coefficient depends on the product of the gain k, and the difference between the rated value of the grid frequency frtd and the actual value of the grid voltage frequency fa.
dco = k∙(frtdfa)
Thus, the frequency facc of the accelerated sinusoidal part of the waveform in Figure 4b is equal:
facc = fa + sco + dco.
The auxiliary angles ϑiud,vd,wd used to generate the set signals of the distorted grid currents i1ud,vd,wd in the discrete form were calculated using Equation (6) for each of the phases, respectively.
ϑiud(t) = 0      for ϑiu(t) = 0
ϑiud(t) = ϑiud(tTs) + 2πfaccTs   for ϑiu(t) <= 2π
Then, the signals of the distorted set currents in the natural three-phase system iud*, ivd*, iwd* were calculated considering the set values of the i1xy* vector.
iud*(t) = i1x*∙ sin(ϑiud(t)) + i1y*∙cos(ϑiud(t))
ivd*(t) = i1x*∙sin(ϑivd(t)) + i1y*∙cos(ϑivd(t))
iwd*(t) = i1x*∙sin(ϑiud(t)) + i1y*∙cos(ϑiud(t))
The distorted waveforms of the setpoint currents iud*, ivd*, iwd* were converted into a rotating reference frame xy aligned with the network voltage vector.
i1xd* = 2/3(iud*∙sin(ϑiu) + ivd*∙sin(ϑiv) + iwd*∙sin(ϑiw))
i1yd* = 2/3(iud*∙cos(ϑiu) + ivd*∙cos(ϑiv) + iwd*∙cos(ϑiw))
The vector i1xyd* determined according to the above equations is the set value at the input of the predictive grid current control system.

3. Description of the Proposed Method

The proposed Active Frequency Drift Hyperbolic Sine method (AFDhs) is based on the same block diagram of the converter control system as the standard AFD method (Figure 3). The main difference is in the block of generating the grid current distortion. The sinusoidal part is proposed to be computed from the angle signal calculated according to Equations (6)–(8) using facc calculated in Equation (9).
facc = fa + (sco + dco)/2
The comparison of Equations (5) and (9) shows that the AFDhs method increases the frequency of the sinusoidal part of the waveform by twice the value of the sum of the static and dynamic coefficients. When we apply the same disturbance time td to compare the methods, we can see that the set current signal reaches zero at the beginning of the period td in Figure 4b, illustrating the standard AFD method. On the other hand, in the proposed method (Figure 5b), at the beginning of the period td, the value of the converter current signal is different from zero.
As mentioned earlier, at time t2 (Figure 5b), the sinusoidal waveform did not reach the value of 0. It should be emphasised that the phase angle ϑiu at this point did not reach the value of 2π (Figure 5a). The moment t2, when the sinusoidal part of the waveform should be finished, depends on the value of the angle ϑiu. It has been proposed that the moment of time t2 is when the angle ϑiu reaches the following value:
ϑiu = 2π − π fa/(fa + (sco + dco))
When the phase angle signal satisfies Equation (10), the last value of the set current signal iud (t2) is stored. The hyperbolic sine function requires an argument x. Its argument varies linearly from −x to x over time from t2 to t3. The sinh function for both arguments −x and x is not the same as the value of iud*(t2). Thus, it is required to scale the value of the sinh function at time t2 by the factor m to maintain the continuity of the generated waveform iud*.
m = −iud (t2)/sinh(x)
Necessary for further calculations is the value of the iud*(t2) signal and the number of iterations of the control algorithm n that will be performed in the time range from t2 to t3. The number n was related to the time between iterations of the algorithm (in a real digital system, it is the sampling time Ts) and was defined as follows:
n = (2π − ϑiud(t2))/(2π∙Ts)∙(1/fa)
Summarising the above, the waveform of the iud* signal is the result of the following function:
iud*(t) = i1x*∙sin(ϑiud(t)) + i1y*∙cos(ϑiud(t))       for t1<= t <= t2
iud*(t) = m∙(sinh(−x + xstep(t)))/2 + sinh(−x)/2     for t2 < t < t3
xstep(t) = 0       for t1 <= t <= t2
xstep(t) = xstep(tTs) + 2x/n     for t2 < t < t3
Quantity xstep(t) increments the domain of the sinh function. It increases, in accordance with the equations above, and causes a transition from −x to x in the domain of the sinh function at the time between t2 and t3 in n steps.

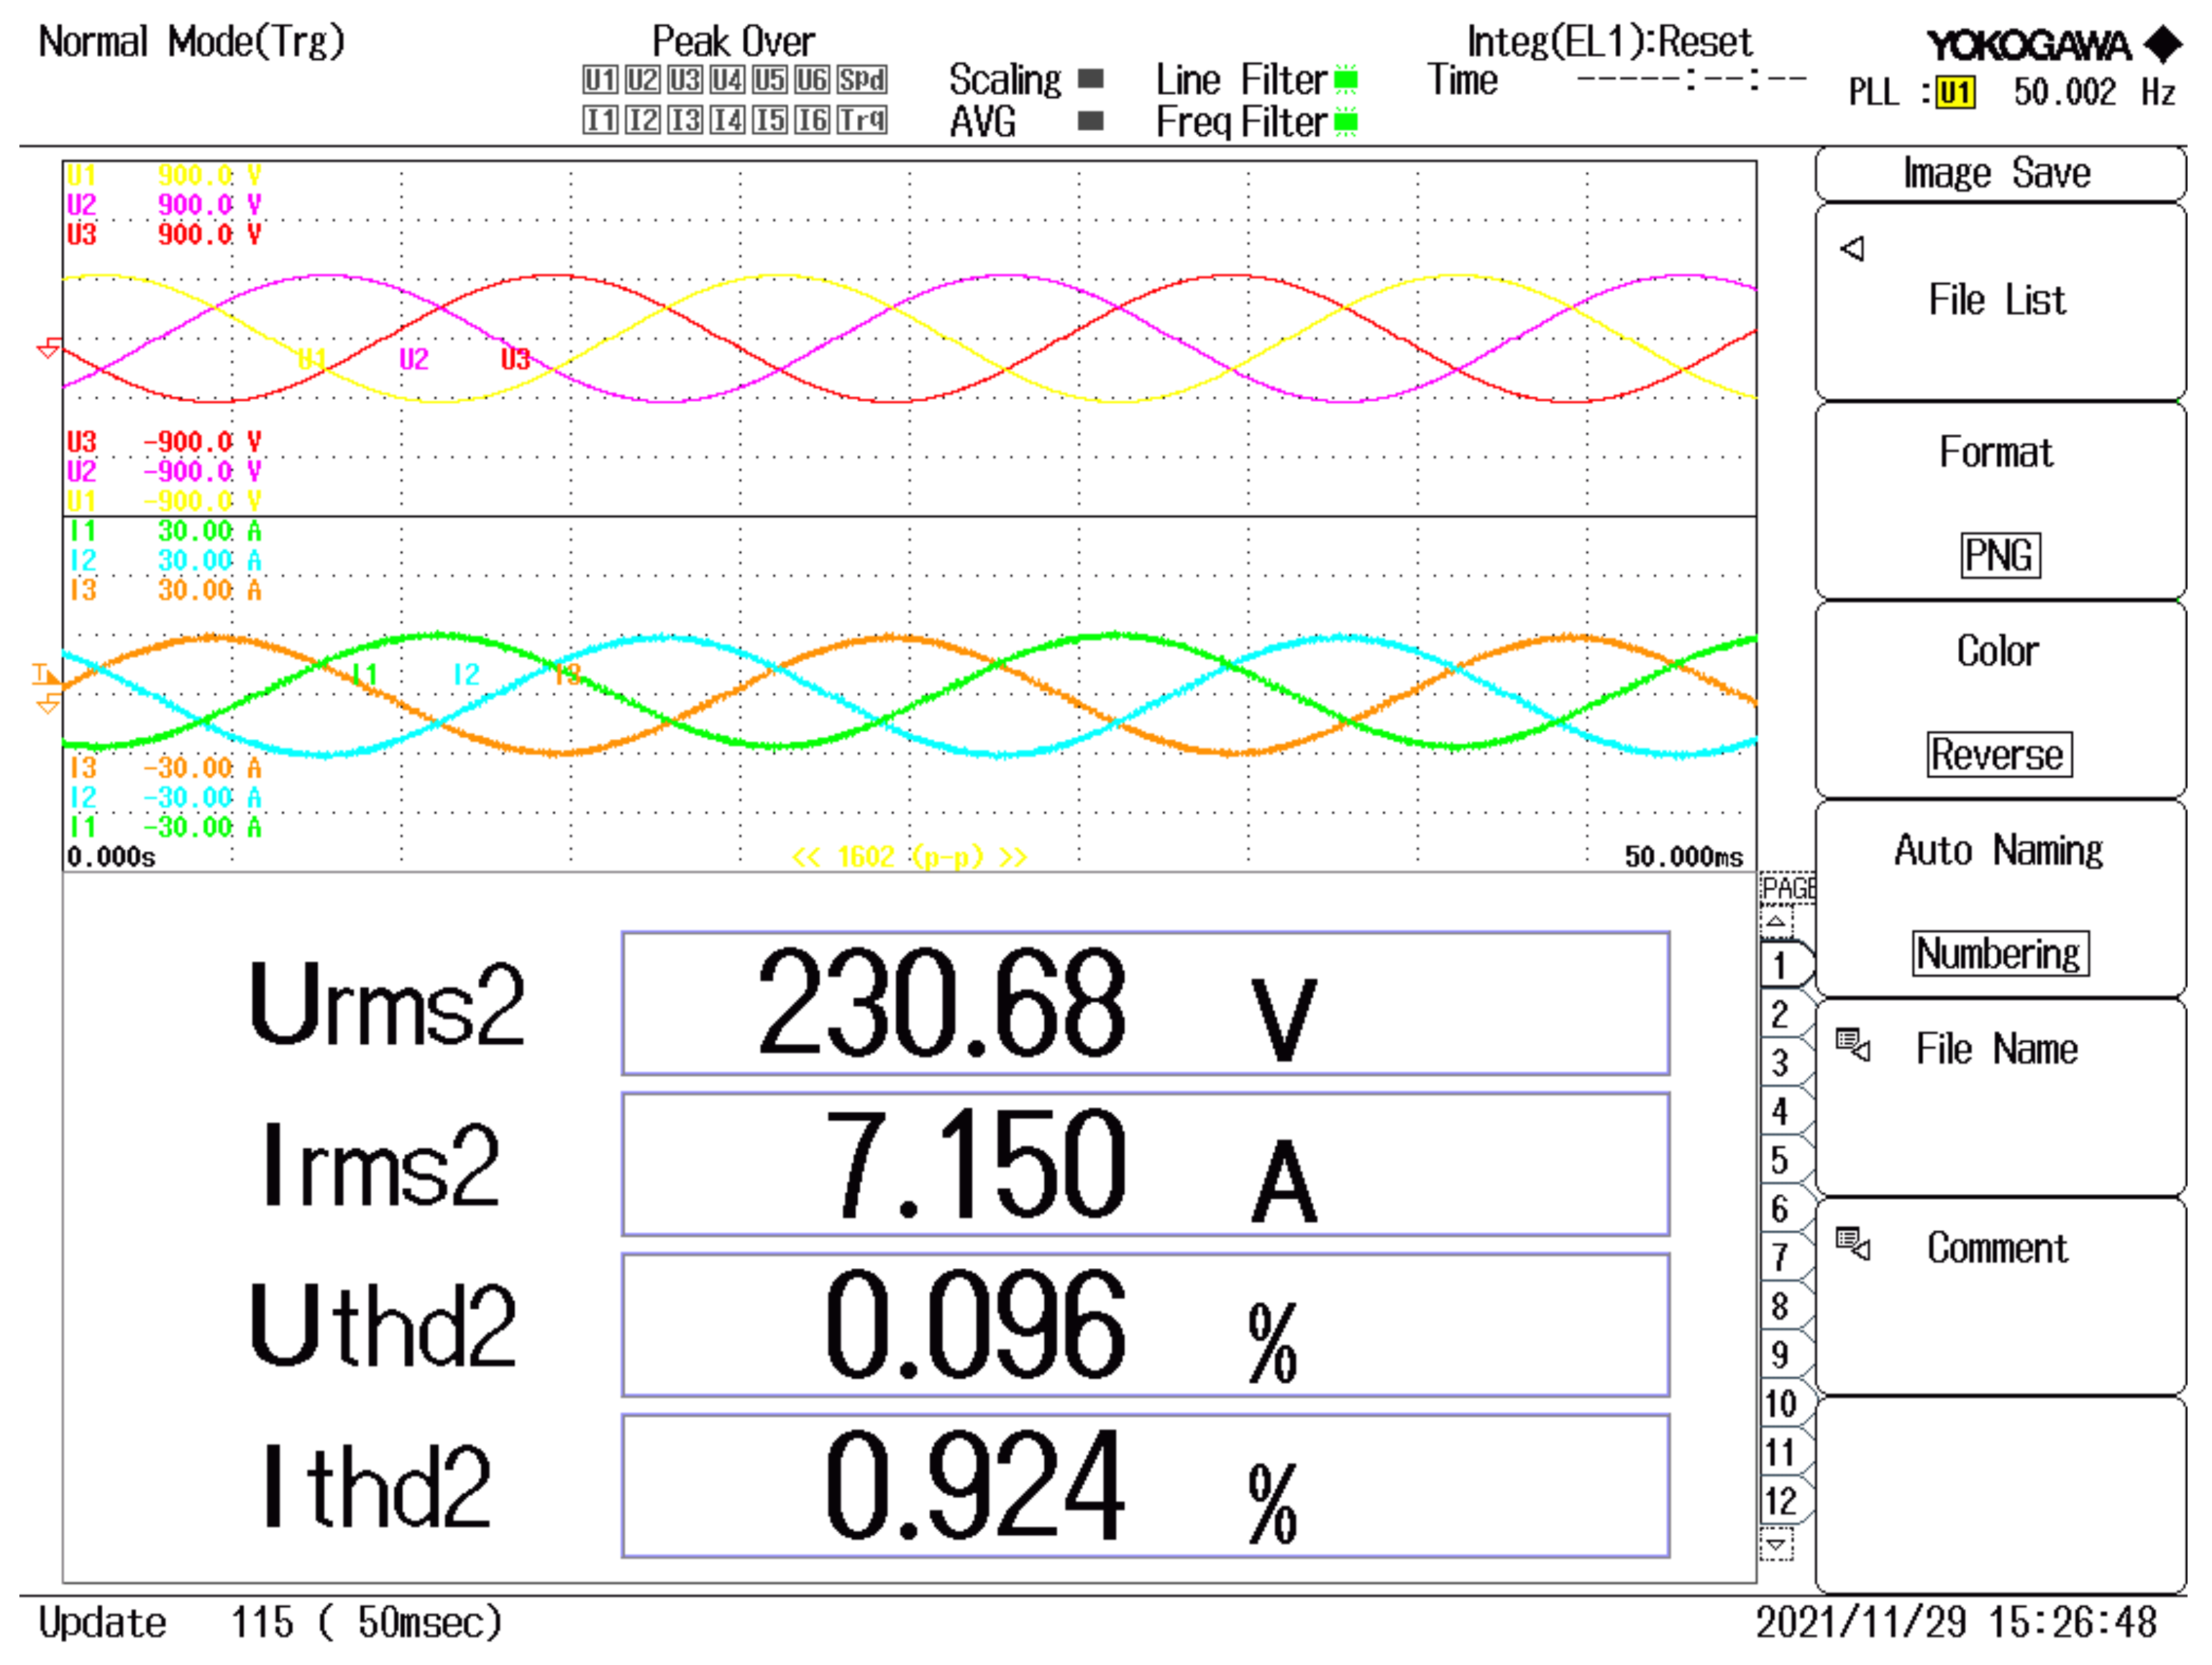
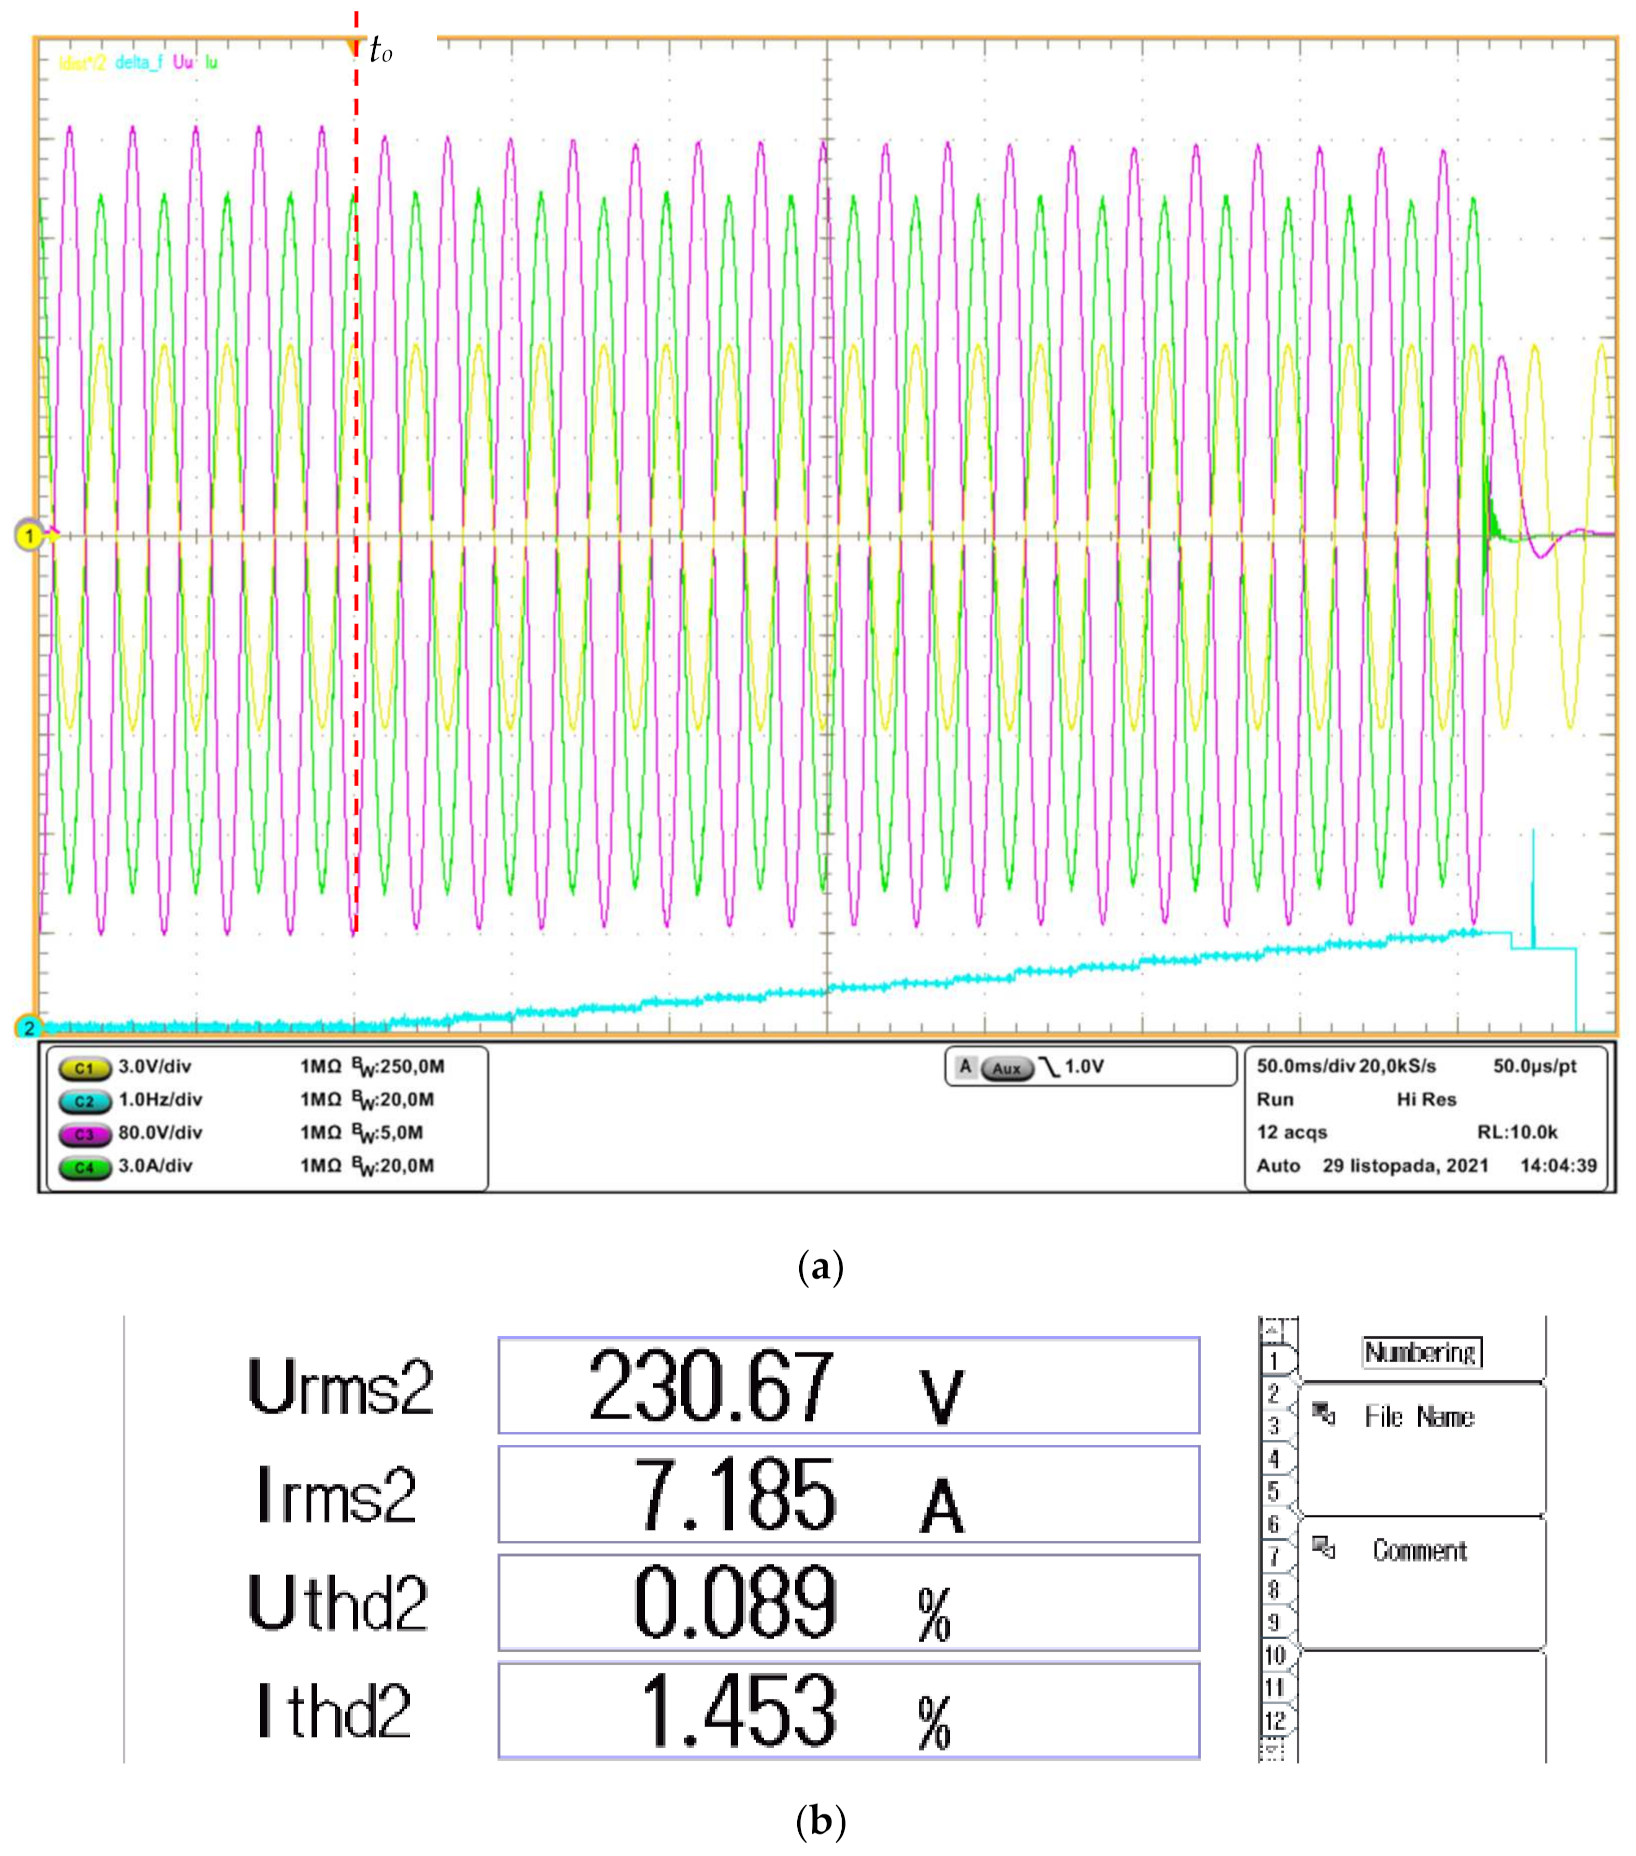
4. Simulation and Experimental Verification

The method of determining the sinusoidal part of the waveforms of both methods is based on different signals of phase angles ϑiud. The AFD method uses the angle calculated from Equations (5) and (6), while the AFDhs method also calculates phase angle from Equation (6), but uses facc calculated in Equation (9). They show that the difference between the voltage phase angle ϑeu and the distorted current angle ϑiud in the AFD method is twice as significant as in the AFDhs method. Primarily, the sinusoidal part defines the first harmonic of the current iud* and determines the phase shift angle with respect to the grid voltage eu. This part also directly affects the ability of the algorithm to detect an island state [13,15]. The comparison of the proposed method with the standard method should base on the same facc value. The result is that the distortion time td in the AFDhs method must be twice as long.
Contrary to the literature cited earlier, the islanding detection problem analysis uses a two-level AC/DC converter coupled with the grid through the LCL filter. The transistors are controlled by the SVM predictive method (Space Vector Modulation). The method used was described in detail by the authors of [29]. It is a non-linear method [30] belonging to the group of methods with a Continuous Control Set of output voltage vectors based on Model Predictive Control (CCS-MPC). The simulation tests reflected the discrete nature of the microcontroller-based converter. These tests were performed in the Matlab/Simulink environment. Similar to the laboratory tests, they were performed following the scheme in Figure 3. The most critical parameters of the analysed circuit are presented in Table 1.
The waveforms of set grid current iud* were generated using the simulation model for the standard AFD method (Figure 6a) and the proposed AFDhs method (Figure 7a).
Subsequently, laboratory tests were performed. The control algorithm was created in C++ and loaded into microprocessor Analog Devices ADSP-21369. The microprocessor is supposed to gather all signals from the voltage and current transducers, and compute the duty cycles for each phase. The generation of gate pulses for the transistors in a two-level AC/DC converter was executed in Spartan XC3S400 FPGA. The tested system (Figure 8) was powered by an arbitrary power source California MX30-3Pi. The presented time courses were recorded on Tektronix DPO7054C oscilloscope and Yokogawa WT1800 power analyser. A set of photos showing the components of the laboratory circuit is presented below.
Contrary to the simulation studies, the ability of the algorithms to detect the islanding operation was tested. The oscilloscope trigger point was tied to the opening time of the main contactor contacts. It was marked on the oscillograms with a vertical line with the symbol t0. The threshold of anti-islanding protection chosen for this study was 49 < f < 51 (Hz).

5. Discussion

The simulation results are presented in Figure 6 and Figure 7. Their comparison allows us to obtain the following conclusions:
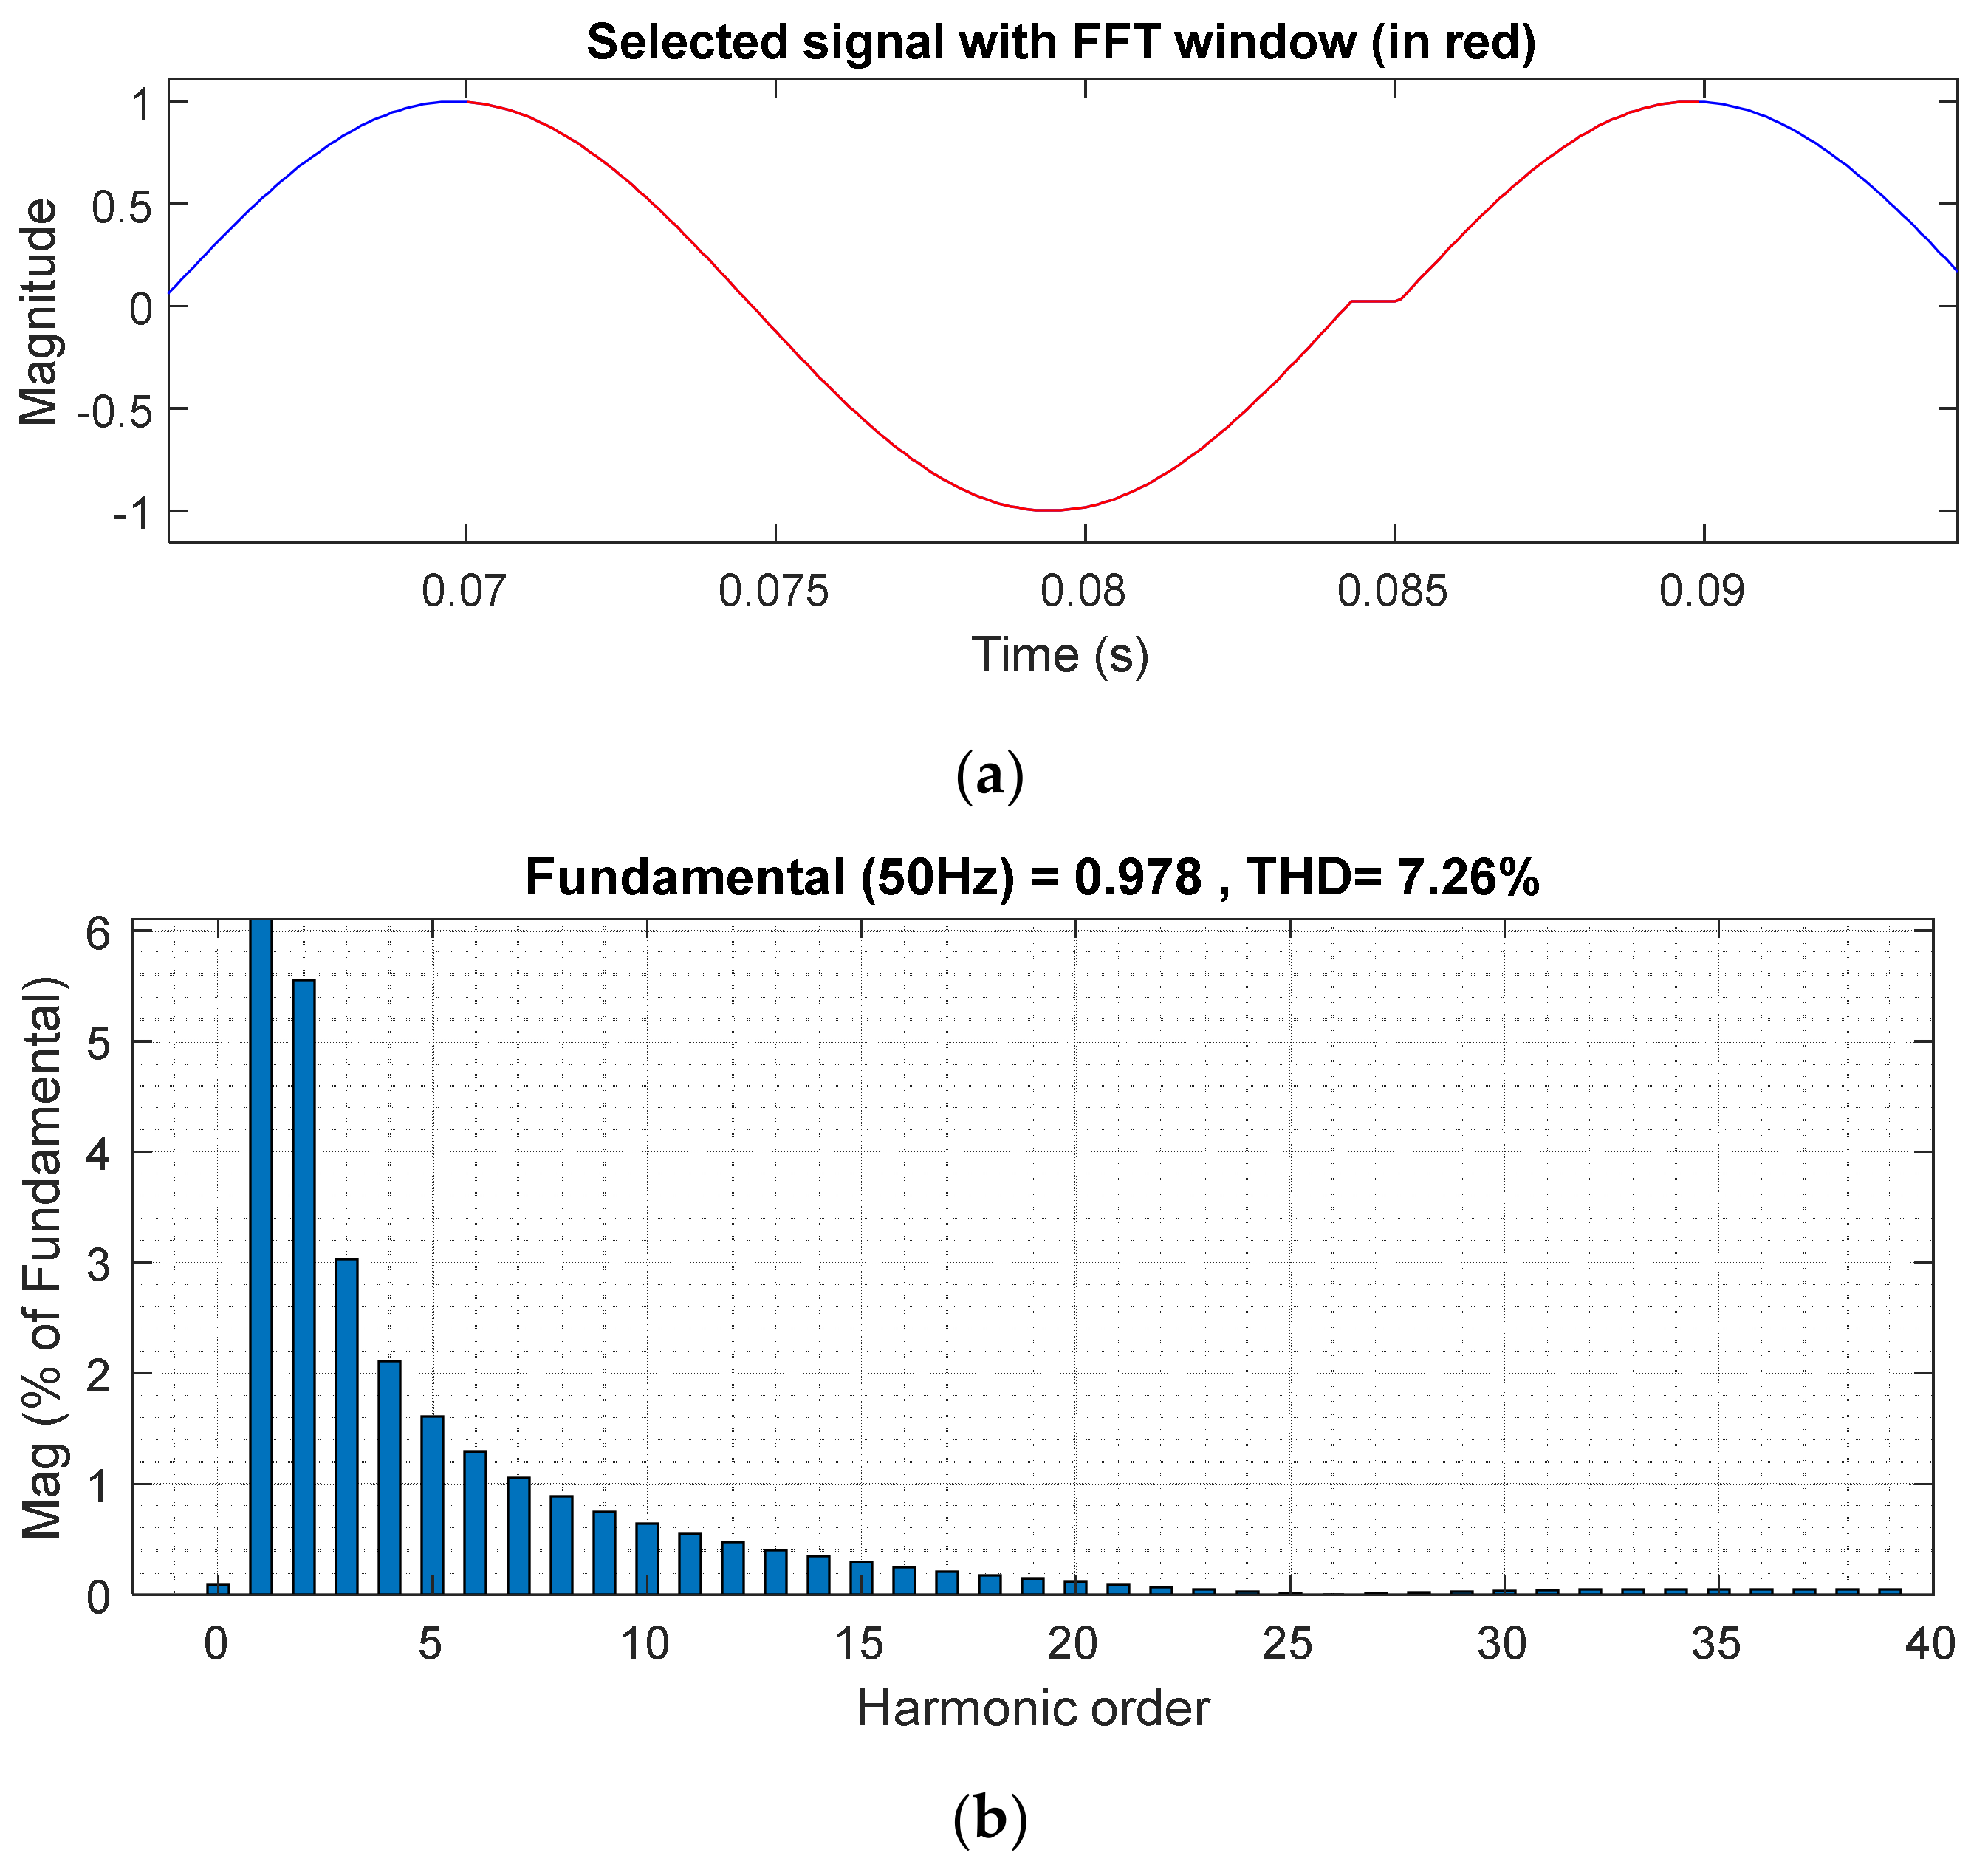
  • The AFD method was characterised by a 4.91%-higher THD40 coefficient of the generated current waveform compared to the harmonic distortion of generated current in the AFDhs method.
  • The spectrum of the current signal in the AFDhs method had a different distribution of individual components. In the AFD method, the amplitudes of successive harmonics (from 1 to 26) decreased. The first local minimum amplitude had the 26th harmonic. The harmonic amplitudes 26–40 grew higher. However, in the AFDhs method, the first local minimum was on the 18th harmonic. Higher-order harmonics (18–40) had lower amplitudes compared to the signal spectrum of the AFD method.
  • The AFDhs method generated a distorted current with a slightly higher RMS value.
The tests performed in the laboratory (results in Figure 9, Figure 10 and Figure 11) show that the current generated by the AFDhs method, in the grid-connected mode, had a lower value of the THD40 coefficient. Regarding the generated current harmonic distortion, without the activated islanding detection function (Figure 9), the methods were characterised by successive THD40 values higher by 57.25% and 47.4%, respectively, for the AFD and AFDhs methods.
Figure 6b and Figure 7b show the spectra of the set current signals. The proposed method was characterised by a more advantageous spectrum of the generated current, a reduced number of disturbances in the form of higher harmonics introduced to the supply network, the same efficiency in terms of island detection time and a slightly larger amount of active energy transferred in the grid-connected mode.
Figure 10 and Figure 11 show the oscillograms containing the waveforms of the grid voltage (magenta), grid current (green), reference grid current (yellow) and frequency delta fa-frtd (blue). The opening time of the grid contactor contacts, which disconnects the power supply from the voltage converter and the local load, is marked with the black dashed line. Before the contacts of the grid contactor are opened, the current fed into the network is slightly distorted. In the AFD method in standby mode, the THD40 coefficient was 1.362% for the AFDhs method, while the generated current without active anti-islanding protection had a THD40 of 0.924%. At the moment of disconnecting from the power grid, the frequency value increased due to the operation of algorithms protecting against unintentional islanding operation. Along with the increase of the distortion time related to the frequency delta, the value of the UGridRMS voltage in the separated circuit slightly decreased during the detection process, despite the constant value of the reference current (yellow wave). The lower value of the voltage in the islanded network results from the current control mode of the converter [29]. The voltage in the network is not a regulated quantity. The parameters of the local load do not change during island operation state detection. Increasing the proportion of the deformed part of the generated current waveform causes a reduction in the output of active power. Thus, according to Equation (1), a voltage drop in the network occurs. When the active power decreases, the share of reactive power increases, which, referring to Equation (1), causes the frequency to change.
In the assumptions for the research, it was decided to keep the same distortion time td for both compared methods. This assumption was to ensure the same proportion of active and reactive power transferred to the supply network during the operation of the converter with the connected power grid. After implementing a new type of disturbance, the converter mains current had a better spectrum than when using the distortion of the standard AFD method. The detection time for both methods was very similar. The standard AFD method and the proposed AFDhs detected the island operating state in approximately 360 ms.
It is worth noting that the generated current was smooth. The ripples of the current associated with switching transistors were invisible. High current quality is ensured by the applied predictive-SVM control method, which perfectly mimics the set current despite using an LCL filter. This method effectively suppresses the resonance harmonics related to the inductances and capacitance of the converter input filter. It perfectly reproduces the complicated shape of the set current resulting from applying the anti-islanding algorithm. Using the predictive-SVM method is an additional advantage of the presented article, as it is an innovative approach to test anti-islanding methods. Earlier publications on islanding operation have presented results in circuits with a voltage converter connected to the network through a more straightforward and much less effective L-type filter.

6. Conclusions

Based on the results of the tests it can be concluded that the goals set for the new method in the introduction were achieved. Laboratory tests confirmed that it is possible to maintain the unintentional islanding detection efficiency of the standard AFD method using the proposed AFDhs method. The modified method generates the sinusoidal part of the set current waveform i1* with a frequency closer to the mains voltage frequency than the standard method. Therefore, it increases the share of the first harmonic of the current, i.e., in the standby mode, more active power is fed into the network. However, two goals were achieved due to the more favourable current spectrum. First, it improved the overall quality of the voltage in the network. Second, it reduced the THD40 factor for the same disturbance time, which allowed us to achieve the maximum allowable THD40 value of the current generated to the network when injecting more disturbance (longer time td). Thus, the proposed method allows increasing the current distortion to shorten the island detection time while meeting the requirements of the maximum current THD for voltage converters connected to the power grid.
In the future, research will focus on developing new island detection methods, combining the minimization of introduced disturbances and observing the sensitivity of the phase synchronization loops to these disturbances.

Author Contributions

Conceptualization, K.D.; methodology, K.D.; software, K.D.; validation, K.D.; formal analysis, A.S.; investigation, K.D.; resources, K.D.; data curation, K.D.; writing—original draft preparation, K.D.; writing—review and editing, A.S.; visualization, K.D.; supervision, A.S.; project administration, K.D. and A.S.; funding acquisition, K.D. and A.S. All authors have read and agreed to the published version of the manuscript.

Funding

The research was carried out as part of work no. WE/WI-IA/1/2019 at the Bialystok University of Technology and financed from a research subsidy provided by the Minister of Education and Science.

Institutional Review Board Statement

Not applicable.

Informed Consent Statement

Not applicable.

Conflicts of Interest

The authors declare no conflict of interest.

References

  1. Ayadi, F.; Colak, I.; Garip, I.; Bulbul, H.I. Impacts of Renewable Energy Resources in Smart Grid. In Proceedings of the 2020 8th International Conference on Smart Grid (icSmartGrid), Paris, France, 17–19 June 2020; pp. 183–188. [Google Scholar] [CrossRef]
  2. Yan, L.; Yongning, C.; Haiyan, T.; Xinshou, T.; Zhankui, Z.; Jianqing, J. Common Focus and New Requirement on Technical Standards of Renewable Energy Grid Integration. In Proceedings of the 2019 Chinese Automation Congress (CAC), Hangzhou, China, 22–24 November 2019; pp. 3719–3723. [Google Scholar] [CrossRef]
  3. Lee, J.; Lee, I.W.; Kim, S.-H. Economic Analysis for Energy Trading System Connected with Energy Storage System and Renewable Energy Sources. In Proceedings of the 2016 IEEE Transportation Electrification Conference and Expo, Asia-Pacific (ITEC Asia-Pacific), Dearborn, Michigan, 27–29 June 2016; pp. 693–696. [Google Scholar] [CrossRef]
  4. Blaabjerg, F.; Yang, Y.; Yang, D.; Wang, X. Distributed Power-Generation Systems and Protection. Proc. IEEE 2017, 105, 1311–1331. [Google Scholar] [CrossRef] [Green Version]
  5. Bignucolo, F.; Cerretti, A.; Coppo, M.; Savio, A.; Turri, R. Effects of Energy Storage Systems Grid Code Requirements on Interface Protection Performances in Low Voltage Networks. Energies 2017, 10, 387. [Google Scholar] [CrossRef]
  6. Schwartfeger, L.; Santos-Martin, D.; Wood, A.; Watson, N.; Miller, A. Review of Distributed Generation Interconnection Standards. In Proceedings of the EEA Conference & Exhibition, Auckland, New Zeland, 25–27 June 2019; pp. 18–20. [Google Scholar]
  7. Verhoeven, B. Probability of Islanding in Utility Network Due to Grid Connected Photovoltaic Power Systems; Report of the International Energy Agency – Phtovoltaic Power Systems Programme T5-07:2002, 02; International Energy Agency: Paris, France, 2002. [Google Scholar]
  8. Worku, M.Y.; Hassan, M.A.; Maraaba, L.S.; Abido, M.A. Islanding Detection Methods for Microgrids: A Comprehensive Review. Mathematics 2021, 9, 3174. [Google Scholar] [CrossRef]
  9. Palm, S.; Schegner, P. Occurrence Probability and Prediction of Unintentional Islands Using Non Detection Zones. In Proceedings of the 2019 IEEE Power Energy Society General Meeting (PESGM), Atlanta, GA, USA, 4–8 August 2019; pp. 1–5. [Google Scholar] [CrossRef]
  10. Woyte, A.; De Brabandere, K.; Van Dommelen, D.; Belmans, R.; Nijs, J. International Harmonization of Grid Connection Guidelines: Adequate Requirements for the Prevention of Unintentional Islanding. Prog. Photovolt. Res. Appl. 2003, 11, 407–424. [Google Scholar] [CrossRef]
  11. Kim, M.-S.; Haider, R.; Cho, G.-J.; Kim, C.-H.; Won, C.-Y.; Chai, J.-S. Comprehensive Review of Islanding Detection Methods for Distributed Generation Systems. Energies 2019, 12, 837. [Google Scholar] [CrossRef] [Green Version]
  12. Kahrobaee, M. Analysis of Local Anti-Islanding Detection Methods for Photovoltaic Generators in Distribution Systems; University of Nebraska: Lincoln, NE, USA, 2019. [Google Scholar]
  13. Bower, W.; Ropp, M. Evaluation of Islanding Detection Methods for Utility-Interactive Inverters in Photovoltaic Systems; Sandia National Laboratory: Albuquerque, NM, USA, 2002; pp. 2002–3591. [Google Scholar] [CrossRef] [Green Version]
  14. Persson, D. Islanding Detection in Power Electronic Converter Based Distributed Generation. Master’s Thesis, Lund University, Lund, Sweden, 2007. [Google Scholar]
  15. De Mango, F.; Liserre, M.; Dell’Aquila, A.; Pigazo, A. Overview of Anti-Islanding Algorithms for PV Systems. Part I: Passive Methods. In Proceedings of the 2006 12th International Power Electronics and Motion Control Conference, Portoroz, Slovenia, 30 August–1 September 2006; pp. 1878–1883. [Google Scholar] [CrossRef]
  16. Isa, A.I.M.; Mohamad, H.; Yasin, Z.M. Evaluation on Non-Detection Zone of Passive Islanding Detection Techniques for Synchronous Distributed Generation. In Proceedings of the 2015 IEEE Symposium on Computer Applications Industrial Electronics (ISCAIE), Langkawi, Malaysia, 12–14 April 2015; pp. 100–104. [Google Scholar] [CrossRef]
  17. Cebollero, J.A.; Cañete, D.; Martín-Arroyo, S.; García-Gracia, M.; Leite, H. A Survey of Islanding Detection Methods for Microgrids and Assessment of Non-Detection Zones in Comparison with Grid Codes. Energies 2022, 15, 460. [Google Scholar] [CrossRef]
  18. Kumar, K.M.; Naresh, M.; Singh, N.K.; Singh, A.K. A Passive Islanding Detection Approach for Distributed Generation Using Rate of Change of Negative Sequence Voltage and Current. In Proceedings of the 2016 IEEE Uttar Pradesh Section International Conference on Electrical, Computer and Electronics Engineering (UPCON), Varanasi, India, 9–11 December 2016; pp. 356–360. [Google Scholar] [CrossRef]
  19. Llonch-Masachs, M.; Heredero-Peris, D.; Chillón-Antón, C.; Montesinos-Miracle, D.; Villafafila-Robles, R. Impedance Measurement and Detection Frequency Bandwidth, a Valid Island Detection Proposal for Voltage Controlled Inverters. Appl. Sci. 2019, 9, 1146. [Google Scholar] [CrossRef] [Green Version]
  20. De Mango, F.; Liserre, M.; Dell’Aquila, A. Overview of Anti-Islanding Algorithms for PV Systems. Part II: Active Methods. In Proceedings of the 2006 12th International Power Electronics and Motion Control Conference, Portoroz, Slovenia, 30 August–1 September 2006; pp. 1884–1889. [Google Scholar]
  21. Desardén-Carrero, E.; Darbali-Zamora, R.; Aponte-Bezares, E.E. Analysis of Commonly Used Local Anti-Islanding Protection Methods in Photovoltaic Systems in Light of the New IEEE 1547-2018 Standard Requirements. In Proceedings of the 2019 IEEE 46th Photovoltaic Specialists Conference (PVSC), Chicago, IL, USA, 16–21 June 2019; pp. 2962–2969. [Google Scholar] [CrossRef]
  22. Voglitsis, D.; Papanikolaou, N.; Kyritsis, A.C. Incorporation of Harmonic Injection in an Interleaved Flyback Inverter for the Implementation of an Active Anti-Islanding Technique. IEEE Trans. Power Electron. 2017, 32, 8526–8543. [Google Scholar] [CrossRef]
  23. Lee, Y.-S.; Kim, J.-H.; Han, B.-M. Islanding Detection Method for Inverter-Based Distributed Generation by Injecting Second Order Harmonic Current. In Proceedings of the 2019 10th International Conference on Power Electronics and ECCE Asia (ICPE 2019-ECCE Asia), Busan, Korea, 27–31 May 2019; pp. 2860–2865. [Google Scholar]
  24. Zhu, X.; Shen, G.; Xu, D. Evaluation of AFD Islanding Detection Methods Based on NDZs Described in Power Mismatch Space; IEEE: San Jose, CA, USA, 2009; pp. 2733–2739. [Google Scholar] [CrossRef]
  25. Zheng, X.; Zhang, R.; Chen, X.; Sun, N. Improved Three-Phase AFD Islanding Detection Based on Digital Control and Non-Detection Zone Elimination. Energies 2018, 11, 2421. [Google Scholar] [CrossRef] [Green Version]
  26. Ko, M.-J.; Choy, I.; Choi, J.-Y.; Song, S.-H.; Lee, K.-O. Novel AFD Method of Islanding Detection with a Periodic Zero Current for Improving on Islanding Detection for Grid-Connected Photovoltaic Inverters. J. Korean Sol. Energy Soc. 2006, 26, 17–23. [Google Scholar]
  27. Abbas, A.S.; El-Sehiemy, R.A.; Abou El-Ela, A.; Ali, E.S.; Mahmoud, K.; Lehtonen, M.; Darwish, M.M.F. Optimal Harmonic Mitigation in Distribution Systems with Inverter Based Distributed Generation. Appl. Sci. 2021, 11, 774. [Google Scholar] [CrossRef]
  28. Yafaoui, A.; Wu, B.; Kouro, S. Improved Active Frequency Drift Anti-Islanding Detection Method for Grid Connected Photovoltaic Systems. IEEE Trans. Power Electron. 2012, 27, 2367–2375. [Google Scholar] [CrossRef]
  29. Dmitruk, K. Predictive-SVM Control Method Dedicated to an AC/DC Converter with an LCL Grid Filter. Bull. Pol. Acad. Sci. Tech. Sci. 2020, 68, 1049–1056. [Google Scholar] [CrossRef]
  30. Falkowski, P.; Godlewska, A. Finite Control Set MPC of LCL-Filtered Grid-Connected Power Converter Operating under Grid Distortions. Bull. Pol. Acad. Sci. Tech. Sci. 2020, 68, 1069–1076. [Google Scholar] [CrossRef]
Figure 1. Examples of power grid configuration: (a) without islanded part of the grid, (b) with islanded part of the grid.
Energies 15 01323 g001
Figure 2. Example of NDZ zone based on monitoring grid’s frequency and voltage parameters.
Energies 15 01323 g002
Figure 3. Block diagram of the voltage converter control system with implemented an anti-islanding function.
Energies 15 01323 g003
Figure 4. Waveforms in the standard AFD method: (a) phase angles, (b) distorted phase currents.
Energies 15 01323 g004
Figure 5. Waveforms in the AFDhs method: (a) phase angles, (b) distorted phase currents.
Energies 15 01323 g005
Figure 6. The result of the simulation of the AFD method (facc = 2): (a) waveforms of the set converter current signal on the AC side, (b) harmonic analysis of the waveform shown in (a).
Energies 15 01323 g006
Figure 7. The result of the simulation of the AFDhs method (facc = 2, x = 2): (a) waveforms of the set converter current signal on the AC side, (b) harmonic analysis of the waveform shown in (a).
Energies 15 01323 g007
Figure 8. Elements of the laboratory examination circuit: (a) two-level AC/DC voltage converter with an LCL filter, (b) parallel RLC load.
Energies 15 01323 g008
Figure 9. The network voltage and current THD40 values measured by the power analyser in normal operation without implementing the anti-islanding method.
Energies 15 01323 g009
Figure 10. Island operation state detection by the AFD method (sco = 0.5, dco = 2): (a) waveforms of the grid voltage (magenta), grid current (green), 0.5*reference grid current (yellow) and frequency delta fa-frtd (blue). (b) The network voltage and current THD40 values measured by the power analyser in normal operation (grid-connected).
Energies 15 01323 g010
Figure 11. Island operation state detection by the AFDhs method (sco = 1, dco = 2, x = 2.5): (a) waveforms of the grid voltage (magenta), grid current (green), 0.5*reference grid current (yellow) and frequency delta fa-frtd (blue). (b) The network voltage and current THD40 values measured by the power analyzer in normal operation (grid-connected).
Energies 15 01323 g011
Table 1. System parameters for the simulation and laboratory tests.
ParameterValue
Parallel RLC load
(values per phase)
R = 32 (Ω)
L = 100 (mH)
C = 100 (μF)
Qf = 1 (-)
Normal frequency range49.5 < fa < 50.5 (Hz)
Normal voltage phase range207 < UGridRMS < 253 (V)
Nominal grid parameters230/400 (V), 50 (Hz)
DC link voltage640 (V)
Grid side inductance L11.83 (mH)
Converter side inductance L24.57 (mH)
Grid filter capacitance C10 (μF)
Sampling time Ts200 (μs)
Modulation frequency5 (kHz)
Publisher’s Note: MDPI stays neutral with regard to jurisdictional claims in published maps and institutional affiliations.

