Article

Potential Greenhouse Gas Mitigation for Converting High Moisture Food Waste into Bio-Coal from Hydrothermal Carbonisation in India, Europe and China

1
School of Chemical and Process Engineering, University of Leeds, Woodhouse Ln, Woodhouse, Leeds LS2 9JT, UK
2
Environmental Science and Engineering Department, Indian Institute of Technology Bombay, Mumbai 400076, India
3
School of Mechanical Engineering, University of Leeds, Woodhouse Ln, Woodhouse, Leeds LS2 9JT, UK
4
School of Energy and Power Engineering, Shandong University, Jinan 250061, China
*
Author to whom correspondence should be addressed.
Energies 2022, 15(4), 1372; https://doi.org/10.3390/en15041372
Submission received: 31 December 2021 / Revised: 26 January 2022 / Accepted: 6 February 2022 / Published: 14 February 2022
(This article belongs to the Section A: Sustainable Energy)

Abstract

:
Hydrothermal carbonisation is a promising technology for greenhouse gas (GHG) mitigation through landfill avoidance and power generation, as it can convert high-moisture wastes into bio-coal which can be used for coal substitution. The GHG mitigation potential associated with landfill avoidance of high-moisture food waste (FW) generated in India, China and the EU was calculated and the potential for coal substitution to replace either grid energy, hard coal, or lignite consumption were determined. Different HTC processing conditions were evaluated including temperature and residence times and their effect on energy consumption and energy recovery. The greatest mitigation potential was observed at lower HTC temperatures and shorter residence times with the bio-coal replacing lignite. China had the greatest total mitigation potential (194 MT CO2 eq), whereas India had the greatest mitigation per kg of FW (1.2 kgCO2/kg FW). Significant proportions of overall lignite consumption could be substituted in India (12.4%) and China (7.1%), while sizable levels of methane could be mitigated in India (12.5%), China (19.3%), and the EU (7.2%). GHG savings from conversion of high-moisture FW into bio-coal and subsequent coal replacement has significant potential for reducing total GHG emissions and represents in India (3%), China (2.4%), and the EU (1%).

1. Introduction

1.1. Background

There has been an ever-increasing interest in waste management, especially the management of food waste (FW). Currently, around a third of all food is wasted [1]. This is estimated to equate to around 1.3 billion tonnes of edible food being wasted annually around the world, resulting in the equivalent of approximately 3.5 billion tonnes of CO2 [2], as large quantities of greenhouse gases (GHGs) are released as a result of producing, processing, transporting, and treating the wasted food [3]. FW treatment is of particular interest due to it having a greater level of impact on climate change when compared to other waste types. This is to do with its large organic content and the fact that a large proportion of FW is landfilled [4]. When landfilled, FW decomposes anaerobically forming methane, a particularly potent GHG, around 25 times more potent than CO2 as a climate forcer [5]. Methane emissions contribute to a large proportion of global GHGs, and there has been an increasing impetus on reducing landfilling emissions with 103 countries pledging to reduce methane emissions by 30% by 2030 when compared to 2020 levels at COP26 [6]. Waste is the third largest contributor to anthropogenic methane behind agriculture and energy and is responsible for 68 MT of methane (1700 MT CO2 eq/yr and 19.6% total anthropogenic methane) [7] with FW being a key contributor to this [8]; thus, a large proportion of methane emissions could be avoided by improving FW treatment [7]. In addition to COP26 commitments, improving FW management presents significant opportunities for meeting UN Sustainable Development goals (SDGs), in particular SDG 13 concerning climate action [9].

1.2. Significance and Options for Energy Recovery from Food Waste

Energy generation is another of the main contributors to GHG emissions globally, with certain countries having particularly carbon intensive energy generation through using high carbon energy sources such as coal. A total of 190 countries have pledged to phase out coal and to decarbonise energy generation, including 23 new countries at COP26 [10]. Additionally, the decarbonisation of energy is in alignment with both SDG 13 regarding climate action, as well as SDG 7 concerning affordable clean energy [9]. There are a number of ways in which FW can be treated to generate energy and contribute to coal substitution and energy decarbonisation; FW can be incinerated with energy recovery and anaerobically digested to create biomethane, which can generate energy, thermally carbonised via pyrolysis to create an energy dense bio-coal, or hydrothermally carbonised to generate an energy dense bio-coal and process water (PW) [11]. Hydrothermal carbonisation (HTC) is a novel technology for converting high-moisture feedstock, such as FW and municipal solid waste (MSW), which could have a particularly great potential for energy generation and GHG mitigation [12].
HTC involves the processing of biological matter in the presence of water at elevated temperatures and pressure. It produces a solid carbonaceous product known as hydrochar (HC), an aqueous phase containing soluble organic and inorganic components and a gaseous fraction containing largely CO2 [13]. Reaction conditions range between 180–260 °C and 20–40 bar pressure. Conversion is typically performed on solid loadings ranging between 10–30 wt.% solids and for reaction times ranging from minutes to several hours [14]. HTC results in the removal of oxygen from the feed via decarboxylation of dehydration reactions, resulting in a higher heating value (HHV) bio-coal with a calorific value similar to brown coal [15]. HTC can be used for any organic feedstock types, although there are clear energetic advantages for the processing of high-moisture feedstock types such as FW. It also facilitates the recovery of energy, chemicals, and nutrients through anaerobic digestion (AD) of process waters (PW) in-line with circular economy principles [14]. It is capable of converting problematic high-moisture, low calorific value feedstock into higher calorific value, hydrophobic, easy-to-handle bio-coal or HC suitable for energy generation [2]. It is, therefore, a technology that would offer great opportunities for climate change mitigation if streams of FW currently landfilled were to be diverted to be processed by HTC, with any HC generated being used to substitute coal used for energy generation [13]. Therefore, the use of HTC for processing FW would have real opportunities concerning SDG 13 in enacting climate action and SDG 7 in providing affordable clean energy, as well as the potential to contribute towards SDG 12 through aiding the sustainable consumption and production of HTC products [9].

1.3. Comparison of the Food Waste Landscape in India, the EU, and China

The two countries with the largest FW levels are China and India, respectively, while the EU also generates vast quantities of FW. The waste landscapes differ significantly in these regions, however, in terms of the current FW generation levels and treatment technologies used. It is very interesting, therefore, to compare and contrast how opportunities for the adoption of HTC of FW would differ in these regions, concerning the decarbonisation of FW treatment, yet there is a lack of literature assessing the implications of these differences.

1.3.1. Current Food Waste Landscape in India

India has major issues associated with its generation and disposal of FW. As seen in Table 1, approximately 253.3 MT of agricultural residues, as estimated by Sahai et al. [16] based on agricultural production and residue generation ratios, and 33.25 million tonnes of FW, as estimated by Kashyap and Agarwal [17] based on production and food loss ratios, are generated per year before the consumption stage. The low-moisture FW and agricultural residues were excluded from this assessment, however, as these may be more suitable for dry thermal processing such as pyrolysis [18], while the use of agricultural residues in animal husbandry is often considered preferable [19]. Subtracting the agricultural residues and low moisture FW deemed unsuitable for HTC, which accounts for almost 271 MT of feedstock, still leaves around 15 million tonnes of high-moisture pre-consumer FW, which can be treated by HTC. Additionally, post-consumption FW has been estimated at 68.76 million tonnes annually, based on a survey by Forbes et al. [20] investigating per capita FW through measuring FW from households in different parts of India. When considering these figures, pre-consumer FW accounts for less than 33% of total FW, while post-consumer FW makes up over 67%. As post-consumer FW is calculated to be many times larger than the 8% estimated for South and Southeast Asia; these figures may vary, with pre-consumer FW making up a greater proportion of overall FW. Xue et al. [21] highlights the uncertainties associated with FW estimates, especially in rapidly developing countries such as India where there is a lack of comprehensive and up to date assessments investigating FW throughout the food chain. However, for a high level assessment of the potential opportunities of utilising this waste as a potential feedstock, these numbers are very useful.
India currently faces major challenges in the treatment and disposal of its FW with only 82% of MSW is collected in India. Moreover, as Table 1 indicates, only around 21.5% of FW in India is processed and treated through AD, composting, and incineration, with around 78.5% of the waste being dumped in open landfill sites [22,23], suggesting significant improvements could be made through landfill avoidance with the adoption alternative processing options such as HTC. This, in turn, could help reduce the estimated 26.7 MT of methane, or 666.5 MTCO2 eq, released every year in India associated with landfill and waste treatment [24].

1.3.2. Current Food Waste Landscape in the EU

The EU also has major challenges associated with its FW landscape. In the EU, as seen in Table 1, 367 MT of agricultural residues, as estimated by Searle and Malins [18] based on agricultural production and residue generation ratios, and 30.6 million tonnes of FW, as estimated by Stenmark et al. [25] based on averaging food losses by sector from EU countries with available data, are generated per year before the consumption stage. The agricultural residues and low-moisture FW were again excluded from this assessment, however, as HTC is considered more suitable for processing high-moisture feedstock types [13]. Excluding agricultural residues and low-moisture FW deemed unsuitable for HTC, which accounts for almost 962 MT of feedstock, leaves around 18.5 million tonnes of high-moisture pre-consumer FW. Pre-consumer FW was categorised into low-moisture, high-moisture, and animal products, based on European FW estimates by FW type from a study by Gustavsson et al. [26]. A further 57 million tonnes of post-consumer FW is generated per annum, as estimated by Stenmark et al. [25], with the majority of post-consumer FW coming from the household setting [27].
The landscape for treatment FW in the EU is relatively mixed. Pre-consumer FW is mostly recycled and utilised in relatively sustainable ways such as for animal feed production, in AD for generation of biomethane, or composting, with only around 3% of high-moisture pre-consumer, and 8% of animal product FW being landfilled, respectively. There is an issue with the treatment of post-consumer FW, however, as an estimated 37% of this waste is landfilled [28], although even this figure is less than half of the landfilling rate in India. Despite landfilling rates being relatively low in the EU, significant improvements could be made through landfill avoidance with the adoption of HTC, which, in turn, could help reduce the estimated 15.4 MT of methane, or 385.2 MT CO2 eq released every year in the EU [29].

1.3.3. Current Food Waste Landscape in China

China also has major challenges with its generation and disposal of FW. As with India, it is very difficult to quantify the exact annual FW produced in China. The best available data, displayed in Table 1, show 930.8 MT of agricultural residues as estimated by Ji [30] based on agricultural production and residue generation ratios, and 291.46 million tonnes of FW as estimated by Xue et al. [21] based on production and food loss ratios, are generated per year before the consumption stage. Agricultural residues and low-moisture FW were again excluded from this assessment, however. Excluding agricultural residues and low moisture FW deemed unsuitable for HTC [13], which accounts for almost 962 MT of feedstock, there is still around 260.11 million tonnes of high-moisture pre-consumer FW generated every year. Additionally, there is around 170 million tonnes of post-consumer FW, as estimated by Zhang et al. [31] based on assessing the FW fraction of MSW and segregated FW in the different parts of China, with the majority of post-consumer FW coming from restaurants and canteens, as opposed to the household setting, contrary to the situation in the EU [31].
When considering FW treatment, China could make major improvements in the way it treats its waste. As of 2014, all MSW is treated in China, bringing it in-line with developed countries. A large proportion of FW is still landfilled (approximately 41%), while a large proportion of FW is now being incinerated [32], with a relatively small proportion of FW being composted or anaerobically digested [33]. It is clear, therefore, that China has considerably less sustainable FW treatment than the EU but treats its FW more sustainably than India does overall. All in all, China landfills vast quantities of FW; thus, significant improvements could be made through landfill avoidance with the adoption of HTC, which in turn could help reduce the estimated 49.6 MT of methane, or 1.24 GT CO2 eq released every year in India [24].
Table 1. Characteristics of the different steps in the FW supply chain in the different regions.
Availability and CompositionTypical Food Waste Characteristics
Food Waste TypeAgricultural ResiduesLow Moisture pre Consumer FWHigh Moisture pre Consumer FWWaste from Animal ProductsPost-Consumer FW
Examples of food waste typesRice straw, wheat straw, and sugarcane bagasseCorn cob, rice husk, kenaf, coconut coir, and hazelnut skinApples, oranges, tomatoes, sweetcorn, jackfruit, and fruit pomaceMeat and dairyHousehold and restaurant waste
Literature sources[16,19,30,34,35,36][17,21,25,26,37,38,39,40][17,21,25,26,40,41,42,43,44][17,21,25,26,42,45][20,25,32,46,47,48]
Quantities available in India (MT/year):
Total253.317.6114.091.5568.76
Landfilled 13.8211.061.2154.01
Quantities available in EU
(MT/year)
Total36712.113.25.357
Landfilled -0.40.4221.09
Quantities available in China (MT/year)
Total930.830.76199.4760.64170
Landfilled-12.6181.7824.8696.07
Moisture (%)6–83.6–10.756–88.1413.8–89.0468.1–75
VS (% TS)77.5–89.568.6–97.754.7–96.471.9–96.486.6–94.1
Carbon (%)40.3–44.0437.8–56.842.6–52.453–53.647.2–53.02
Hydrogen (%)5.53–6.184.73–7.22.5–6.85.97–8.86.6–7.79
Nitrogen (%)0.88–1.150.35–2.80.5–4.74–17.262.3–4.69
Oxygen (%)48.9–53.140.5–48.247.823.2–34.234.35–39
Ash (%)1.9–11.68.5–16.323.6–20.70.3–21.15–5.2
Figures for moisture are shown as a percentage of total mass (on an as received basis). Figures for elemental and ash content are all shown as a percentage of mass on a dry basis.

1.4. Comparison of Regions Energy Intensity and Coal Usage

The two countries with the largest levels of coal usage are China and India, respectively, while the EU region also uses large amounts of coal in certain countries. The regions also have very different carbon intensities of grid energy, with India and China using considerably more carbon intensive energy sources. For these reasons, it is very interesting to compare and contrast how the opportunities for the adoption of HTC of FW would differ in these regions and how they would impact the decarbonisation of grid energy and coal substitution, something that is yet to be researched.
India’s grid energy is very carbon intensive, while the country also uses vast amounts of coal for energy and industry. Indian grid energy, as shown in Table 2, currently has a very high carbon intensity of 707 g CO2 eq per kWh due to its reliance on coal and other fossil-fuel derived carbon intensive energy sources [49]. Moreover, India uses vast quantities of coal, most of which is hard coal (806 MT/year), as opposed to lignite (47 MT/year), making India the second largest consumer of coal in the world [50].
In contrast, the EU has a much lower carbon intensive grid energy mix, and a significantly lower level of coal consumption. EU energy grid intensity, shown in Table 2, is 275 g CO2 eq per kWh. This lowering is due to many member nations phasing out coal use for energy generation and adopting low carbon energy sources such as nuclear and bioenergy [51]. Coal usage in the EU is also much lower than in India, as many countries phased out coal; however, certain countries such as Poland and Germany still use large amounts of coal [52]. Hard coal use in the region is very low (144 MT/year); however, its lignite use is much higher (246 MT/year), equating to almost five times that of India, with the EU being one of the major lignite users globally [52,53].
China has a relatively carbon intense grid energy mix and has an extremely high level of coal consumption. China’s energy grid intensity, as shown in Table 1, is 580 g CO2 eq per kWh. This is significantly higher than the EU average, due to China relying on carbon intense energy sources, in particular coal, but notably lower than the figure for India, as India generates vast amounts of low carbon energy from renewable sources such as hydropower and bioenergy [54]. China is the world’s primary consumer of coal, using more than three times more coal than India, the second largest consumer. On the other hand, China consumes less lignite than the EU [50]. It is clear, therefore, from Table 2, that all of the regions could make significant improvements in decarbonisation of energy, especially India, and coal reduction, especially China.
Table 2. Grid energy carbon intensity and coal usage in the different regions.
CountryEnergy Grid Carbon Intensity
(g CO2 eq/kwh)
Hard Coal Use (MT)Lignite Usage (MT)
Sources:[51,55][50,52,53][50,52,53]
India707.280647
EU275144246
China5803243235

1.5. Summary

It is clear, therefore, that vast quantities of FW are currently being generated, while large amounts of coal are being mined and combusted to generate energy to varying degrees in India, the EU, and China, to the detriment of the environment. HTC of currently landfilled FW offers a clear opportunity for mitigating emissions resultant from landfilling FW, as well as decarbonising energy generation by substituting coal with HC; however, the extent of this opportunity and how it would differ in the different regions is yet to be determined by the literature.

1.6. Aim and Objectives

The overall aim of the paper was to investigate the opportunities and limitations that the adoption of FW HTC could have on GHG mitigation in India, the EU, and China. The first objective of the paper is to assess and compare the climate mitigation potential associated with the HTC of all currently landfilled FW in India, the EU, and China for different high-moisture FW types, for landfill avoidance, grid energy, and lignite and hard coal substitution. The second objective is to assess the impact that using different HTC processing conditions would have on GHG mitigation potentials. The third objective is to assess the total and proportion of lignite and hard coal that could be substituted in the different regions. The fourth objective is to assess the total and proportion of methane emissions that could be avoided in the regions. The fifth objective is to examine implications of future changes to the FW landscape in the different regions and the practical implications associated with the utilisation of HC for coal substitution. The sixth and final objective is to evaluate the role FW HTC may have on overall GHG reductions in India, the EU, China, and the globe. Altogether, this is a high-level investigation aiming to identify the approximate GHG and methane mitigation potential, as well as coal substitution potential arising from HTC of currently landfilled, high-moisture FW in India, the EU, and China. No paper has specifically assessed the GHG mitigation, coal replacement, and methane avoidance potential for HTC in India, the EU, and China. This paper, therefore, has the purpose of opening up a new topic area for further research to conduct more in-depth studies in order to ascertain more precise quantifications of the potential benefits from FW HTC.

1.7. Methods Used

Quantitative techniques were used to specifically determine the potential for utilising currently landfilled pre-consumption high-moisture FW, pre-consumption animal product FW, and post-consumption FW, with the HC produced during HTC being used to substitute grid energy, lignite (brown coal), and hard coal in the different regions. An assessment was made of the total mitigation potential (total MTCO2eq/year), as well as the average mitigation potential per tonne of FW (tonne CO2 eq/tonne FW) for each FW category. This looked at the specific impacts for landfill avoidance, grid energy substitution, lignite substitution, and hard coal substitution, in addition to a combination of landfill and grid energy, landfill and lignite, and landfill and hard coal substitution. A further assessment was also made for the total quantities (MT/year) and proportion of total usage (%) of lignite and hard coal that could be substituted, through FW HTC in the different regions. An assessment was also made for the total quantities (MT/year) and proportion of total emissions (%) of methane that could be avoided, through landfill avoidance with FW HTC in the different regions.

1.8. Paper Outline

The paper addresses the methodology used for the calculations, then discusses the climate mitigation potential by category in India, the EU, and China. A comparison is made of the mitigation potential in the regions, and its implications towards policy and current trends on future mitigation opportunities are discussed, providing novel findings. The research investigates the practical implications of HC utilisation and coal substitution, such as the impact of fuel properties and differences between coal and HC with potential solutions to any issues that may develop, and the general potential for FW HTC in decarbonising regions and the globe. The information provided in this paper could be used to gain a real appreciation of the theoretical opportunities that HTC of FW could provide in the different regions to help policy makers understand the extent to which the HTC of FW could aid GHG mitigation, coal substitution, and methane avoidance.

2. Materials and Methods

2.1. HTC Feedstock

For each FW type, feedstock quantities for each region were taken from figures in the literature and is shown in Table 1, alongside the quantities of FW being landfilled by category. Only landfilled FW was considered for HTC. FW characteristics such as carbon, hydrogen, oxygen, nitrogen, and sulphur (CHONS) and moisture content were also taken from the literature from a range of items associated with the type of FW. For the purpose of calculations, the minimum and maximum values for each FW category were averaged, with the mean value used in order to estimate the typical FW characteristics for each FW type. For each of the FW types, higher heating value (HHV) in MJ was estimated using an equation by Friedl [56], as shown in Equation (1), and was based on the average elemental characteristics where C is the carbon fraction, H is the hydrogen fraction, and N is the nitrogen fraction of the feedstock.
HHV = 3.55C2 − 232C − 2230H + 51.2C X H + 131N + 20,600

2.2. Landfill Avoidance

For wet FW (as received), GHG mitigation figures (MT CO2 eq/year) for landfill avoidance in the different regions were calculated through using a range of assumptions. Methane emissions were calculated for each FW type for the different regions by multiplying the quantities of landfilled FW on a dry basis (MT), by the carbon fraction of the FW (both shown in Table 1), the dissimilation factor of biogenic carbon as landfill gas (LFG), the proportion of carbon in the FW that would be expected to turn into LFG, (0.64) and the proportion of LFG that would be expected to be methane (0.55) [57]. The quantities of methane were then converted into CO2 equivalent emissions by multiplying total methane emissions (MT) by the global warming factor (GWF) of methane, which is 25 times more potent than CO2 [5]. The method to calculate total methane emissions avoided is shown in Equation (2), where CH4 (total) is the total methane emissions from landfilling, FWdw is the total dry FW (excluding moisture), C is the carbon fraction of the FW, and the method to calculate the CO2 eq from avoided methane emissions is shown in Equation (3), where GWF (LFG) is the CO2 eq of the avoided methane emissions, and CH4 (total) is the total methane emissions from landfilling.
CH4 (total) = FWdw × C (0.55 × 0.64)
GWF (LFG) = 25 × CH4 (total)
Other emissions associated with landfilling each tonne of wet waste (as received) such as construction, excavation, and onsite diesel use were also included using the following figures: diesel fuel for excavation (1.3 kg CO2/tonne FW), synthetic liner (1.85 kg CO2/tonne FW), and gravel (0.15 kg CO2/tonne FW), as well as onsite diesel use (5.5 kg CO2/tonne FW), altogether totaling 8.8 kg CO2/tonne FW [56] as shown in Equation (4), where GWF (other) is the total (non-methane) emissions from running the landfill site (associated with the landfilled FW), and FWww is the total wet FW (as received). The overall calculation factoring in methane emissions, as well as other landfilling emissions mitigated from the avoidance of landfilling of FW in the different regions is shown in Equation (5), where GWF (LF) is the overall CO2 eq mitigation from landfill avoidance, GWF (LFG) is the total CO2 eq mitigation from methane avoidance, and GWF (other) is the total (non-methane) emissions from running the landfill site. Construction emissions were considered for landfilling, but not HTC, as it was assumed that HC would be used in existing coal-fired power plants to generate energy [58]. Onsite heat and electricity use, as well as offsite transport emissions were excluded, however, as it was assumed that associated emissions would be similar for both HTC and landfilling of FW [59].
GWF (other) = FWww × 0.0088
GWF (LF) = GWF (LFG) + GWF (other)

2.3. HTC Energy Generation Calculations for the Different Process Conditions

HTC energy generation was calculated to assess the credentials of low-intensity, medium-intensity, and high-intensity HTC, respectively, for the following process conditions: 180 °C for 1 h, 220 °C for 3 h, and 250 °C for 6 h. Energy yield was calculated by dividing the gross energy output after FW HTC (HC and PW as based on equations by Lucian et al. [60]) by the energy input of the raw FW (HHV of FW, based on estimated HHV multiplied by FW quantities for the regions). The net energy gains were calculated by subtracting the energy input (during the HTC process also based on equations by Lucian et al., 2020) from the gross energy output (from HC and PW as based on equations by Lucian et al. [60]) and dividing this figure by the gross energy output. The study by Lucian et al. [60] conducted an energy assessment for HTC of the organic fraction of MSW (primarily FW), calculating energy inputs, as well as outputs from hydrochar and AD of PW, using the same process conditions as used in this study. The following energy yields and net energy gains were used, as calculated from figures by Lucian et al. [60]: FW HTC at 180 °C for 1 h had an energy yield of 0.87 and a net energy gain of 0.46; FW HTC at 220 °C for 3 h had an energy yield of 0.95, and a net energy gain of 0.40; FW HTC at 250 °C for 6 h had an energy yield of 0.68, and a net energy gain of 0.08. The equation for calculating the energy output is shown in Equation (6), where E(PJ) is the total energy output, EFW is the total energy content of the raw FW, EY is the energy yield, and Enet is the net energy gain.
Yields were taken from Lucian et al. [60] because the figures presented in the Lucian et al. [60] study allowed for the energy generation calculations to be made based on the estimated feedstock availability and HHV inputs, for low, medium, and high HTC processing intensity scenarios in a way that other papers would not. Furthermore, the yield values concerning net energy yield and net energy gain for both HC and PW utilisation were calculated to be similar to comparable studies [61,62]. In addition, Lucian et al. [60] calculated energy generation from PW, through biomethane production related to AD, the established technology for utilising the process waters and the technology proposed for the calculations in this paper, in contrast to similar studies [61,62].
Figures were calculated in PJ and were then converted to GWh by multiplying the energy by 288.78, and then adjusted to factor in the efficiency of converting the raw energy into electrical energy by multiplying the total energy generation figures by 0.33, the efficiency fraction of a typical coal-fired power plant [63]. The equation for converting the energy output in PJ to GWh, adjusting for efficiency losses is shown in Equation (7), where E(total) is the energy generation in GWh after efficiency losses, and E(PJ) is the total energy output (in PJ) before factoring in efficiency losses in power plants).
E(PJ) = EFW × EY × Enet
E(total) = E(PJ) × 277.78 × 0.33

2.4. Grid Energy Substitution

GHG mitigation figures for grid energy substitution were calculated for the different regions, where the energy generated from HTC would be used to contribute directly towards the national grid energy supply. This was performed by multiplying the net energy generation (GWh) figures by the grid carbon intensity figures (KT CO2 eq/GWh) displayed in Table 2, as shown in Equation (8), where GWF (grid) is the total CO2 eq mitigation from grid substitution, E(total) is the total energy generated (in GWh, after efficiency losses), and CIgrid is the carbon intensity of the grid (in g CO2 eq/kWh)
GWF (grid) = E(total) × CIgrid

2.5. Coal Substitution

GHG mitigation figures for coal substitution were calculated for the different regions, where the energy generated from HTC would be used to contribute directly towards the substitution of hard coal or lignite. This was performed by multiplying the net energy generation (GWh) figures by the carbon emissions associated with energy generation from hard coal of 1.05 kg CO2-eq/kWh and lignite of around 1.30 kg CO2 eq/kWh, as taken from a review of the CO2 emissions associated with energy generation from hard coal and lignite by Turconi et al. [64]. Equation (9) shows GHG mitigation from hard coal, where GWF (hc) is the total CO2 eq mitigation from hard coal substitution and E(total) is the total energy generated (in GWh, after efficiency losses), and Equation (10) shows GHG mitigation from lignite, where GWF (lig) is the total CO2 eq mitigation from lignite substitution, and E(total) is the total energy generated (in GWh, after efficiency losses).
GWF (hc) = E(total) × 1.05
GWF (lig) = E(total) × 1.3

2.6. Mitigation per kg of FW

Total GHG mitigation figures (MT CO2 eq) were converted into GHG mitigation per kg of FW (kg CO2/kg FW) by dividing the total mitigation (MT CO2 eq) by the quantities of wet waste, as received (MT) for each country, for each FW category, with the FW quantities shown in Table 1. The calculation is shown in Equation (11), where MpFW is the CO2 eq mitigation per kg of FW (kg CO2 eq/kg FW), GWF (total) is the total GHG mitigation for the different mitigation options (MT CO2 eq), and FWww is the total FW (as received) for the different FW categories in the different regions (MT).
MpFW = GWF (total) ÷ FWww

2.7. Total and Proportion of Coal Substituted in Regions

The proportion of total coal usage that could be substituted from FW HTC was calculated by dividing the total net energy generated by the energy content of lignite (26.7 MJ/kg) and hard coal (29.3 MJ/kg), as taken from Food and Agriculture Organization [65], a paper on energy conversion, factoring in energy efficiency (0.33) [63], to show the total quantity of lignite and hard coal that could be substituted (MT/year). Equation (12) shows total substitution potential for hard coal, where hc (total) is the total quantity of hard coal that could be substituted (MT), and E(PJ) is the total energy output (in PJ before factoring in efficiency losses in power plants), and Equation (13) shows total substitution potential for lignite, where Lig (total) is the total quantity of lignite that could be substituted (MT), and E(PJ) is the total energy output (in PJ before factoring in efficiency losses in power plants). An assumption was made that power plant efficiency losses would be the same for hc as it would be for hard coal and lignite (67%) [58].
hc (total) = E(PJ) ÷ 29.3
Lig (total) = E(PJ) ÷ 26.7
The total quantities of hard coal and lignite (MT/year) that could be substituted using the different conditions in the different regions were then divided by the total lignite and hard coal usage in the regions and multiplied by 100 to find the proportion (%) of these coal types that could be replaced by FW HTC products in the different regions. Equation (14) shows the proportion of total hard coal use that could be substituted in the different regions, where hc (%) is the proportion of hard coal that could be substituted in the studied region, hc (total) is the total quantity of hard coal that could be substituted (MT), and hcR is the total quantity of hard coal used in the region annually, and Equation (15) shows proportion of total lignite use that could be substituted in the different regions, where Lig (%) is the proportion of lignite that could be substituted in the studied region, Lig (total) is the total quantity of lignite that could be substituted (MT), and LigR is the total quantity of lignite used in the region annually.
hc (%) = hc (total) ÷ hcR
Lig (%) = Lig (total)÷ LigR

2.8. Methane Avoidance

The total quantities (MT/year) and proportion of total anthropogenic methane that could be avoided in the different regions was calculated through using the same range of assumptions explained in Section 2.2, as shown in Equation (2). The total annual methane emissions avoided were then divided by total anthropogenic methane emissions for the studied regions to estimate the proportion of methane that could be avoided through the HTC of currently landfilled FW. Equation (15) shows the proportion of methane that could be substituted in the different regions, where CH4 (%) is the proportion of methane that could be avoided in the studied region, CH4 (total) is the total methane emissions from landfilling that is avoided, and CH4R is the total annual anthropogenic methane emissions emitted in the region annually.
CH4 (%) = CH4 (total) ÷ CH4R

3. Results

The results first cover key non-region specific trends such as the general impacts of process conditions and coal substitution type (hard coal or lignite) on GHG mitigation.
After this, region specific findings for India, the EU, and then China are discussed. These sections consider the individual contributions of the GHG mitigation components; GHG mitigation from landfill avoidance, GHG mitigation through the energy generated from FW HTC substituting grid energy in the region assessed (grid energy substitution), and GHG mitigation through the energy generated from HTC substituting coal (hard coal and lignite substitution). These sections then compare combined GHG mitigation scenarios (landfill and grid energy substitution and landfill and coal substitution), before considering the GHG mitigation opportunities from the different FW types (high-moisture pre-consumer FW, animal products pre-consumer FW, and post-consumer FW).
Following this, GHG mitigation opportunities in the different regions (India, the EU, and China) are compared. This section compares the scale of mitigation opportunities in the different regions, before comparing GHG mitigation opportunities per kg of FW generated in the regions.
After this, levels of potential coal substitution are discussed. This considers the non-region specific trends such as the general impacts of HTC process conditions, as well as coal substitution type (hard coal or lignite) on total coal substitution quantities. It then presents the region-specific findings in India, the EU, and then China on total and proportional coal replacement opportunities for hard coal and lignite.
Following this, levels of methane avoidance from landfill avoidance is considered. This section looks region specific findings in India, the EU, and then China for total methane avoidance and the proportion of anthropogenic methane that could be avoided in each region.
Finally, a framework for calculating GHG mitigation and coal substitution from FW HTC in different regions is presented. This framework is designed for instructing policy-makers and researchers on how to conduct similar assessments in different regions.

3.1. Non-Region Specific Trends

The effect of HTC conditions on GHG mitigation from grid energy and coal substitution are the same for all of the studied regions. Processing the FW at 180 °C for 1 h has the greatest net energy gain and therefore the greatest GHG mitigation potential. GHG mitigation levels for these conditions were 5.7% higher than processing the FW at 220 °C for 3 h, due to the increased net energy gain resulting from the lower HTC energy consumption, slightly outweighing lower energy outputs. A more significant reduction in net energy gain is observed when processing the FW at 250 °C for 6 h, resulting in a net energy gain and related GHG reduction from coal and grid energy substitution, of 7.1 and 6.7 times less than that for 180 °C for 1 h and 220 °C for 3 h, respectively, due to much higher energy inputs and lower energy outputs under these conditions.
In addition, the same proportional increase in GHG mitigation when substituting lignite as opposed to hard coal was observed for all countries. GHG mitigation levels for lignite were around 13.8% higher than for hard coal in all studied regions, due to the fact that lignite (1.3 kg CO2 eq/kWh) is 13.8% more carbon intensive as a fuel than hard coal (1.05 kg CO2 eq/kWh).

3.2. India Greenhouse Gas Mitigation Potential

Total GHG reduction levels and GHG reductions per tonne of total FW for the different GHG mitigation components and GHG mitigation scenarios associated with FW HTC in India are shown in Table 3 and Figure 1. Landfilling has the greatest GHG mitigation potential of all of the GHG mitigation components, with a total mitigation of over 84 MT of equivalent CO2, reducing the GHGs associated with Indian FW by 0.99 kg of CO2 eq for every kg of FW generated in the country. Conversely, utilising the energy from HTC for direct grid energy substitution in India has the lowest GHG mitigation of the GHG mitigation components, with a maximum total GHG mitigation of almost 10.1 MT CO2 eq, and 0.12 kg of CO2 eq per kg of FW generated in the country, more than eight times lower than that of landfill avoidance. Utilising the energy from HTC for direct coal substitution results in a significantly lower mitigation potential than landfill avoidance, but slightly more mitigation than grid energy, due to the grid energy mix containing many energy sources that are less carbon intensive than coal. Lignite substitution would mitigate around 18.5 MT of CO2 eq, and 0.22 kg CO2 per kg FW, a level of GHG mitigation around 1.9 times greater than for grid energy substitution.
An assessment of total GHG mitigation potentials based on the different GHG mitigation scenarios (landfill avoidance and grid energy or landfill avoidance and coal substitution) found that landfill avoidance and lignite substitution has the greatest mitigation potential. A GHG mitigation of over 102.5 MT of CO2 eq per year could be achieved with this scenario, reducing GHG emissions from FW by an average of 1.22 kg per kg of FW, when processing at 180 °C for 1 h. Following this, landfill avoidance and hard coal substitution has the next greatest GHG mitigation potential, with a GHG mitigation of around 99 MT of CO2 eq per year, reducing GHG emissions from FW by an average of 1.17 kg per kg of FW, when using the same processing conditions. Landfill avoidance and grid energy substitution has the lowest GHG mitigation potential, with a GHG mitigation of over 94.1 MT of CO2 eq per year, reducing GHG emissions from FW by an average of over 1.12 kg per kg of FW.
Concerning GHG mitigation potentials for the different FW types, post-consumer FW has the greatest GHG mitigation, as it makes up the majority of the total FW. The mitigation potential for this type of FW is almost 83.2 MT of CO2 eq per year, when processing at 180 °C for 1 h to substitute landfilling and lignite, when compared to just over 16 MT, and almost 3.4 MT of CO2 eq per year for high-moisture pre-consumer, and animal products pre-consumer FW, respectively, as they represent comparatively small sources of FW in the country. On the other hand, animal products FW has the greatest GHG mitigation potential per kg of FW (2.2 kg CO2 eq per kg of FW, when processing at 180 °C for 1 h to avoid landfilling and substitute lignite). This equates to almost double the GHG mitigation from post-consumer FW and high-moisture pre-consumer FW (1.2 kg and 1.1 kg CO2 eq per kg of FW, respectively). This is due to animal product FW having a higher carbon content, lower moisture content, and higher energy density per tonne of wet waste, meaning it would generate more energy after HTC or methane when landfilled.

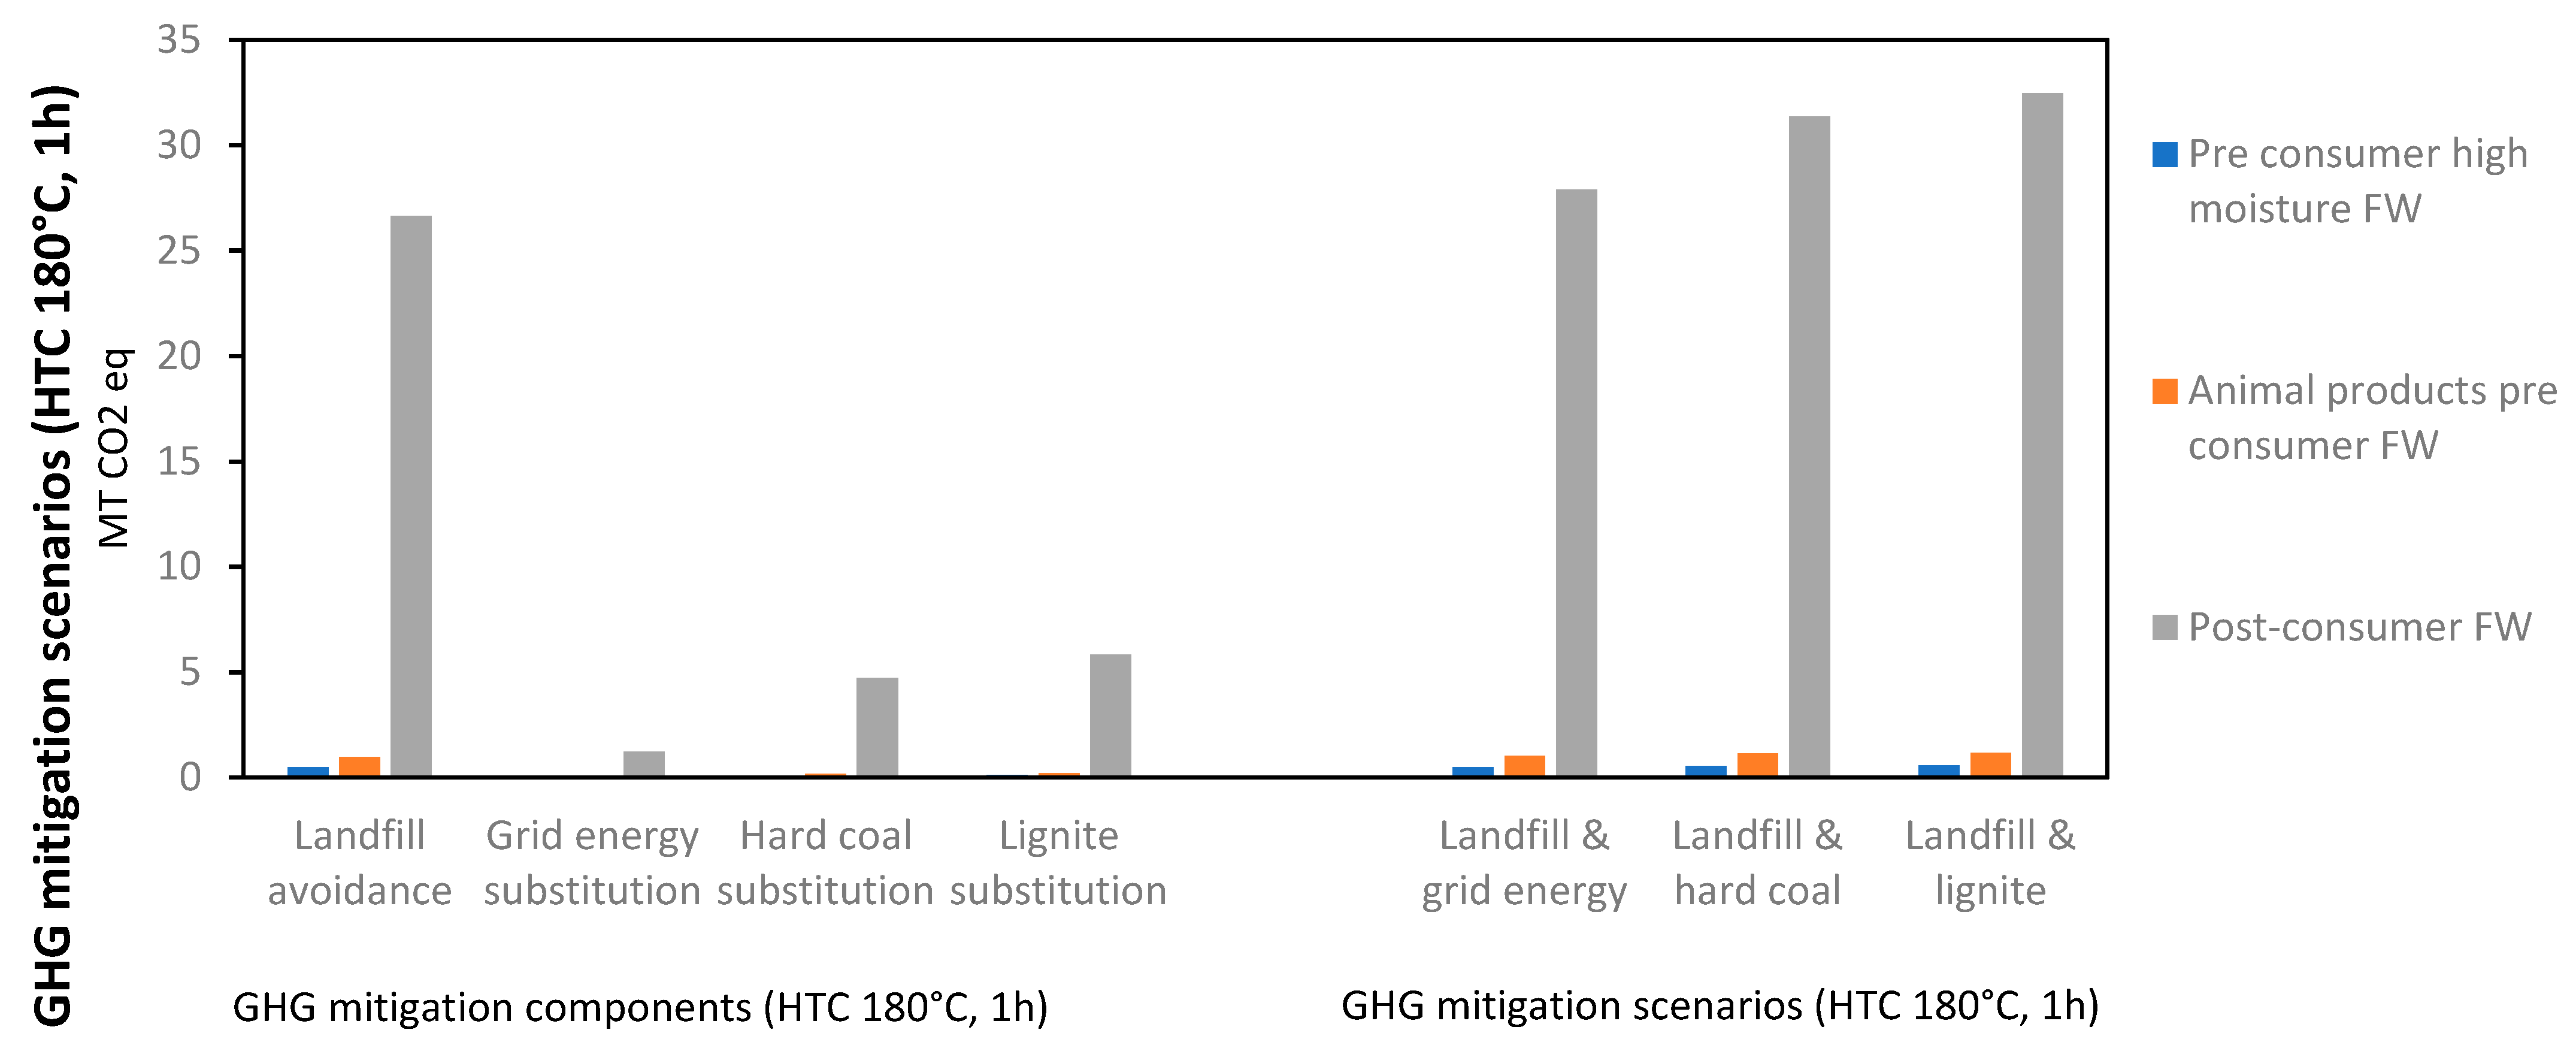
3.3. EU Greenhouse Gas Mitigation Potential

Levels of GHG reduction and GHG reductions per tonne of total FW for the different GHG mitigation components and GHG mitigation scenarios in the EU were generated and are presented in Table 4. Landfill avoidance has the greatest GHG mitigation of the categories, as illustrated in Figure 2, with a total mitigation potential of almost 28.1 MT of equivalent CO2, and would reduce the GHGs associated with EU FW by 0.37 kg of CO2 eq for every kg of FW generated in the country. Conversely, grid energy substitution has the lowest GHG mitigation, with a maximum total GHG mitigation figure of just over 1.3 MT CO2 eq and around 0.02 kg of CO2 eq per kg of FW. Mitigation levels from energy substitution are particularly low, due to the EU having a low grid energy carbon intensity, when compared to the other studied regions. Coal substitution results in a significantly lower mitigation potential than landfill avoidance but considerably more mitigation than grid energy, due to the EU energy mix mostly containing energy sources that are substantially less carbon-intensive than coal. Additionally, lignite substitution would mitigate over 6.1 MT of CO2 eq but still only 0.08 kg CO2 per kg FW.
Total mitigation potentials based on the different GHG mitigation scenarios show landfill and lignite substitution has the biggest mitigation potential, with a potential GHG mitigation of over 34.2 MT of CO2 eq per year, reducing GHG emissions from FW by an average of 0.45 kg per kg of FW, when processing at 180 °C for 1 h. Landfill and grid energy substitution has the lowest GHG mitigation potential, with a GHG mitigation of almost 29.4 MT of CO2 eq per year, reducing GHG emissions from FW by an average of 0.39 kg per kg of FW. These results highlight the fact that, while landfill mitigation is the main GHG mitigation component, there is a significant increase in mitigation if HC substitutes coal and not grid energy, with the mitigation potential of landfill and lignite substitution being 16.3% higher than landfill and grid energy substitution.
Post-consumer FW has the greatest GHG mitigation potential of the different FW types. This is because the majority of the landfilled FW is generated after consumption, due to there being significantly higher landfilling rates than for pre-consumer FW (37%, compared to 8% for pre consumer animal waste and 3% for pre consumer high-moisture FW), and post-consumer FW makes up the majority of total EU FW (around 62.5% of the total high-moisture FW). The mitigation potential for this type of FW is almost 32.5 MT of CO2 eq per year, when processing at 180 °C for 1 h to substitute landfilling and lignite, when compared to just under 0.6 and 1.2 MT of CO2 eq per year for high-moisture pre-consumer FW, and animal products pre-consumer FW, respectively, as they represent comparatively smaller sources of FW and have considerably lower landfilling rates associated with them in the region. In addition, per tonne of FW, post-consumer FW has the greatest mitigation potential of almost 0.57 kg CO2 eq per kg of FW when processing at 180 °C for 1 h to substitute landfilling and lignite, when compared to just over 0.04 and 0.22 kg CO2 eq per kg of FW for high-moisture FW and animal products pre-consumer FW, respectively.

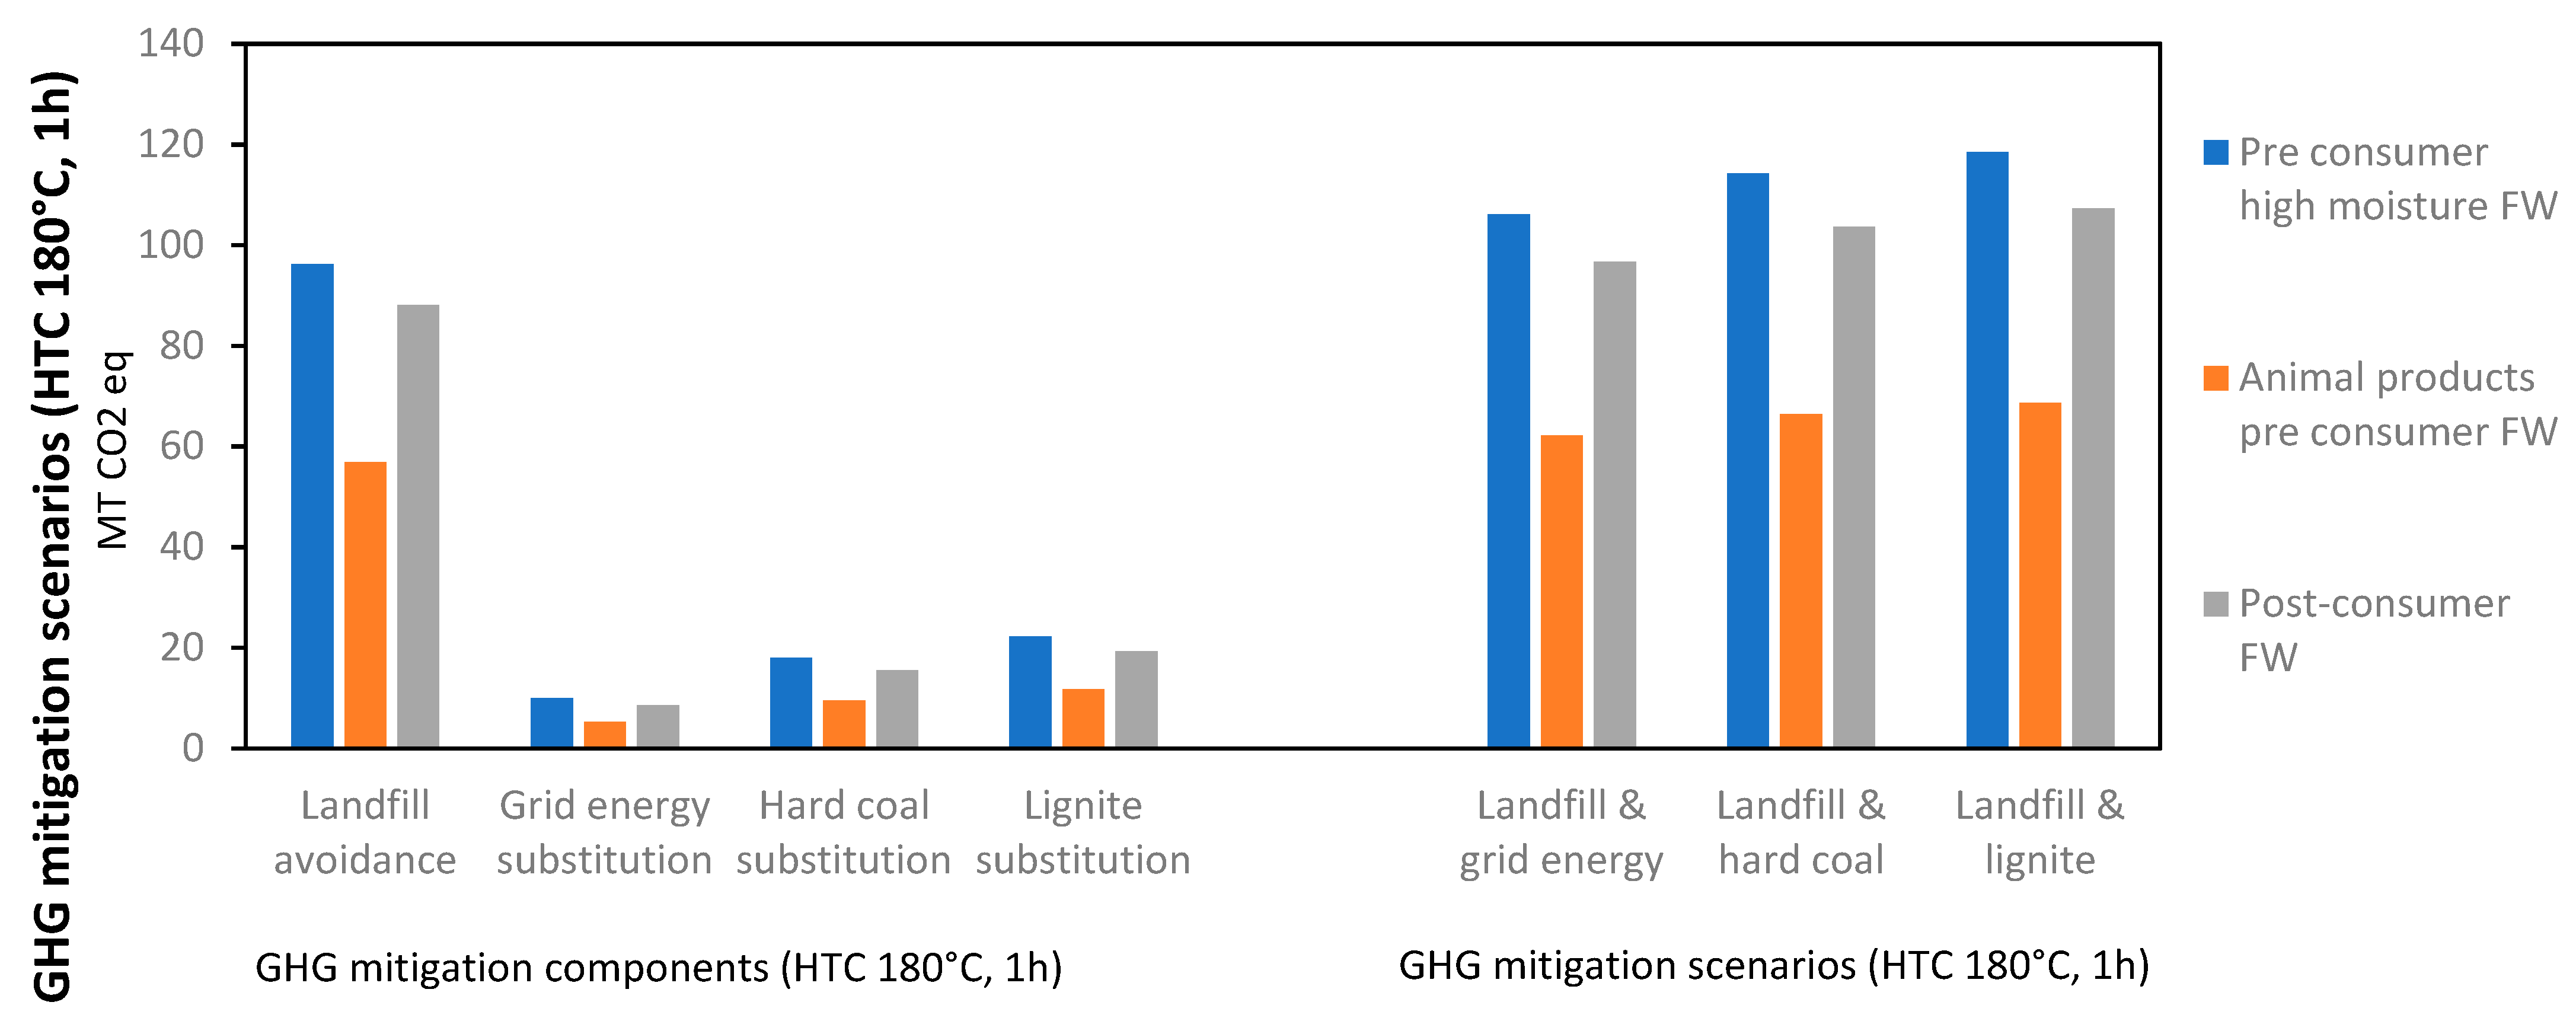
3.4. China Greenhouse Gas Mitigation Potential

Figures were generated on the total GHG reduction and GHG reductions per tonne of total FW for the different GHG mitigation components and scenarios associated with FW HTC in China and are displayed in Table 5. As with the other regions, landfill avoidance has the greatest GHG mitigation of all of the specific components, as shown in Figure 3, with a total mitigation potential of over 241 MT of equivalent CO2. In addition, the GHG mitigation per kg of FW associated with the landfill avoidance in China is just over 0.56 kg of CO2 eq for every kg of FW generated in the country. Grid energy substitution has the lowest GHG mitigation of the categories, with a maximum total GHG mitigation figure of under 23.8 MT CO2 eq, and just under 0.06 kg of CO2 eq per kg of FW, around 9.3 times lower than that of landfill avoidance. Coal substitution results in a significantly lower mitigation potential than landfill avoidance but greater mitigation than grid energy, due to the Chinese energy mix containing many energy sources that are substantially less carbon intensive than coal. Lignite substitution would mitigate almost 53.3 MT of CO2 eq and just over 0.12 kg CO2 per kg FW, a level of GHG mitigation more than 2.2 times greater than for grid energy substitution.
When considering total mitigation potentials from the different GHG mitigation scenarios, landfill and lignite substitution has the greatest mitigation potential, with a GHG mitigation of over 294 MT of CO2 eq per year, reducing GHG emissions from FW by an average of 0.68 kg per kg of FW when processing at 180 °C for 1 h. Landfill and grid energy substitution has the lowest GHG mitigation potential, with a GHG mitigation of almost 265 MT of CO2 eq per year, reducing GHG emissions from FW by an average of 0.62 kg per kg of FW. These results show that there is a slight increase in mitigation if HC substitutes coal and not grid energy. The mitigation potential of landfill and lignite, substitution is 16% higher than for landfill and grid energy substitution.
With regard to GHG mitigation potentials for the different FW types, high-moisture pre-consumer FW has the greatest GHG mitigation potential, as it makes up the largest proportion of the total FW generated in China (over 46% of total high-moisture FW and landfilled FW), while post-consumer FW makes up 39.5% of the landfilled FW, and animal products pre-consumer FW makes up around 14.5% of landfilled FW and related emissions. The mitigation potential for high-moisture pre-consumer FW is almost 118.5 MT of CO2 eq per year, when processing at 180 °C for 1 h to substitute landfilling and lignite, when compared to 107.3 and 68.6 MT of CO2 eq per year for post-consumer and animal products pre-consumer FW, respectively, as they represent comparatively smaller sources of FW. Conversely, per tonne of FW, animal products FW has the greatest mitigation potential of almost 1.13 kg CO2 eq per kg of FW, when processing at 180 °C for 1 h to substitute landfilling and lignite, when compared to 0.59 and 0.63 kg CO2 eq per kg of FW for high-moisture pre-consumer FW and post-consumer FW, respectively.

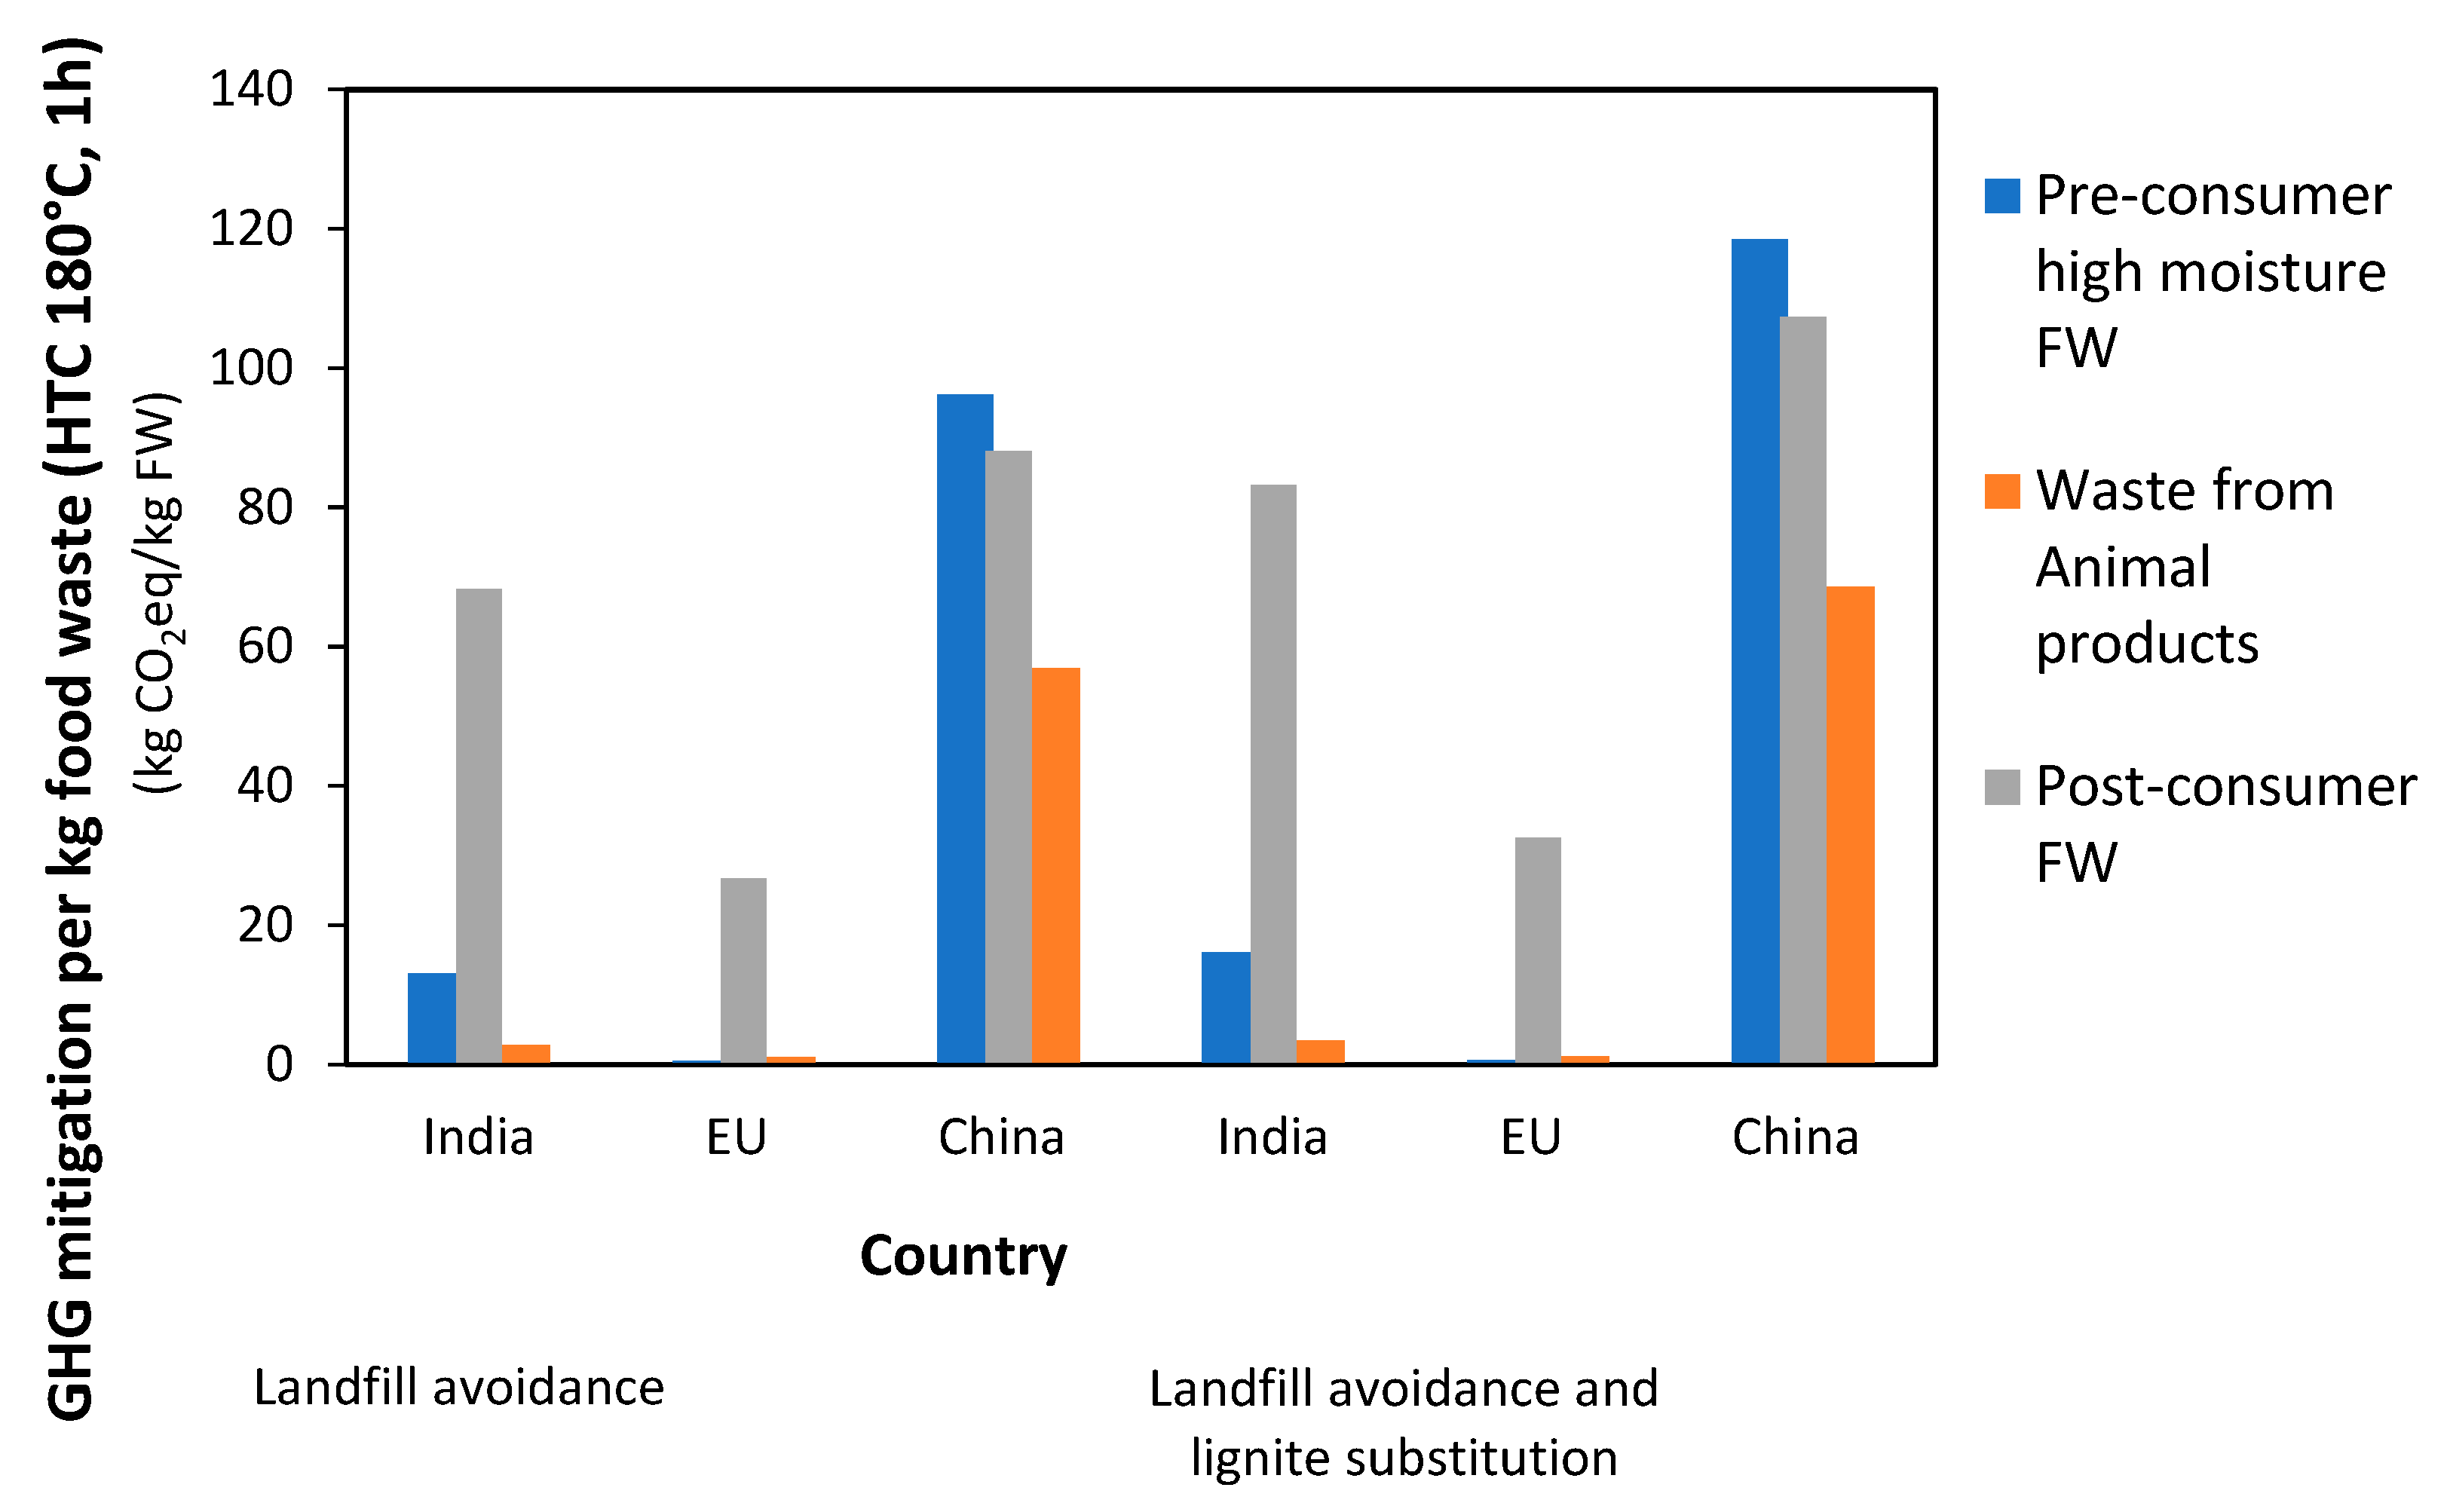
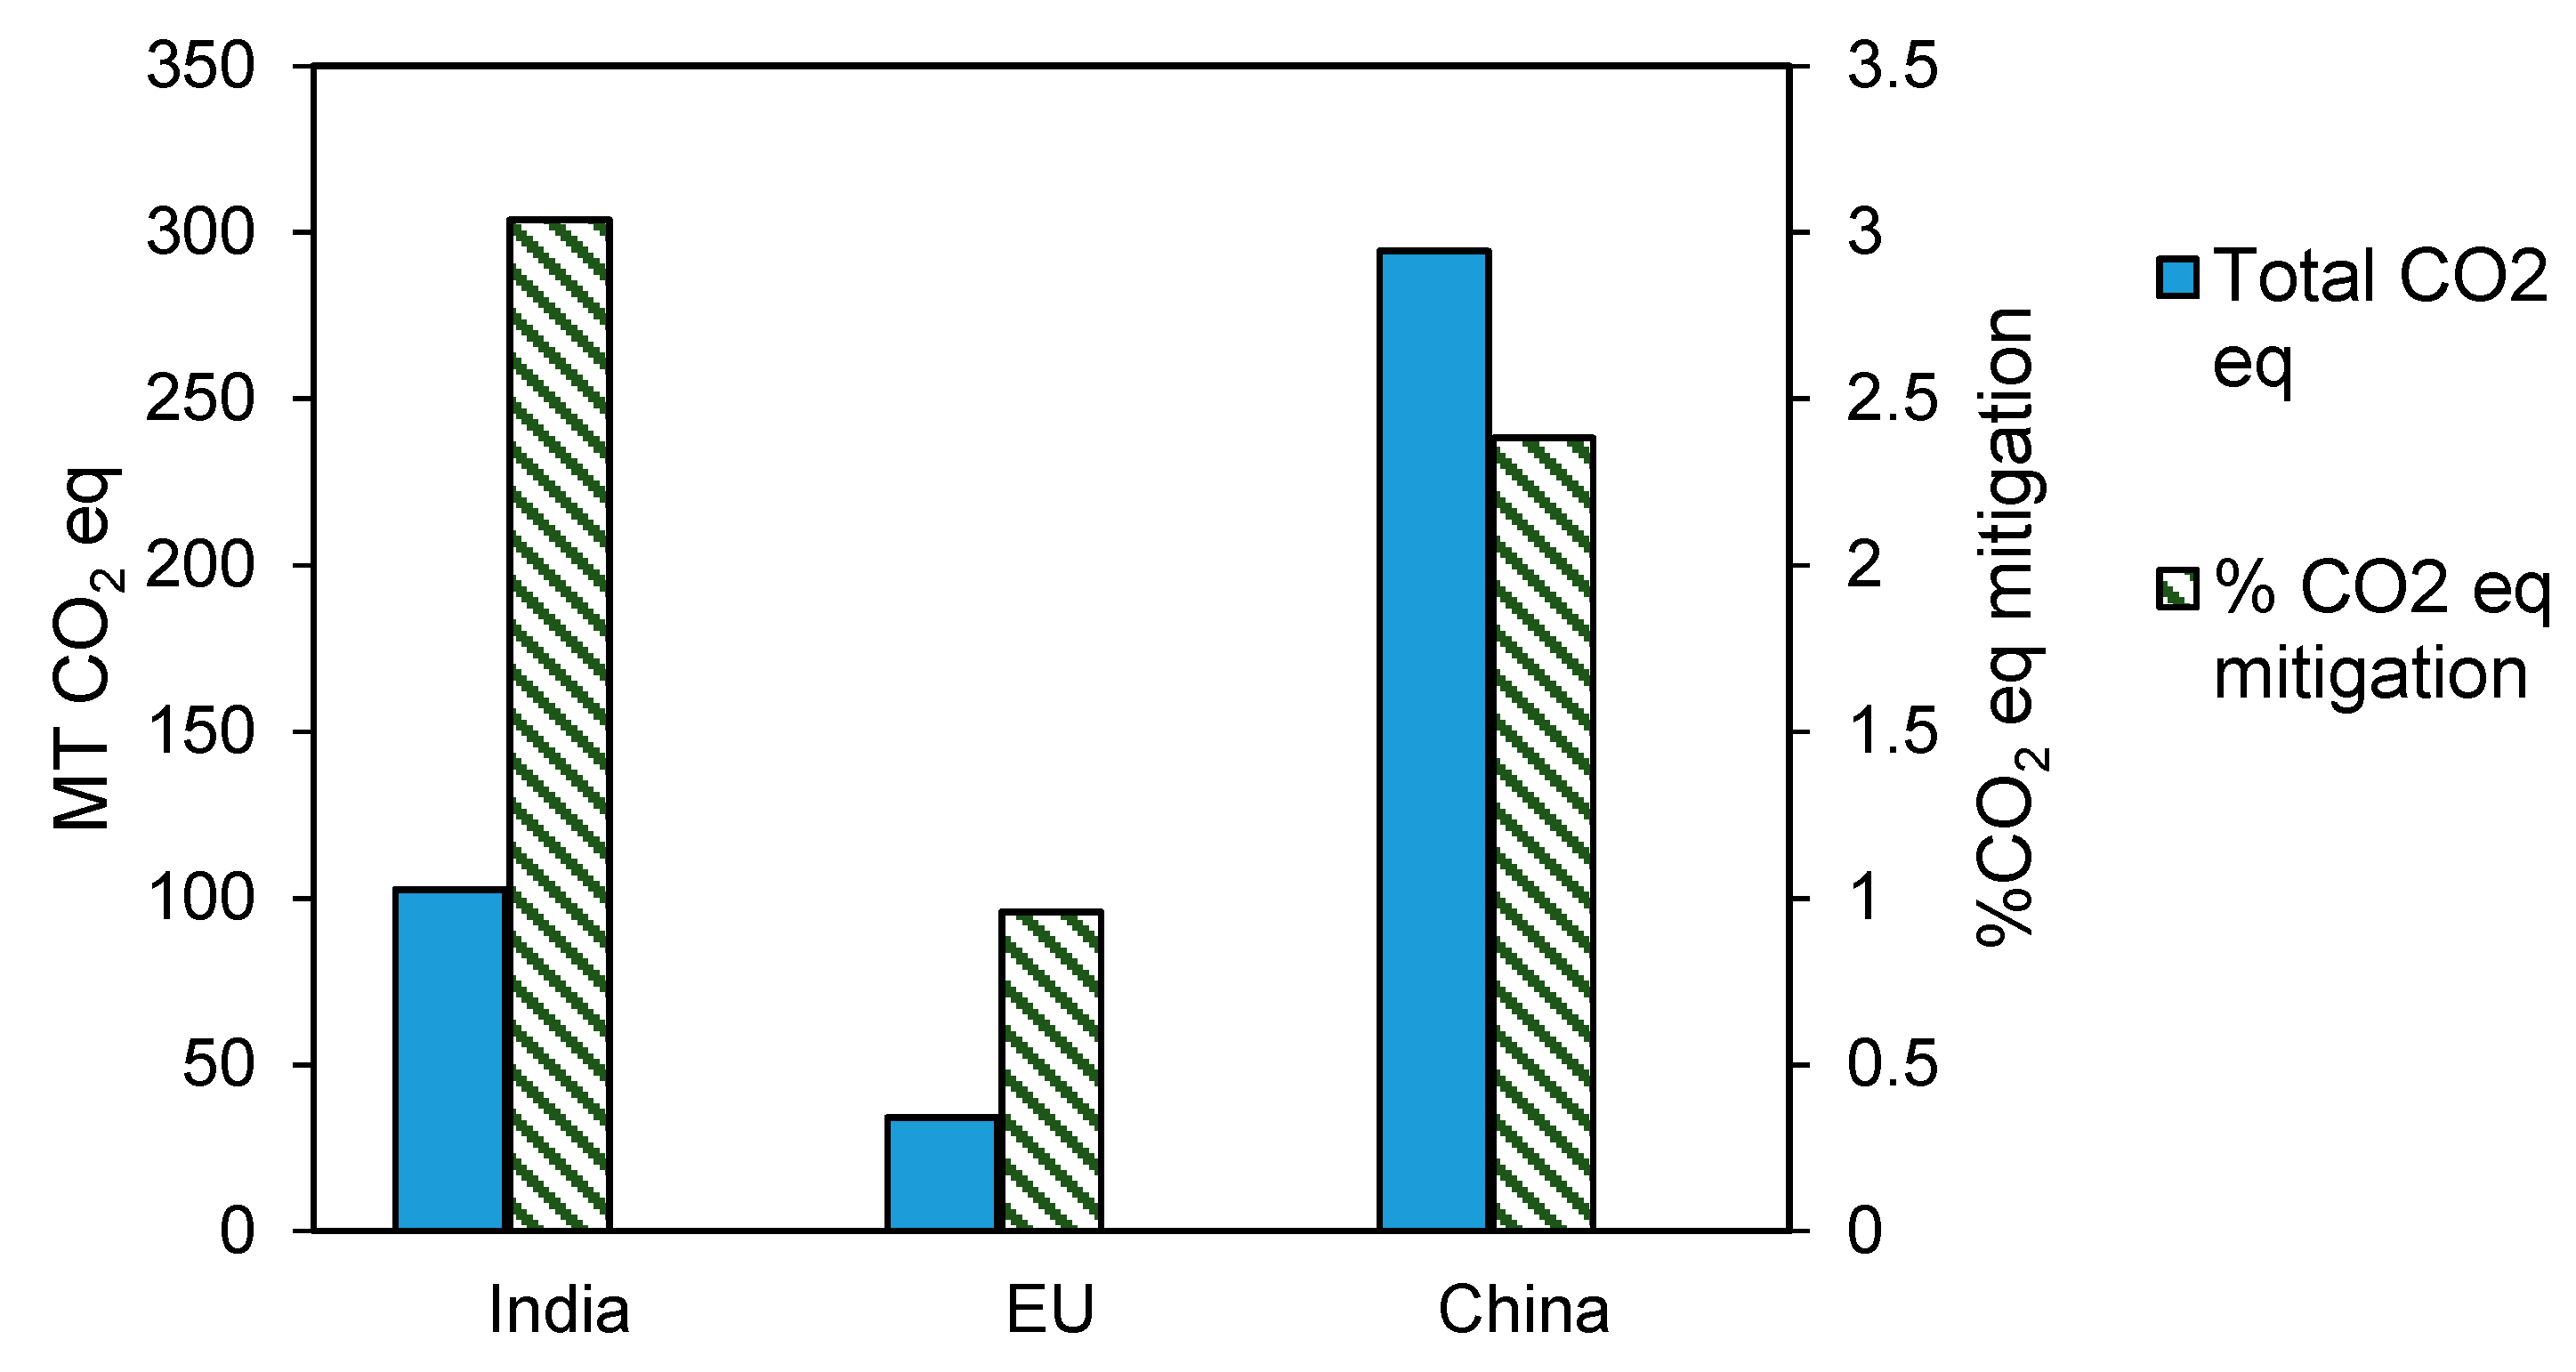
3.5. Comparison of Greenhouse Gas Mitigation Potential in India, the EU, and China

When comparing the GHG mitigation opportunities related to FW HTC in the different regions, there are considerable differences. Generally speaking, it is clear that China has considerably greater GHG mitigation opportunities concerning the scale of mitigation possible, as illustrated in Figure 4. FW HTC could mitigate almost three times more CO2 eq than India, and almost nine times more CO2 eq than the EU. In particular, China has considerably greater opportunities for GHG mitigation with HTC of currently landfilled pre-consumer FW than the other regions. This FW type makes up considerably more than half of the GHG mitigation opportunities in China but less than a fifth of Indian GHG mitigation opportunities and around a twentieth of EU GHG mitigation. Post-consumer FW makes up the vast majority of GHG mitigation opportunities in India, because it is the greatest source of FW in the country, and in the EU, because it has considerably higher landfilling rates than for pre-consumer FW. In addition, it is clear that landfill avoidance makes up the vast majority of GHG mitigation for all regions (around 82%).
Figure 5 compares the levels of GHG mitigation per quantity of FW in each region for the different FW types and indicates significant differences. Overall, India has the greatest average GHG mitigation opportunities of 1.22 kg CO2 eq per kg of FW, when compared to 0.68 kg CO2 kg eq per kg of FW for China, and only 0.45 kg eq per kg of FW for the EU (when considering landfill and lignite substitution with HTC at 180 °C for 1 h). Moreover, waste from animal products has a considerably greater GHG mitigation opportunity than the other FW types per kg of FW. This is because its lower moisture content would relate to higher methane generation if landfilled and thus greater GHG mitigation from landfill avoidance, as well as a higher energy input (HHV) and energy output after HTC, relating to a greater GHG mitigation from both grid energy and coal substitution. Levels of GHG mitigation per kg of FW are higher from post-consumer FW in the EU, however, due to higher landfilling rates. Conversely, high-moisture pre-consumer FW has the lowest GHG mitigation potential, as it has the highest moisture content of the FW types.

3.6. Levels of Potential Coal Substitution

Concerning coal substitution, quantities of hard coal and lignite, as well as the proportion of these types of coal that could be substituted in India, the EU, and China, were generated and are displayed in Table 6. When comparing hard coal and lignite substitution, generally speaking, it is clear that, in all regions, a greater quantity of lignite could be replaced. This is due to the fact that lignite has a lower calorific value of roughly 26.7 MJ/kg when compared to 29.3 MJ/kg for hard coal. This means that HC produced during FW HTC can replace around 9.7% more lignite than hard coal. In addition, as mentioned earlier, net energy gain is greatest using the process conditions of 180 °C for 1 h, with a slight drop off in net energy of 5.7% using 220 °C for 3 h. In addition, there is a significant drop off when using 250 °C for 6 h, with the net energy gain for these conditions being around 7.1 and 6.7 times lower than when processing at 180 °C for 1 h and 220 °C for 3 h, respectively, as reflected in the coal substitution results.
HTC of currently landfilled FW in India could generate enough HC to replace 5.3 MT of hard coal and 5.8 MT of lignite. This would equate to around 0.66%, and 12.38% of the hard coal and lignite use in the country, respectively, with the proportion being much higher for lignite, due to India using considerably less lignite than hard coal. As with the GHG mitigation scenarios, coal substitution figures are much higher for post-consumer FW, when compared to the other types of FW, due to the majority of suitable FW for HTC coming from post-consumer FW in the country.
In the EU, FW HTC could generate enough HC to replace almost 1.8 MT of hard coal and over 1.9 MT of lignite, around three times less than for India. This would equate to around 1.2% and 0.8% of the hard coal and lignite use among EU27 member nations, respectively, with the proportion being higher for hard coal, due to the EU using considerably more lignite than hard coal, as opposed to India. Due to the majority of suitable FW for HTC coming from post-consumer FW in the region, coal substitution figures are vastly higher for post-consumer FW, when compared to the other types of FW, because this FW type has a much higher landfilling rate than the other FW types.
In China, there could be sufficient HC generated to replace around 15.3 MT of hard coal and 16.6 MT of lignite. This would equate to around 0.5% and 7.1% of the hard coal and lignite use in the country, respectively, with the proportion being significantly higher for lignite, due to China using considerably less lignite than hard coal, as with India, but unlike the EU. As with the GHG mitigation scenarios, coal substitution figures are slightly higher for pre-consumer high-moisture FW, followed shortly by post-consumer FW and animal product pre-consumer FW, due to there being slightly more suitable FW for HTC coming from pre-consumer high-moisture FW in the country than other types. This is in contrast to both India and the EU, where the majority of landfilled FW and greatest coal substitution opportunities were from post-consumer FW.

3.7. Levels of Methane Avoidance

Concerning methane avoidance, figures on the total methane reductions and the proportion of the total anthropogenic methane that could be substituted in India, the EU, and China were generated and are displayed in Table 7.
Landfill avoidance associated with the HTC of currently landfilled FW in India could lead to the avoidance of around 3.34 MT of methane per year. This would equate to the avoidance of around 12.5% of anthropogenic methane in the country. As with the GHG mitigation and coal substitution scenarios, the methane avoidance potential for post-consumer FW is much greater than for the other FW types, contributing to around 81% of the total methane avoidance due to the majority of suitable FW for HTC coming from post-consumer FW in the country.
In the EU, HTC of landfilled FW could lead to the avoidance of around 1.12 MT of methane per year, three times lower than for India. This would equate to the avoidance of around 7.2% of anthropogenic methane emissions in the EU27 member nations, a proportion around 1.7 times less than for India. As with the GHG mitigation and coal substitution scenarios, the methane avoidance potential for post-consumer FW is vastly greater than for the other FW types, contributing to almost 95% of the total methane avoidance because the majority of suitable FW for HTC comes from post-consumer FW in the region, due to this FW type having a much higher landfilling rate than the other FW types.
In China, around 9.6 MT of methane could be avoided annually, almost 8.6 and 2.9 times higher than for the EU and India, respectively. This would equate to around 19.3% of anthropogenic methane emissions in China, a proportion around 2.7 and 1.5 times greater than for the EU and India, respectively. As with the GHG mitigation and coal substitution scenarios, the methane avoidance potential for pre-consumer high-moisture FW is the greatest, followed shortly by post-consumer FW and animal product pre-consumer FW, contributing to around 39.9%, 36.5%, and 23.6% of methane avoidance, respectively. This was due to their being slightly more suitable FW for HTC coming from pre-consumer high-moisture FW in the county than other types. This is in contrast to both India and the EU, where the majority of landfilled FW, and thus greatest methane avoidance opportunities were from post-consumer FW.

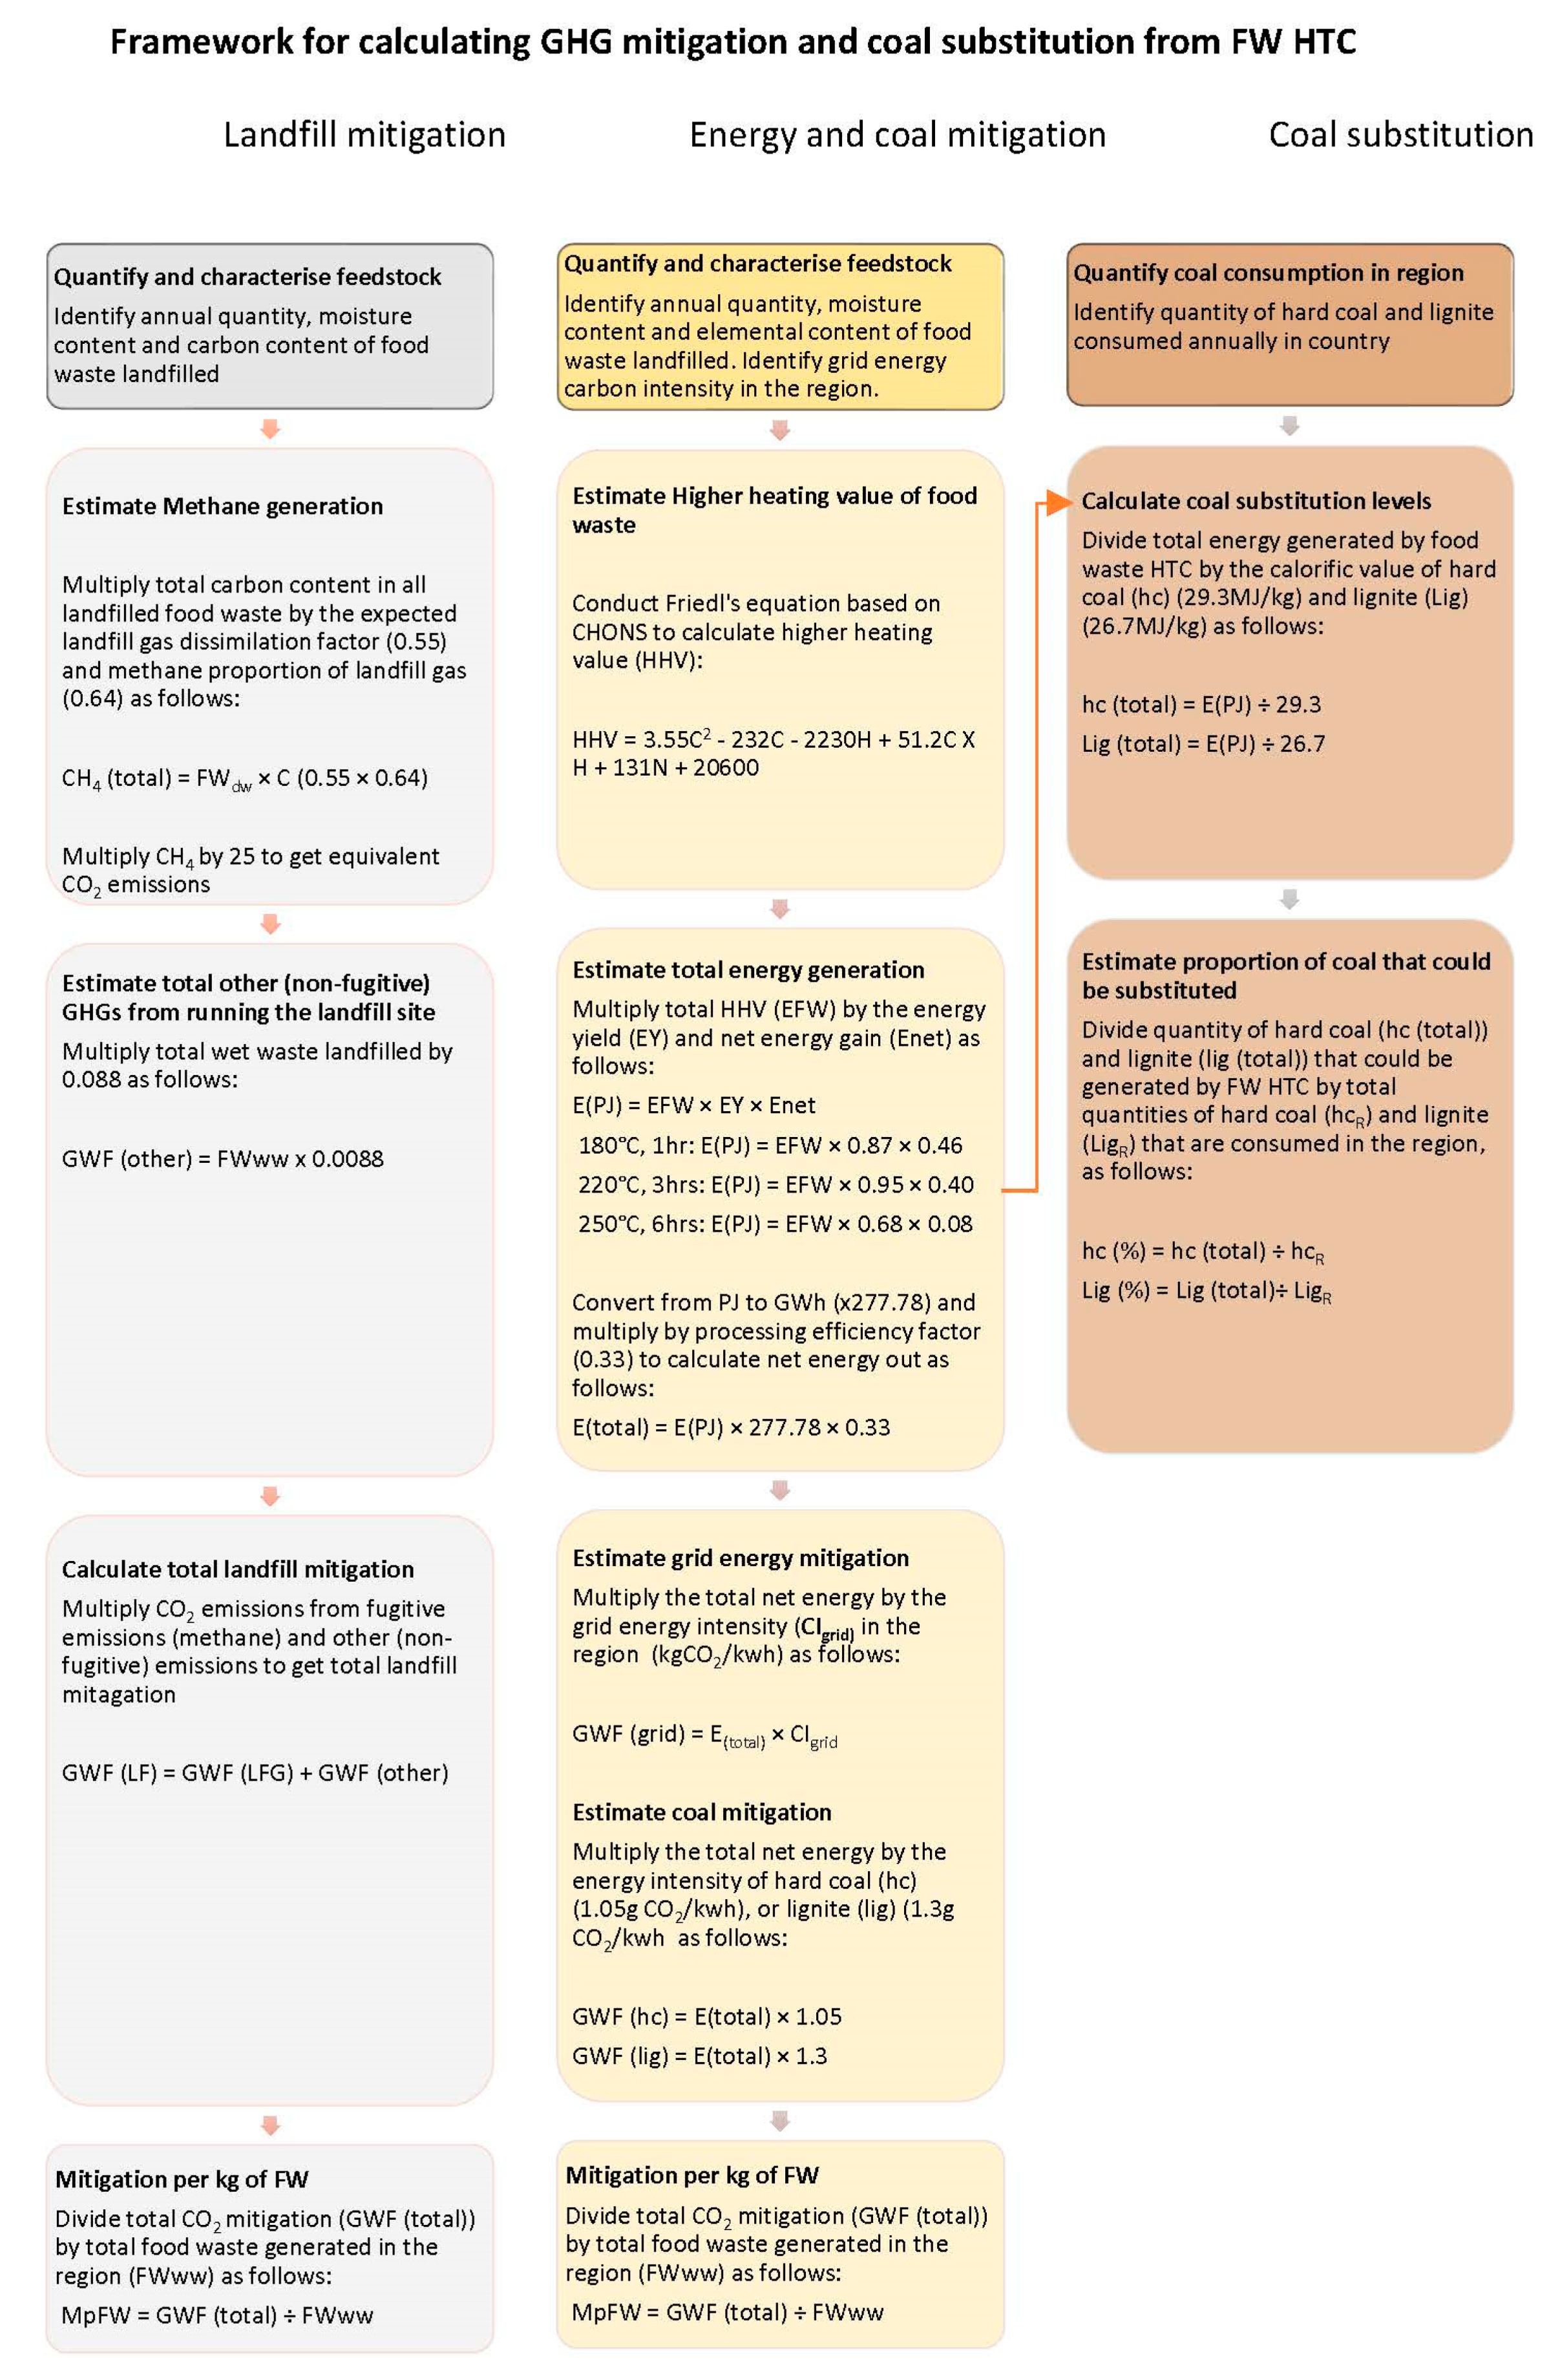
3.8. Framework for Calculating GHG Mitigation and Coal Substitution from FW HTC

A framework for using the methodology of this study to calculate the GHG mitigation and coal substitution potential from FW HTC (Figure 6) was created to illustrate how policymakers and fellow researchers could use the outcome of this study to make necessary assessments to identify opportunities for FW HTC in different regions. It details how landfill mitigation, energy and coal mitigation, as well as coal substitution assessments could be performed in different settings to assess the environmental credentials of FW HTC. The steps are shown in descending order detailing the actions that should be carried out, with another arrow showing how the energy and coal mitigation assessment feeds into to the coal substitution assessment.

4. Impact on Future Policy Implications

4.1. India

4.1.1. Current Trends in Food Waste Generation and Treatment in India

FW is believed to be increasing rapidly in India. While it is difficult to calculate the rate of increase for FW specifically, due to lack of monitoring, MSW is increasing at a current rate of 5% per annum [66], and it is believed that FW may be increasing also [67]. This is coinciding with an increase in the country’s population, alongside rapid urbanisation [68]. Increasing levels of MSW and related FW is resulting in increased GHG emissions, with methane emissions from landfills more than doubling from 404 Gg in 1999–2000 to 1084 Gg in 2015 [47].
Improvements in FW treatment are being witnessed in India, with regards to the amount of organic waste that is collected, processed, and treated. When MSW is sorted and the organic fraction (containing FW) is separated, this waste is typically composted, anaerobically digested, made into refuse derived fuel, or incinerated; however, vermi-composting is also established in India [67,69].

4.1.2. Food Waste Policy in India

Policy drivers in India are resulting in improvements in FW collection and treatment. Concerning general countrywide policy, India’s MSW Rules (MSWR) (Management & Handling (M&H), 2000) were last updated in 2016 [69]. The National Government has set goals for India to have 100% door-to-door collection of MSW, with source segregation of waste (including organics). They have also targeted the treatment and scientific disposal of all MSW, with a drive to reduce the proportion of organic waste that is landfilled, and increase the use of more sustainable treatments such as clean renewable energy generation through technologies such as HTC. India is looking to encourage public private partnerships (PPP) in developing integrated waste treatments, with a regional approach to waste management. The National Government plan is to promote public awareness campaigns and encourage community composting schemes [70].
On a state-based level, the government is looking to draft bylaws and legislation such as a landfill tax to discourage landfilling, in a similar way to that of the EU Landfill tax (a tax to reduce landfilling of waste that will be discussed in the next section). Meanwhile, the national government has asked states to come up with incentives for by-products of sustainable organic waste technologies and has outlined that municipalities should quantify the levels of daily waste generated. Furthermore, they require States to develop effective sanitation policies and laws concerning waste production and management [70].
It seems inevitable, therefore, that FW generation, segregation, and collection is increasing in India and likely to continue in the future [71]. As a consequence, the availability of FW that requires treatment is likely to increase, and HTC could play a major role in improving FW management in India in the future [72].

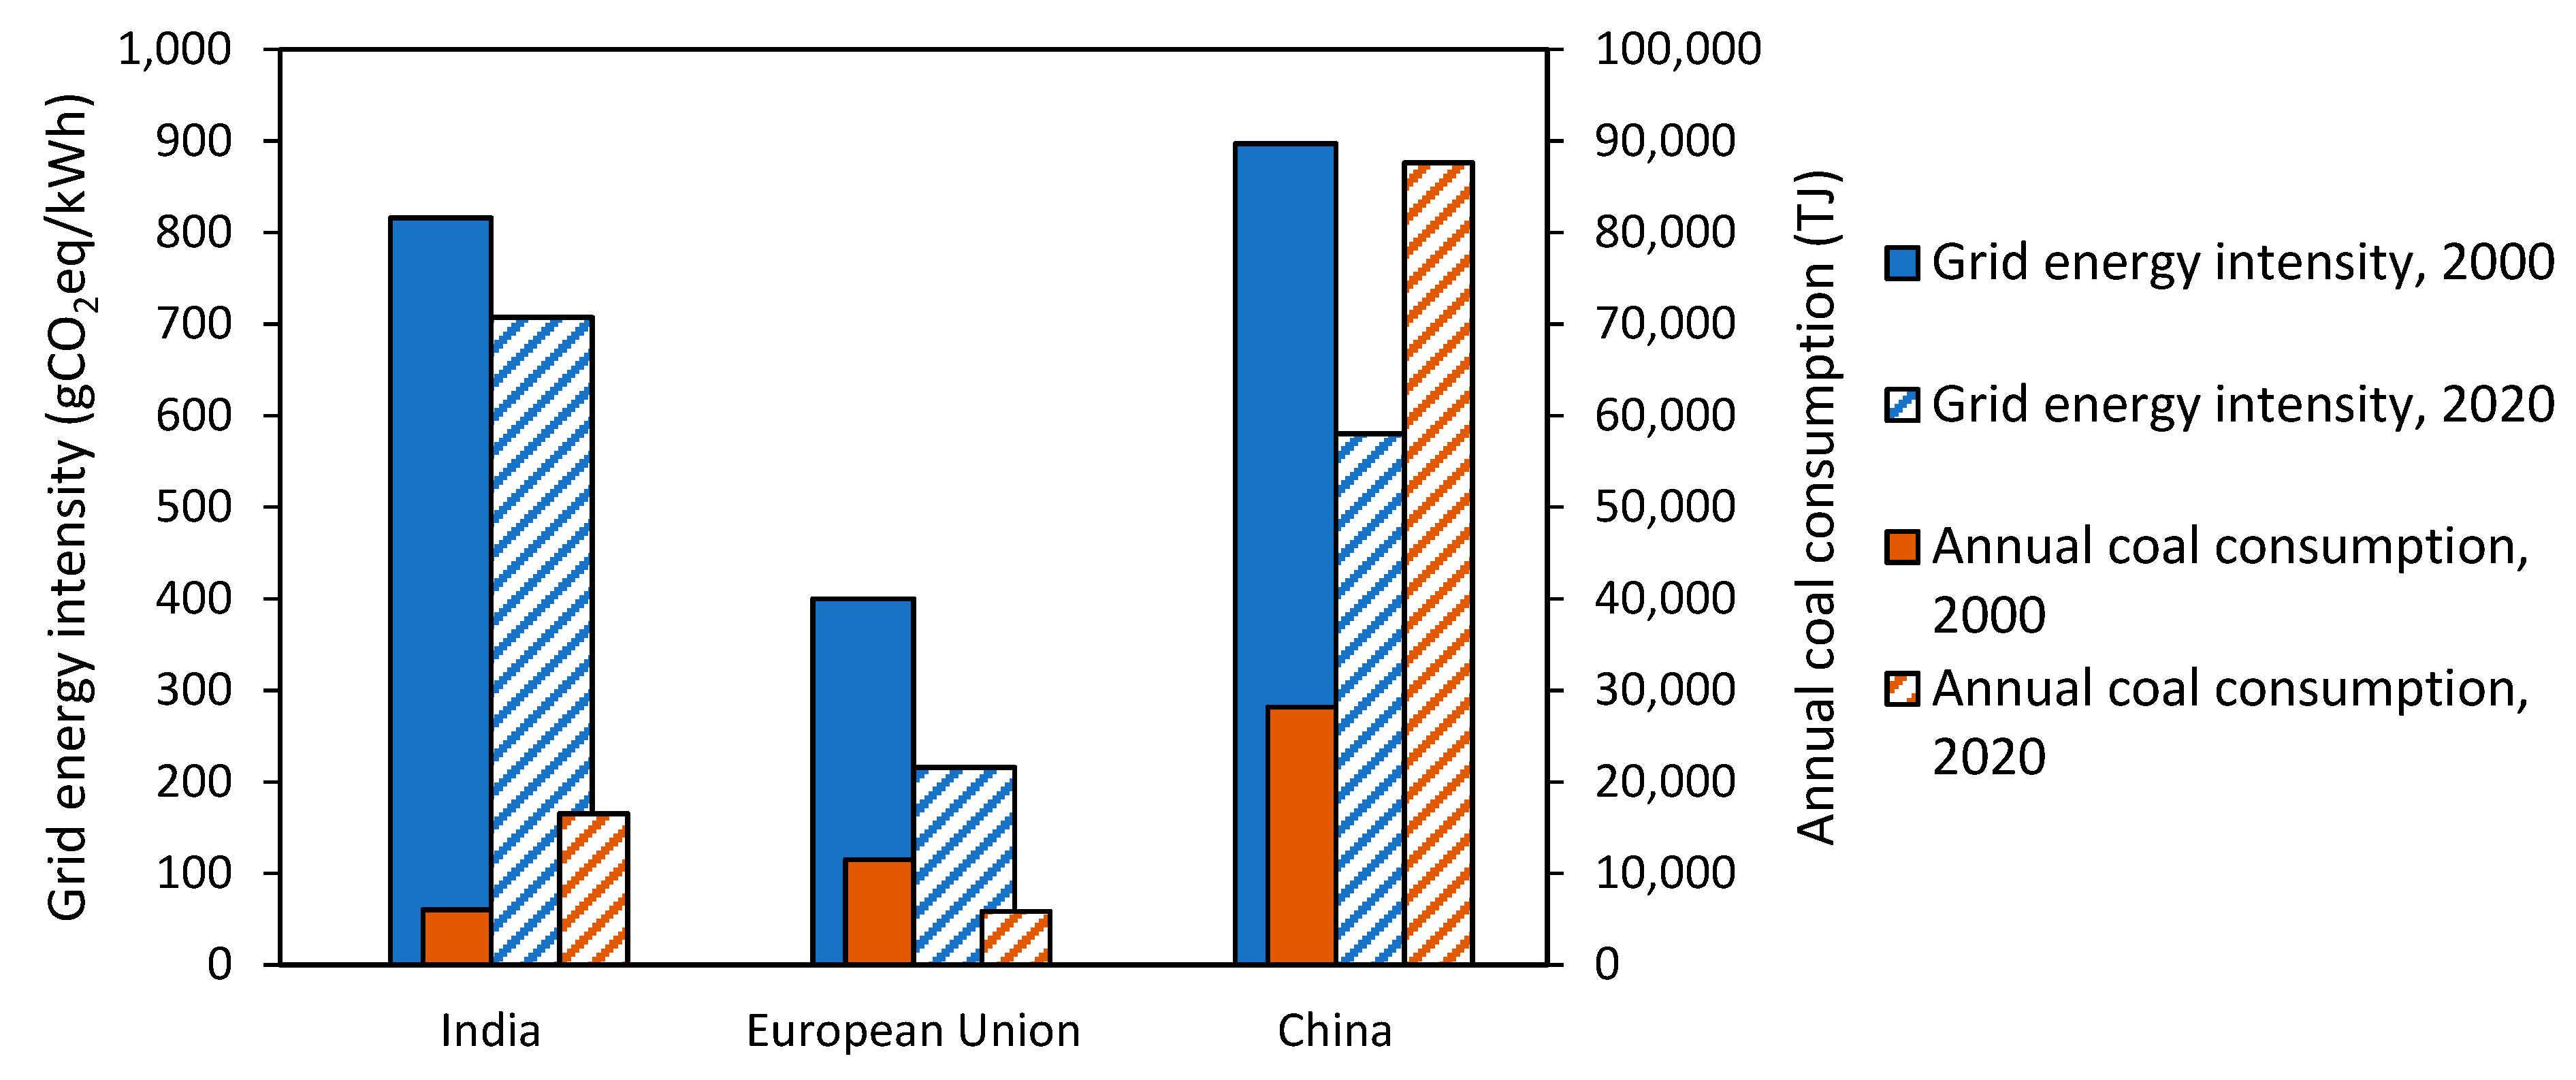
4.1.3. Current Trends in Energy Intensity and Coal Use

In India, grid intensity has reduced slightly over the last 20 years, while coal consumption has risen significantly over the same period, as illustrated in Figure 7. The grid energy intensity in India has reduced from 816.1 g CO2 eq/kWh in 2000 to 707.2 g CO2 eq/kWh in 2020, peaking in 2012. This equates to 5.445 g CO2 eq/kWh annual reduction over the period, and a 15.4% total reduction [56]. Coal consumption and annual coal use has increased in India from 6041 TJ in 2000 to 16,531 TJ in 2020, with an annual increase of 524.5 TJ and a 2.7-fold total increase [73].
India has set a target to reach net zero CO2 eq emissions by 2070, with the decarbonisation of its energy sector being a key part of this [74]. India has set out to decrease the carbon intensity of energy by 33% by 2030, compared to 2005 levels. Additionally, India has committed to generate 40% of its power from non-fossil technologies by 2030. The country is targeting increase in energy efficiency, use of clean fuel and support for the adoption of renewable energy as part of its strategy to meet these targets [75]; thus, the adoption of HTC of currently landfilled FW would very much be aligned to these policies. It is also clear that there will be vast quantities of coal, and highly carbon intensive energy to substitute into the future, based on current trends; thus, the adoption of FW HTC could bring about clear and prolonged benefits.

4.2. EU

4.2.1. Current Trends in Food Waste Generation and Treatment in the EU

FW levels in the EU have remained relatively steady [24]. FW in the EU alone is calculated to contribute to the equivalent of 170 million tonnes of CO2 being released into the atmosphere, almost 2 tonnes of CO2 equivalent per tonne of FW [76].
In the EU, there have been significant improvements recently in how it manages the FW it generates. Landfilling and other unsustainable disposal processes for MSW have reduced from 40% in 2008 to 24% in 2017. This has coincided with significant increases in energy recovery of organic waste, while composting and AD is becoming increasingly common in the EU [52]. The amount of organic waste (primarily FW) that is recycled through composting and AD in the EU (EU-27 and UK) has increased from 48 kg per person annually in 2000 to 83 kg in 2018 [77]. Additionally, the majority of segregated FW is treated using sustainable technologies, with most of the total FW generated avoiding landfilling. It shows that over 90% of pre-consumer FW is treated sustainably through recycling or energy recovery. This figure drops to around 64% for post-consumer FW but still remains significantly higher when compared to India.
FW segregation and collection is increasing in the EU as a whole; however, there is a large variation in the segregation levels and treatment methods of the different member states. There is a growing availability of feedstock in the EU, and HTC could play a significant role in FW management in the future. It seems clear that the majority of the pre-consumption FW in the EU is already being treated in a sustainable manner; nonetheless, there are opportunities for improvements regarding the treatment of post-consumption FW [78].

4.2.2. Food Waste Policy in the EU

Policy drivers in the EU are resulting in improvements in FW management in the EU. Perhaps the most significant development regarding FW management policy in the EU was the Landfill Directive, introduced in 1999, which aimed to divert organic waste from landfills, vastly reducing the amount of fugitive methane generated from landfilled waste. The directive did not specify what treatment technology should replace landfilling, however, meaning many countries switched primarily to incineration for unsegregated MSW. Nonetheless, AD and composting have become prominent for segregated FW. In addition, waste management was considered as a top priority in the EU’s Sixth Environment Action Programme (2002–2013), leading to the revision of the EU waste framework directive. The EU Waste Framework Directive was subsequently revised in 2008. It set out a strategy for the separation, collection, and treatment of waste for all member states. EU countries were encouraged to conduct separate collection of organic waste, treat organic waste in an environmentally sustainable manner, and use environmentally safe materials produced from organic waste. The Directive requires the participating countries to recycle 50% of their MSW by 2020, with the level increasing to 70% by 2030. Increased separation of organic wastes from MSW provides an additional opportunity for HTC [78].
FW reduction is another key strategy that EU policy is targeting. There have been a number of EU policies aimed at reducing the levels of FW, through prevention and redistribution, as instigated as part of the “Thematic Strategy on Waste Prevention and Recycling” within the revised EU Waste Framework Directive. More than a hundred national projects have been set up to increase FW awareness and offer education and technology to reduce FW [78]. Furthermore, in alignment with the Sustainable Development Goal 12.3, the EU is committed to halve per capita post-consumer FW, in addition to reducing pre-consumer FW [79]. Efforts to minimise FW generation in the region may, therefore, also threaten the availability of feedstock for HTC over time [78].
It seems clear, therefore, that, unlike with India, a large proportion of FW is already being treated in a sustainable manner in the EU, with comparatively very low proportions of FW being landfilled. In addition, FW generation may well decrease in the future, due to numerous policies tackling FW reduction, as opposed to India [71]. This means that, when considering FW availability as a feedstock, opportunities to reduce GHG emissions are already much more limited than with India, as the greatest mitigation proportion is with landfill avoidance and will likely become even more limited in the future with yet more improvements in FW treatment and potential reductions in FW levels [8].

4.2.3. Current Trends in Energy Intensity and Coal Use

In the EU, grid intensity and coal use has reduced significantly over the last 20 years, as shown in Figure 7. EU grid energy intensity has reduced from 400.2 g CO2 eq/kWh in 2000 to 215.7 g CO2 eq/kWh in 2020. This equates to 9.225 g CO2 eq/kWh annual reduction over the period, and an 85.6% total reduction, a total reduction 5.6 times greater than for India [55]. Annual coal consumption has decreased in the EU from 11,502 TJ in 2000 to 5841 TJ in 2020, with an annual decrease of 283.1 TJ, and a total reduction of around 51%, in contrast to rapidly increasing coal use in India [73]. In addition, the EU has targeted a 70% reduction in coal usage, including a near-total phase out of coal in energy generation by 2030, when compared to 2015 levels [80].
The EU has set a target to reach net zero CO2 eq emissions by 2050, with energy decarbonisation being a key part of this [81]. India has set out to decrease the carbon intensity of its energy by 40% by 2030, when compared to 1990 levels. As with India, the EU is targeting increases in energy efficiency, use of clean fuel and providing support for the adoption of renewable energy as part of its strategy to meet these targets [75]; thus, as with India, the adoption of HTC of currently landfilled FW would very much be aligned to these policies. That said, due to the rapid reductions in coal consumption and a rapid decarbonisation of an already relatively low-carbon energy mix, the benefits related to FW HTC in the EU will likely decrease in the future, based on current trends. Consequently, the adoption of FW HTC could bring about considerably more limited and short-lived benefits in the EU than India.

4.2.4. Contrast among EU Countries

Although the EU altogether tends to have better FW management approaches, lower coal usages, and lower carbon energy sources than India and China, the different countries have considerable variation concerning their FW and energy landscapes. Table 8 shows how there are a number of countries in particular that have notably higher consumption of hard coal and brown coal, higher carbon grid energy, higher FW generation rates, lower FW collection rates, and higher landfilling rates, meaning that, in these regards, they are more similar to India and China than the EU.
Poland and Germany are the main coal-consuming countries. Poland consumes the largest proportion of hard coal in the EU (43%) followed by Germany (22%), while for lignite use, Germany consumes the largest proportion (44%), followed by Poland (19%). Altogether, the two countries consume over 60% of both hard coal (65%) and lignite (63%), despite there being 27 countries in the EU, as many member nations have mostly, or fully, phased out coal [82]. In recent years, policies in Germany have shifted towards phasing out coal [83], leading to decreasing coal usage [52], while Poland has to some extent retained policy support for its coal industry [83], meaning that the country has not shown the same reduction in coal consumption as Germany has [52].
Table 8. FW HTC opportunities in different EU countries.
CountryEU AveragePolandGermanyCzechiaRomaniaEstoniaSourceYear
Hard coal use (% of EU total)3.743223minimalminimal[77]2019
Brown coal use (% of EU total)3.71944126minimal[77]2019
Grid intensity (g CO2/kWh)287789406445291900[84]2018
FW generation (kg/capita)116.711294.493.7127.7111.8[85]2017
FW collection (%)165271033[85]2017
Landfilling (%)23.541.770.8876.8371.0519.92[86]2017
Green implies better than EU average, light red implies worse than EU average, dark red implies worst country for the specific category.
Estonia has the highest carbon intensity associated with its energy generation of 900 g CO2 eq/kWh, more than three times the EU average, and 111 g CO2 eq/kWh higher than Poland (789 g CO2 eq/kWh), the country with the next highest carbon intensity. Czechia (445 g CO2 eq/kWh) and Germany (406 g CO2 eq/kWh) have considerably lower carbon-intensive grid energy than Poland (344 and 383 g CO2 eq/kWh, respectively), but still over the EU average (158 and 119 g CO2 eq/kWh higher, respectively). Conversely, Romania (291 g CO2 eq/kWh) has roughly the same grid intensity as the EU average.
Concerning FW generation, Romania generates the greatest amount of FW per capita (127.7 kg/capita) and is the only listed country to generate per capita FW levels that are higher than the EU average (11 kg/capita higher than 116 kg/capita). Poland (112 kg/capita) and Estonia (111.8 kg/capita) generate similar per capita FW levels to the EU average (4.7 and 4.9 kg/capita, respectively), while Czechia (93.7 kg/capita) and Germany (94.4 kg/capita) generate notably lower levels of per capita FW than the EU average (23 and 22.3 kg/capita, respectively).
With regard to FW treatment, Romania and Estonia have the joint lowest FW collection rates (both 3% of total FW collected), notably lower than the EU average (13% lower than the EU average of 16%). Poland has the next lowest FW collection rates (5%), which is still considerably lower than the EU average (11% lower). Czechia has a slightly lower collection rate (10%) than the EU average, while Germany has significantly higher FW collection rates (27%) than the EU. FW collection rates are important indicators of how sustainable the countries’ FW treatment is, as specifically collected FW typically becomes composted, or anaerobically digested (low carbon treatment technologies), as opposed to FW that is not specifically collected which is mixed with MSW and is typically incinerated or landfilled [86]. MSW landfilling rates are also shown in Table 8, giving a rough indication of FW landfilling rates (as much of the FW not segregated in households ends up being mixed into MSW and treated together with this waste). It can be seen that Czechia and Romania have the highest landfilling rates (76.83% and 71.05%, respectively), notably higher than the EU average (23.5%), with both countries landfilling a proportion greater than three times that of the EU average. Poland also has above average landfilling rates (41.77%), while Estonia landfills a slightly lower proportion than the EU average (19.92%), and Germany landfills considerably less (0.88%), with a landfilling rate of almost 27 times lower than the EU average.
EU countries clearly have different FW and energy landscapes, meaning that they have differing levels of opportunities regarding the adoption of HTC of FW. Germany consumes large quantities of coal but generates less FW per capita and has considerably higher FW collection rates and lower landfilling rates than the EU average. Therefore, Germany does not present a particularly great opportunity for FW HTC, as most of its FW will already be treated sustainably, and there would be little GHG reduction from the adoption of HTC of FW. Estonia has the highest grid energy carbon intensity of all of the countries; however, it has relatively low total coal usage (in part due to it having a low population) and a relatively low landfilling rate, meaning it also does not have particularly large opportunities for GHG reduction from FW HTC. Romania and Czechia both have relatively low coal usage and grid intensities, but low FW collection and high landfilling rates, meaning that there would be a significant opportunity for GHG mitigation from HTC of FW, in particular through landfill avoidance. When assessing all criterion, it seems like Poland may have the greatest opportunity for GHG reduction through FW HTC, due to its high coal usage, high grid carbon intensity, low FW collection rates, and relatively high landfilling rates.
Although it is clear that currently there are numerous EU countries that have multiple aspects associated with the energy and FW landscapes that would make them more suitable for the adoption of FW HTC than the EU on average, this may not be the case in the future. The abovementioned EU policies on tackling FW reduction, decarbonising energy sources, and decreasing the landfilling of FW means that opportunities in each of these countries are likely to reduce in the future, as less FW is generated and landfilled [78], coal usage is phased out, and grid energy is decarbonised [80].

4.3. China

4.3.1. Current Trends in Food Waste Generation and Treatment in China

While there is some debate as to the quantities of FW generated in China, FW is believed to be increasing rapidly and is set to rise steadily into the future [31]. It is estimated that post-consumer FW will increase from 170 ± 30 MT in 2018 to 220 ± 42 MT in 2040, an increase of 29% over 22 years, or an annual increase of 2.3 MT per year from post-consumer FW alone [21,31]. Increasing levels of FW is resulting in increased GHG emissions from FW treatment. If no improvements in the way FW is treated are made, FW treatment related emissions will rise from 137 ± 26 MT CO2 eq in 2018 to 180 ± 30 MT CO2 eq 2040, an increase of 31% [31].
On the other hand, improvements in FW treatment are being developed in China, with the amount of FW being treated increasing. There are a number of cities and regions in China that have begun to segregate their FW, with FW being treated through sustainable technologies such as AD and composting. That said, the majority of FW in China is still landfilled or incinerated [32,87].

4.3.2. Food Waste Policy in China

Policy drivers in China are resulting in improvements in FW management in the country. China sets targets and objectives for the waste management sector every five-years [87]. The 12th five-year plan (2011–2015) set aside over 10 billion Yuan for the construction of 242 treatment facilities across 31 provinces to treat over 30,000 tons of FW. This included 100 pilot projects, primarily in developed cities in Eastern China developing the greatest treatment capacity in the country. AD was the main FW treatment technology implemented, with composting and animal feed also being adopted. Meanwhile, the 13th annual five-year plan (2016–2020) has set out over 18 billion Yuan, to add an additional FW treatment capacity of almost 35,000 tons per day, that will bring the total nationwide capacity up to almost 65,000 tons per day, almost doubling the amount of FW that can be treated in the country when compared to the end of 2015. Eastern China would have the highest FW treatment capacity with over 30,000 tons per day, whilst other regions would have a capacity of between 5000 and 15,000 tons per day. AD, other energy recovery technologies, and production of animal feed are the main treatment technologies being considered. Sorting of MSW particularly in households is another key component in the national strategy for improving FW treatment [88]. It is noted that there is a lack of mature policy support for FW recycling in China, poor implementation of laws, and regulations countrywide, alongside issues resulting from low technical expertise and low processing efficiency alongside high treatment costs that are limiting progress [89].
China also has a number of ongoing strategies designed to reduce the amount of FW produced in the country. High post-harvest losses of vegetables and grains have been noted in China, primarily due to poor storage. Numerous policies have been set up to reduce post-harvest losses, such as the ‘The Programme for Mid- and Long-term National Grain Security’. It was also noted that there was a significant amount of FW produced during extravagant banquets among government employees, as paid for by expenses. Efforts were made to reduce this stream of FW by limiting the size and extravagance of publicly funded meals, termed the ‘Eight Rules on Improving Style of Work and Enhancing Close Ties With the People’ [90]. Moreover, there has been a nationwide campaign to reduce FW in canteens through use of educational and prompt messaging, as well as social media posts, termed the ‘Clean Plate’ Campaign [91]. Both have noted positive results; however, issues specific to China such as particularly high proportions of meals being catered and a perceived need to over-order food as a way of showing respect to guests and displaying generosity present in the culture means that FW generation remains high in the catered sector [90].
It seems apparent, therefore, that FW generation, segregation, and collection are increasing in China, as with India, and is likely to continue in the future [87]. This means that, when considering FW availability as a feedstock, there are clearly significant emerging opportunities. Moreover, it is clear that China has the greatest quantities of landfilled FW of the three regions and thus the greatest current opportunities for FW HTC in the future. The ‘Clean Plate’ campaign may have the potential to drastically reduce FW in China however, as canteens currently make up a large proportion of the national FW [91]. This may, in turn, lead to an eventual reduction in potential HTC feedstock and could limit the potential for FW HTC, as is likely with EU FW reduction campaigns and policies. Overall, however, it is clear that HTC could play a very significant role in improving FW management in China currently and in the future.

4.3.3. Current Trends in Energy Intensity and Coal Use

In China, grid intensity has reduced substantially over the last 20 years; however, coal consumption has risen significantly, as shown in Figure 7. Chinese grid energy intensity has reduced from 897.1 g CO2 eq/kWh in 2000 to 580 g CO2 eq/kWh in 2020. This equates to a 15.85 g CO2 eq/kWh annual reduction over the period, and a 35.3% total reduction, a greater annual reduction than both India and the EU, and a greater percentage reduction than India, but a lower percentage reduction than the EU [55]. Concerning coal consumption, annual coal use has increased in China from 28,167 TJ in 2000 to 87,638 TJ in 2020, with an annual increase of 2973 TJ, and a 3.1-fold total increase, a proportional increase slightly higher than that of India (2.7-fold), but a 5.7 times greater annual increase when compared to India [50]. This is in significant contrast to the EU, which has decreased its coal use significantly in recent years.
Regarding expected future changes, China has set a target to reach net zero CO2 eq emissions by 2060, with energy decarbonisation a key part of this [92]. China has set out to decrease the carbon intensity of energy by 60% by 2030, when compared to 2005 levels. China has also targeted non-fossil energy to make up 20% of primary energy by 2030. As with India and the EU, China is targeting increases in energy efficiency, use of clean fuel, and support for the adoption of renewable energy as part of its strategy to meet these targets [75]; thus, as with India and the EU, the adoption of HTC of currently landfilled FW would very much be aligned to these policies. It is also clear that there will be vast quantities of coal, in contrast to the EU, and a decarbonising, but a relatively carbon-intense grid energy mix to substitute into the future, based on current trends; thus, the adoption of FW HTC could bring about clear and prolonged benefits, as with India.

5. Practical Considerations for Hydrochar Replacing Coal

While the theoretical benefits from the HTC of currently landfilled FW in the form of GHG reduction are clear to see, it is important to also consider the practical implications of using HC to substitute FW, as well as looking at the wider benefits of HTC on climate change mitigation in the studied countries.
Concerning practical issues related to replacing coal with HC, it is important to consider differences in the energy density between HC and coal. HC differs depending on the process conditions that are used during HTC. Table 9 shows the energy densities resultant from HTC, at the different process conditions used in this paper, for FW [93,94,95] and the biodegradable component of MSW [60]. It can be observed that longer HTC residence times and higher processing temperatures result in more energy dense HCs. Different studies found that FW processed at 180 °C for 1 h tends to have a relatively low energy density of between 17.4 and 19.61 MJ/kg. In comparison, lignite (26.7 MJ/kg) and hard coal (29.3 MJ/kg) are significantly more energy-dense than FW processed at 180 °C for 1 h (9.3–7.09 and 11.9–9.69 MJ/kg, respectively). FW processed at 220 °C for 3 h tends to have a higher energy density of between 22.2 and 23.75 MJ/kg, which is still lower than lignite (4.5–2.95 MJ/kg lower) and hard coal (7.1–5.55 MJ/kg) but significantly closer than for HTC at 180 °C for 1 h, especially if it is replacing lignite. FW that is processed at 250 °C for 6 h produces considerably more energy dense HC of 25.6–32.3 MJ/kg ranging from just under the energy density of lignite (1.1 MJ/kg lower) to over the energy density of hard coal (2.9 MJ/kg higher). It is clear that HC produced by HTC at higher temperatures and residence time (250 °C for 6 h) is the best quality concerning energy density and would therefore likely be the most suitable for substituting coal, especially hard coal. Conversely, it is clear that the HC produced from HTC at the lowest temperature and residence time (180 °C for 1 h) is the lowest quality concerning energy density and would, therefore, likely be the least suitable for substituting coal, especially hard coal. That said, and as discussed in Section 3, the FW processed at 180 °C for 1 h has the highest net energy gain, while FW processed at 250 °C for 6 h has a particularly low net energy gain and much lower GHG mitigation potential. As processing FW at 220 °C for 3 h produces HC that has an energy density 4.47 MJ/kg higher on average than when processing at 180 °C for 1 h, and only a 5.7% lower net energy gain, these conditions may be the best option when considering both GHG mitigation and fuel handling properties. If this HC was to substitute lignite, there would be a less significant difference in energy density when compared to hard coal, while there would be the enhanced benefit related to lignite being a more carbon intense fuel; thus, its substitution would relate to enhanced GHG mitigation, as well as fewer fuel-related technical issues.
Other issues related to HC when compared to coal include bulk density and handling issues. HC from FW typically has a lower bulk density as well as lower energy density, meaning that the HC has a larger volume to mass ratio when compared to coal. Further to this, when stored for long time-periods, HC may can have some storage issues effecting structural integrity and natural expansion. Combining FW with lignocellulosic wastes, such as the agricultural residues mentioned in Section 1, can improve fuel quality by increasing its energy density and bulk density, reducing natural expansion, and thus decreasing the likelihood of fuel degradation [58]. Vast quantities of lignocellulosic wastes are generated in India, China, and the EU, from agricultural residues, to low-moisture pre-consumer FW, as shown in Table 1, as well as garden waste and non-FW organics within MSW [16,19,30,67,88]. Co-processing FW with these wastes could lead to improved fuel qualities, as well as increasing the amount of HC that is possible to produce and using other under-utilised feedstock sources. Additionally, in India in particular but also China, much of the MSW is unsegregated. It would be possible to utilise the organic fraction of MSW to generate vast quantities of high quality fuel through HTC, where it may not be a pure enough feedstock for other technologies such as AD or composting, generating energy much cleaner and efficiently than just incinerating the waste [48]. Co-combustion of HC with coal to replace lignite could further reduce fuel related issues due to a reduction in the net energy and mass density, as well as combustion behaviour, making the integration of HC as a fuel source in existing coal-fired power plants easier for existing infrastructure to process [96]. Overall, although there would be potential technical issues associated with HC replacing coal, to a large extent these issues could be resolved through implementing the suggested mitigations. Therefore, HTC of FW, as well as other available organic wastes, could bring about significant benefits concerning clean energy and SDG 7, as well as sustainable production and consumption of a low carbon coal alternative and SDG 12 [9].

6. Potential of Food Waste Hydrothermal Carbonisation in Greater Decarbonisation

When considering the greater scope for FW HTC to contribute towards the decarbonisation of India, the EU, and China, it is worth assessing the proportion of regional GHG emissions HTC of currently landfilled FW could mitigate in order to identify the scale of role it could play in general climate change mitigation. Total CO2 eq emissions for India, the EU, and China between 1970 to 2018 have been compiled by The World Bank [97], showing notable changes over this period. Indian CO2 eq emissions have been rising steadily, almost doubling from 1.72 GT CO2 eq in 2000 to 3.37 GT CO2 eq in 2018. Total CO2 eq reductions (MT) and proportions of total GHG emissions that could be mitigated in India, the EU, and China, if all currently landfilled FW was processed through HTC at 180 °C for 1 h with the HC replacing lignite, are displayed in Figure 8. At year 2018 levels, over 3% of total national emissions could be avoided through FW HTC at 180 °C for 1 h or processing using 220 °C for 3 h for improved HC fuel quality. Conversely, EU CO2 eq emissions have been reducing gradually, from 4.21 GT CO2 eq in 2000 to 3.57 GT CO2 eq in 2018. At 2018 levels, almost 1% of total EU emissions could be avoided if all FW currently landfilled in the EU was processed through HTC at 180 °C for 1 h with the HC replacing lignite or processing using 220 °C for 3 h for improved HC fuel quality. This is a proportion more than three times lower than that of India, as the regions have similar total CO2 eq emissions, but India has a significantly higher mitigation potential due to increased landfilling rates. Chinese CO2 eq emissions have been rising rapidly, increasing 2.7-fold from 4.60 GT CO2 eq in 2000 to 12.36 GT CO2 eq in 2018, despite a more gradual increase in recent years. At 2018 levels, almost 2.4% of total national emissions could be avoided through FW HTC at 180 °C for 1 h with the HC replacing lignite, or if processing using 220 °C for 3 h for improved HC fuel quality. This is a 27% lower proportion of total CO2 eq emissions when compared to India but almost 2.5 times higher than for the EU. All in all, if all currently landfilled FW was processed through HTC at 180 °C for 1 h with the HC replacing lignite for India, the EU, and China, 430.92 MT CO2 eq could be mitigated annually, or more than 0.9% of the 45.87 GT CO2 eq global emissions could be avoided, from these countries alone [97]. This could be increased yet further through co-processing the FW with other abundant organic wastes, especially lignocellulosic wastes such as agricultural residues that could improve HC fuel qualities [15,18,29]. It is clear therefore that HTC of FW and other available organic wastes could bring about significant climate action in line with SDG 13 [9].
While there is a lack of literature quantifying the GHG mitigation levels from HTC of currently landfilled FW, Lu et al. [98] found that landfilling FW resulted in around 0.6 kg of CO2 eq per kg of FW landfilled (on a wet waste, as received basis), while HTC could generate around 11.94 MJ of energy for every kg of FW treated (on a wet waste as received basis). The study subsequently highlighted that diverting currently landfilled FW to HTC would present a particularly great opportunity for GHG mitigation. Additionally, Li et al. [99] and Gupta et al. [48] found HTC generated energy more efficiently and led to greater GHG mitigation when compared to incineration when processing FW, while Reiβmann et al. [100] found HTC performed better than pyrolysis of FW. Moreover, Gupta et al. [48] and Lu et al. [98]. found HTC to perform better than AD and composting when concerning GHG mitigation potential. These studies indicate that FW HTC could bring greater levels of GHG mitigation than if currently landfilled FW were to be diverted towards other, more established FW treatment technologies like those mentioned. Furthermore, Sharma and Dubey [58] highlighted the scale of coal replacement and associated GHG mitigation that would be possible from HTC of organic waste, estimating that 11% of global coal could be substituted by the hydrothermal carbonisation of all organic waste worldwide.

7. Conclusions

In conclusion, this research set out to explore the benefits and limitations associated with HTC of currently landfilled FW in India, the EU, and China, and, in doing so, has added to the literature to increase our understanding of the opportunities and limitations associated with FW HTC.
The CO2 eq mitigation potential associated with the HTC of all currently landfilled FW in India, the EU and China for different high-moisture FW types, for landfill avoidance and grid energy as well as lignite and hard coal substitution, has been quantified, as shown in Table 2, Table 3 and Table 4. China had the greatest total GHG mitigation potential, while India had the greatest GHG mitigation potential per quantity of FW treated. In addition, landfill and lignite substitution had the greatest mitigation potential when compared to hard coal and energy substitution, with landfill avoidance being the most significant area for GHG mitigation. Moreover, post-consumer FW has the greatest GHG mitigation potential for India and the EU, while pre-consumer high-moisture FW has the greatest mitigation potential in China. With this being said, FW figures and landfilling rates for India and China especially may not be fully accurate, due to a lack of formal recording of waste generation and treatment figures particularly in India, meaning that these figures may have some uncertainty associated with them, with an underestimation of Indian FW levels highly likely in particular [21]. Perhaps once FW generation levels, treatment, and measurement become more formalised throughout the countries, in particular India, this study could be replicated with updated FW quantities and landfilling rates so that more accurate figures could be gained on GHG mitigation potentials.
The impact of using different HTC processing conditions on GHG mitigation potentials has been measured. The findings clearly indicate that the processing of FW through HTC at 180 °C for 1 h leads to the greatest mitigation potential of the different process conditions, with a small 5.7% drop in net energy gain and related GHG mitigation from energy generation when moving to 220 °C for 3 h, before a significant drop of around 7.1 and 6.7 times less times less energy processing at 250 °C for 6 h when compared to 180 °C for 1 h, and 220 °C for 3 h, respectively. With this being said, these figures were taken using conversion figures from a study by Lucian et al. [60], as shown in Equation (6). They used the biodegradable fraction of MSW, which may have contained some non-FW, lignocellulosic material, meaning that these measurements may, in reality, be slightly different. Perhaps a further research could conduct tests on homogenised FW from each FW category and each region, using the same conditions to gain more accurate figures concerning energy yields and net energy gains, to gain greater certainty on the true GHG mitigation potentials based on FW HTC using the different process conditions. With this being said, it appears that HTC of landfilled FW at 180 °C for 1 h to substitute lignite has the greatest theoretical potential for GHG mitigation in the different regions.
The total and proportion of lignite and hard coal that could be substituted in the different regions’ has also been assessed, with total and proportional coal replacement figures displayed in Table 6. The study has shown that China has the greatest potential to substitute coal regarding total coal substitution (MT). It is also apparent that the same HC could mitigate more lignite than hard coal, due to hard coal having a higher calorific value. Moreover, for proportional substitution the greatest proportion of any coal type for any region that could be substituted is with lignite substitution in India, followed by lignite substitution in China, with much lower proportions of hard coal being substituted in both countries due to higher total hard coal usage. Following this, the next highest proportional substitution was for EU hard coal substitution, with a comparatively lower proportion for lignite substitution, due to high lignite use in the area. With this being said, there is some variation among the calorific values for lignite and hard coals, not the set calorific values used for the assessment, meaning that there will be some uncertainty related to the quantities of hard coal and lignite that could be substituted in reality.
The total and proportion of methane emissions that could be avoided in the regions was also assessed, with total and proportional coal replacement figures displayed in Table 7. The findings clearly indicate that the total methane mitigation figures were greatest for China, while the proportion of total anthropogenic methane that could be substituted were greatest in China, then India, and lowest in the EU. This assessment uses general assumptions about the proportion of carbon that will degrade into LFG, and the proportion of LFG that will become methane. In reality, this may vary based on FW composition, landfill type, temperatures, and many other variables however [56]; thus, it is only a rough estimate of the methane avoidance, and further studies should be made extensively modelling how FW composition, landfill types within the regions, and climatic conditions, among other variables, may impact true methane creation from landfilled FW, and thus methane avoidance in the regions.
The implications of future changes to the FW landscape in the different regions, and practical implications associated with the utilisation of HC for coal substitution have also been examined. Regarding practical implications of HC replacing coal, this study has identified that energy density was a potential issue, especially when the FW processed at 180 °C for 1 h replaces hard coal, due to particularly low and high energy densities respectively. With this in mind, the findings suggest that HTC process conditions of 220 °C for 3 h should be used to replace lignite, due to these conditions producing more energy dense HC, whilst only having a slightly lower net energy gain than for 180 °C for 1 h, while lignite also has a lower energy density than hard coal, whilst being a more carbon intensive fuel. Further suggestions for reducing issues associated with HC and energy density, mass density, storage properties, and combustion behaviour included co-processing FW with lignocellulosic organic fuels such as agricultural residues, and co-firing HC in coal-fired energy plants with coal. The study also suggests that co-processing FW with other organic wastes would increase feedstock quantities for HTC, and subsequently lead to greater overall GHG mitigation.
The role FW HTC could have on overall GHG reductions in India, the EU, China, and the globe was also evaluated. The study identified that China had the greatest overall total CO2 eq mitigation potential; however, the greatest proportional CO2 eq mitigation of total CO2 eq emissions of the regions was for India. The proportional CO2 eq mitigation for India and China is significantly higher than for the EU. Regarding the proportion of CO2 eq that could be mitigated from FW HTC of Indian, Chinese, and European landfilled FW, 0.94% of global CO2 eq could be mitigated, a figure that would be much higher if it included all FW landfilled globally, alongside the HTC of all other currently landfilled organic wastes, and abundant agricultural residues.
From these findings, the research can make a number of recommendations to ascertain high potential opportunities for FW HTC and GHG mitigation. Figure 6 provides researchers and policymakers with instructions on how to assess key GHG mitigation criteria for FW HTC, and identify opportunities in different regions. As the greatest mitigation for FW HTC came from landfill avoidance, regions and FW types within regions that have high landfilling rates should be prioritised for the adoption of HTC. Moreover, areas with high lignite use should also be prioritised, as lignite substitution results in enhanced GHG mitigation when compared to higher quality coal and grid energy, and characteristically HC is more similar to lignite than it is to hard coal, due to it having a lower calorific value. HTC of FW may also be combined with other underutilised organic wastes, preferably lignocellusoic wastes such as agricultural residues, to improve fuel quality and quantity, and should perhaps be co-fired with coal to reduce the likelihood of technical issues associated with HC use and coal substitution from developing. All in all, it is clear that HTC of currently landfilled FW has significant opportunities for GHG mitigation, with these opportunities enhanced in countries with high FW generation rates and poorer FW treatment, such as India and China, but to a considerably lesser extent in the EU.

Author Contributions

Conceptualisation, N.D., A.R. and J.B.G.; methodology, N.D., A.R. and J.B.G.; validation, A.R.; formal analysis, N.D.; investigation, N.D.; resources, N.D., A.R. and J.B.G.; data curation, N.D.; writing—original draft preparation, N.D.; writing—review and editing, N.D., J.B.G., D.G., A.G., T.C., Y.T., X.Y. and A.R.; visualisation, N.D. and D.G.; supervision, A.R.; project administration, A.R. and A.G.; funding acquisition, A.R. and A.G. All authors have read and agreed to the published version of the manuscript.

Funding

This research was funded by the Engineering & Physical Sciences Research Council (EPSRC) (grant no. EP/L014912/1) and a DST UKIERI funded Thematic partnership between the University of Leeds and Indian Institute of Technology, Bombay on Conversion of wet wastes by Hydrothermal carbonisation (IND/CONT/GA/18-19/18).

Institutional Review Board Statement

Not applicable.

Informed Consent Statement

Not applicable.

Data Availability Statement

Not applicable.

Conflicts of Interest

The authors declare no conflict of interest. The funders had no role in the design of the study; in the collection, analyses, or interpretation of data; in the writing of the manuscript, or in the decision to publish the results.

References

  1. Food and Agriculture Organization. Global Food Losses and Food Waste–Extent, Causes and Prevention; SAVE FOOD: An Initiative on Food Loss and Waste Reduction; FAO: Rome, Italy, 2011. [Google Scholar]
  2. Saqib, N.U.; Sharma, H.B.; Baroutian, S.; Dubey, B.; Sarmah, A.K. Valorisation of food waste via hydrothermal carbonisation and techno-economic feasibility assessment. Sci. Total Environ. 2019, 690, 261–276. [Google Scholar] [CrossRef] [PubMed]
  3. Vision 2020: UK Roadmap to Zero Waste to Landfill. 2013. Available online: https://www.vision2020.info/assets/pdf/Vision_2020_roadmap.pdf (accessed on 8 October 2021).
  4. WRAP. Estimates of Food Surplus and Waste Arisings in the UK. 2017. Available online: http://www.wrap.org.uk/sites/files/wrap/Estimates_%20in_the_UK_Jan17.pdf (accessed on 20 August 2021).
  5. British Standards Institution. PAS 2050: 2011 Specification for the Assessment of the Life Cycle Greenhouse Gas Emissions of Goods and Services; British Standards Institution: London, UK, 2011. [Google Scholar]
  6. UNFCC. World Leaders Kick Start Accelerated Climate Action at COP26. 2021. Available online: https://unfccc.int/news/world-leaders-kick-start-accelerated-climate-action-at-cop26 (accessed on 8 October 2021).
  7. IEA. Methane Tracker 2020. 2021. Available online: https://www.iea.org/reports/methane-tracker-2020 (accessed on 8 October 2021).
  8. Ebner, J.; Babbitt, C.; Winer, M.; Hilton, B.; Williamson, A. Life cycle greenhouse gas (GHG) impacts of a novel process for converting food waste to ethanol and co-products. Appl. Energy 2014, 130, 86–93. [Google Scholar] [CrossRef]
  9. Sachs, J.D.; Schmidt-Traub, G.; Mazzucato, M.; Messner, D.; Nakicenovic, N.; Rockström, J. Six transformations to achieve the sustainable development goals. Nat. Sustain. 2019, 2, 805–814. [Google Scholar] [CrossRef]
  10. UNFCC. End of Coal in Sight at COP26. 2021. Available online: https://unfccc.int/news/end-of-coal-in-sight-at-cop26 (accessed on 10 October 2021).
  11. Pham, T.P.T.; Kaushik, R.; Parshetti, G.K.; Mahmood, R.; Balasubramanian, R. Food waste-to-energy conversion technologies: Current status and future directions. Waste Manag. 2015, 38, 399–408. [Google Scholar] [CrossRef]
  12. Li, Y.; Liu, H.; Xiao, K.; Jin, M.; Xiao, H.; Yao, H. Combustion and Pyrolysis Characteristics of Hydrochar Prepared by Hydrothermal Carbonization of Typical Food Waste: Influence of Carbohydrates, Proteins, and Lipids. Energy Fuels 2019, 34, 430–439. [Google Scholar] [CrossRef]
  13. Biller, P.; Ross, A.B. Production of biofuels via hydrothermal conversion. In Handbook of Biofuels Production; Woodhead Publishing: Sawston, UK, 2016; pp. 509–547. [Google Scholar]
  14. Parmar, K.R.; Ross, A.B. Integration of hydrothermal carbonisation with anaerobic digestion; Opportunities for valorisation of digestate. Energies 2019, 12, 1586. [Google Scholar] [CrossRef] [Green Version]
  15. Peterson, A.A.; Vogel, F.; Lachance, R.P.; Fröling, M.; Antal, M.J., Jr.; Tester, J.W. Thermochemical biofuel production in hydrothermal media: A review of sub-and supercritical water technologies. Energy Environ. Sci. 2008, 1, 32–65. [Google Scholar] [CrossRef]
  16. Sahai, S.; Sharma, C.; Singh, S.K.; Gupta, P.K. Assessment of trace gases, carbon and nitrogen emissions from field burning of agricultural residues in India. Nutr. Cycl. Agroecosyst. 2011, 89, 143–157. [Google Scholar] [CrossRef]
  17. Kashyap, D.; Agarwal, T. Food loss in India: Water footprint, land footprint and GHG emissions. Environ. Dev. Sustain. 2020, 22, 2905–2918. [Google Scholar] [CrossRef]
  18. Libra, J.A.; Ro, K.S.; Kammann, C.; Funke, A.; Berge, N.D.; Neubauer, Y.; Titirici, M.M.; Fühner, C.; Bens, O.; Kern, J.; et al. Hydrothermal carbonization of biomass residuals: A comparative review of the chemistry. Biofuels 2011, 2, 71–106. [Google Scholar] [CrossRef] [Green Version]
  19. Searle, S.; Malins, C. Availability of Cellulosic Residues and Wastes in the EU; International Council on Clean Transportation: Washington, DC, USA, 2013. [Google Scholar]
  20. Forbes, H.; Quested, T.; O’Connor, C. Food Waste Index Report 2021; United Nations Environment Programme: Nairobi, Kenya, 2021. [Google Scholar]
  21. Xue, L.; Liu, X.; Lu, S.; Cheng, G.; Hu, Y.; Liu, J.; Dou, Z.; Cheng, S.; Liu, G. China’s food loss and waste embodies increasing environmental impacts. Nat. Food 2021, 2, 519–528. [Google Scholar] [CrossRef]
  22. Dhar, H.; Kumar, S.; Kumar, R. A review on organic waste to energy systems in India. Bioresour. Technol. 2017, 245, 1229–1237. [Google Scholar] [CrossRef]
  23. Di Maria, F.; Mersky, R.L.; Daskal, S.; Ayalon, O.; Ghosh, S.K. Preliminary comparison among recycling rates for developed and developing countries: The case of India, Israel, Italy and USA. In Sustainable Waste Management: Policies and Case Studies; Springer: Singapore, 2020; pp. 1–13. [Google Scholar]
  24. World Data. Greenhouse Gases Emissions by Country. 2021. Available online: https://www.worlddata.info/greenhouse-gas-by-country.php (accessed on 10 October 2021).
  25. Stenmarck, A.; Jensen, C.; Quested, T.; Moates, G.; Buksti, M.; Cseh, B.; Juul, S.; Parry, A.; Politano, A.; Redlingshofer, B.; et al. Estimates of European Food Waste Levels, Reducing Food Waste through Social Innovation; EU Fusions: Stockholm, Sweden, 2016. [Google Scholar]
  26. Gustavsson, J.; Cederberg, C.; Sonesson, U. Global Food Losses and Food Waste—Study Conducted for the International Congress; FAO: Rome, Italy, 2011. [Google Scholar]
  27. Priefer, C.; Jörissen, J.; Bräutigam, K.R. Food waste prevention in Europe–A cause-driven approach to identify the most relevant leverage points for action. Resour. Conserv. Recycl. 2016, 109, 155–165. [Google Scholar] [CrossRef]
  28. Scherhaufer, S.; Moates, G.; Hartikainen, H.; Waldron, K.; Obersteiner, G. Environmental impacts of food waste in Europe. Waste Manag. 2018, 77, 98–113. [Google Scholar] [CrossRef] [PubMed]
  29. EEA. EEA Greenhouse Gases—Data Viewer. 2021. Available online: https://www.eea.europa.eu/data-and-maps/data/data-viewers/greenhouse-gases-viewer (accessed on 11 October 2021).
  30. Ji, L.Q. An assessment of agricultural residue resources for liquid biofuel production in China. Renew. Sustain. Energy Rev. 2015, 44, 561–575. [Google Scholar] [CrossRef]
  31. Zhang, H.; Liu, G.; Xue, L.; Zuo, J.; Chen, T.; Vuppaladadiyam, A.; Duan, H. Anaerobic digestion based waste-to-energy technologies can halve the climate impact of China’s fast-growing food waste by 2040. J. Clean. Prod. 2020, 277, 123490. [Google Scholar] [CrossRef]
  32. Liu, M.; Ogunmoroti, A.; Liu, W.; Li, M.; Bi, M.; Liu, W.; Cui, Z. Assessment and projection of environmental impacts of food waste treatment in China from life cycle perspectives. Sci. Total Environ. 2022, 807, 150751. [Google Scholar] [CrossRef]
  33. Yong, Z.J.; Bashir, M.J.; Hassan, M.S. Biogas and biofertilizer production from organic fraction municipal solid waste for sustainable circular economy and environmental protection in Malaysia. Sci. Total Environ. 2021, 776, 145961. [Google Scholar] [CrossRef]
  34. Yevich, R.; Logan, J.A. An assessment of biofuel use and burning of agricultural waste in the developing world. Glob. Biogeochem. Cycles 2003, 17, 1095. [Google Scholar] [CrossRef]
  35. Sahoo, K.; Kumar, A.; Chakraborty, J.P. A comparative study on valuable products: Bio-oil, biochar, non-condensable gases from pyrolysis of agricultural residues. J. Mater. Cycles Waste Manag. 2021, 23, 186–204. [Google Scholar] [CrossRef]
  36. Ulloa, J.B.; Van Weerd, J.H.; Huisman, E.A.; Verreth, J.A.J. Tropical agricultural residues and their potential uses in fish feeds: The Costa Rican situation. Waste Manag. 2004, 24, 87–97. [Google Scholar] [CrossRef] [PubMed]
  37. Anukam, A.I.; Goso, B.P.; Okoh, O.O.; Mamphweli, S.N. Studies on characterization of corn cob for application in a gasification process for energy production. J. Chem. 2017, 2017, 6478389. [Google Scholar] [CrossRef] [Green Version]
  38. Paynor, K.A.; David, E.S.; Valentino, M.J.G. Endophytic fungi associated with bamboo as possible sources of single cell protein using corn cob as a substrate. Mycosphere 2016, 7, 139–147. [Google Scholar] [CrossRef]
  39. Saeed, A.A.H.; Harun, N.Y.; Nasef, M.M. Physicochemical characterization of different agricultural residues in malaysia for bio char production. Int. J. Civ. Eng. Technol. 2019, 10, 213–225. [Google Scholar]
  40. Fiore, S.; Ruffino, B.; Campo, G.; Roati, C.; Zanetti, M.C. Scale-up evaluation of the anaerobic digestion of food-processing industrial wastes. Renew. Energy 2016, 96, 949–959. [Google Scholar] [CrossRef]
  41. Viswanath, P.; Devi, S.S.; Nand, K. Anaerobic digestion of fruit and vegetable processing wastes for biogas production. Bioresour. Technol. 1992, 40, 43–48. [Google Scholar] [CrossRef]
  42. Ahmad, N.; Sahrin, N.; Talib, N.; Ghani, F.A. Characterization of energy content in food waste by using thermogravimetric analyser (TGA) and elemental analyser (CHNS-O). J. Phys. Conf. Ser. 2019, 1349, 012140. [Google Scholar] [CrossRef]
  43. Del Valle, M.; Cámara, M.; Torija, M.E. Chemical characterization of tomato pomace. J. Sci. Food Agric. 2006, 86, 1232–1236. [Google Scholar] [CrossRef]
  44. Joshi, V.K.; Sandhu, D.K. Preparation and evaluation of an animal feed byproduct produced by solid-state fermentation of apple pomace. Bioresour. Technol. 1996, 56, 251–255. [Google Scholar] [CrossRef]
  45. Fantozzi, F.; Pistolesi, V.; Massoli, S.; Pugliese, A.; Bidini, G. Anaerobic digestion of spoiled milk in batch reactors: Technical and economic feasibility. Energy Procedia 2015, 81, 309–318. [Google Scholar] [CrossRef] [Green Version]
  46. Okoro-Shekwaga, C.K. Improving the Biomethane Yield and Biogas Quality of Food Waste during Anaerobic Digestion by Sequential Process Optimisation and Biomethanation. Ph.D. Thesis, University of Leeds, Leeds, UK, 2019. [Google Scholar]
  47. Heaven, S.; Zhang, Y.; Arnold, R.; Paavola, T.; Vaz, F.; Cavinato, C. Compositional Analysis; Core Laboratories: Amsterdam, The Netherlands, 2013. [Google Scholar]
  48. Gupta, D.; Mahajani, S.M.; Garg, A. Effect of hydrothermal carbonization as pretreatment on energy recovery from food and paper wastes. Bioresour. Technol. 2019, 285, 121329. [Google Scholar] [CrossRef] [PubMed]
  49. IEA. India Energy Outlook 2021. 2021. Available online: https://www.iea.org/reports/india-energy-outlook-2021 (accessed on 11 October 2021).
  50. IEA. Coal Information. 2020. Available online: https://iea.blob.core.windows.net/assets/a5f208e9-f66b-4d31-b5af-87d581b70c18/Coal_Information_Overview_2020_edition.pdf (accessed on 11 October 2021).
  51. IEA. Europe. 2021. Available online: https://www.iea.org/regions/europe (accessed on 11 October 2021).
  52. Eurostat. Coal Production and Consumption Statistics. 2020. Available online: https://ec.europa.eu/eurostat/statistics-explained/index.php?title=Coal_production_and_consumption_statistics#Consumption_and_production_of_hard_coal (accessed on 12 October 2021).
  53. Australian Government. Coal in India. 2019. Available online: https://www.industry.gov.au/sites/default/files/2019-08/coal-in-india-2019-report.pdf (accessed on 12 October 2021).
  54. IEA. China. 2021. Available online: https://www.iea.org/countries/china (accessed on 11 October 2021).
  55. IEA. Development of CO2 Emission Intensity of Electricity Generation in Selected Countries, 2000–2020. 2020. Available online: https://www.iea.org/data-and-statistics/charts/development-of-co2-emission-intensity-of-electricity-generation-in-selected-countries-2000-2020 (accessed on 12 October 2021).
  56. Friedl, A.; Padouvas, E.; Rotter, H.; Varmuza, K. Prediction of heating values of biomass fuel from elemental composition. Anal. Chim. Acta 2005, 544, 191–198. [Google Scholar] [CrossRef]
  57. Manfredi, S.; Tonini, D.; Christensen, T.H.; Scharff, H. Landfilling of waste: Accounting of greenhouse gases and global warming contributions. Waste Manag. Res. 2009, 27, 825–836. [Google Scholar] [CrossRef] [PubMed]
  58. Sharma, H.B.; Dubey, B.K. Co-hydrothermal carbonization of food waste with yard waste for solid biofuel production: Hydrochar characterization and its pelletization. Waste Manag. 2020, 118, 521–533. [Google Scholar] [CrossRef] [PubMed]
  59. Mehta, Y.D.; Shastri, Y.; Joseph, B. Economic analysis and life cycle impact assessment of municipal solid waste (MSW) disposal: A case study of Mumbai, India. Waste Manag. Res. 2018, 36, 1177–1189. [Google Scholar] [CrossRef]
  60. Lucian, M.; Volpe, M.; Merzari, F.; Wüst, D.; Kruse, A.; Andreottola, G.; Fiori, L. Hydrothermal carbonization coupled with anaerobic digestion for the valorization of the organic fraction of municipal solid waste. Bioresour. Technol. 2020, 314, 123734. [Google Scholar] [CrossRef]
  61. Mahmood, R.; Parshetti, G.K.; Balasubramanian, R. Energy, exergy and techno-economic analyses of hydrothermal oxidation of food waste to produce hydro-char and bio-oil. Energy 2016, 102, 187–198. [Google Scholar] [CrossRef]
  62. McGaughy, K.; Reza, M.T. Hydrothermal carbonization of food waste: Simplified process simulation model based on experimental results. Biomass Convers. Biorefin. 2018, 8, 283–292. [Google Scholar] [CrossRef]
  63. Mau, V.; Gross, A. Energy conversion and gas emissions from production and combustion of poultry-litter-derived hydrochar and biochar. Appl. Energy 2018, 213, 510–519. [Google Scholar] [CrossRef]
  64. Turconi, R.; Boldrin, A.; Astrup, T. Life cycle assessment (LCA) of electricity generation technologies: Overview, comparability and limitations. Renew. Sustain. Energy Rev. 2013, 28, 555–565. [Google Scholar] [CrossRef] [Green Version]
  65. Food and Agriculture Organization. Energy Conservation in the Mechanical Forest Industries; FAO: Rome, Italy, 1990. [Google Scholar]
  66. CPHEEO. Manual on Municipal Solid Waste Management. Part III: The Compendium; Central Public Health and Environmental Engineering Organization, Ministry of Urban Development: New Delhi, India, 2016.
  67. Joshi, R.; Ahmed, S. Status and challenges of municipal solid waste management in India: A review. Cogent Environ. Sci. 2016, 2, 1139434. [Google Scholar] [CrossRef]
  68. Kaushal, R.K.; Varghese, G.K.; Chabukdhara, M. Municipal solid waste management in India-current state and future challenges: A review. Int. J. Eng. Sci. Technol. 2012, 4, 1473–1489. [Google Scholar]
  69. Singh, C.K.; Kumar, A.; Roy, S.S. Quantitative analysis of the methane gas emissions from municipal solid waste in India. Sci. Rep. 2018, 8, 2913. [Google Scholar] [CrossRef]
  70. CPHEEO. Manual on Municipal Solid Waste Management. Part II: An Overview; Central Public Health and Environmental Engineering Organization, Ministry of Urban Development: New Delhi, India, 2016.
  71. Kumar, P.; Hussain, A.; Dubey, S.K. Methane formation from food waste by anaerobic digestion. Biomass Convers. Biorefinery 2016, 6, 271–280. [Google Scholar] [CrossRef]
  72. Gupta, D.; Mahajani, S.M.; Garg, A. Opportunities for Resource Recovery After Hydrothermal Pretreatment of Biodegradable Municipal Solid Waste: A Mini-review. In Waste Management as Economic Industry Towards Circular Economy; Springer: Singapore, 2020; pp. 149–158. [Google Scholar]
  73. IEA. World Coal Consumption, 1978–2020. 2021. Available online: https://www.iea.org/data-and-statistics/charts/world-coal-consumption-1978-2020 (accessed on 14 October 2021).
  74. Chaturvedi, V.; Malyan, A. Implications of a Net-Zero Target for India’s Sectoral Energy Transitions and Climate Policy. 2021. Available online: https://www.ceew.in/sites/default/files/ceew-study-on-implications-of-net-zero-target-for-indias-sectoral-energy-transitions-and-climate-policy.pdf (accessed on 13 October 2021).
  75. Fragkos, P.; van Soest, H.L.; Schaeffer, R.; Reedman, L.; Köberle, A.C.; Macaluso, N.; Evangelopoulou, S.; De Vita, A.; Sha, F.; Qimin, C.; et al. Energy system transitions and low-carbon pathways in Australia, Brazil, Canada, China, EU-28, India, Indonesia, Japan, Republic of Korea, Russia and the United States. Energy 2021, 216, 119385. [Google Scholar] [CrossRef]
  76. Bräutigam, K.R.; Jörissen, J.; Priefer, C. The extent of food waste generation across EU-27: Different calculation methods and the reliability of their results. Waste Manag. Res. 2014, 32, 683–694. [Google Scholar] [CrossRef]
  77. European Environment Agency. Trend in Municipal Waste Management. 2019. Available online: https://www.eea.europa.eu/data-and-maps/daviz/trend-in-municipal-waste-management#tab-chart_2 (accessed on 7 July 2020).
  78. Secondi, L.; Principato, L.; Laureti, T. Household food waste behaviour in EU-27 countries: A multilevel analysis. Food Policy 2015, 56, 25–40. [Google Scholar] [CrossRef]
  79. EC. Food Waste. 2021. Available online: https://ec.europa.eu/food/safety/food-waste_en#:~:text=The%20EU%20is%20committed%20to,food%20production%20and%20supply%20chains (accessed on 14 October 2021).
  80. Tsiropoulos, I.; Nijs, W.; Tarvydas, D.; Ruiz, P. Towards net-zero emissions in the EU energy system by 2050. In Insights from Scenarios in Line with the 2030 and 2050 Ambitions of the European Green Deal; Publications Office of the European Union: Luxembourg, 2020. [Google Scholar]
  81. Vieira, L.C.; Longo, M.; Mura, M. Are the European manufacturing and energy sectors on track for achieving net-zero emissions in 2050? An empirical analysis. Energy Policy 2021, 156, 112464. [Google Scholar] [CrossRef]
  82. Collins, C. Beyond Coal: Phase-Out Policies in the EU and Implications for the United States; Climate Institute: Washington, DC, USA, 2019. [Google Scholar]
  83. Rentier, G.; Lelieveldt, H.; Kramer, G.J. Varieties of coal-fired power phase-out across Europe. Energy Policy 2019, 132, 620–632. [Google Scholar] [CrossRef]
  84. EEA. Greenhouse Gas Emission Intensity of Electricity Generation in Europe. 2021. Available online: https://www.eea.europa.eu/data-and-maps/indicators/overview-of-the-electricity-production-3/assessment#:~:text=The%20GHG%20emission%20intensity%20of%20total%20electricity%20generation%20in%20the,on%20average%2C%20in%20that%20time (accessed on 11 October 2021).
  85. Giavini, M.; Favoino, E. Bio-Waste Generation in the EU: Current Capture Levels and Future Potential; Bio-Based Industries Consortium (BIC): Brussels, Belgium, 2020. [Google Scholar]
  86. EEA. Municipal Waste Landfill Rates in Europe by Country. 2021. Available online: https://www.eea.europa.eu/data-and-maps/daviz/municipal-waste-landfill-rates-in#tab-chart_1 (accessed on 11 October 2021).
  87. Zhou, M.H.; Shen, S.L.; Xu, Y.S.; Zhou, A.N. New policy and implementation of municipal solid waste classification in Shanghai, China. Int. J. Environ. Res. Public Health 2019, 16, 3099. [Google Scholar] [CrossRef] [Green Version]
  88. Wen, Z.; Wang, Y.; De Clercq, D. What is the true value of food waste? A case study of technology integration in urban food waste treatment in Suzhou City, China. J. Clean. Prod. 2016, 118, 88–96. [Google Scholar] [CrossRef]
  89. Liu, J.; Lundqvist, J.; Weinberg, J.; Gustafsson, J. Food losses and waste in China and their implication for water and land. Environ. Sci. Technol. 2013, 47, 10137–10144. [Google Scholar] [CrossRef] [PubMed]
  90. Mirosa, M.; Yip, R.; Lentz, G. Content analysis of the ‘clean your plate campaign’on sina weibo. J. Food Prod. Mark. 2018, 24, 539–562. [Google Scholar] [CrossRef]
  91. Pollitt, H. Analysis: Going carbon neutral by 2060 ‘will make China richer’. Carbon Brief, 29 September 2020; p. 24. [Google Scholar]
  92. Mazumder, S.; Saha, P.; Reza, M.T. Co-hydrothermal carbonization of coal waste and food waste: Fuel characteristics. Biomass Convers. Biorefin. 2020, 12, 3–13. [Google Scholar] [CrossRef]
  93. Wilk, M.; Śliz, M.; Gajek, M. The effects of hydrothermal carbonization operating parameters on high-value hydrochar derived from beet pulp. Renew. Energy 2021, 177, 216–228. [Google Scholar] [CrossRef]
  94. Ischia, G.; Fiori, L.; Gao, L.; Goldfarb, J.L. Valorizing municipal solid waste via integrating hydrothermal carbonization and downstream extraction for biofuel production. J. Clean. Prod. 2021, 289, 125781. [Google Scholar] [CrossRef]
  95. Satchwell, A.J.; Scown, C.D.; Smith, S.J.; Amirebrahimi, J.; Jin, L.; Kirchstetter, T.W.; Brown, N.J.; Preble, C.V. Accelerating the deployment of anaerobic digestion to meet zero waste goals. Environ. Sci. Technol. 2018, 52, 13663–13669. [Google Scholar] [CrossRef]
  96. Liu, Z.; Quek, A.; Hoekman, S.K.; Srinivasan, M.P.; Balasubramanian, R. Thermogravimetric investigation of hydrochar-lignite co-combustion. Bioresour. Technol. 2012, 123, 646–652. [Google Scholar] [CrossRef]
  97. World Bank. Total Greenhouse Gas Emissions (kt of CO2 Equivalent)—China, India, European Union. 2021. Available online: https://data.worldbank.org/indicator/EN.ATM.GHGT.KT.CE?end=2018&locations=CN-IN-EU&start=1970&view=chart (accessed on 14 October 2021).
  98. Lu, X.; Jordan, B.; Berge, N.D. Thermal conversion of municipal solid waste via hydrothermal carbonization: Comparison of carbonization products to products from current waste management techniques. Waste Manag. 2012, 32, 1353–1365. [Google Scholar] [CrossRef]
  99. Li, L.; Diederick, R.; Flora, J.R.; Berge, N.D. Hydrothermal carbonization of food waste and associated packaging materials for energy source generation. Waste Manag. 2013, 33, 2478–2492. [Google Scholar] [CrossRef]
  100. Reißmann, D.; Thrän, D.; Bezama, A. Hydrothermal processes as treatment paths for biogenic residues in Germany: A review of the technology, sustainability and legal aspects. J. Clean. Prod. 2018, 172, 239–252. [Google Scholar] [CrossRef]
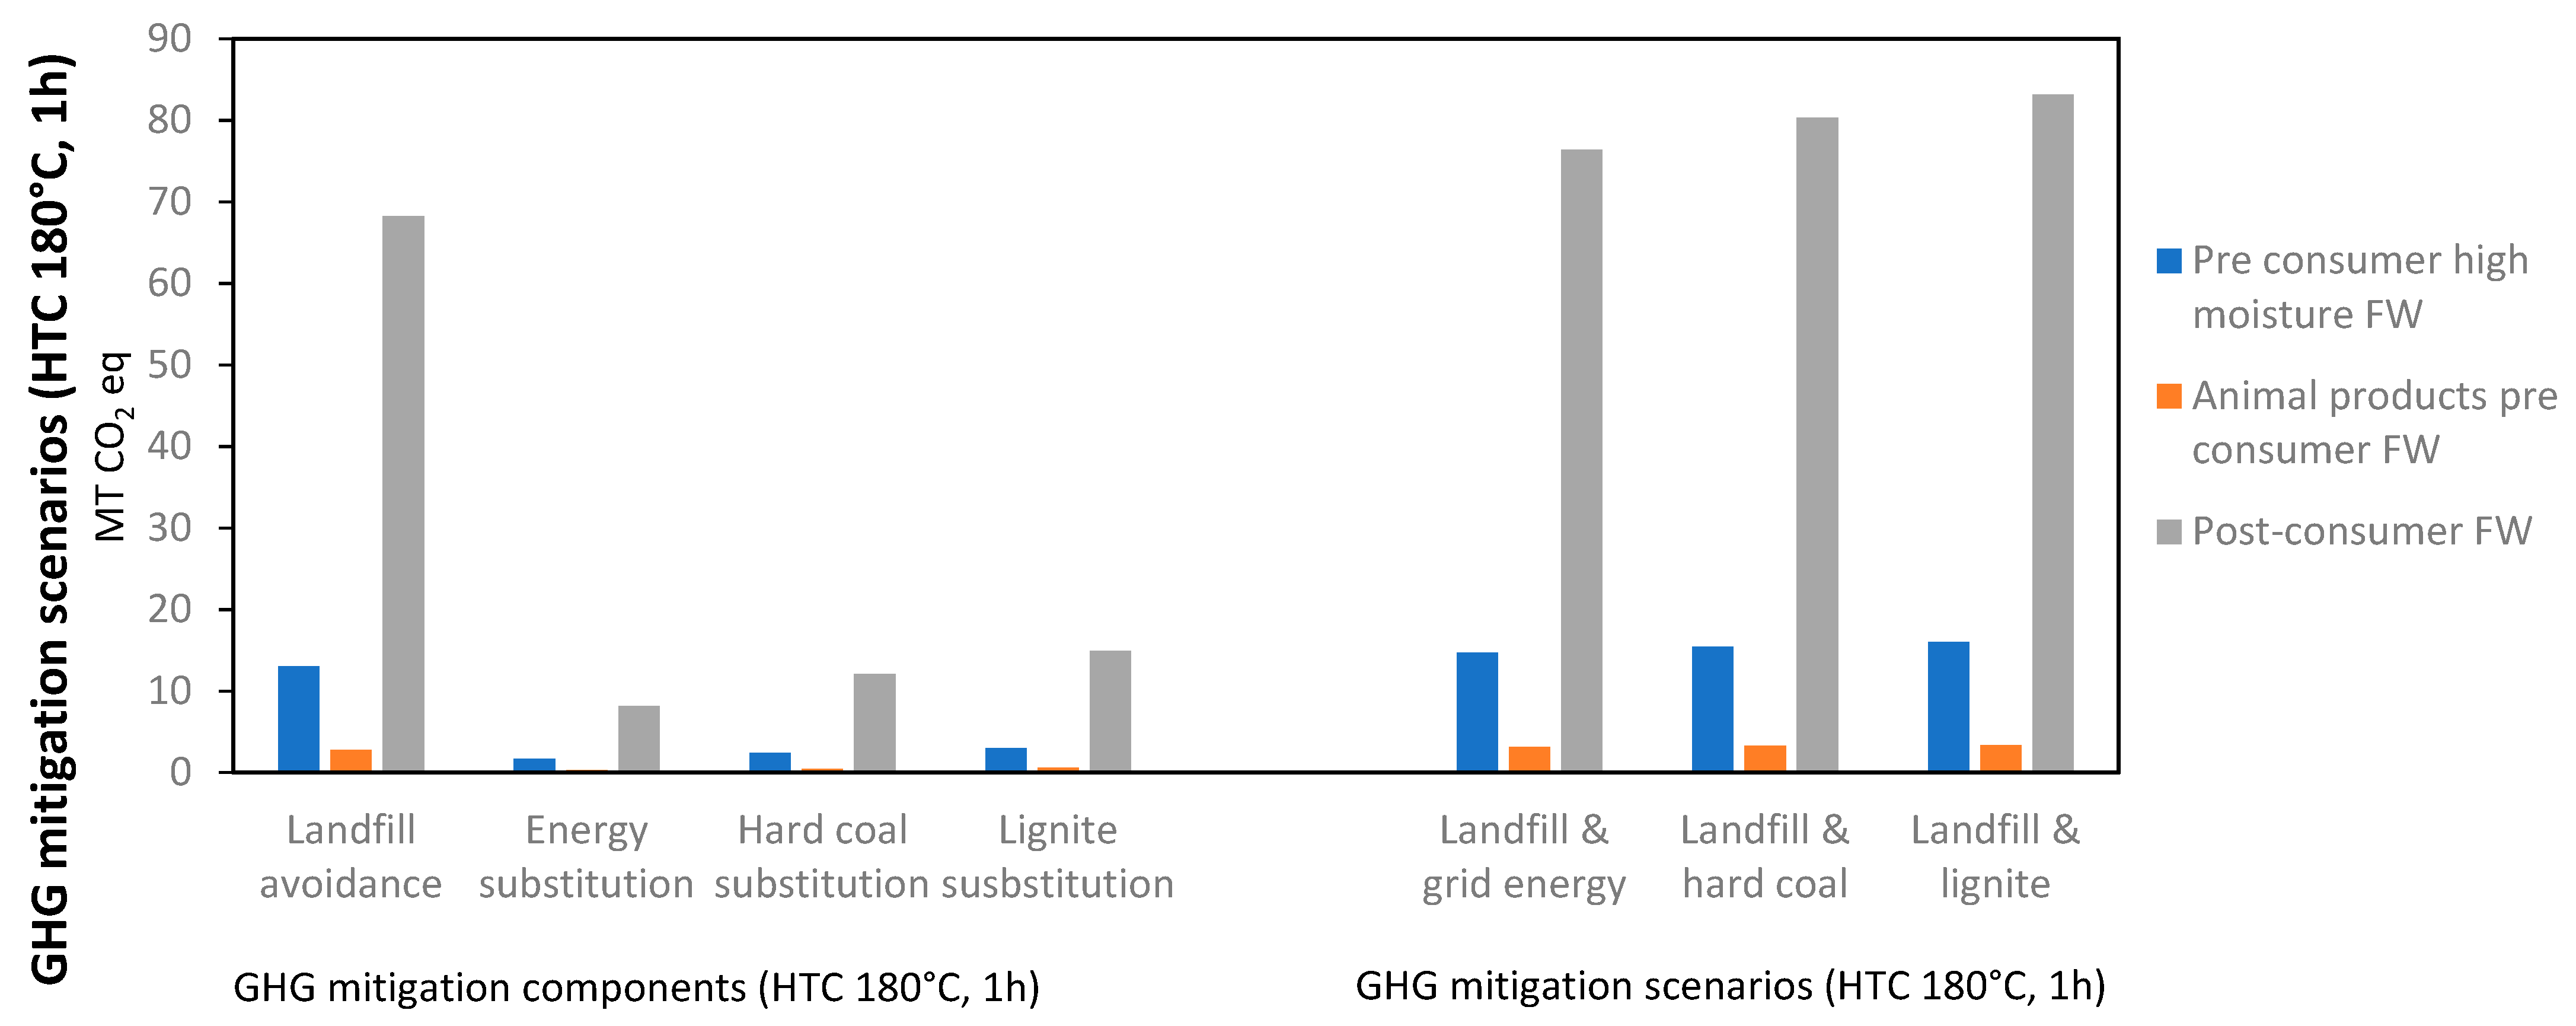
Figure 1. India GHG mitigation from GHG mitigation components, scenarios, and FW types.
Energies 15 01372 g001
Figure 2. EU GHG mitigation from mitigation components, scenarios, and FW types.
Energies 15 01372 g002
Figure 3. China GHG mitigation from mitigation components, scenarios, and FW types.
Energies 15 01372 g003
Figure 4. Comparing total GHG mitigation in India, the EU, and China.
Energies 15 01372 g004
Figure 5. Comparing GHG mitigation per kg of FW in India, the EU, and China.
Energies 15 01372 g005
Figure 6. Framework for calculating GHG mitigation and coal substitution from FW HTC.
Energies 15 01372 g006
Figure 7. Energy intensity and coal use 2000–2020 in India, the EU, and China.
Energies 15 01372 g007
Figure 8. Total and proportional GHG mitigation from FW HTC in India, the EU, and China.
Energies 15 01372 g008
Table 3. Indian climate change mitigation figures from substituting FW landfilling with HTC.
Mitigation TypeHTC TypeHigh Moisture pre Consumer FWAnimal Products pre Consumer FWPost-Consumer FWTotal
Unit Measurements
GHG Mitigation Components
MT CO2 eqkg CO2 eq/kg FWMT CO2 eqkg CO2 eq/kg FWMT CO2 eqkg CO2 eq/kg FWMT CO2 eqkg CO2 eq/kg FW
Landfill avoidance13.020.922.781.8068.230.9984.041.00
Energy substitution180 °C, 1 h1.640.120.310.208.120.1210.070.12
220 °C, 3 h1.550.110.300.197.680.119.530.11
250 °C, 6 h0.230.020.040.031.140.021.420.02
Hard coal substitution180 °C, 1 h2.430.170.460.3012.060.1814.960.18
220 °C, 3 h2.300.160.440.2811.410.1714.150.17
250 °C, 6 h0.340.020.070.041.700.022.100.02
Lignite substitution180 °C, 1 h3.010.210.570.3714.920.2218.510.22
220 °C, 3 h2.850.200.540.3514.120.2117.510.21
250 °C, 6 h0.420.030.080.052.100.032.600.03
GHG mitigation scenarios
Landfill and energy substitution
180 °C, 1 h14.661.043.102.0076.361.1194.111.12
220 °C, 3 h14.571.033.081.9975.921.1093.571.11
250 °C, 6 h13.250.942.831.8369.381.0185.461.01
Landfill and hard coal substitution180 °C, 1 h15.451.103.252.1080.291.1799.001.17
220 °C, 3 h15.321.093.222.0879.641.1698.191.16
250 °C, 6 h13.360.952.851.8469.931.0286.141.02
Landfill and lignite substitution180 °C, 1 h16.031.143.362.1783.161.21102.551.22
220 °C, 3 h15.871.133.332.1582.351.20101.551.20
250 °C, 6 h13.440.952.871.8570.331.2098.661.17
Table 4. EU climate change mitigation figures from substituting FW landfilling with HTC.
Mitigation TypeHTC TypeHigh Moisture Pre-Consumer FWAnimal Products Pre-Consumer FWPost-Consumer FWTotal
Unit Measurements
GHG Mitigation Components
MT CO2 eqkg CO2 eq/kg FWMT CO2 eqkg CO2 eq/kg FWMT CO2 eqkg CO2 eq/kg FWMT CO2 eqkg CO2 eq/kg FW
Landfill avoidance0.470.040.970.1826.640.4728.080.37
Energy substitution180 °C, 1 h0.020.000.040.011.230.021.300.02
220 °C, 3 h0.020.000.040.001.170.021.230.02
250 °C, 6 h0.000.000.010.000.170.000.180.00
Hard coal substitution180 °C, 1 h0.090.010.160.034.710.084.960.07
220 °C, 3 h0.080.010.150.034.450.084.690.06
250 °C, 6 h0.010.000.020.000.660.010.700.01
Lignite substitution180 °C, 1 h0.110.010.200.045.830.106.130.08
220 °C, 3 h0.100.010.190.045.510.105.800.08
250 °C, 6 h0.020.000.030.010.820.010.860.01
GHG mitigation scenarios
Landfill and energy substitution
180 °C, 1 h0.490.041.010.1927.880.4929.380.39
220 °C, 3 h0.490.041.010.1927.810.4929.310.39
250 °C, 6 h0.470.040.980.1826.820.4728.260.37
Landfill and hard coal substitution180 °C, 1 h0.550.041.130.2131.350.5533.040.44
220 °C, 3 h0.550.041.120.2131.100.5532.770.43
250 °C, 6 h0.480.040.990.1927.310.4828.780.38
Landfill and lignite substitution180 °C, 1 h0.570.041.170.2232.470.5734.210.45
220 °C, 3 h0.570.041.160.2232.160.5633.880.45
250 °C, 6 h0.480.041.000.1927.460.4828.940.38
Table 5. Chinese climate change mitigation figures from substituting FW landfilling with HTC.
Mitigation TypeHTC TypeHigh Moisture pre Consumer FWAnimal Products pre Consumer FWPost-Consumer FWTotal
Unit Measurements
GHG Mitigation Components
MT CO2 eqkg CO2 eq/kg FWMT CO2 eqkg CO2 eq/kg FWMT CO2 eqkg CO2 eq/kg FWMT CO2 eqkg CO2 eq/kg FW
Landfill avoidance96.200.4856.870.9488.060.52241.120.56
Energy substitution180 °C, 1 h9.940.055.240.098.600.0523.770.06
220 °C, 3 h9.400.054.950.088.130.0522.480.05
250 °C, 6 h1.400.010.740.020.940.093.070.04
Hard coal substitution180 °C, 1 h17.990.099.480.1615.560.0943.030.10
220 °C, 3 h17.020.098.970.1514.720.0940.700.09
250 °C, 6 h2.530.011.330.041.700.175.560.08
Lignite substitution180 °C, 1 h22.260.1111.730.1919.260.1153.250.12
220 °C, 3 h21.060.1111.100.1818.220.1150.370.12
250 °C, 6 h3.130.011.650.052.100.216.880.10
GHG mitigation scenarios
Landfill and energy substitution
180 °C, 1 h106.140.5362.111.0296.650.57264.890.62
220 °C, 3 h105.600.5361.821.0296.190.57263.610.61
250 °C, 6 h97.600.4957.610.9588.990.52244.200.57
Landfill and hard coal substitution180 °C, 1 h114.190.5766.351.09103.620.61284.160.66
220 °C, 3 h113.220.5765.841.09102.780.60281.830.66
250 °C, 6 h98.730.4958.200.9689.750.53246.680.57
Landfill and lignite substitution180 °C, 1 h118.460.5968.601.13107.310.63294.380.68
220 °C, 3 h117.260.5967.971.12106.270.63291.500.68
250 °C, 6 h99.330.5058.520.9790.150.53248.010.58
Table 6. Total and percentage coal substitution by type in India, the EU and China.
CategoryHTC TypeHigh Moisture Pre-Consumer FWWaste from Animal ProductsPost-Consumer FWTotal
Unit Measurements Total Substitution (MT)Proportion of Coal (%)Total Substitution (MT)Proportion of Coal (%)Total Substitution (MT)Proportion of Coal (%)Total Substitution (MT)Proportion of Coal (%)
IndiaHard coal180 °C, 1 h0.860.110.160.020.600.535.300.66
220 °C, 3 h0.820.100.160.020.600.505.020.62
250 °C, 6 h0.120.020.020.000.600.070.750.09
Lignite180 °C, 1 h0.952.020.180.384.699.985.8212.38
220 °C, 3 h0.901.910.170.364.449.445.5111.71
250 °C, 6 h0.130.280.030.050.661.400.821.74
EUHard coal180 °C, 1 h0.030.020.060.041.671.161.761.22
220 °C, 3 h0.030.020.050.041.581.101.661.15
250 °C, 6 h0.000.000.010.010.230.160.250.17
Lignite180 °C, 1 h0.030.010.060.031.830.741.930.78
220 °C, 3 h0.030.010.060.021.730.701.820.74
250 °C, 6 h0.000.000.010.000.260.100.270.11
ChinaHard coal180 °C, 1 h6.380.213.360.115.520.1815.260.51
220 °C, 3 h6.030.203.180.115.220.1714.430.48
250 °C, 6 h0.900.030.470.020.600.021.970.07
Lignite180 °C, 1 h7.002.973.691.566.062.5716.747.10
220 °C, 3 h6.622.813.491.485.732.4315.846.71
250 °C, 6 h0.980.420.520.220.660.282.160.92
Table 7. Total and percentage methane mitigation in India, the EU, and China.
CategoryHigh Moisture Pre-Consumer FWWaste from Animal ProductsPost-Consumer FWTotal
Unit MeasurementsTotal Substitution (MT)Proportion of Methane (%)Total Substitution (MT)Proportion of Methane (%)Total Substitution (MT)Proportion of Methane (%)Total Substitution (MT)Proportion of Methane (%)
India0.521.940.110.422.7110.173.3412.52
EU0.020.120.040.251.066.871.127.24
China3.827.702.274.573.507.059.5819.32
Table 9. Comparing HTC calorific values of HC and coal.
Fuel TypeHCLigniteHard Coal
HTC conditions180 °C, 1 h220 °C, 3 h250 °C, 6 hN/AN/A
References[60,93,94,95][60,93,94,95][60,93,94][64][64]
Calorific value (MJ/kg)17.4–19.6122.2–23.7525.6–32.226.729.3
Publisher’s Note: MDPI stays neutral with regard to jurisdictional claims in published maps and institutional affiliations.

