Abstract
This research discusses the results of experiments performed on a large-scale gasification installation to determine the influence of total system pressure and partial pressure of CO2 on the efficiency of conversion and the quality of the produced gas. The three tested feedstocks were bark, lignin and a blend of bark and wheat straw, while softwood pellet (SWP) was used as a reference fuel. A mixture of O2/CO2/H2O was used as a gasification agent. The tests were devised to validate the previously proposed process parameters, verify whether similar ash agglomeration problems would occur and compare the thermal behaviour of the feedstocks converted in close-to-industrial process conditions. An understanding of the effect of using CO2 for gasification was further deepened, especially regarding its influence on the yield of H2 and temperature profiles of the fluidized bed. The influence of gasification pressure was predominantly visible in higher yields of all hydrocarbons (including CH4) and lower overall production of producer gas. At the process development unit (PDU), all tested feedstocks were converted at similar process conditions and no signs of potential bed agglomeration could be noticed. This opposes the findings observed in smaller-scale bubbling fluidized bed (BFB) tests. The discussion behind these discrepancies is also presented.
1. Introduction
Throughout the years, pressurized gasification has been treated as one of the most promising technologies for the conversion of primary, non-renewable feedstocks such as hard coals or lignites into chemical intermediates and fuels. However, the use of the same idea has often been considered also for renewable sources, due to great differences between the characteristics of these two groups of feedstocks. Today, the advantages of using pressurized gasification systems for the conversion of biomasses remain not as pronounced.
During the past decade, we observed the development of a couple of remarkable pressurized biomass gasification installations aimed at the production of renewable fuels and chemicals. These actions were aligned with changing EU legislation and were highly supported by such esteemed bodies as the International Renewable Energy Agency and the International Energy Agency. These two institutions have indicated the following goals as priorities for broadening the scale of market uptake of biomass thermal conversion technologies, which is one of the keys for the opening opportunities regarding the decarbonization of our industries:
- To develop biomass-to-liquids (BtL) routes for the production of biodiesel and dimethyl ether (DME) from black liquor gasification;
- To maturate pressurized gasification plants to produce bio-synthetic natural gas (bio-SNG), as in the GoBiGas Phase 2 and E.ON Bio2G Project [1,2];
- To study hybrid biochemical and thermochemical conversion routes.
It can be noticed that from the above list, the first two goals relate directly to the development of pressurized biomass gasification systems [3].
Considering the principles of thermodynamics, it can be seen that performing a gasification process at pressures higher than atmospheric has a few important merits. Firstly, biomass gasification at elevated pressures provides higher reaction efficiencies and kinetics [4,5,6]. This can be noted not only for traditional, solid biomass but also for marine biomass. In [7], the CO2 gasification process of marine biomass (Nannochlo-ropsis gaditana microalgae char) was evaluated with special attention to high-pressure thermogravimetric analyser (HP-TGA) experiments. Within the studied range, the process performance, expressed as reactivity and gasification rate at 50% conversion, was positively influenced by the increase in temperature and pressure, while the effect of the partial pressure of CO2 was negligible. Secondly, by avoiding the need for the compression of producer gas before the stage of synthesis, the related energy and exergy losses can also be avoided [8]. As importantly, for commercial, large-scale operations, due to the smaller size of reactors and vessels, performing the whole conversion route at elevated pressure can be more economical from the standpoint of CAPEX.
Nonetheless, the indicated advantages of the pressurized gasification process often remain outweighed by its drawbacks. Throughout the years we observed numerous unsuccessful projects in this area. The exact reasons behind the unsuccessful story of each differed; however, the following issues were most often highlighted as most problematic: the operational challenges related to the complexity of the system, the great cost and difficulty of construction of the installation, the greatly more complex problem of controlling and automating each unit operation, and the lower accessibility of instrumentation and equipment. All these problems often led to failures, primarily observed within the fuel feeding units, and to unstable operation of the reactor or gas cleaning islands. Often these technical hurdles could be overcome, but the situation of the market had the effect that when the flow of subsidies was stopped the economic grounds for continuation of these processes were also shut [9,10]. On the other hand, cleaning producer gases is easier and more efficient when conducted at higher pressures. Moreover, here the smaller sizing of the apparatuses provides major economic advantages. In general, for gas clean-up systems there are fewer technical hurdles to overcome, while process and technological gains resulting from operating under elevated pressures are more pronounced [9,11]. Thermochemical conversion of hard coals and lignites at pressures higher than 50 bar is supported by many factors. The following can be listed as the most important: easier procurement of coals, its transportation, storage, pretreatment and feeding to pressurized reactors, increase in kinetics of gasification reactions of coal chars (coke), and overall smaller size of the installation. Thus, the overall concept of pressurized coal gasification units remains better justified. On the other hand, it is said that for most biomasses, increasing the pressure of the gasification process just to 4–7 barg provides similar kinetic benefits as 50 bar for coals. This notion is supported by the lower productivity of biomass chars and their much higher reactivity when compared with chars from the gasification of coals [3,12,13]. For this reason, the need to intensify the gasification reactions of chars derived from biomass is less pronounced; however, the importance of reforming volatiles gains in importance due to the problem of the production of tars.
The two of the most often discussed polygeneration routes based on syngas produced through the conversion of biomass are methanation and Fischer–Tropsch synthesis (FT), which are performed most often at 1–10 bara and 20–40 bara, respectively. Currently, the most successful projects of Biomass-to-X (BtX) mainly rely on gasification at atmospheric pressures with subsequent pressurization and deep cleaning of the gas [14,15]. This implies that the optimum between the technical and technological issues related to BtX biorefinery concepts will remain undefined until these technologies reach successful demonstrations in large-scale industrial operations.
The further added value of using gasification technologies lies in the possibility of application of external CO2 sources to increase the conversion of carbon and the total efficiency of the process. A prerequisite when using CO2 gasification is unfortunately the increased operational and investment costs connected with CO2 removal from the producer gas, its management and recirculation. From the standpoint of thermodynamic equilibrium calculations and modelling, it is known that increasing the pressure and temperature of the gasification process leads towards lower production of H2 and CO, while larger amounts of CO2 and CH4 are produced. This, unfortunately, opposes the common goals of BtX technologies and thus induces the need for additional gas upgrading and conversion processes [5,16,17]. At the same time, through the thermodynamic equilibrium calculations we know that using CO2 for gasification further lowers the yields of H2 at the expense of increased production of CO. Reversed water–gas shift and Boudouard reactions are the two primary mechanisms standing behind this [18,19].
A variety of experimental results dedicated to the determination of the influence of pressure on FB gasification of biomass are available in the literature. Unfortunately, many of the presented findings are often contradictory. The authors most often agree that through increasing the gasification pressure, the yields of all hydrocarbons (light and heavy, including tars) increases [9,20]. On the other hand, the issues of char production and change in the overall efficiency of the process remain undecided. In allothermal, steam-blown gasification studies, it was proved that raising the gasification pressure from 2 to 10 barg caused the yield of methane to be increased by up to 38% [6]. The changes in the yields of hydrocarbons and chars can often be attributed to a denser reaction atmosphere, the impact of secondary reforming and to pyrolysis reactions. However, as it is virtually impossible to keep all the necessary similarities between processes conducted at different pressures, different reactor setups used in the research can lead to different conclusions, while (as it has been said) the thermodynamic equilibrium data are theoretical and not attainable in large-scale reactors [4].
Furthermore, the amount of available experimental studies dedicated to the influence of using CO2 for the gasification of biomass is even more scarce than is available for the impact of pressure. At the same time, we see that these two research areas are well developed and documented for coal-oriented processes. In general, CO2 takes part in FB gasification processes similar to that of steam. It acts simultaneously as a fluidizing and a gasifying agent [19,21,22]. Contrary to steam, CO2 gasification reactions are generally slower, more endothermic; also CO2 has much lower heat capacity. CO2 also shifts the equilibrium of Boudouard and water–gas shift reactions. In both cases, it promotes the production of CO at the cost of production of H2, hence further increasing the need for the availability of H2 from external sources.
The use of CO2 in thermo-chemical conversion processes is primarily stipulated for lowering the C footprint of the processes. The full potential of this concept is well illustrated in studies oriented toward gasification and oxy-combustion of coals. On the other hand, when CO2 is used for the conversion of biomasses, the process can finally have a negative carbon footprint. Thus, when the CO2 is sequestrated and recirculated within the biomass gasification process and the efficiency of its conversion is high enough to reach negative net emissions of the CO2, we can see this method as a potential way for chemical sequestration of anthropogenic CO2 [19,21,22,23].
The issue of the influence of gasification with the use of pure CO2 was recently extensively discussed and validated by, i.a., Mauerhofer et al. [18,24,25]. The reactor system used was a dual-fluidized bed (DFB) which enables the production of the producer gas in the allothermal mode, thus separating the influence of combustion reactions. The authors indicate that at the DFB gasification conditions the reverse water–gas shift reaction reaches its maximum rates at 760–840 °C, while on the other hand, to increase the rate of the Boudouard reaction, an optimal gasification temperature should be kept slightly higher ca. 850–950 °C. Hence, high conversions of CO2 can only be achieved using biomasses of advantageous ash chemistry.
Research presented in this paper was carried out within the Heat-to-Fuel project (acronym: HtF). It is a Horizon-2020-funded project aimed at the development of next-generation liquid biofuels at a final price < 1 €/l. It aims to demonstrate that this goal can be achieved through an innovative combination of Fischer–Tropsch synthesis and aqueous-phase reforming (APR). HtF thus concentrates on delivering high-quality fuels at significantly reduced life-cycle emissions of greenhouse gasses (GHG). Two conversion routes build HtF. They are commonly addressed as the dry and wet routes. Herein the authors describe a section of research that was performed in the dry conversion route. The research was performed on a large-scale facility to develop principles of using CO2 as a gasifying agent and the influence of gasification pressure on the conversion of waste biomasses.
The article presents the results of experiments conducted on a large-scale PDU. A central part of this installation is a pressurized circulating fluidized bed (CFB) gasification reactor (0.1–0.5 MPa, 850 °C, 50 kg/h). Three feedstocks, namely wood bark, lignin residue from the production of bio-ethanol and a blend of the bark and wheat straw were compared against a reference fuel (SWP) to assess the efficiency of their gasification. The tests were performed in an autothermal regime and a mixture of O2/CO2/H2O as a gasifying agent. The registered process data on fluidized bed (FB) gasification and producer gas quality were analysed and confirmed against performed mass and energy balances.
To follow the FB gasification experiments presented here and to establish the base for comparison with previously published results, it is essential to set a precise range of control variables and parameters. Indices commonly applied for the FB gasification process do not find direct use in experiments where CO2 is used for gasification. For this reason, the authors propose a set of modified indices which take into consideration the opposing action that CO2 and H2O impose on the composition of producer gas.
The PDU-scale test runs were preceded by research conducted on a bench-scale BFB installation. These experiments aimed to screen process conditions that can lead to low efficiency of the conversion or defluidization of the FB bed. In that work, it was shown that a major reason for the unstable behaviour of an FB can be attributed to the increasing concentration of ash material present in the bed, especially if the ash has low melting temperatures. Hence at the bench scale, agglomeration of the bed was observed only after two conditions were fulfilled simultaneously; the temperature of the process exceeded the melting temperature of ash and a large amount of ash was collected in the bed material. Therefore, the concepts of time before defluidization or critical concentration of ash in bed material were analysed against models and theories that can be found in the literature [26,27]. Interestingly, during the PDU-scale experiments, no signs of bed agglomeration could be detected for the same gasification conditions. Aspects of the CFB process that counteract the previously observed bed agglomeration problems are hence discussed hereafter.
2. Materials and Methods
2.1. Feedstocks
Two biomasses of waste origins were the primary concern of this study, namely bark and lignin (side products from the forest industry and the production of bioethanol in the 2nd generation, respectively). The reason was mainly their waste character, abundance, low market price and competition. Furthermore, a ‘blend’ of bark with straw, in a mass ratio of 85%/15%, respectively, was also tested as a way to increase the share of straw usage in thermochemical conversion pathways.
One of the premises of HtF was to build the dry conversion route based on the feedstock of low market prices which can be acquired in quantities large enough to support the operation of a biorefinery of the minimal size of 100 MW. From techno-economic standpoints, it is very interesting to develop ways for the conversion of biomasses which are of waste origin and thus do not compete for cultivation territory and resources with other crops, while still being a source of carbon and hydrogen which can be converted to useful commodities (energy and chemicals). Different straws are a perfect example of such feedstocks. Their abundance leads to low market prices, while their high ash content and high amount of alkaline metals often preclude recovery of their full chemical and energetic potentials. Throughout the years, combustion and gasification of straw were performed in staged operations and under low-temperature conditions. The low temperature of conversion decreases its efficiency and leads to the generation of high amounts of waste (chars, organic species). To counteract this problem, it is necessary to influence the chemistry of the ashes and thus enable conversion at higher temperatures. The first and most frequently applied solution (particularly for straws) requires leaching of the feedstock, which is mainly conducted through washing with water solutions of various pH levels [28,29]. The second method is based on the premise of the possibility of conducting a chemical reaction between the ash components that express low melting temperature, and an additive of tailored chemical composition, which at process conditions (850–950 °C) react together to produce compounds that have higher melting temperatures and thus do not form a liquid phase [30,31].
HtF undertook the research to assess the boundaries of applicability of the second, hereafter called the ‘blending’, method [32,33]. However, instead of using a chemical reagent that retains an inert character in gasification reactions, the goal here was to find out such pairs or blends of biomass feedstocks whose ashes are complementary both in their quantity and in their chemical composition. Here, the bark was blended with straw (85%/15% w/w) to assess the limits of the above-described idea. In previous publications of the Heat-to-Fuel consortium, it is possible to find more details behind the rationale of the selection, thermodynamic deliberations, as well as small-scale laboratory and fluidized bed experiments [27,32,34].
Before gasification, all feedstocks were pre-treated accordingly to obtain the fuel of the standardized rheological parameters as well as good flow and feeding properties. The pre-treatment procedure was adapted individually for each feedstock, but in general it consisted of grinding to the size < 3–4 mm, drying/moistening to ca. 15% of water content and compression into cylindrical pellets of 6 mm in outer diameter. The pretreatment was performed to improve the density of the feedstocks and the reliability and control of the feeding and to assure that the blend is well mixed. Preparation and characterization of the feedstocks were performed by IChPW, and the resulting physicochemical properties are shown in Table 1.

Table 1.
Proximate and ultimate analysis of gasified feedstocks.
2.2. Gasifying Agents and Bed Material
The technical gasses used in the research were technical grade, liquid O2 (2.5; 20 bar), CO2 (2.7; 25 bar) and N2 (5.0; 25 bar). Air used for start-ups and in combustion chambers was compressed using WAN-NK 200 FL compressor (15 barg, 340 Nm3/h). Steam used as a gasifying agent was produced by a steam generator having a capacity of 30 kg/h of 15 barg/202 °C steam.
The bed material used in the research was Austrian olivine. Table 2 collates characteristic parameters of the bed material.
Table 2.
Physiochemical characteristics of olivine used as bed material.
2.3. Gasifying Agents and Bed Material
2.3.1. Producer Gas Composition
The composition of the dry producer gas was determined online using Siemens Ultramat 23 (CO, CO2, CH4) and Calomat 6E (H2) as well as two Sick 710 analysers equipped with THERMOR, FINOR and OXOR E modules (CO, CO2, CH4, H2 and O2). Such a large diversity of analysers was used to enable the measurement of a vast range of producer gas compositions with good precision. The analysers were calibrated with a set of standard mixtures of gases, and their readings in similar ranges correlated well. These readings were used by operators only for process control purposes.
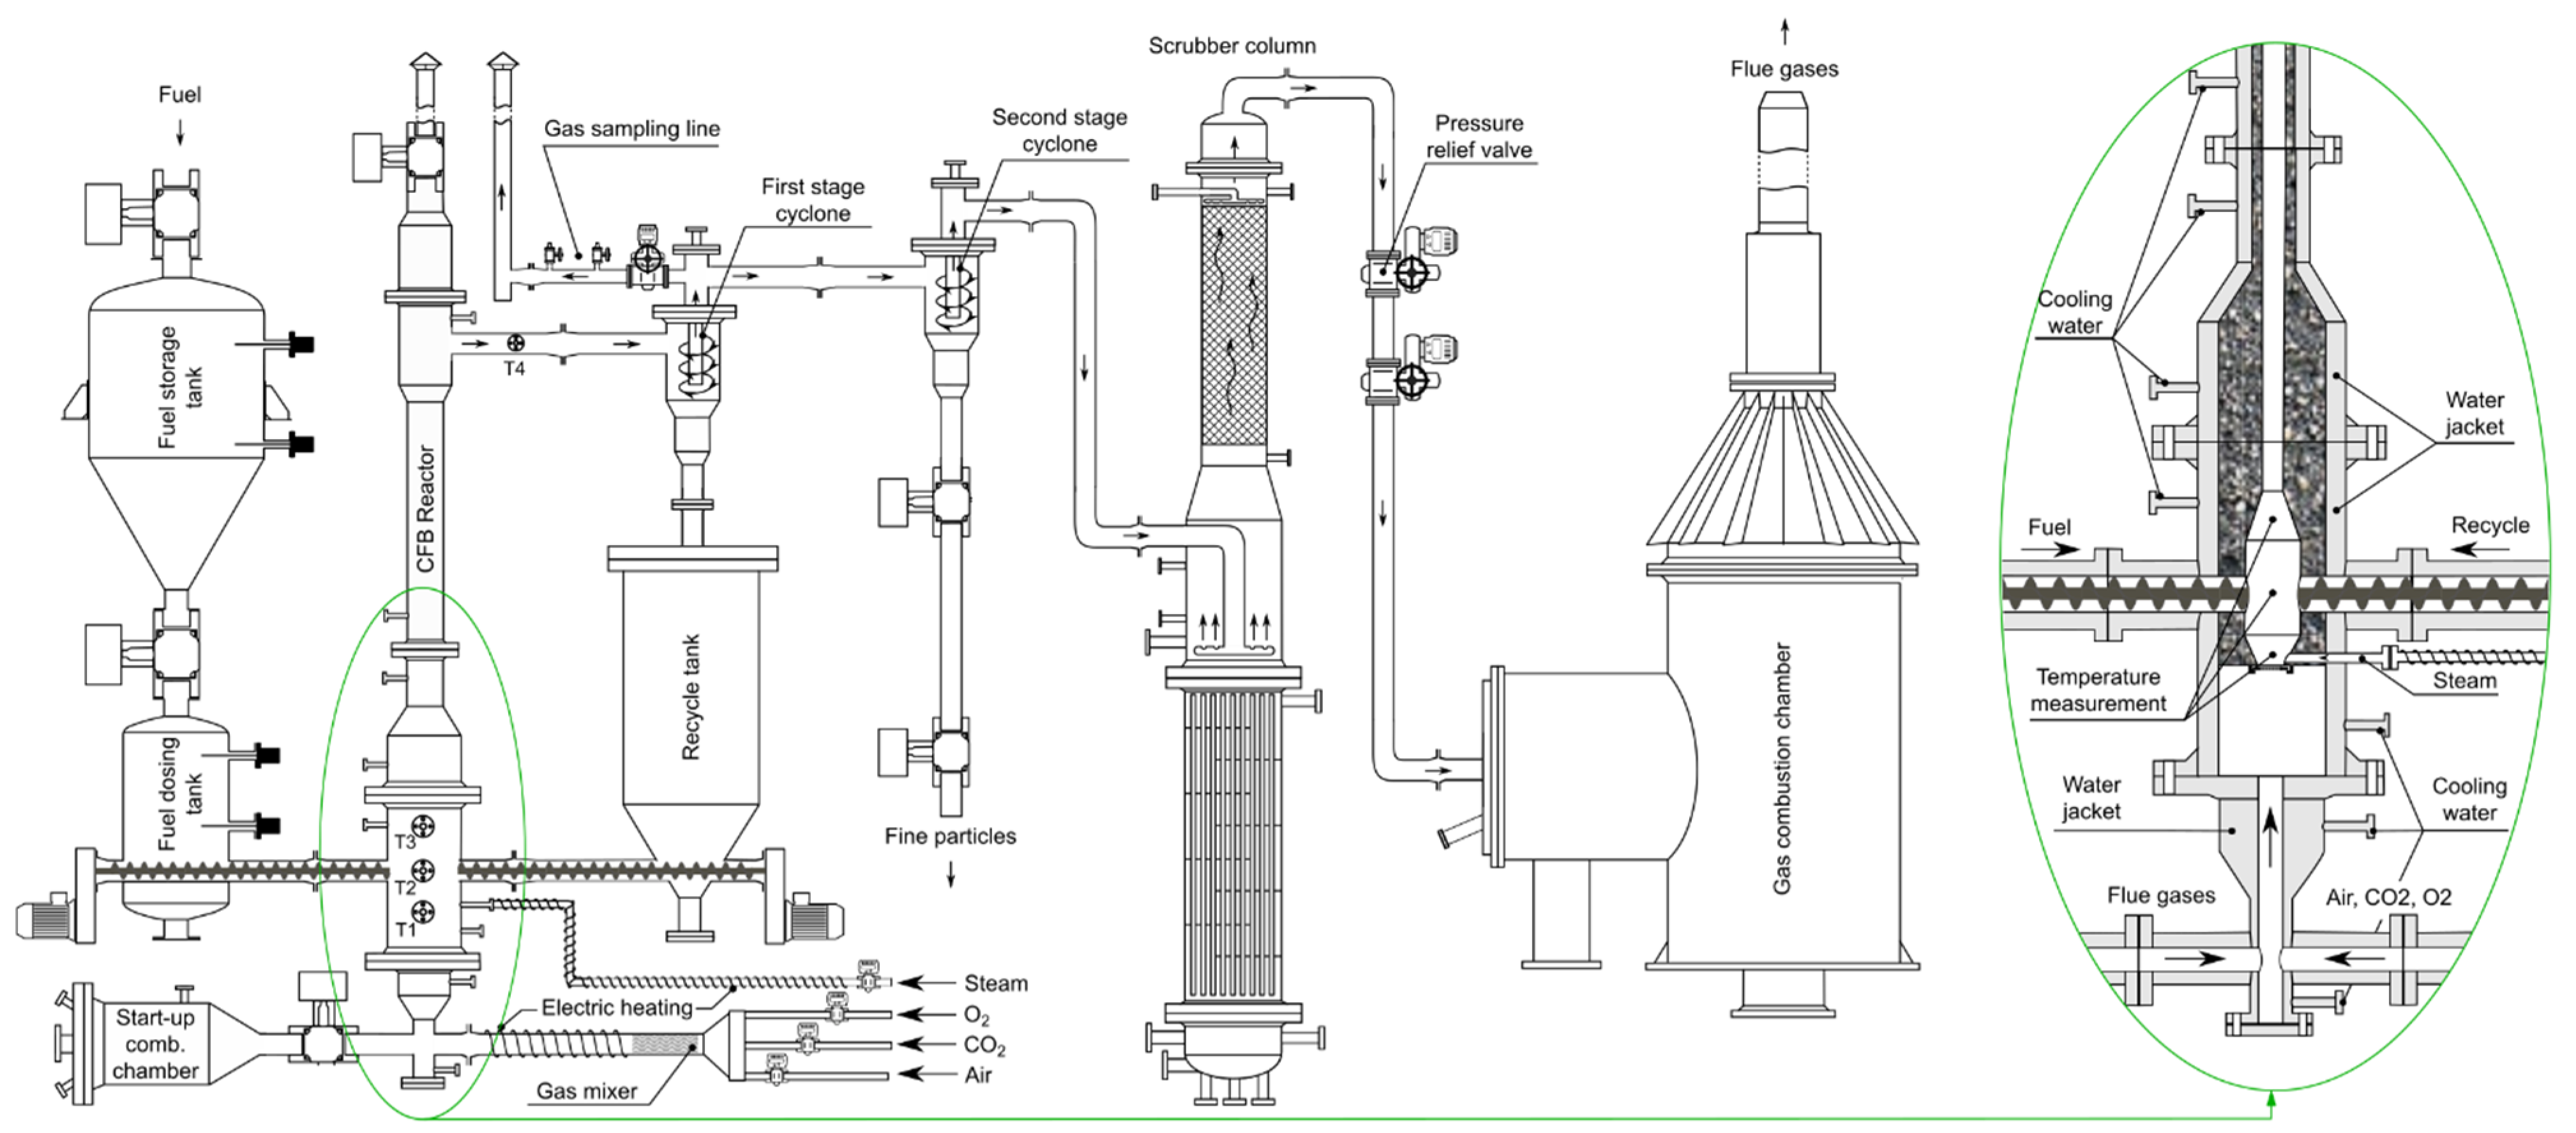
To determine the exact composition of the producer gas, as well as the content of higher hydrocarbons, the gas was sampled, collected in Tedlar bags and later analysed with gas chromatography (GC). Gas composition determined through GC was used during subsequent steps of data analysis as well as calculation of mass and energy balances. Thus, only the results from GC are presented hereafter. The sampling was conducted with the use of the hot gas sampling line, located after the first stage cyclone. The line was equipped with an independent temperature and pressure regulation system which thus provides means for isokinetic sampling from the pressurized installation. Within the HtF experiments, the sampling was performed at ca. 400 °C and 10 kPag. Schematic representation of the gas sampling line is depicted in Figure 1.
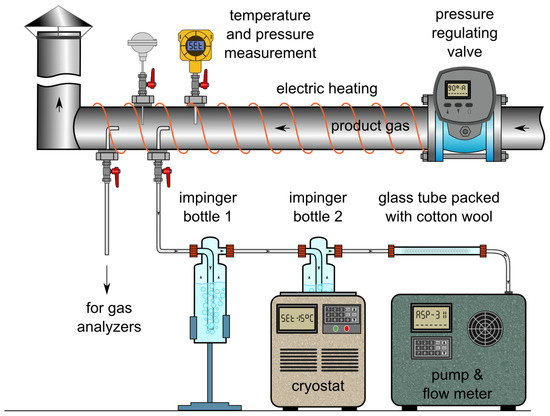
Figure 1.
Sampling line integrated with the pressurized gasification reactor.
The gas samples from Tedlar bags were analysed without pretreatment, using a Varian CP3800 GC coupled with a flame ionization detector and a thermal conductivity detector. This setup allows for successfully determining the basic composition of the producer gas. All qualitative and quantitative analyses were performed with external gas standards.
2.3.2. Water, Solids and Tar Analysis
From the same sampling point, producer gas was also sampled to determine its water, tar and particulate matter content. The sampling system consisted of a probe, two impinger bottles and a tube filled with cotton wool. The probe was introduced axially into the low-pressure hot-gas line, upstream of the sampling port used for the determination of gas composition. The end of the probe was connected to two impinger bottles, each containing about 50 mL of isopropanol. The first bottle was kept at ambient temperature while the second was cooled in cryostat down to −15 °C. In the first bottle, most tar and dust were collected, while the second recovered the remaining light organics and water. The glass tube filled with cotton wool at the end of the probing set acted as a droplet collector and protected the gas pump and flow regulator used during the sampling.
To determine water content in the gas, the Karl Fischer method was applied [15,36].
Solid particles collected in the isopropanol solutions were filtered off, washed with an additional portion of isopropanol, dried until a constant mass was reached, and weighed. Subsequently, the isopropanol liquid solution was directed for the determination of tar content.
Analysis of the tar was performed in two stages. Firstly, the mass of gravimetric tars was measured after the evaporation of the solvent under reduced pressure (0.1 bar, 80 °C) and final drying until a constant mass was reached. The obtained liquid isopropanol solution was tested on GC for qualitative and quantitative analysis of light organic fraction. A sample of gravimetric tar was further dissolved in fresh isopropanol and analysed on GC to determine the amount of light organic fraction remaining in the gravimetric tar. The sum of the organic species found from the second GC analysis was deducted from the measured gravimetric tar, thus giving the real amount of heavy tars that are not visible on GC and the light tars which are quantifiable through GC.
For mass and energy balances, an approximation of elemental composition (CHNS) and HHV of light tars was taken from the lighter of the two analysed GC tars, while the heavier were respectively applied to gravimetric tars. The conditions and procedure of the above-mentioned analysis stand for the definition of tars adopted in this research.
2.3.3. Composition of Solid Particles in Producer Gas
Solids from syngas were periodically recovered from the collection tank underneath the second stage cyclone. After weighing, the samples were analysed for their proximate and ultimate parameters similar to ones performed on feedstocks (Section 2.1).
3. Experimental Installation
The installation used in HtF to perform research on the pressurized gasification of waste biomasses is located in IChPW’s Clean Coal Technology Centre in Zabrze, Poland. A central part of the installation is a CFB reactor designed for O2/CO2/H2O gasification of solid fuels at elevated pressure (15 barg and 1000 °C).
The installation presented in Figure 2 is a PDU of maximum 800 kWt power (fuel chemical energy). It consists of an autothermal CFB gasifier, a continuous biomass feeding system, a bed material recycling loop that is controlled by a mechanical screw feeder, a set of two cyclones, two separate systems for the preparation of primary gasification agent and generation of steam, respectively, a gas cleaning system, a pressure regulation system, and a gas combustion chamber used for the safe utilization of the producer gas. All subsystems of the installation are designed to be operated continuously under pressurized conditions, including necessary control, measurement and regulation that are collectively governed by a supervisory control and data acquisition (SCADA) system.
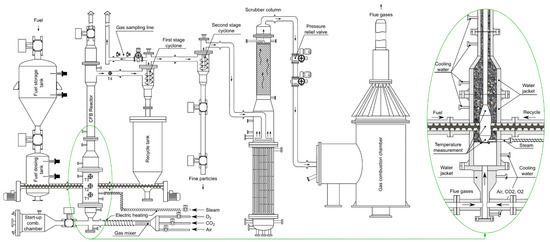
Figure 2.
Schematic representation of the CFB installation.
The heart of the installation is a CFB reactor. It is a pear-shaped reactor coupled with a riser and a recycle cyclone. Recirculation of bed material is controlled by a screw feeder, which feeds the bed material from a collection tank located underneath the recycle cyclone back to the reactor. Producer gas cleaned off from the coarse solids enters a 2nd stage, a high-efficiency cyclone for the removal of fines. The design of the reactor triggers two distinctive fluidization regimes: a stable bubbling bed attained in the widened bottom part of the reactor, and a fully developed, turbulent fluidized bed in the narrowed-down riser.
The fuel feeding system consists of two hoppers separated from each other and the atmosphere by ball valves. This arrangement allows for continuous feeding to the reactor during operating in over-pressure while reducing the danger of producer gas leakage. A small stream of nitrogen is introduced continuously to the upper fuel tank as a purge. Char separated in the second cyclone is stored and gradually cooled in a discharge pipe mounted underneath the cyclone.
For start-ups, the reactor is connected to a combustion chamber that is fuelled with natural gas. During this time, the reactor is empty, and the bed inventory is stored in the recycle tank. This allows for gradual and safe heating of the complete CFB system.
The longitudinal profile of temperatures inside the reactor and freeboard is measured using four K-type thermocouples. Locations of the thermocouples are noted on the schematic diagram of the reactor (Figure 2).
In HtF tests, the gasifying agent was fed to the bed through a flat distributor at 30–40 °C. Superheated steam at 210 °C was fed directly into the bed, 50 mm above the grate, via a separately heated feeding line. The flow rates of air, O2, CO2 and N2 were measured independently using Bronkhorst EL–FLOW SELECT mass flow controllers. The flow rate of steam was measured in parallel with a Kobold Messring BGN rotameter and Endress-Hauser Provirl flow meter, respectively, for flow rates of steam < 22 kg/h and >22 kg/h.
3.1. Method and Operating Conditions of the Pressurized CFB Reactor
Start-ups of the installation are performed by heating the reactor and material of the bed using flue gases produced in a start-up combustion chamber. After initial preheating up to 300 °C, a small stream of fuel is fed into the bed, to initiate a combustion process in the CFB and further heat the system. To facilitate quick and controlled ignition of the feedstock in the fluidized bed material, the flue gases are mixed with pure oxygen. Following this, the stream of flue gas is replaced with inert fluidizing gas; in the HtF project, CO2 was used for this task. When stable combustion in the reactor is achieved, with bed temperatures of about 750 °C, the stream of fuel is increased, and the gasification process can be started. For this unit, it takes approximately 6 h to reach a stable, autothermal gasification process from a cold start-up.
The following list of common assumptions and goals was set for all conducted experiments:
- Maximum temperature of the bed: 850 °C.
- Gasification pressure: 1 and 5 barg.
- Reactor input capacity: 130–140 kWt (1 barg), 360–400 kWt (5 barg).
- In bed gas velocity above 0.75 m/s, which corresponds to a fluidization velocity above 6 m/s in the riser.
- The ratio of water input (steam + moisture from fuel) related to carbon in the fuel (H2O/C) close to 1.
3.2. FB Gasification Efficiency Indices
In conventional gasification systems where air/H2O or O2/H2O mixtures are used as gasifying agents, process indices are well established and successfully allow for the comparison of different reactors and experimental conditions. However, when CO2 is applied for gasification, these indices need to undergo modifications to maintain similarity with their original meaning.
In this research, the following Equations (1)–(6) were applied to calculate the air–fuel equivalence ratio, total water-to-fuel/carbon ratio, CO2-to-fuel/carbon ratio, cold gas efficiency (CGE), hot gas efficiency (HGE) and carbon conversion efficiency (CCE), respectively.
As was previously mentioned, Boudouard and reverse water–gas shift reactions are the main pathways through which CO2 influences gasification systems. Both reactions are endothermic, produce CO and consume H2.
To analyse this influence, the following Equation (7) was used as a convenient method to follow the trend of H2/CO production:
4. Results and Discussion
4.1. PDU-Scale Gasification
The results presented hereafter should be viewed as taking into account the previous small-scale gasification experiments [27]. The lab-scale tests indicated the following issues as potentially most problematic:
- Small and large amounts of agglomerates observed in bed material recovered after the bark and lignin gasification runs, respectively;
- Fragmentation of fuel particles and a large amount of produced fines from gasification of bark and lignin leading to conversion losses;
- Increase in the intensity of agglomeration of the bed resulting from increasing streams of feedstocks leading to unstable gasification runs at higher pressures;
- Quick and uncontrollable defluidization and sintering of the bed upon changes of system pressure;
- Separation of size fractions of bed material inducing lower homogeneity of the temperature profile registered in-bed while finally leading to defluidization in the bubbling section.
The goal of this research was to verify the operating parameters and characteristics of HtF feedstocks under CFB conditions, higher process pressures and in a different reactor design. For this application, the CFB design is thought to be advantageous due to its maintaining a less-dense bed, longer contact times and higher attrition of agglomerates forming in the process. Moreover, a larger inventory of bed material helped to test the theory of the maximum allowable ash concentration as one of the leading factors influencing the bed defluidization phenomena. This theory states that only after a minimum concentration of a liquid-phase fraction of ash is reached in the bed material will defluidization be observed [26]. Moreover, continuous separation and recovery of the agglomerates are also easier in industrial CFB conditions than BFB.
At the PDU scale, all tested feedstocks were gasified at 1 and 5 barg and for all tested process conditions a set of stable gasification parameters was achieved. Interestingly, particularly in the case of lignin and the blend, the research conducted at the lab scale did not indicate this to be possible.
Results of the gasification experiments are presented in Table 3. The results are values averaged over balancing points which were performed over the duration of at least 2 h. Balancing points at a given set of temperature and pressure conditions were performed only after the reactor had attained and maintained stable operation for at least 1 h. The stable operation of the reactor was defined as the variation of any of the reactor’s temperature measurements (T1-T3) < ±10 °C from the setpoint value.
Table 3.
Results of experimental test runs, process efficiency parameters and indices.
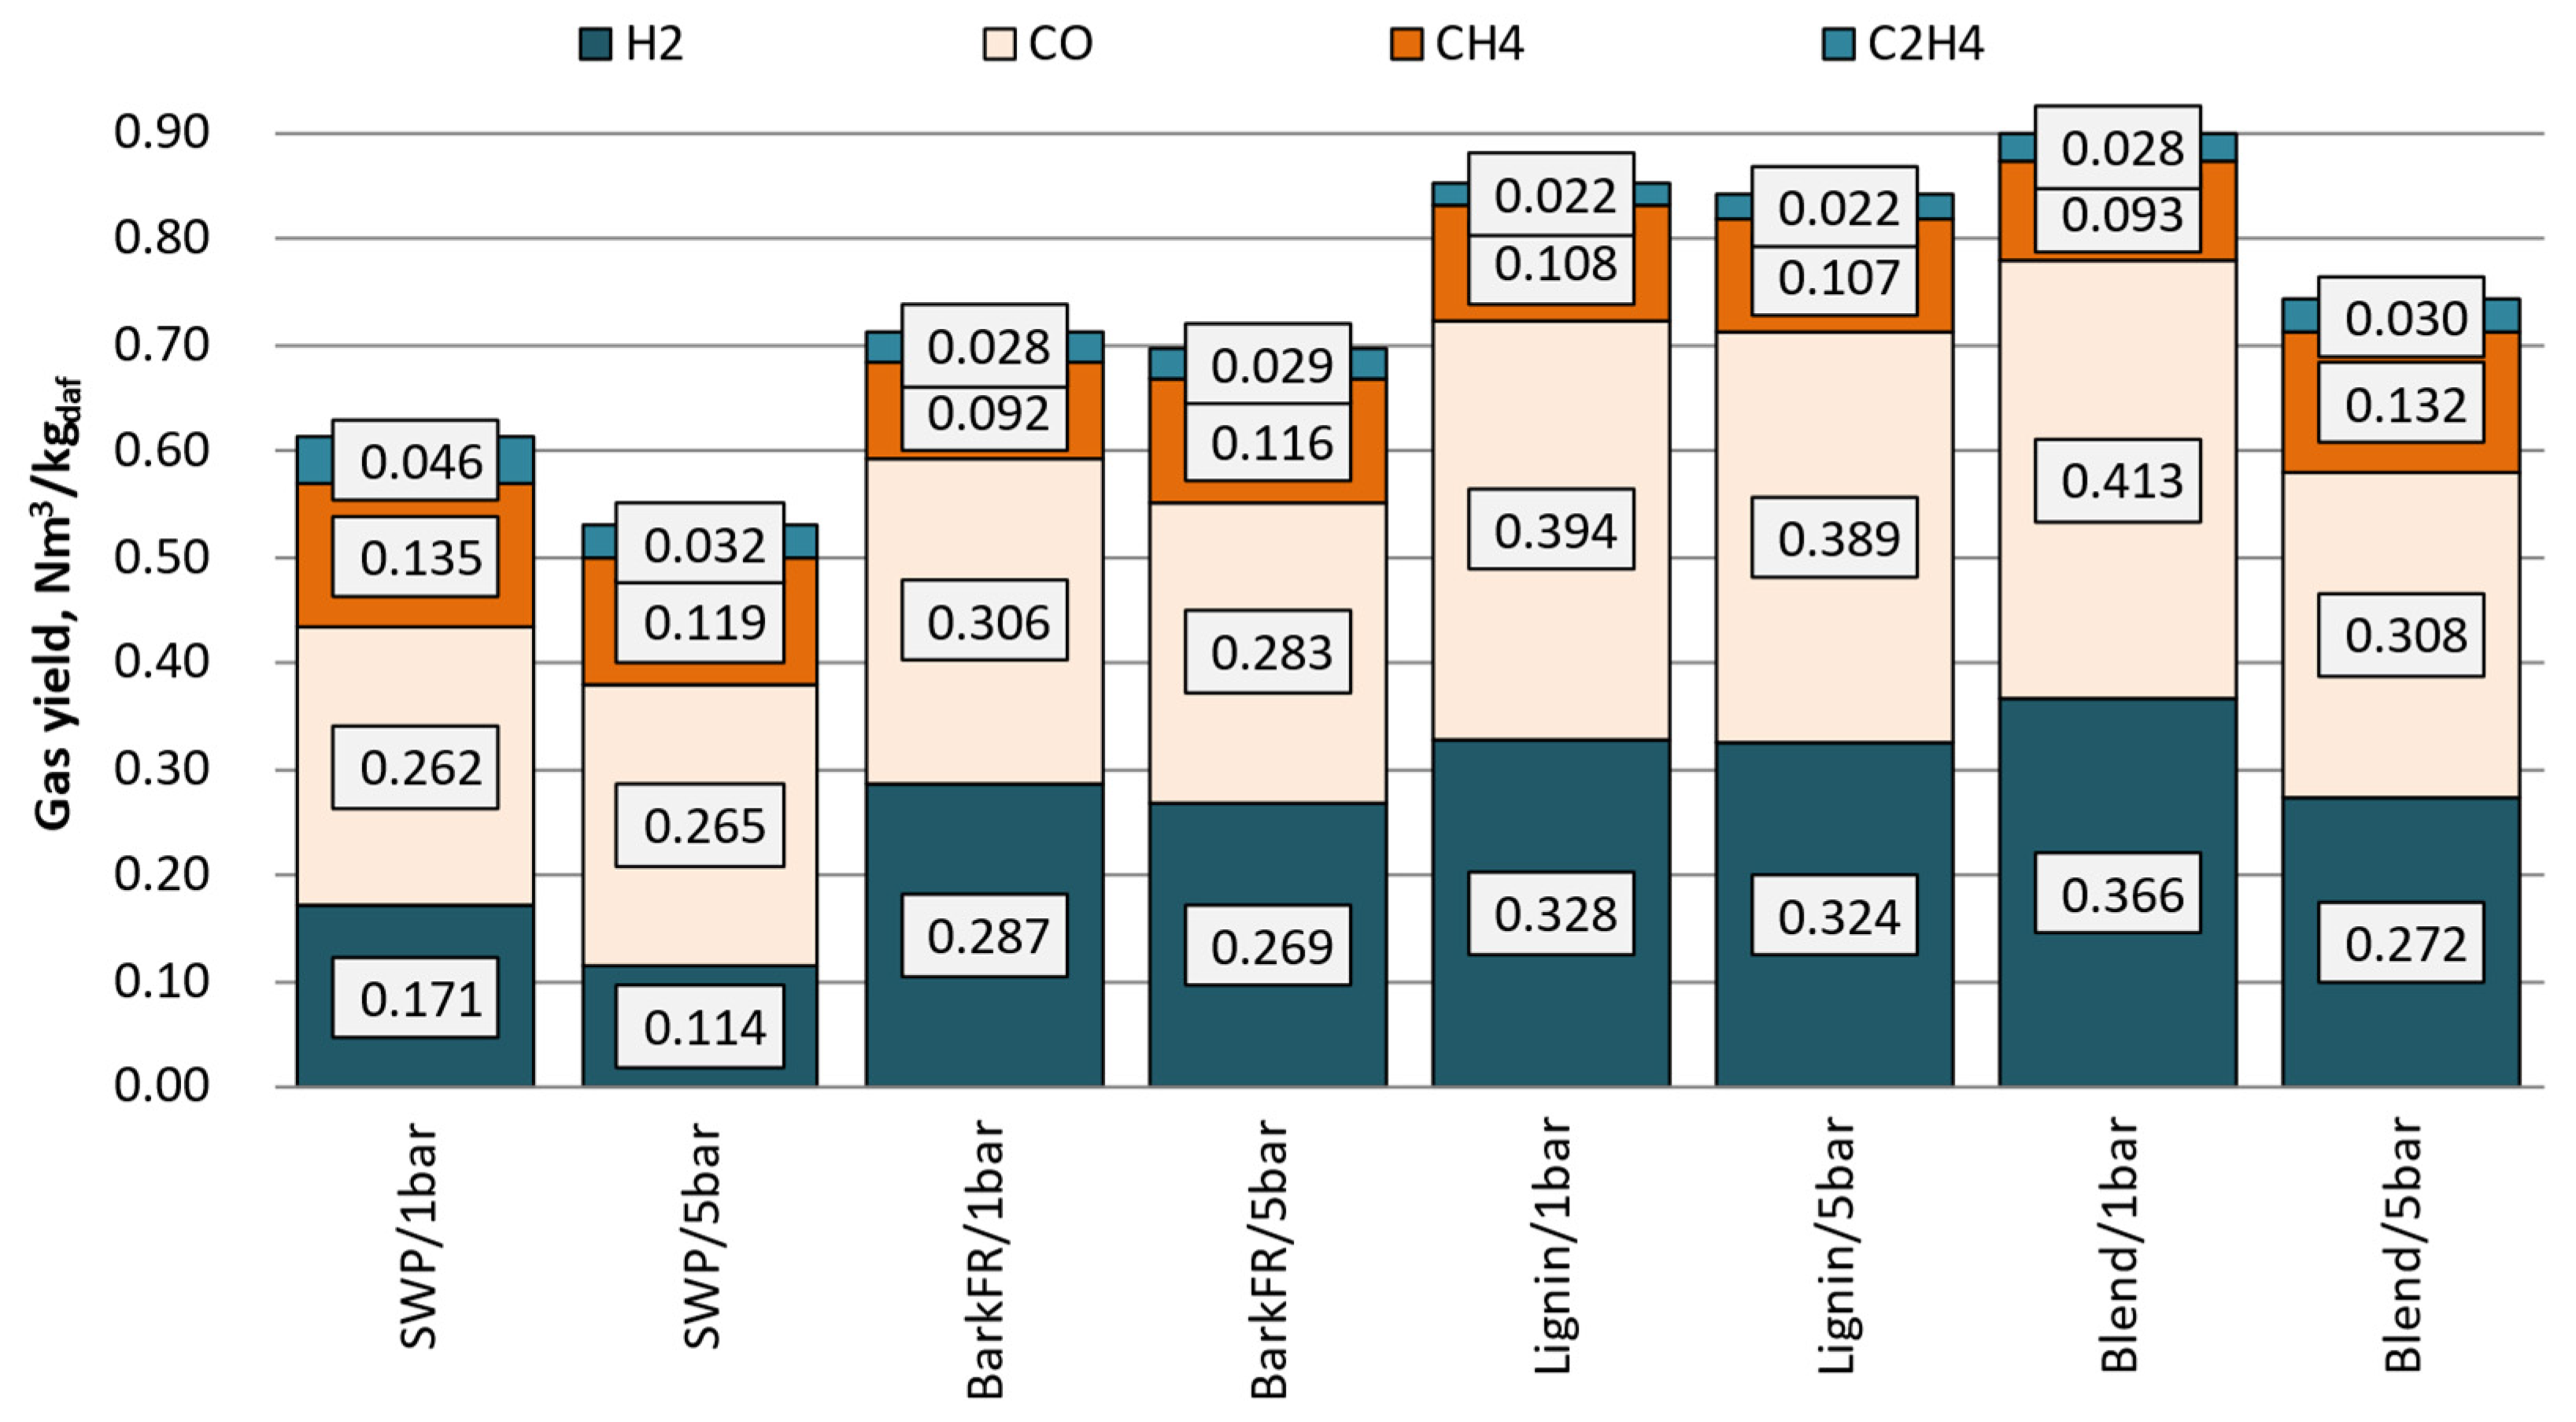
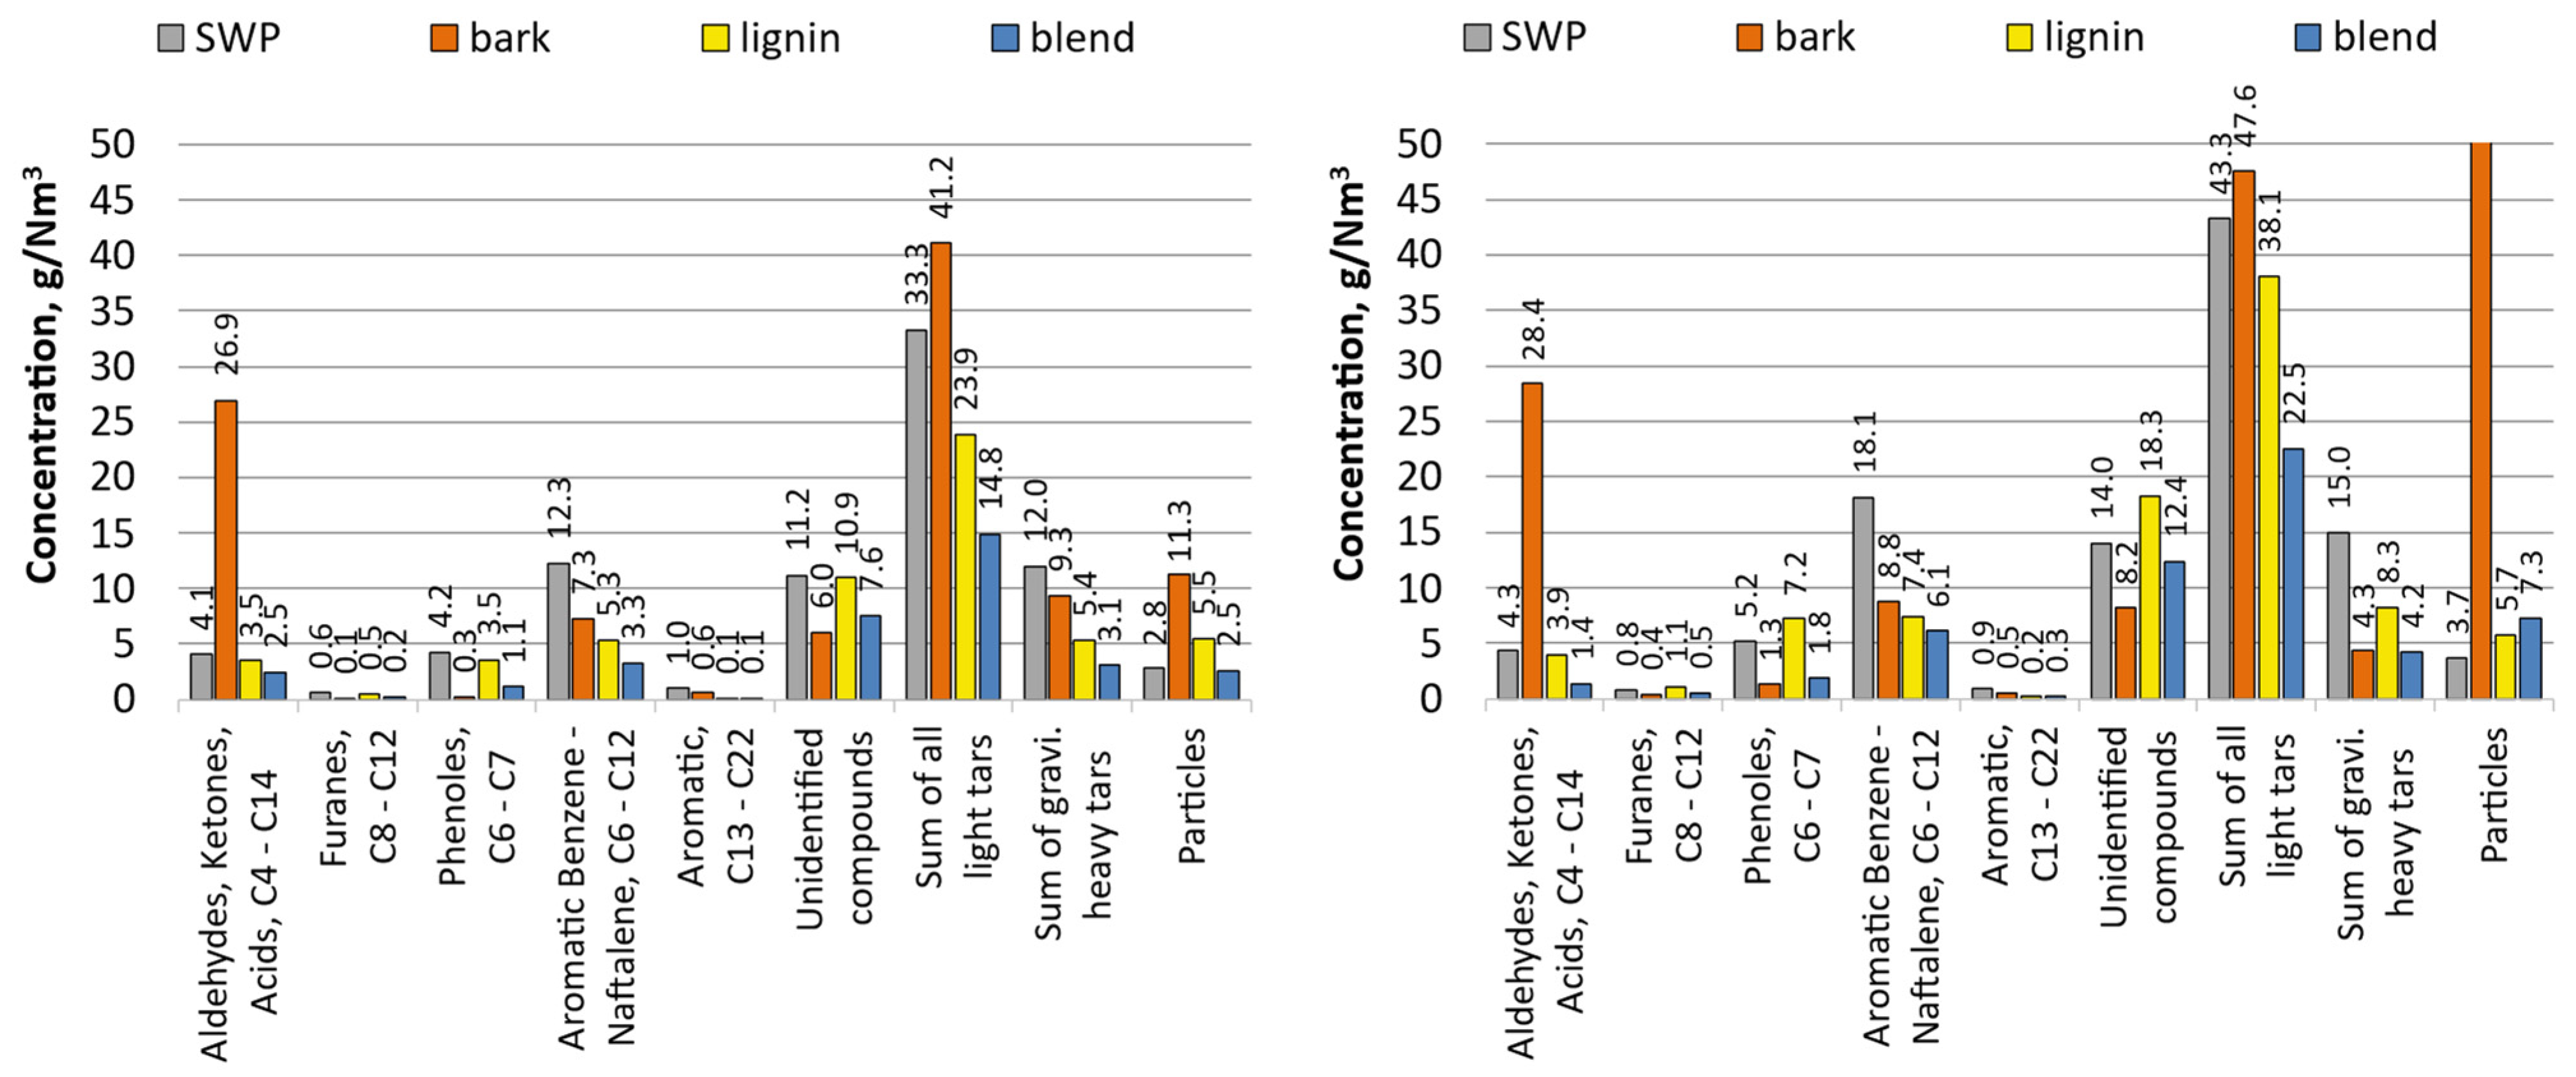
Figure 3 presented below displays the producer gas composition after recalculation to a CO2-free basis. This action brings the producer gas composition closer to ‘dry-state conditions’, which is the reference state conventionally used to report gas composition from gasification runs where air/O2/steam mixtures were used. Moreover, Figure 4 presents the compositions of organic contaminants (grouped into fractions) of the gas that were measured for 1 barg and 5 barg tests, respectively.

Figure 3.
The yield of the main constituents of the producer gas.
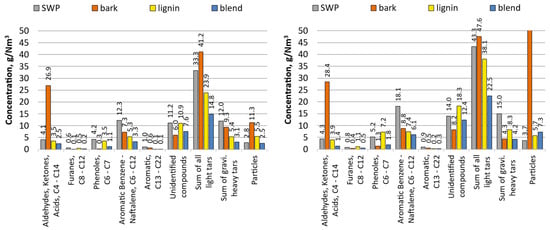
Figure 4.
Composition of tars with a division for the main classes of compounds for 1 barg and 5 barg tests (left and right, respectively).
In the PDU-scale experiments, no significant technological issues were noticed during the conversion of the feedstocks. Moreover, no substantiate agglomerates, meaning agglomerates of particle size larger than 2x the maximum size of the largest fraction of the fresh bed material, i.e., >1 mm, were detected after any of the tests (bed material was sieved after each experiment and fresh olivine was always used at the start). Also in these process conditions, no signs of destabilization of the bed were observed for any of the four tested feedstocks (analysed through observation of bed dP variation, bed temperature profiles).
4.1.1. Softwood Pellets
The benchmark was set here using softwood pellets. Stream and quality of producer gas from gasification of SWP did not fluctuate during any of performed tested points. It can be noticed that with increasing system pressure the concentrations of CO, CH4 and CO2 increased, while those of H2 and C2H6 decreased. All fractions of contaminants in the producer gas increased with increasing pressure. The change of solids, light and heavy tars were measured to increase for 30%, 25% and 33%, respectively. This trend was distinguishable throughout all analysed classes. Remarkably, the highest gains were primarily observed in the content of aromatic C6–C12 compounds (50% increase). This observation should be analysed keeping in mind that between each pressure point, as well as the streams of fuel, gasifying agent and recycle were increased. Therefore, in the constant volume reaction system, where the residence time (reaction time) was close to constant, the concentration of reactants increased remarkably, thus influencing the properties of producer gas and its contaminants.
4.1.2. Bark
Gasification of bark when performed at 850 °C showed no signs of agglomeration or defluidization of the bed. In contrast to the reference fuel, for bark, the increase in system pressure did not show any clear influence on the ratio of CO and H2 produced. An increase in all measured hydrocarbons (CH4, C2H4, C2H6), similar to the SWP, can be noticed. Overall, gasification of bark resulted in higher yields of gases and their total was less prone to variations related to changing the pressure of the reaction; bark: 0.71–0.72 Nm3//kgdaf (SWP: 0.54–0.62 Nm3//kgdaf).
Bark also yielded higher amounts of both H2 and CO and lower amounts of hydrocarbons, compared to SWP, which is indicative of a higher degree of conversion. This thesis can be supported by the calculations of process efficiency indices, which for bark increased with increasing system pressure. This opposes the observations conducted for the rest of the tested feedstocks. It is known that increasing the amount of ash material circulating in the bed inventory can influence conversion rates due to its catalytic activity; however, this characteristic was not observed for lignin or the blend, while both have higher ash contents than bark. Further research is needed to determine whether this feature is characteristic for bark and if there is an inflexion point for the efficiency increase.
Unfavourable fragmentation and production of fine particles observed for bark at the lab scale were also observed here. Four times larger flow rates of solids in producer gas were measured through both sampling and mass balance (char recovered from the 2nd stage cyclone of the PDU reactor). This extremely high stream of solids influenced the stability of gas sampling, hence obscured slightly the analysis of contaminants contained in the producer gas. In comparison to SWP, bark yielded a slightly smaller total sum of light and heavy tars, e.g., for the pressure of 5 barg, 51.9 g/Nm3 vs. 58.3 g/Nm3. Direct comparison of each class of tars shows that SWP yielded tars primarily rich in aromatic C6–C12 compounds, while gasification of bark resulted in tar abundant in light oxygenated aliphatic hydrocarbons. Also remarkable was that only for the case of bark was it possible to determine that with increasing system pressure the amount of produced heavy tar dropped.
Moreover, bark produced chars with the highest content of ash (ca. 85 wt.%). Nevertheless, due to the residual content of carbon and its HHV, the char cannot be managed through landfilling. The most frequently stipulated method for the valorisation of the chars from gasification of biomass is the recovery of its chemical energy through combustion, e.g., use for rising steam or supplying heat for other internal processes. The second frequently discussed application is the use of char as a soil improver; however, here a detailed analysis of ash chemistry and its leaching behaviour is necessary. The qualitative and quantitative analyses of chars recovered from other feedstocks differed mainly in the amount of ash content and volatiles, and only to a smaller degree in their CHNS. All the details of the proximate and ultimate analysis of chars are listed in Table 4.
Table 4.
Physicochemical analysis of chars from the second stage cyclone.
4.1.3. Lignin
Gasification of lignin was performed at slightly lower temperatures (830–840 °C). During both experiments conducted, no signs of defluidization of the bed or agglomeration of ash were noticed. The reactor operated smoothly with no pressure or temperature fluctuations. Moreover, between any of the test points, the stream and quality of producer gas did not differ by a significant margin. This opposes the observations from previous BFB experiments [27].
For lignin, the increase in system pressure did not influence preferentially the yield of any of the main gas constituents. In general, lignin as a feedstock produced very high yields of producer gas (highest from all measured for 5 barg). The gas was also preferentially rich in CO. In comparison to SWP, it was observed that lignin yielded much higher amounts of H2 and CO and similar amounts of hydrocarbons. The yields of H2 and CO surpassed even those measured for bark.
For lignin, a univocal increase in the productivity of tars (in all classes) can be noticed under the action of increasing gasification pressure. Also for this case, the difference in the amount of produced tars between gasification at 1 and 5 barg was the highest from all tested feedstocks (rise of 58%). The highest gains were noticed for phenols and furans, which increased by 106% and 102%, respectively. At the same time, for all tested pressures, the concentration of particulate matter remained at a similar level (5.5–5.7 g/Nm3). Regarding the analysis of classes of organic species building the tars produced from lignin, their composition and respective shares were similar to those of the tar produced during the gasification of SWP. However, SWP tars were richer in the aromatic C6–C12 fraction.
4.1.4. 85/15. Blend of Bark and Wheat Straw
One of the key reasons for conducting the experiments described here was to validate the efficiency of the ‘blending’ method at the PDU scale. From lab and bench-scale experiments, it was known that the chemical reaction between ashes of the two constituents of the 85/15 blend takes place, but at the same time in the gasification conditions of the continuous BFB, bench-scale experiments, a significant propensity for production of agglomerates was noticed. Hence this characteristic needed to be verified in the PDU scale as well.
Similarly to lignin, to keep better control of the process, the maximum temperatures of the bed were reduced (810–820 °C) here as well. Interestingly enough, when compared to bench-scale BFB tests, during all of the PDU-scale experiments, no signs of defluidization of the bed or agglomeration of ash could be noticed. Moreover, the fuel characteristics of the blend were far superior to those of lignin as far as ease of start-up, process stability and response to control actions are concerned. The blend also produced the highest yields of gases for all test runs conducted at 1 barg. Similarly to SWP, the gas productivity dropped remarkably as the pressure was increased. Concerning the hydrocarbon content of the producer gas, a remarkable similarity with the stand-alone bark can be noticed. Finally, it can be noticed that the inclusion of straw into a blend with bark also greatly enhanced the productivity of CO and H2.
As the process conditions between lignin and blend gasification tests were very similar, it is also interesting that the blend provided a higher carbon conversion and overall process efficiency figures. The mixed characteristics of ashes from bark and straw were clearly beneficial for the gasification process, and because no agglomeration issues were observed it is even more interesting to pursue the use of the blending method as a way to broaden the uptake of agricultural feedstocks for the production of energy and chemicals.
It cannot be unnoticed that gasification of the blend yielded by far the cleanest producer gas as far as the content of tars is concerned, as well as greatly lowered the yield of fines. This was noticed beforehand for the sole gasification of bark (runs 3 and 4). Moreover, the characteristics of classes of tars from the blend resembled more closely those analysed from SWP or lignin, than those from bark; no significant concentration of light aliphatics were measured.
4.2. Application of the Producer Gas from CO2 Gasification in Synthesis
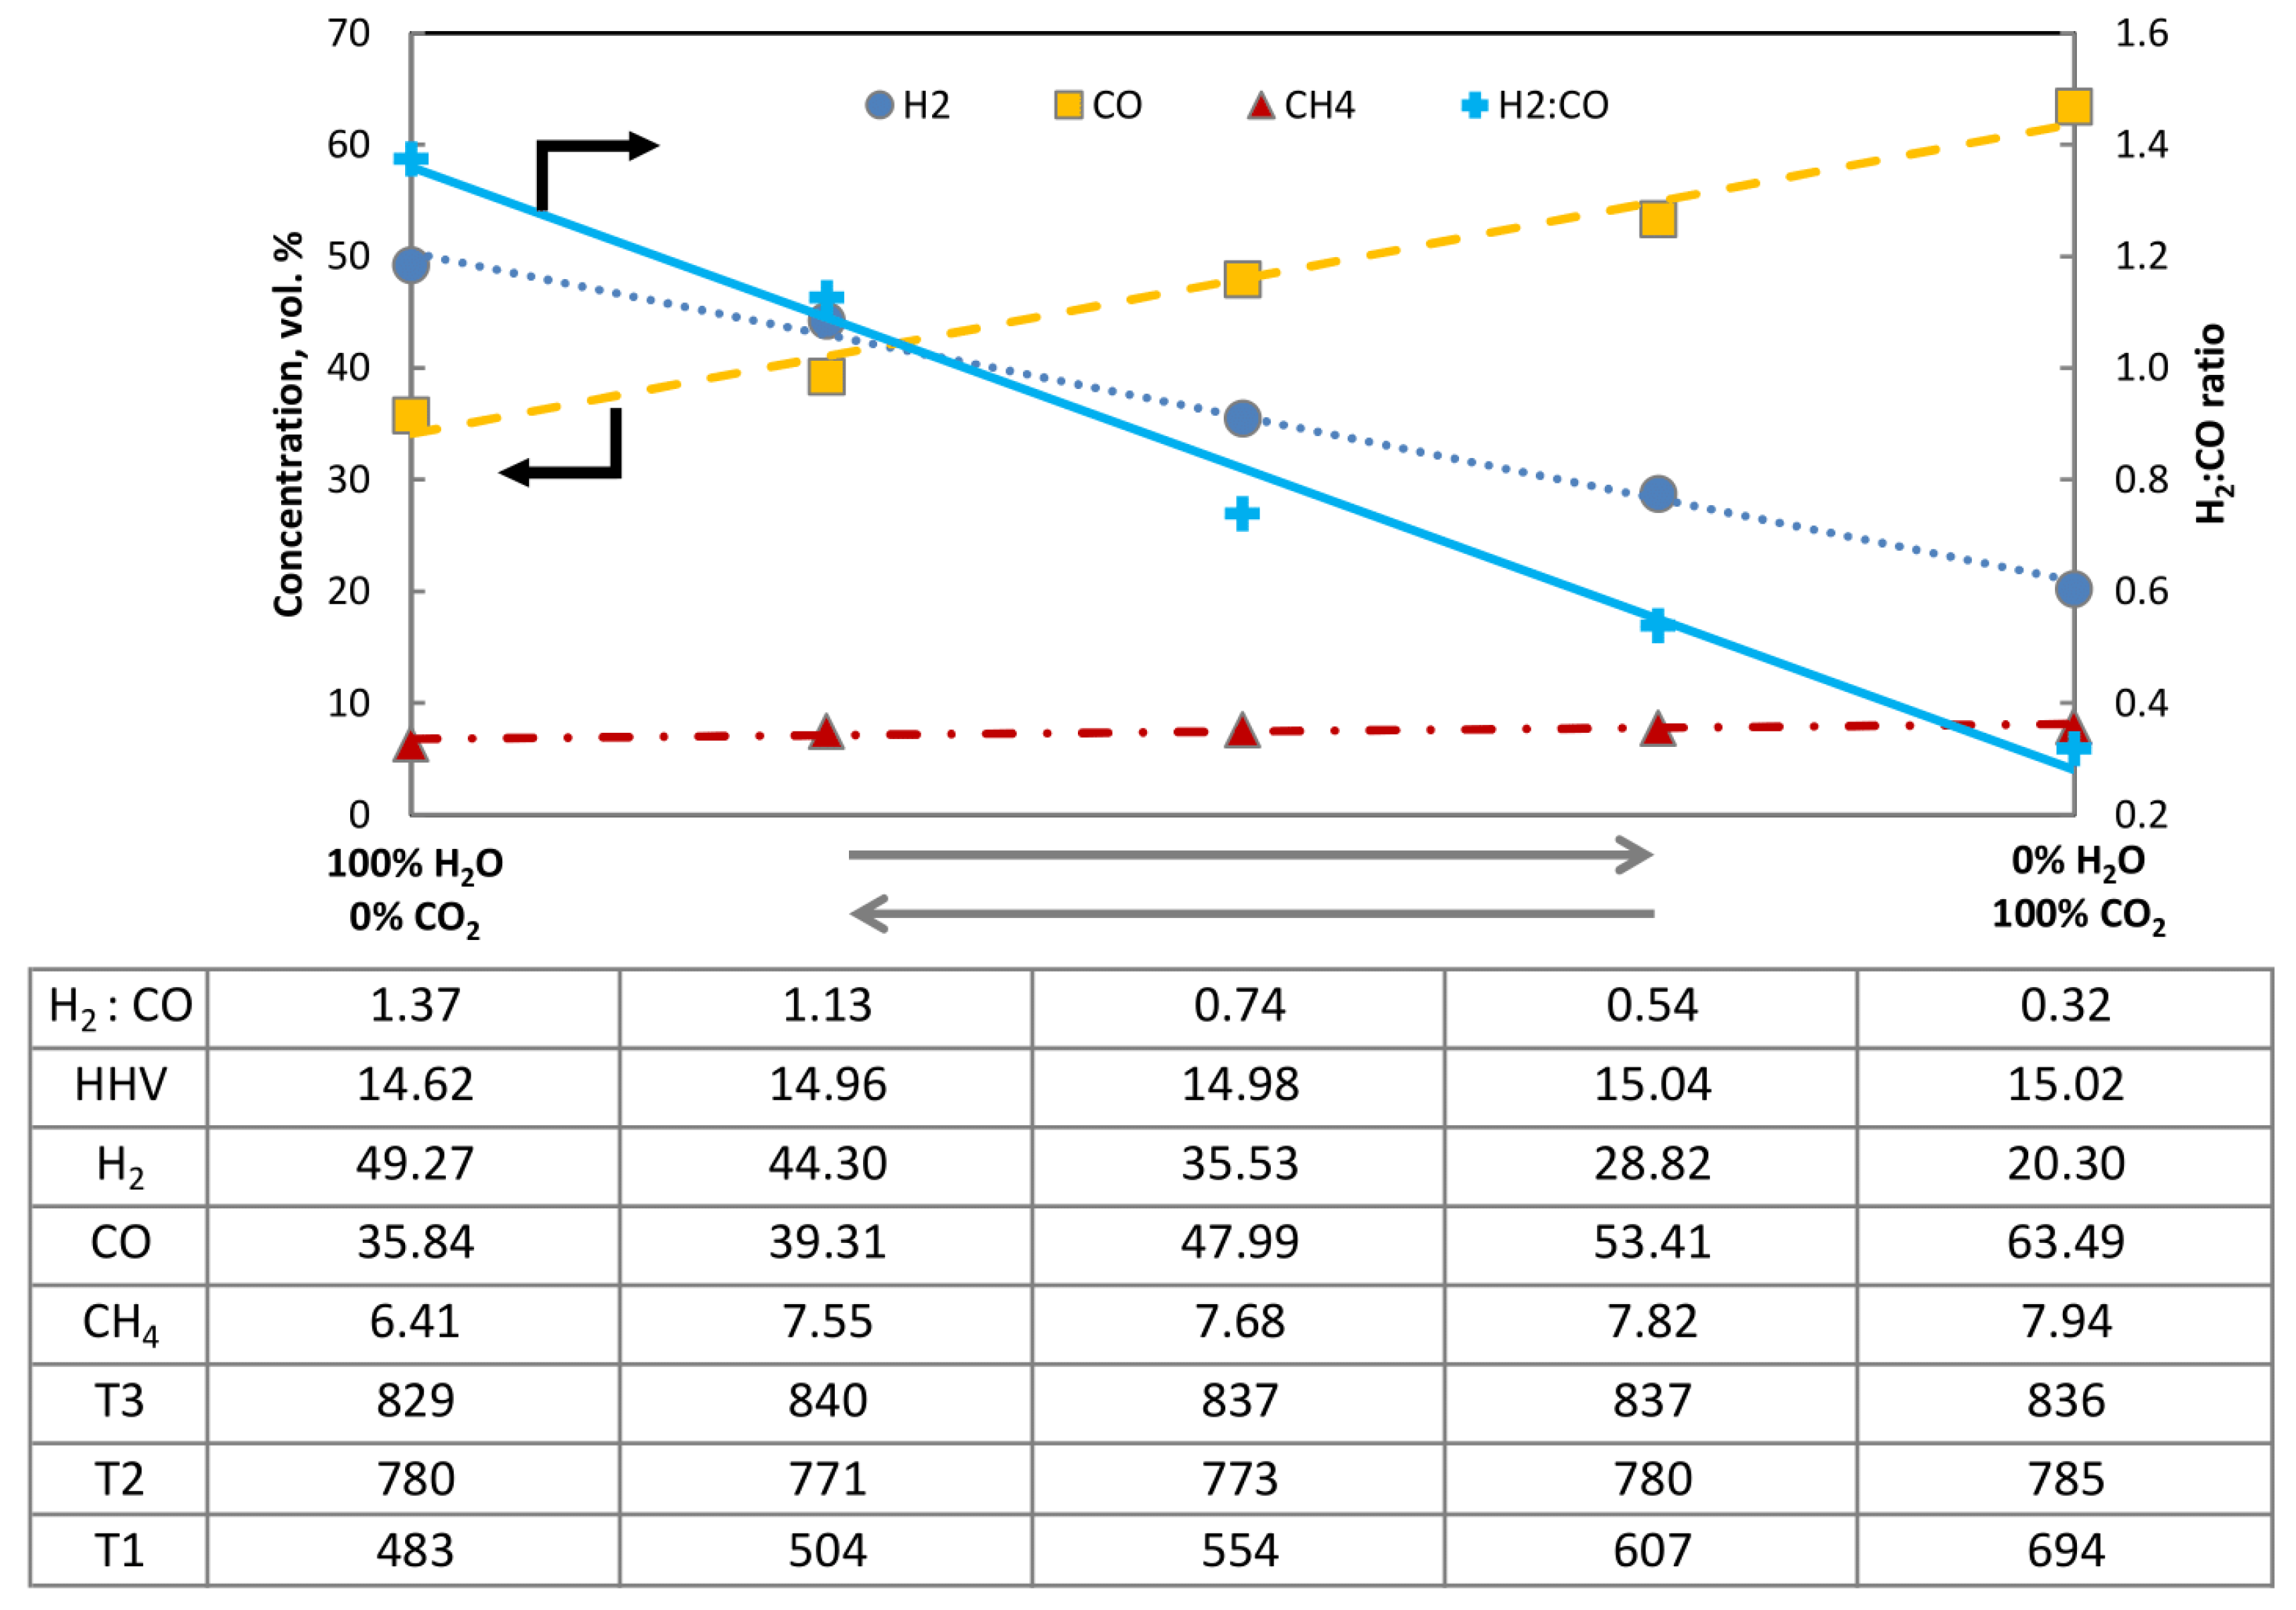
To perform a synthesis of chemicals from producer gas, it first needs to be upgraded to syngas and, depending on the application, a certain ratio of H2/CO needs to be assured. In the case of FT synthesis, it is preferable for the ratio to slightly exceed 2. Under conventional gasification conditions, with the use of oxygen and steam as gasifying agents, and a mildly catalytic bed material such as olivine or CaO, this goal is often attainable without the use of additional water–gas shift reactors. However, in the experiments presented here it was shown that the addition of CO2 has a substantial effect on the yield of H2. Experiments 1–8 were carried out with ratios of H2O to CO2 from 0.3–1.37, while for most a ratio of 1:1 was kept. The highest ratio of H2/CO = 0.95 was obtained for gasification of bark when the H2O/(C + CO2) was equal to 0.61 (H2O/C = 1.03). Lignin and the blend were a little bit more resistant in producing H2. Interestingly for SWP, increasing the amount of steam present in the system had a very small influence on the productivity of H2 when compared to other fuels tested. For SWP a small ratio of H2/CO = 0.43 was obtained using a ratio comparable to that in bark H2O/(C + CO2) = 0.6. H2 productivity of SWP looked even worse taking into account that during Test 1, the ratio of CO2 to H2O used was much higher and still yielded higher amounts of H2 than during Test 2.
To illustrate this problem, the following Figure 5 was prepared. The graph depicts the changes of the main constituents of the producer gas on a dry and CO2-free basis as a function of the composition of the gasifying agent. The right-hand side of the figure presents the producer gas composition obtained during autothermal gasification of bark in the CFB reactor where O2/CO2 was used, while the left-hand side provides information about the composition obtained using O2/H2O as a gasification mixture. The amount of O2 between the two extremes was not regulated, as the max temperature of the bed did not show a tendency to change.
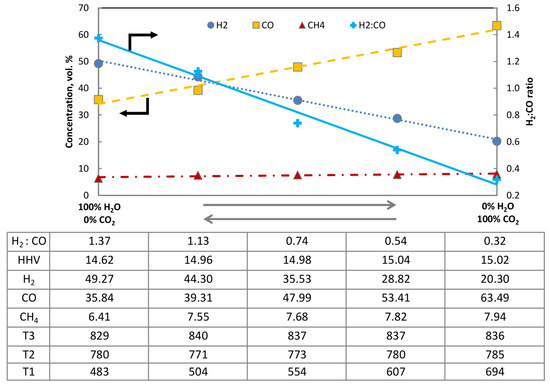
Figure 5.
Composition of dry, CO2-free producer gas under varying compositions of gasifying agent O2/H2O–O2/CO2 (bark, 850 °C 1 barg).
It is quite conventional that steam gasification of biomass performed in an auto-thermal reactor can produce a ratio of ca. 1.4 H2/CO, obtained using H2O/C of 1.48, while allothermal or dual fluidized bed reactors can exceed the threshold of 2. In the opposite scenario, where O2/CO2 was used for gasification, the resulting ratio of H2/CO dropped to 0.32, while the CO2/C of 3.55 was used. Interestingly gasification under CO2 also led to a slightly higher productivity of hydrocarbons, which can be attributed to lower rates of dry-reforming reactions. The data table presented above also contains information regarding the change of bed temperatures measured. The placement of the thermocouples T1, T2 and T3 was denoted in Figure 2. The influence of changing the composition of the gasifying agents can be primarily noticed on the thermocouple T1, while the temperature fluctuations measured on T2 and T3 were insignificant and did not differ from the standard operating characteristic of this reactor. Importantly, however, taking into account that the steam nozzle is located in the near vicinity of the thermocouple T1, this variation should be primarily attributed to the design of the reactor and the physical act of feeding steam, rather than to the action of steam as a gasifying agent.
After the completion of all the experiments, it can be summarized that the influence of the use of CO2 and H2O on the temperature profile of the fluidized bed is similar. Both agents decrease the temperature of the bed due to the endothermic character of their related chemical reactions and tend to extend the temperature profile as a result of extending the fluidized bed. These characteristics should be taken into consideration when developing carbon-negative technologies for the future. Because changing the composition of a gasifying agent through the adaptation of the ratio of steam to CO2 used during gasification allows us to greatly influence the composition of the producer gas, the combined usage of these two gasifying agents provides gasification technology with a new degree of flexibility. Flexibility is the key to addressing the specific needs stemming from different applications, for adapting to the varying availability of external sources of H2 as well as the demand for H2 or other high-value commodities.
5. Conclusions
The main objective of the research on gasification presented here was to determine the impact of gasification pressure and CFB reactor configuration on the conversion of selected biogenic residues. Furthermore, the experiments allowed for validation of the blending methods as a means of enhancing the potential for thermochemical conversion of feedstocks of adverse ash chemistry.
All tested feedstocks were gasified under a mixed H2O/CO2/O2 atmosphere and in a similar gasification temperature. This was done to determine their propensity for production of producer gas with a high ratio and yield of H2 and CO. Finally, an experiment was also performed using gasifying agents of varying composition, where H2O was replaced by CO2 while keeping similar fluidization regimes. The resulting array of producer gas compositions showed that there exists a linear relationship between the gas compositions attainable using gasifying agents composed of varying ratios of CO2 and H2O.
These results further develop the experience gained during bench-scale gasification tests [27]. For all tested feedstocks no signs of agglomeration of ash particles or defluidization of the FB were observed. All three feedstocks showed advantageous gasification characteristics in terms of the stability and efficiency of the process. In the case of the PDU-scale tests, lignin did not show significant problems with fragmentation, which was the case during previous trials. Lignin and the blend also yielded the highest amounts of producer gas, thus proving their potential in extending the scope of feedstocks that can be used in biorefineries such as Heat-to-Fuel. The admixture of 15 wt.-% of straw to bark enhanced its gasification characteristics, particularly through lowering the amount of produced contaminants (tars and particulate matter), as well as increasing the efficiency of the gasification process and the quality of the produced gas. Finally, in every feature compared, all three feedstocks fared better than the reference SWP, while being cheaper and abundantly available on the market. These feedstocks are also in line with the postulated sustainable use of biomasses and resigning from using clean, high-quality woody biomasses as a source of energy or chemicals.
Advisable for the future is to continue research on the gasification of blends of barks with straws of higher mass ratios, in particular in Ca-looping conditions or combined processes of low-temperature gasification and direct combustion of hot producer gas.
The process data presented in this paper do not stand as the optimum gasification conditions for these feedstocks. The experiments were devised to test these biomasses under similar process conditions and hence leave great potential for further optimization.
Finally, the most important effect of the CFB tests is the experimental validation of the technical possibility for gasification of these three types of waste biomasses, in the conditions of elevated pressures of the process. The tests performed indicate that increasing the gasification pressure leads generally to:
- Lower total yields of producer gas;
- Increased yields of light hydrocarbons (methane–pentane);
- Higher yields of light GC-detectable tars, gravimetric tars, and particulate matter;
- A shift in the composition of tars from light aliphatic compounds towards heavier, aromatic compounds;
- A slight decrease in CGE while maintaining the HGE at similar levels.
The experiments conducted show that the chemical sequestration of CO2 through the gasification of biomass is technically feasible. However, the influence of the applied CO2 on the composition of the yielded producer gas is very high, and thus this may cause its utilization for chemical synthesis to be difficult or impractical. Therefore, it is paramount to integrate gasification units that use CO2 with external sources of hydrogen such as water electrolysers, APR, SMR, DMR or pyrolysis of methane.
The experiments performed also support the thesis that gasification pressure has a negligible effect on the agglomeration properties of ashes. It can be stipulated that with good control of the gasification process conditions, control of the quality of feedstocks and proper ash separation from the bed material, the problem of ash agglomeration of the three waste biomasses presented here can be controlled. Nevertheless, other important issues in the pressurized conversion of biomasses remain.
While thinking about the subject of the commercial-scale BtX, especially when performed in pressurized systems, we should always keep in mind, i.a., the problem of securing the availability of the feedstocks in large quantities and at an adequate quality as well as the pretreatment, handling, storage and feeding of these biomasses to gasifiers. Connecting this information with other technical problems with the operation of pressurized gasification systems raises the question of the relevance of this method.
For years now we have known that high-pressure (>35 barg) gasification of biomass is technically possible [3,10,37]. However, for the past two decades, we do not see any clear sign of technological or technical breakthroughs which would lead towards pressurized gasification units. Frankly, most such projects have ended up as failures (due to various reasons) in just a few years after their erection. These experiences and the lessons learned from them still do not render the pressurized BtX concepts less promising for the future, nor do they mean that, all things considered, they are the best possible solution. It is generally agreed upon that all unit operations performed on renewable feedstocks are more demanding than their counterparts of fossil origin. Moreover, for the conversion of biomasses, we cannot directly apply the methods and process development schemes known to have been working based on using fossil fuels. Hence, each of the above-mentioned small contributions induces renewable technologies to be more demanding, complicated, risky and more expensive.
When discussing the issue of the application of pressurized gasification systems in the case of the conversion of biomasses, the common term of the economies of scale needs to be related to the fuel and production characteristics of biomasses. Even when the economic reasons for the use of biomasses, or in fact against the use of conventional feedstocks, concretizes, we will still need to find answers for the problems of logistics, storage, handling, pretreatment and feeding of biomasses at large scales. Due to problems with the acquisition of enough quantities of biomass, no projections support the development of a large amount of large-scale (>200–500 MWt) gasification plants [38]. Hence, only for this reason, the economies of scale will find an upper limit, which inherently will also be related to the usefulness of performing the conversion at higher pressures. If after such a long time of developing biomass gasification systems operated at atmospheric pressure, we still find many of them lacking maturity for broadscale deployment, how can the more problematic pressurized units be smoothly taken up by the market?
At the moment, no clear answers can be given to address the problem of choosing the best solution between atmospheric gasification coupled with pressurized gas cleaning and synthesis on the one hand, and carrying out the whole gasification and synthesis process chain in pressurized conditions on the other. Only successful demonstration and proliferation of either one of the abovementioned concepts will resolve or redirect this discussion to new tracks. For the decades to come, it will probably remain more proper to develop thermochemical conversion systems where the gasification and rough cleaning of the producer gas is realized at atmospheric pressure, while the subsequent deep cleaning, reforming and synthesis will be carried out at elevated pressure conditions. Only in longer time frames does this technology have the potential to undergo technical and economical optimization, and the authors believe that in this process there will also be a place for complete pressurized BtX installations.
Author Contributions
Conceptualization, M.S.; data curation, M.S.; formal analysis, M.S. and J.Z.; funding acquisition, J.Z.; investigation, M.S. and T.I.; methodology, M.S. and T.I.; project administration, M.S. and T.I.; resources, M.S.; supervision, T.I.; validation, M.S. and J.Z.; visualization, M.S.; writing—original draft, M.S.; writing—review and editing, J.Z. All authors have read and agreed to the published version of the manuscript.
Funding
This project has received funding from the European Union’s Horizon 2020 research and innovation programme under grant agreement No. 764675 (Heat-to-Fuel).
Institutional Review Board Statement
Not applicable.
Informed Consent Statement
Not applicable.
Conflicts of Interest
The authors declare no conflict of interest. The funders had no role in the design of the study; in the collection, analyses, or interpretation of data; in the writing of the manuscript; or in the decision to publish the results.
List of Abbreviation and Subscripts:
| Symbols: | |
| λ | air-fuel equivalence ratio (AFER) |
| conversion [kg∙h−1/(kg∙h−1)] | |
| mass stream [kg∙h−1] | |
| mole stream [mol∙h−1] | |
| Cp | specific heat capacity [kJ/kg T] |
| dP | differential pressure, here ref. to the fluidized bed [Pa] |
| R | ash agglomeration index [-] |
| Q | heat [kJ∙mol−1] |
| U | fluidization velocity [m∙s−1] |
| X | mass fraction [-] |
| Indices: | |
| ar | as received |
| d | dry state |
| daf | dry-ash-free fuel |
| db | dry basis |
| g | gauge |
| in | inlet |
| ga | gasifying agent |
| mf | minimum fluidization |
| r. out | reactor outlet |
| pg | producer gas |
| Abbreviations: | |
| APR | aqueous phase reforming |
| bio-SNG | bio-synthetic natural gas |
| BtL | biomass-to-liquids |
| BtX | biomass-to-X (X stands for all commodities such as power, heat, liquid and gaseous fuels, chemicals) |
| BFB | bubbling fluidized bed |
| CCE | carbon conversion efficiency [%] |
| CFB | circulating fluidized bed |
| CGE | cold gas efficiency [%] |
| Characteristic ash sintering temperatures [°C]: | |
| IDT | initial deformation temperature |
| ST | softening temperature |
| HT | hemispherical temperature |
| FT | flow temperature |
| DME | dimethyl ether |
| DFB | dual-fluidized bed |
| FB | fluidized bed |
| FT | Fischer–Tropsch |
| GC | gas chromatography |
| GHG | greenhouse gas |
| H2O/C | Water/Carbon ratio |
| HGE | hot gas efficiency |
| HHV | higher heating value [J∙g−1] or [MJ∙(Nm3)−1] |
| PDU | process development unit |
| SCADA | supervisory control and data acquisition |
| SWP | softwood pellet |
| U/Umf | fluidization number, the ratio of actual fluidization velocity to min. fluidization velocity [m∙s−1/(m∙s−1)] |
References
- Thunman, H.; Seemann, M. The GoBiGas Plant. In Substitute Natural Gas from Waste; Elsevier: Amsterdam, The Netherlands, 2019; pp. 455–474. ISBN 978-0-12-815554-7. [Google Scholar]
- Biollaz, S.; Schildhauer, T.; Held, J.; Seiser, R. Production of Biomethane/Synthetic Natural Gas (SNG) from Dry Biomass–A Technology Review 2016. In Proceedings of the EUBCE 2016, Amseterdam, The Netherlands, 6–9 June 2016. [Google Scholar]
- Motta, I.L.; Miranda, N.T.; Maciel Filho, R.; Wolf Maciel, M.R. Biomass Gasification in Fluidized Beds: A Review of Biomass Moisture Content and Operating Pressure Effects. Renew. Sustain. Energy Rev. 2018, 94, 998–1023. [Google Scholar] [CrossRef]
- Fermoso, J.; Stevanov, C.; Moghtaderi, B.; Arias, B.; Pevida, C.; Plaza, M.G.; Rubiera, F.; Pis, J.J. High-Pressure Gasification Reactivity of Biomass Chars Produced at Different Temperatures. J. Anal. Appl. Pyrolysis 2009, 85, 287–293. [Google Scholar] [CrossRef]
- Xu, R.; Zhang, J.; Wang, G.; Zuo, H.; Zhang, P.; Shao, J. Gasification Behaviors and Kinetic Study on Biomass Chars in CO2 Condition. Chem. Eng. Res. Des. 2016, 107, 34–42. [Google Scholar] [CrossRef]
- Valin, S.; Ravel, S.; Guillaudeau, J.; Thiery, S. Comprehensive Study of the Influence of Total Pressure on Products Yields in Fluidized Bed Gasification of Wood Sawdust. Fuel Process. Technol. 2010, 91, 1222–1228. [Google Scholar] [CrossRef]
- Soreanu, G.; Tomaszewicz, M.; Fernandez-Lopez, M.; Valverde, J.L.; Zuwała, J.; Sanchez-Silva, L. CO2 gasification Process Performance for Energetic Valorization of Microalgae. Energy 2017, 119, 37–43. [Google Scholar] [CrossRef]
- Xiang, Y.; Cai, L.; Guan, Y.; Liu, W.; He, T.; Li, J. Study on the Biomass-Based Integrated Gasification Combined Cycle with Negative CO2 Emissions under Different Temperatures and Pressures. Energy 2019, 179, 571–580. [Google Scholar] [CrossRef]
- Tuomi, S.; Kaisalo, N.; Simell, P.; Kurkela, E. Effect of Pressure on Tar Decomposition Activity of Different Bed Materials in Biomass Gasification Conditions. Fuel 2015, 158, 293–305. [Google Scholar] [CrossRef]
- Kurkela, E.; Staåhlberg, P. Air Gasification of Peat, Wood and Brown Coal in a Pressurized Fluidized-Bed Reactor. II. Formation of Nitrogen Compounds. Fuel Process. Technol. 1992, 31, 23–32. [Google Scholar] [CrossRef]
- Wang, W.; Padban, N.; Ye, Z.; Olofsson, G.; Andersson, A.; Bjerle, I. Catalytic Hot Gas Cleaning of Fuel Gas from an Air-Blown Pressurized Fluidized-Bed Gasifier. Ind. Eng. Chem. Res. 2000, 39, 4075–4081. [Google Scholar] [CrossRef]
- Wu, C.; Yin, X.; Ma, L.; Zhou, Z.; Chen, H. Operational Characteristics of a 1.2-MW Biomass Gasification and Power Generation Plant. Biotechnol. Adv. 2009, 27, 588–592. [Google Scholar] [CrossRef]
- Kurkela, E.; Kurkela, M.; Hiltunen, I. The Effects of Wood Particle Size and Different Process Variables on the Performance of Steam-Oxygen Blown Circulating Fluidized-Bed Gasifier. Environ. Prog. Sustain. Energy 2014, 33, 681–687. [Google Scholar] [CrossRef]
- Anton, L.; Gunnasrsson, I.; Tengberg, F. The GoBiGas Project Demonstration of the Production of Biomethane from Biomass via Gasification. Göteborg Energi 2018, 10, 13–15. [Google Scholar]
- Hofbauer, H.; Rauch, R.; Ripfel-Nitsche, K. Report on Gas Cleaning for Synthesis Applications; TU Wien: Vienna, Austria, 2007. [Google Scholar]
- Li, J.; Li, F.; Liu, W.; Liu, Z.; Zhan, H.; Zhang, Y.; Hao, Z.; Cheng, Z.; Huang, J.; Fang, Y. Influence of Pressure on Fluidized Bed Gasifier: Specific Coal Throughput and Particle Behavior. Fuel 2018, 220, 80–88. [Google Scholar] [CrossRef]
- Bui, H.-H.; Wang, L.; Tran, K.-Q.; Skreiberg, Ø.; Luengnaruemitchai, A. CO2 Gasification of Charcoals in the Context of Metallurgical Application. Energy Procedia 2017, 105, 316–321. [Google Scholar] [CrossRef]
- Mauerhofer, A.M.; Müller, S.; Benedikt, F.; Fuchs, J.; Bartik, A.; Hammerschmid, M.; Hofbauer, H. Dual Fluidized Bed Biomass Gasification: Temperature Variation Using Pure CO2 as Gasification Agent. In Proceedings of the ICPS19—International Conference on Polygeneration Strategies, Vienna, Austria, 18–20 November 2019. [Google Scholar]
- Valin, S.; Bedel, L.; Guillaudeau, J.; Thiery, S.; Ravel, S. CO2 as a Substitute of Steam or Inert Transport Gas in a Fluidised Bed for Biomass Gasification. Fuel 2016, 177, 288–295. [Google Scholar] [CrossRef]
- Mayerhofer, M.; Mitsakis, P.; Meng, X.; de Jong, W.; Spliethoff, H.; Gaderer, M. Influence of Pressure, Temperature and Steam on Tar and Gas in Allothermal Fluidized Bed Gasification. Fuel 2012, 99, 204–209. [Google Scholar] [CrossRef]
- Jeremiáš, M.; Pohořelý, M.; Svoboda, K.; Manovic, V.; Anthony, E.J.; Skoblia, S.; Beňo, Z.; Šyc, M. Gasification of Biomass with CO2 and H2O Mixtures in a Catalytic Fluidised Bed. Fuel 2017, 210, 605–610. [Google Scholar] [CrossRef] [Green Version]
- Cheng, Y.; Thow, Z.; Wang, C.-H. Biomass Gasification with CO2 in a Fluidized Bed. Powder Technol. 2016, 296, 87–101. [Google Scholar] [CrossRef]
- Jeremiáš, M.; Pohořelý, M.; Svoboda, K.; Skoblia, S.; Beňo, Z.; Šyc, M. CO2 Gasification of Biomass: The Effect of Lime Concentration in a Fluidised Bed. Appl. Energy 2018, 217, 361–368. [Google Scholar] [CrossRef]
- Mauerhofer, A.M.; Müller, S.; Benedikt, F.; Fuchs, J.; Bartik, A.; Hofbauer, H. CO2 Gasification of Biogenic Fuels in a Dual Fluidized Bed Reactor System. Biomass Convers. Biorefinery 2021, 11, 1101–1116. [Google Scholar] [CrossRef] [Green Version]
- Mauerhofer, A.M.; Fuchs, J.; Müller, S.; Benedikt, F.; Schmid, J.C.; Hofbauer, H. CO2 Gasification in a Dual Fluidized Bed Reactor System: Impact on the Product Gas Composition. Fuel 2019, 253, 1605–1616. [Google Scholar] [CrossRef]
- Balland, M.; Froment, K.; Ratel, G.; Valin, S.; Roussely, J.; Michel, R.; Poirier, J.; Kara, Y.; Galnares, A. Biomass Ash Fluidised-Bed Agglomeration: Hydrodynamic Investigations. Waste Biomass Valorization 2017, 8, 2823–2841. [Google Scholar] [CrossRef]
- Szul, M.; Głód, K.; Iluk, T. Influence of Pressure and CO2 in Fluidized Bed Gasification of Waste Biomasses. Biomass Convers. Biorefinery 2021, 11, 69–81. [Google Scholar] [CrossRef]
- Liu, Y.; Yan, T.; An, Y.; Zhang, W.; Dong, Y. Influence of Water Leaching on Alkali-Induced Slagging Properties of Biomass Straw. J. Fuel Chem. Technol. 2021, 49, 1839–1849. [Google Scholar] [CrossRef]
- Siddiqi, M.H.; Liu, X.; Hussain, M.A.; Qureshi, T.; Tabish, A.N.; Lateef, H.U.; Zeb, H.; Farooq, M.; Nawaz, S.; Nawaz, S. Evaluation of Physiochemical, Thermal and Kinetic Properties of Wheat Straw by Demineralising with Leaching Reagents for Energy Applications. Energy 2022, 238, 122013. [Google Scholar] [CrossRef]
- Zhang, W.; Huang, S.; Wu, S.; Wu, Y.; Gao, J. Ash Fusion Characteristics and Gasification Activity during Biomasses Co-Gasification Process. Renew. Energy 2020, 147, 1584–1594. [Google Scholar] [CrossRef]
- Li, F.; Zhao, C.; Li, J.; Li, Y.; Zhao, H.; Fan, H.; Xu, M.; Wang, Z.; Huang, J.; Fang, Y. Investigation on Ash Fusion Behavior Modification of Wheat Straw by Sludge Addition. J. Energy Inst. 2021, 98, 1–10. [Google Scholar] [CrossRef]
- Defoort, F.; Campargue, M.; Ratel, G.; Miller, H.; Dupont, C. Physicochemical Approach to Blend Biomass. Energy Fuels 2019, 33, 5820–5828. [Google Scholar] [CrossRef]
- Froment, K.; Seiler, J.-M.; Defoort, F.; Ravel, S. Inorganic Species Behaviour in Thermochemical Processes for Energy Biomass Valorisation. Oil Gas Sci. Technol.–Rev. D’IFP Energ. Nouv. 2013, 68, 725–739. [Google Scholar] [CrossRef] [Green Version]
- Valin, S.; Ravel, S.; Pons de Vincent, P.; Thiery, S.; Miller, H.; Defoort, F.; Grateau, M. Fluidised Bed Gasification of Diverse Biomass Feedstocks and Blends—An Overall Performance Study. Energies 2020, 13, 3706. [Google Scholar] [CrossRef]
- Xu, C.C.; Zhu, J. Prediction of the minimum fluidization velocity for fine particles of various degrees of cohesiveness. Chem. Eng. Commun. 2008, 196, 499–517. [Google Scholar] [CrossRef]
- Dantan, N. Determination of Water Traces in Various Organic Solvents Using Karl Fischer Method under FIA Conditions. Talanta 2000, 52, 101–109. [Google Scholar] [CrossRef]
- Kurkela, E. Status of Peat and Biomass Gasification in Finland. Biomass 1989, 18, 287–292. [Google Scholar] [CrossRef]
- Maier, S.; Tuomi, S.; Kihlman, J.; Kurkela, E.; Dietrich, R.-U. Techno-Economically-Driven Identification of Ideal Plant Configurations for a New Biomass-to-Liquid Process—A Case Study for Central-Europe. Energy Convers. Manag. 2021, 247, 114651. [Google Scholar] [CrossRef]

Publisher’s Note: MDPI stays neutral with regard to jurisdictional claims in published maps and institutional affiliations. |
© 2022 by the authors. Licensee MDPI, Basel, Switzerland. This article is an open access article distributed under the terms and conditions of the Creative Commons Attribution (CC BY) license (https://creativecommons.org/licenses/by/4.0/).