1. Introduction
In the automotive and aerospace industry, to address in a better way the reliability and efficiency requirements for new high-speed electrical drives, it is necessary to implement new power electronic converters using new wide-bandgap semiconductor devices (WBGs) [
1,
2,
3]. The introduction of new wide-bandgap power electronic devices, such as Gallium Nitride (GaN) and Silicon Carbide (SiC), enhanced the development of the new converters with a higher efficiency and switching frequency and a smaller size. Compared to conventional Silicon-based IGBT converters, with long turn-on and turn-off times and switching frequencies of around 10–30 kHz, the new wide-bandgap semiconductors have the ability to operate at high temperatures with switching frequencies of around 100 kHz and therefore short on/off times, reducing switching losses and increasing the efficiency of the entire power converter [
4,
5].
These advantages lie in the band gap, which is three times larger than that of Silicon devices. A larger band gap enables lower temperature dependence of the main device parameters, a much higher breakdown voltage, and a much lower
resistance determining device conduction losses lower than Si devices [
6,
7]. Operating at high switching frequencies, converters using semiconductors with WBG can be made smaller and lighter, while increasing efficiency by reducing harmonic content and acoustic noise, thus improving the performance of the entire electrical drive. However, these new WBG devices feature very steep voltage waveform pulses produced by the pulse width modulation (PWM) inverter. When this voltage is used to power an electrical machine, it causes surges at the terminals of the machine winding, creating an electrical stress on the insulation, which favours partial discharges (PD) at a higher extent when compared to the Si-based converter powering the machine. Consequently, it is also leading to the premature breakdown of the insulation of the machine stator winding [
8,
9].
Nowadays, there are many occurrences of the premature failures of electric motors and generators powered by PWM converters. The causes of these breakdowns are still a source of research for many scholars. However, many reports have shown that a PWM signal can trigger a higher number of partial discharge phenomena in a stator winding, resulting in premature insulation failure. When a breakdown or failure of an electric motor occurs, it is almost inevitable that the machine will be taken out of service from the process in which it is applied, and the resetting of the machine may take place after a long period of time, thus creating downtimes in a process that causes large economic losses. The review [
10] characterised these losses due to downtime for various industrial sectors with a bar graph showing that the greatest losses are in the automotive sector, where there are many high-speed drives. For these reasons, a great effort is being made to identify the causes of premature failure of machine insulation, and through predictive maintenance techniques in which the machine is constantly monitored, an incipient failure can be immediately detected, and the necessary actions can be scheduled to avoid more serious process downtime.
In 1951, one of the first studies published by S.B. Warder [
11] showed that the voltages produced by rectifiers had a harmful effect on the dielectric material of the power cable used in a railway network. These voltages produced a harmonic distribution that generated overvoltages that triggered internal discharges in the cable insulation. Later, in 1992, it was shown by Persson [
12] that the PWM inverter is the cause of premature insulation breakdown of the stator winding when the electrical machine is powered through the converter in an electrical drive.
The overvoltages generated at the machine terminals are mainly caused by the reflected voltage waves travelling over the connecting cable between the converter and the electrical machine. Due to the parasitic capacitance of the motor winding insulation, the distribution of the electric field is not uniform and therefore generates distortions in the voltage waveform that can lead to a partial discharge dangerous for the insulation. For this reason, regulatory organizations such as the National Electrical Manufacturers Association (NEMA) and the International Electrotechnical Commission (IEC) have become aware of the issues related to the partial discharges and have introduced restrictions and requirements for motors. A great deal of works have been undertaken to analyse the causes of premature failure of stator winding insulation, and studies have been carried out to estimate conditions so that predictive maintenance can be devised [
13,
14,
15]. Monitoring systems analyse the set of the first symptoms that occur before a failure so that maintenance can be carried out in time. By observing the first symptoms leading up to a failure, it is also possible to determine the lifetime of the machine and estimate the risk of failure.
Currently, tests and monitoring techniques for machines are useful tools for the user to organise the entire schedule of machine maintenance and manage downtime optimally, avoiding unexpected failures. Besides, through these studies, it is possible to determine the main cause that leads to machine malfunction or failure earlier than expected, and thus being able to make changes to the system to prevent it from happening again in the future. There are different types of tests that can detect faults in different parts of the electric motor. Basically, the tests that are performed fall into two categories: on-line and off-line. Tests conducted when the machine is disconnected from the system are the off-line tests. They can be carried out when the machine is partially disassembled or simply performed directly on the terminals of the motor stator winding. Instead, on-line tests are widely used because they are performed during the nominal operation of the machine, so analysing variables such as temperature, mechanical vibrations, and electrical quantities occurring during service. Not all types of faults can be analysed with on-line or off-line techniques, so good predictive maintenance requires several tests to be carried out both on-line and off-line to assess the entire state of the machine and to obtain useful information to avoid unexpected faults. To implement effective predictive maintenance techniques, it is essential to take into account the non-uniform voltage distribution at the terminals of the winding but also the oscillatory phenomena created when working at high frequencies. For this reason, high-frequency (HF) models of induction motors have been developed in recent years. These HF models can be seen as a key tool to better understand the different features of the PWM voltage waveform and their affect on the insulation, together with the overvoltage problems in PWM drives. Furthermore, they can be used for the development and benchmarking of the mitigation techniques, which can change the slope of the steep pulses coming from the inverter and suppress the overvoltages, such as for example filter or active gate driving techniques.
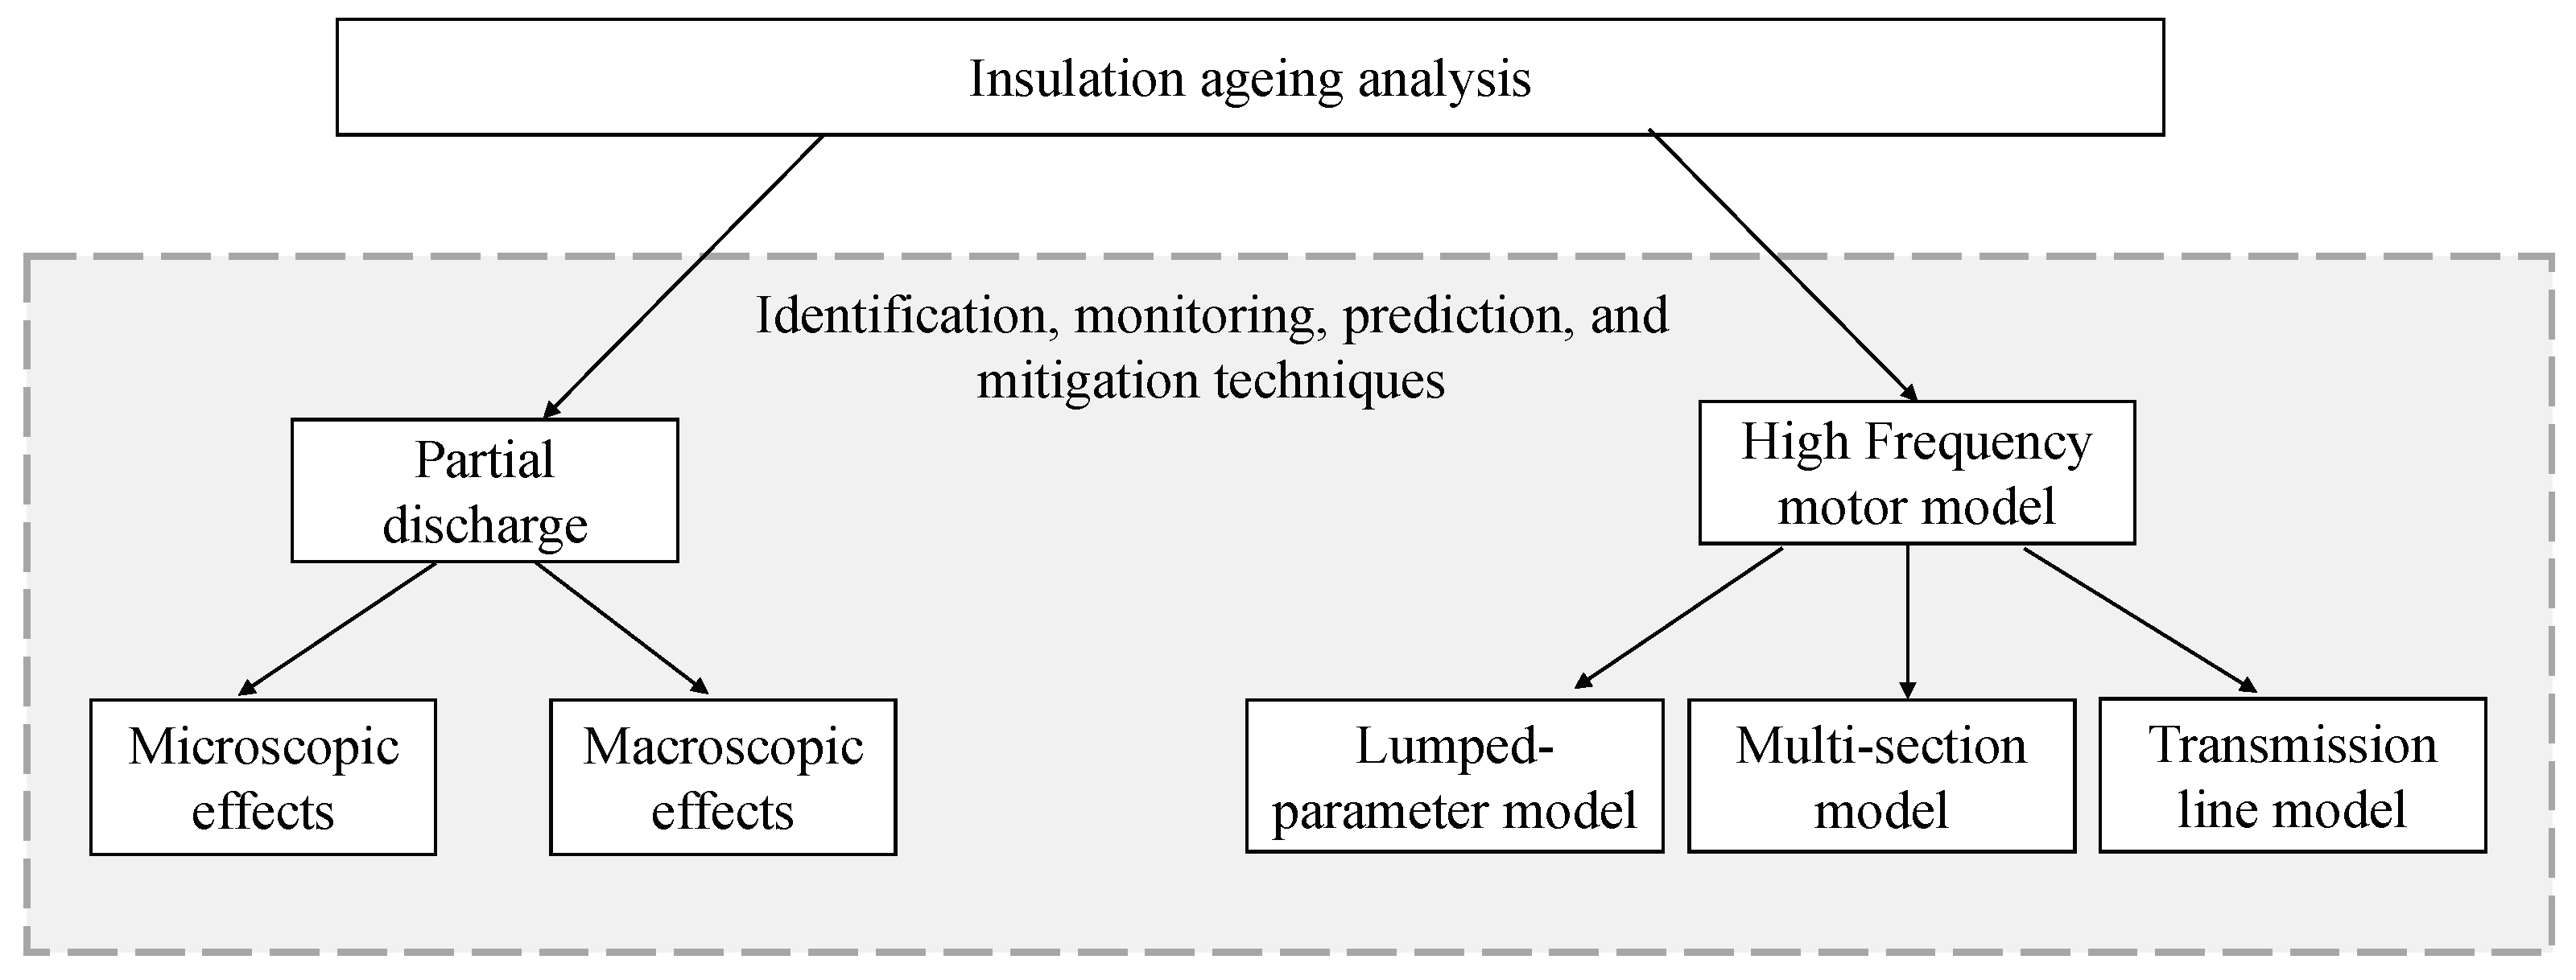
This article presents the review of the literature on HF motor models, with the comparison of the main features and voltages generated at the motor terminals for different models and the experimental voltage waveforms. Moreover, the overview of the PDs is also provided, from the power electronics point of view, and particularly by analysing the different characteristics of the PWM voltage waveforms affecting the insulation. In particular, it is divided into two major categories: the macroscopic and microscopic effects of the PDs generated by PWM signals. The microscopic effects are referring to simple systems, such as small samples of dielectric material where it is easy to conduct the tests and analyse characteristics. The macroscopic effects, on the other hand, consider more complex systems such as an entirely random wound stator. In these more complex systems, it is of interest to study easily accessible quantities, such as the phase current or impedance in the high-frequency domain. The key connection between the HF motor modelling and the PDs is the insulation ageing: HF motor models are crucial in understanding and studying the most critical ageing parameters and overvoltage mitigation techniques, as it is favouring PD generation and insulation stress especially in the modern drives; on the other hand, the knowledge on the microscopic and macroscopic effects on the PDs can viably be used in the development of monitoring and prediction techniques useful to avoid the drive malfunctioning and accelerated ageing. These are summarised in
Figure 1.
2. Partial Dicharges
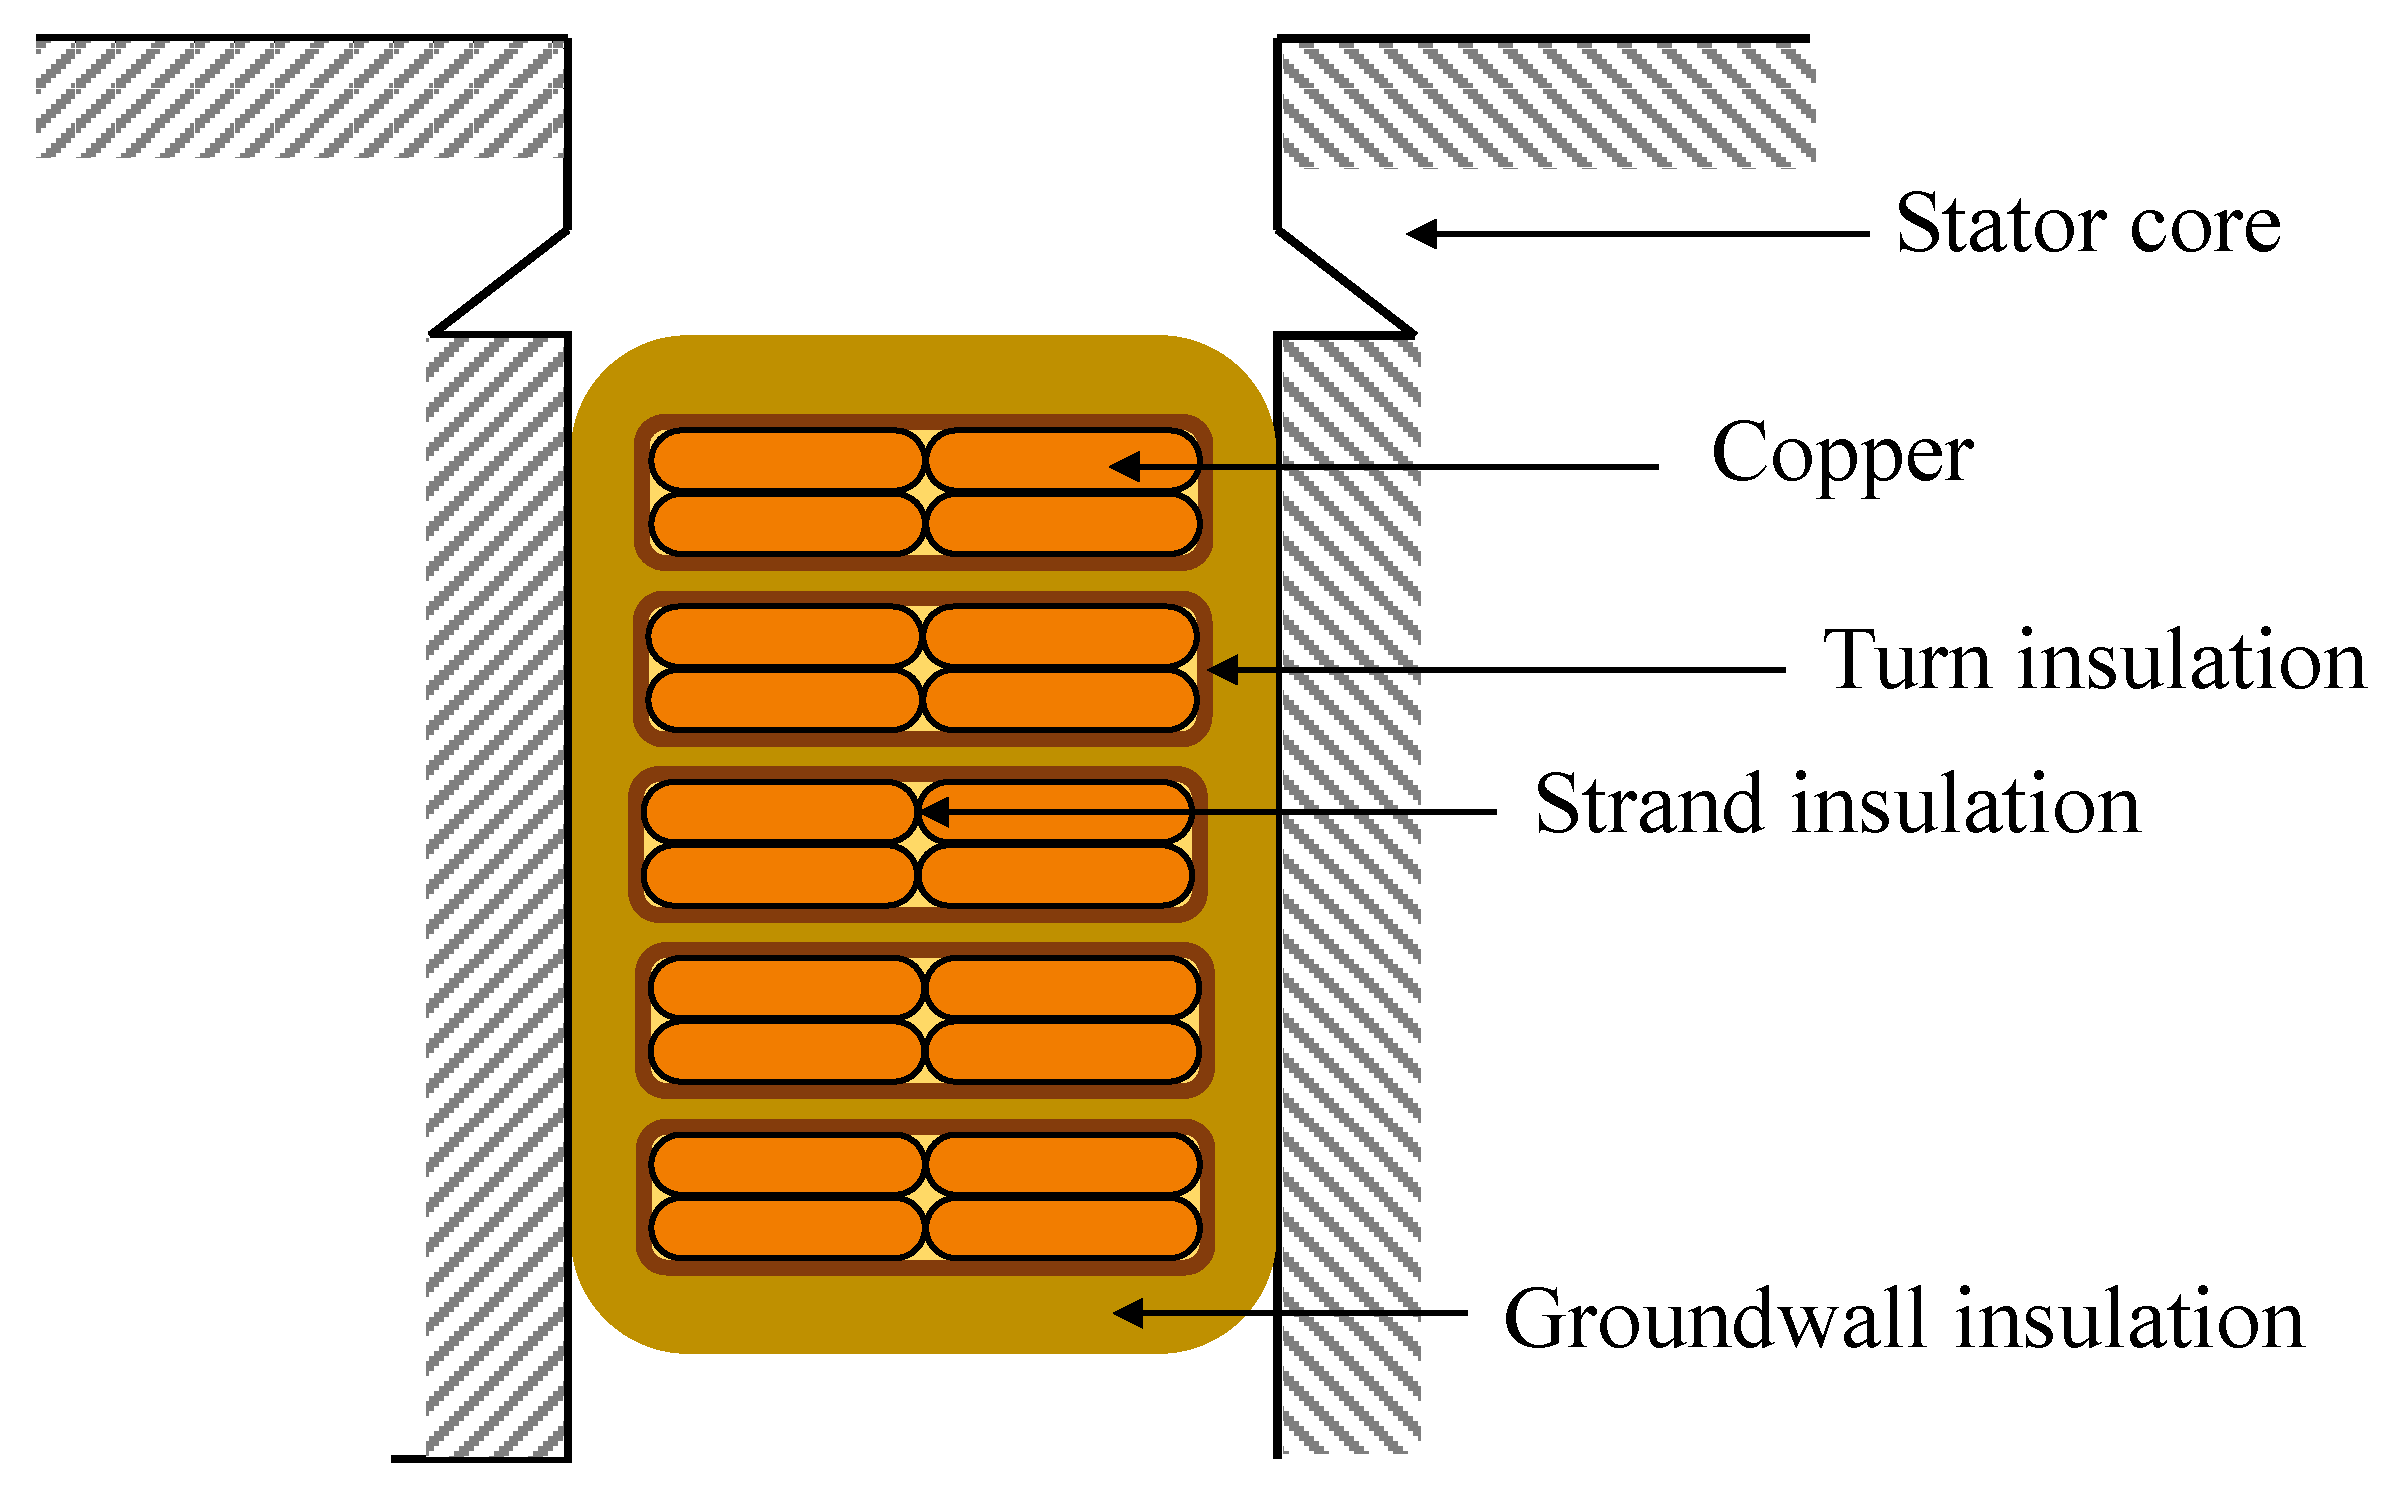
The insulation system of the stator winding consists of various parts that ensure the correct insulation between the active parts of the winding and that no electrical short-circuits can occur.
Figure 2 shows the schematic diagram of the stator winding section of an induction motor.
The insulation between the conductors is necessary to prevent the
skin effect occurring between the wires and to reduce the Joule losses
. The turn insulation between the windings is necessary to prevent short circuits between them in the coil. Groundwall insulation, on the other hand, insulates the coil formed by the copper conductors from the stator. These elements are of fundamental importance to ensure the correct operation of the machine, but at the same time they constitute the most fragile element of the electrical drive [
15]. The dielectric composing the insulation system is very often characterised by small defects such as micro-cavities in the material, small air pockets resulting from imperfect adhesion between conductors, or defects in the construction of the components created during manufacture.
There are two types of insulation systems, as distinguished in IEC 60034 series: Type I and Type II. In Type I systems, the low-voltage motors are using organic insulation, and this kind of system should not experience any PD during their service lifetime. They are normally random wounds. Here, the ageing mechanisms are considered to be thermo-mechanical rather than electrical. On the other hand, Type II systems have the inorganic/organic insulation, but in this case the PDs can be withstood for a long time, provided that PD magnitudes are not too large. The IEC standard dealing with the Type I systems is presented in 60034-18-41 [
16], while Type II systems are presented in 60034-18-42 [
17].
There are different kinds of stresses that can affect the rate of insulation deterioration. In general, they can be divided into four main groups: thermal, electrical, ambient, and mechanical stresses, the TEAM stresses. In the past, mainly the thermal and mechanical stresses were studied, as they were the most recognized cause of insulation deterioration and eventually failure. Nowadays, with the WBG development trend and high switching frequency operation, the newly introduced electrical stress needs to be considered at a high extent, as it pushes the electrical stress to a high level.
When the insulation system is subjected to an impulsive voltage such as the PWM waveform provided by the inverter, the electrical winding is subjected to high electrical stress, which is leading to partial discharges, even as it is energized. These discharges are of different types and can occur in several parts of the electrical machine insulation. In [
15], for example, partial discharges can occur in the groundwall and in particular in the air pockets. If the electric field created in the conductor exceeds the dielectric strength of the air, which temporarily becomes a conductor, it will produce the discharge. These discharges, once initiated, cause delamination, erosion, and breakage of the insulating enamel, causing the conductors to come into contact with each other, creating a high short-circuit current that flows between the conductors and triggering the over-current protections that make the machine go out of service [
18,
19].
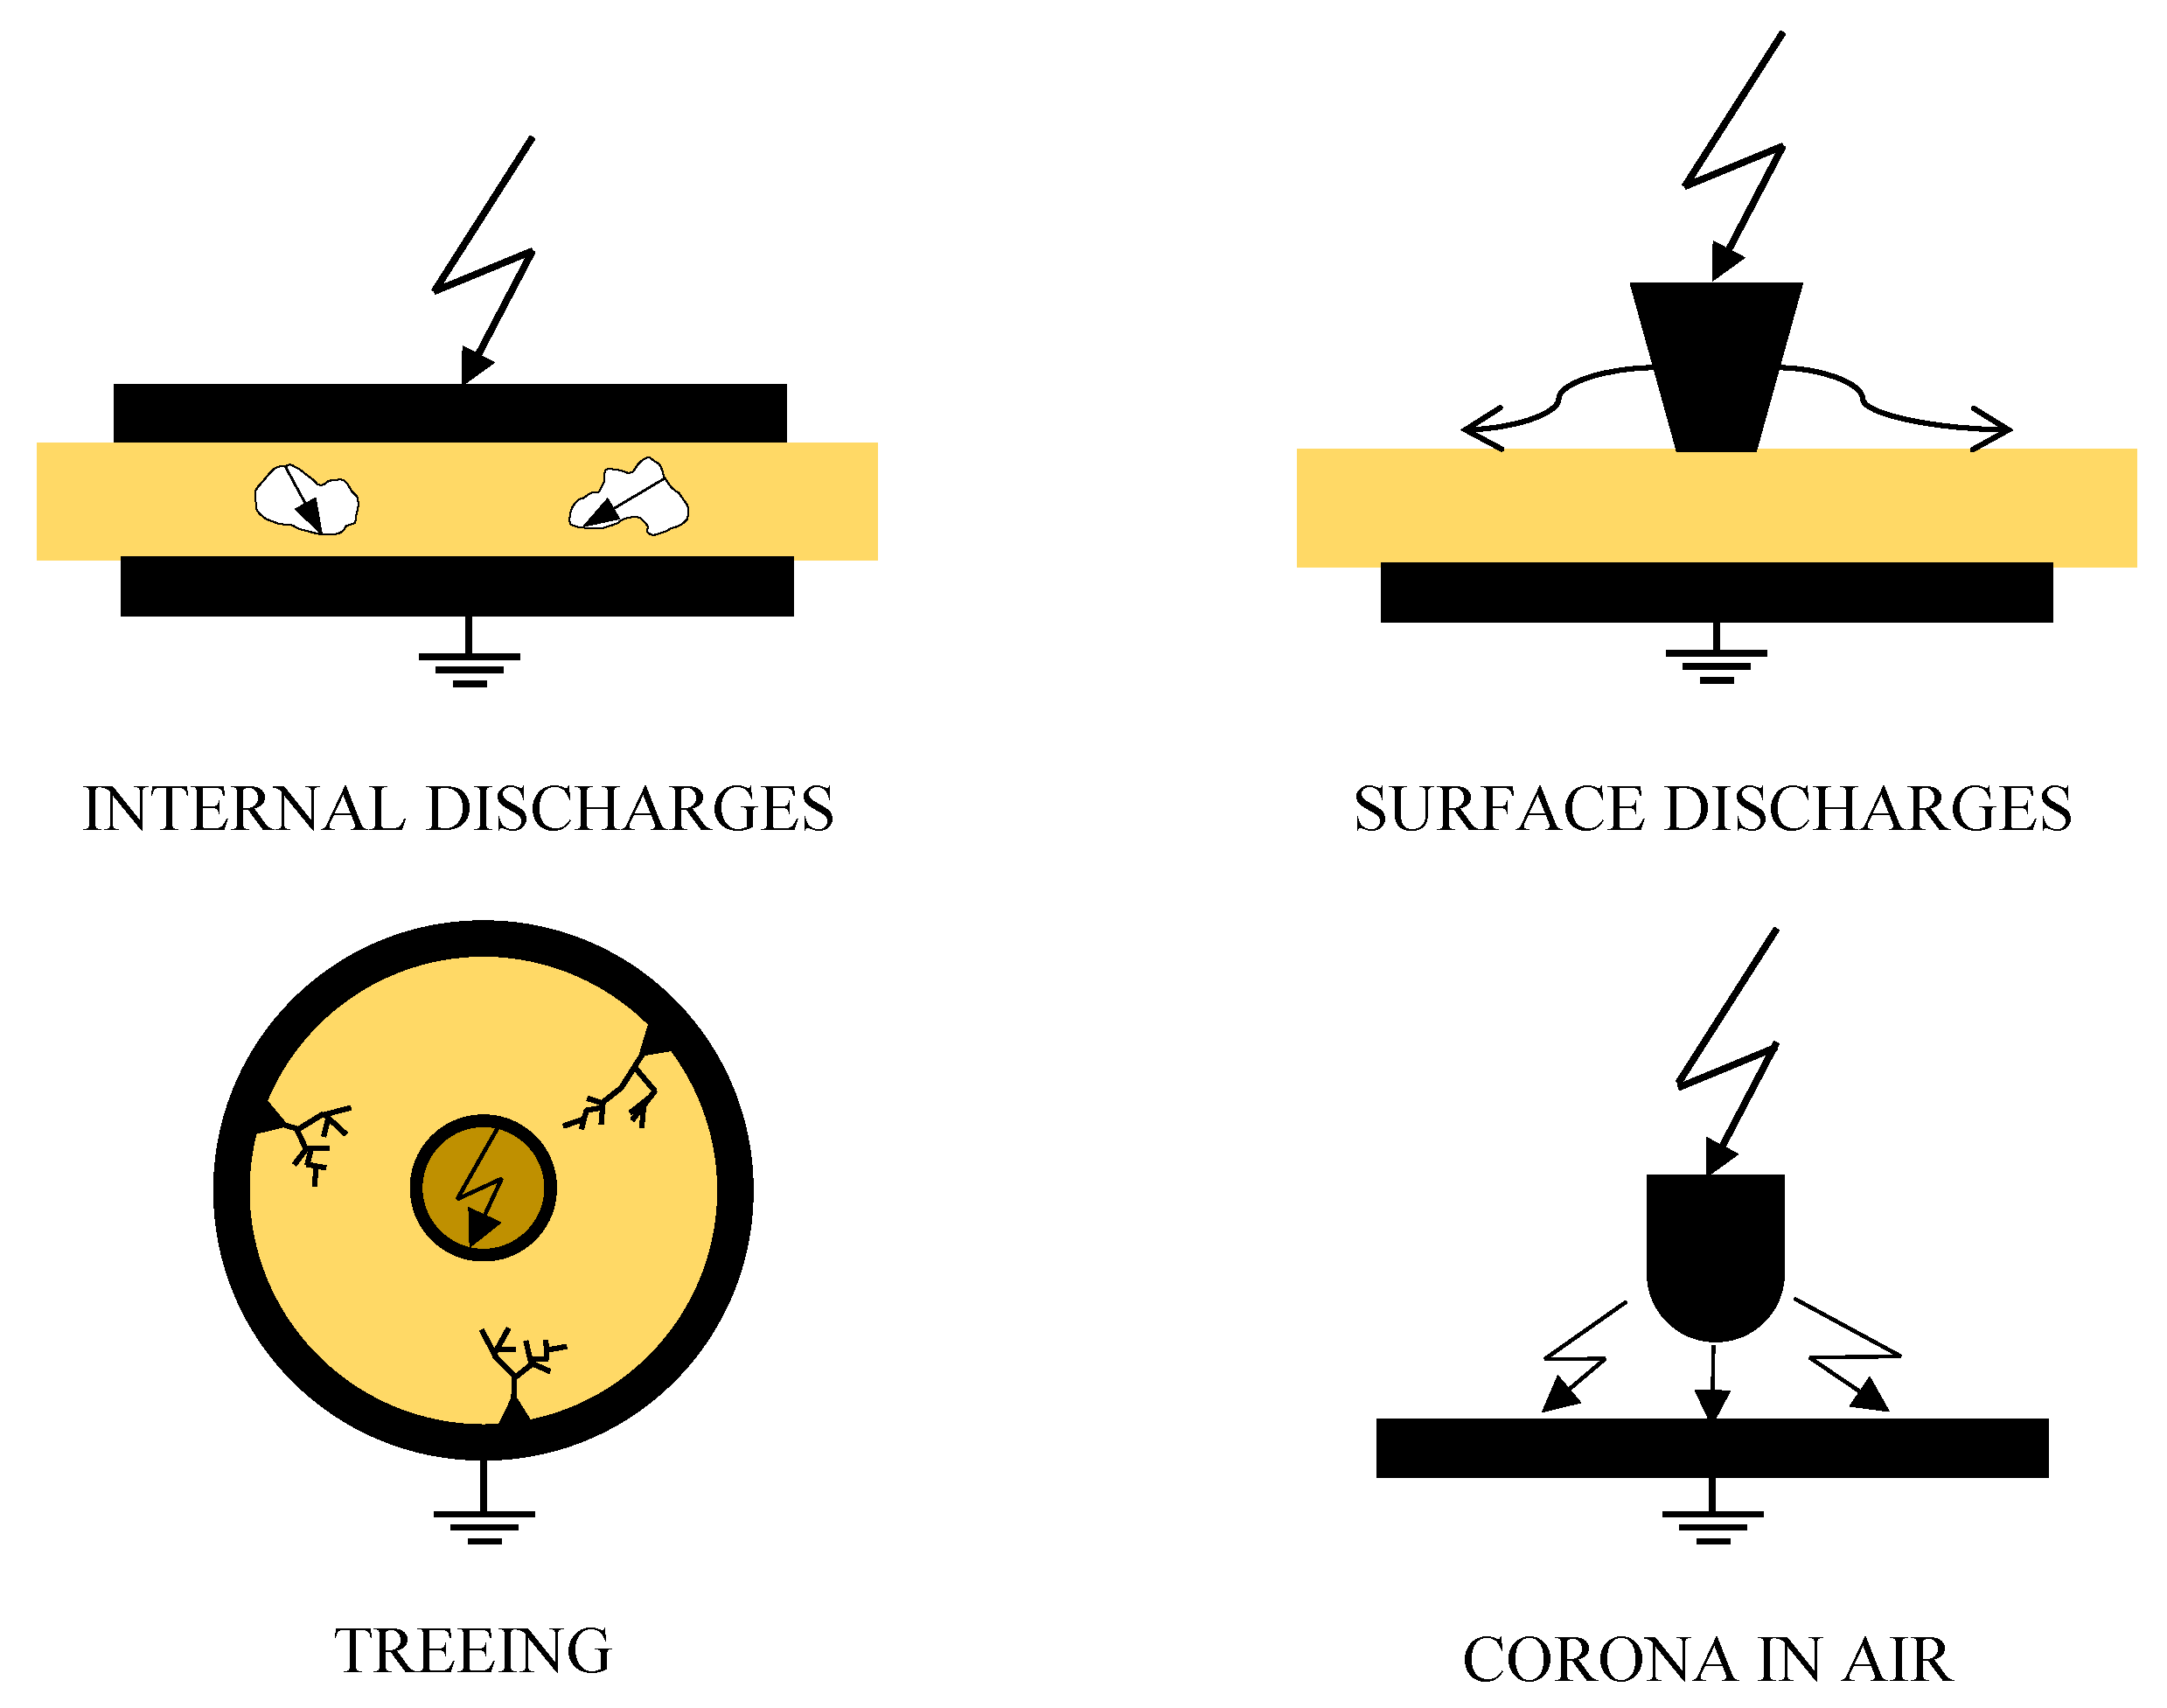
In principle, partial discharges can be divided into four categories, as seen in the
Figure 3.
Internal partial discharges are the most common and one of the main causes of premature failure of the insulator. During the manufacturing process of the dielectric material, air micro cavities are incorporated in the product, and therefore once the insulator is subjected to an external electric field, a difference is created between the electric field of the air present in the micro cavity and that of the dielectric, generating a partial discharge inside the material. Another discharge that occurs in the dielectric is called treeing due to its branching formation; its origin depends on the local electric field elevation and once triggered leads to the complete discharge [
20]. Surface discharges are triggered between the surfaces of two different dielectrics very commonly in rotor winding of electrical machines.
Corona discharges occur when the conductor has sharp irregularities and is exposed to air; at these points a high enough electric field is created to cause ionisation of the air, which once ionised conducts electricity and ignites a spark (electric arc), which corrodes the insulation, known as the corona effect. In an electric motor, these discharges are mainly triggered inside the insulation of the groundwall, where there are the possibilities of gaps or air spaces between the wall and the conductor [
15,
21].
Since the first half of the 1990s to the present, many studies have been conducted to analyse partial discharges, and interesting reports have described the physical characteristics of the phenomenon [
11,
12,
22,
23,
24,
25,
26,
27,
28,
29]. Certainly, one of the first to deal with this phenomenon was Kreuger [
26] in 1961, with a published study dealing with the identification of partial discharges and later Kreuger published a classification of partial discharges in 1993 [
27], following the work of Gulski in 1991 [
30]. Through the classification process, discharges of unknown origin can be identified by matching the fingerprint of the examined discharge with patterns of known discharges. The method provided by Kreuger [
27] has been the foundation for the development of new techniques for the diagnostics and recognition of partial discharges, most of which are based on neural networks, fuzzy logic, and more or less complex statistical approaches. The statistical approaches are based on the analysis of a single PD, evaluating and rejecting the noise, in order to better appreciate the characteristics of the discharge. After that, a series of statistical analyses is conducted, referring to the polarity of the pulse, its amplitude, the distribution of the pulses and also the parameters related to the phase angle of the PD trigger, and the phase interval between the start and end of the discharge [
31,
32,
33]. However, as is well-known, isolation diagnosis is not easy to achieve, largely because the parameters such as amplitude and time of PDs’ onset vary stochastically.
Partial discharges have stochastic behaviour because of the stochastic delay time due to the availability of the initiating electron of the discharge and the memory effect generated by previous discharges influencing subsequent ones. In particular, once triggered, PDs change the properties of the dielectric material and leave residual charges on the dielectric that then influence the occurrence of future partial discharges, as explained in detail in the following works [
34,
35,
36].
The effects that generate PDs can be residual charges in the vicinity of defects [
37], a reduction in material resistivity [
38], a change in surface conductivity [
39], or a change in material geometry or roughness. In order to clarify the causes that lead to the occurrence of partial discharges in solid dielectrics, the concept of partial discharge area has been introduced, i.e., the zone comprising the microcavity and the insulation where the residual charges generated by the previous PDs thicken.
The discharge area is the part of the dielectric where PDs are most likely to occur, and the magnitude of the discharge varies stochastically due to the causality of the residual surface charges [
37]. The authors in [
38] measured the reduction in resistivity of the dielectric material when subjected to a partial discharge and were able to map the changes in dielectric structure and thus the change in the discharge area. This information can be used both to develop new PD models and to prevent full discharge.
The presence of microcavities and defects in the dielectric cause an electric field that is not uniform throughout the material, and in particular a densification of charge is created near the microcavity, which often leads to the generation of partial discharges [
18]. By analysing the PDs generated in insulation material defects such as epoxy resin voids, it is possible to describe the development of partial discharges during the ageing phases of the insulation. These studies are carried out by means of stochastic models [
28,
29,
40]. Studying the effects of partial discharges helps us to understand the dynamics of the phenomenon and its chemical and physical characteristics. The measurement of PD has been useful in determining the relationship between the type of defect and the generation of the discharge [
18,
28].
Gutfleisch and Niemeyer [
28,
29] analysed the PD activity in air gaps of known geometry in epoxy resin to provide rules for identifying the type of defect and for assessing the ageing state of the dielectric. The dielectric was observed for a period of six months, and the data obtained were examined using phase-resolved partial discharge (PRPD) models for various ageing stages. In this work, a method that takes into account the effects of defect geometry was proposed to study the discharge activity and associated memory effect with the resulting distribution of charge produced in the cavity by the PD. The partial discharge, once triggered and extinct, causes temporal effects such as spatial charges and surface charges that are attenuated during time. Gutfleisch et al. [
29] did not investigate all the stages from the initiation of the partial discharge to the breaking of the isolation, which has been done successfully in [
41]. The relationship between PDs and the failure behaviour of a typical insulation has been proposed in [
41].
It has been shown in many later studies that these charges contribute to the generation of further partial discharges, as they examine the memory effects, considered to be responsible for the stochastic behaviour of the PD [
34,
35]. The presence of the space charge contributes to the premature aging of the dielectric and at the same time influences the onset of subsequent partial discharges [
36]. A well-detailed review of the memory effects introduced by residual charges was provided by Cheng Pan et al. [
34].
3. Overview of the PWM Voltage Waveform Affecting the Insulation
In recent years the partial discharge has become of great scientific interest, as it has been shown that it causes premature breakdown of the stator winding insulation of electrical machines powered by power electronic converters. A power electronic converter, usually controlled with pulse width modulation, produces a steep voltage pulses, which has the effect on the motor insulation. This is even more evident with the development of the new power semiconductors and especially with the increasing popularity of wide-bandgap devices, and SiC-MOSFET and GaN devices, even though they offer many benefits compared to Si devices [
7,
42]. These devices can be used at high speeds due to the low
and
values. It is these low
and
values that cause high
and
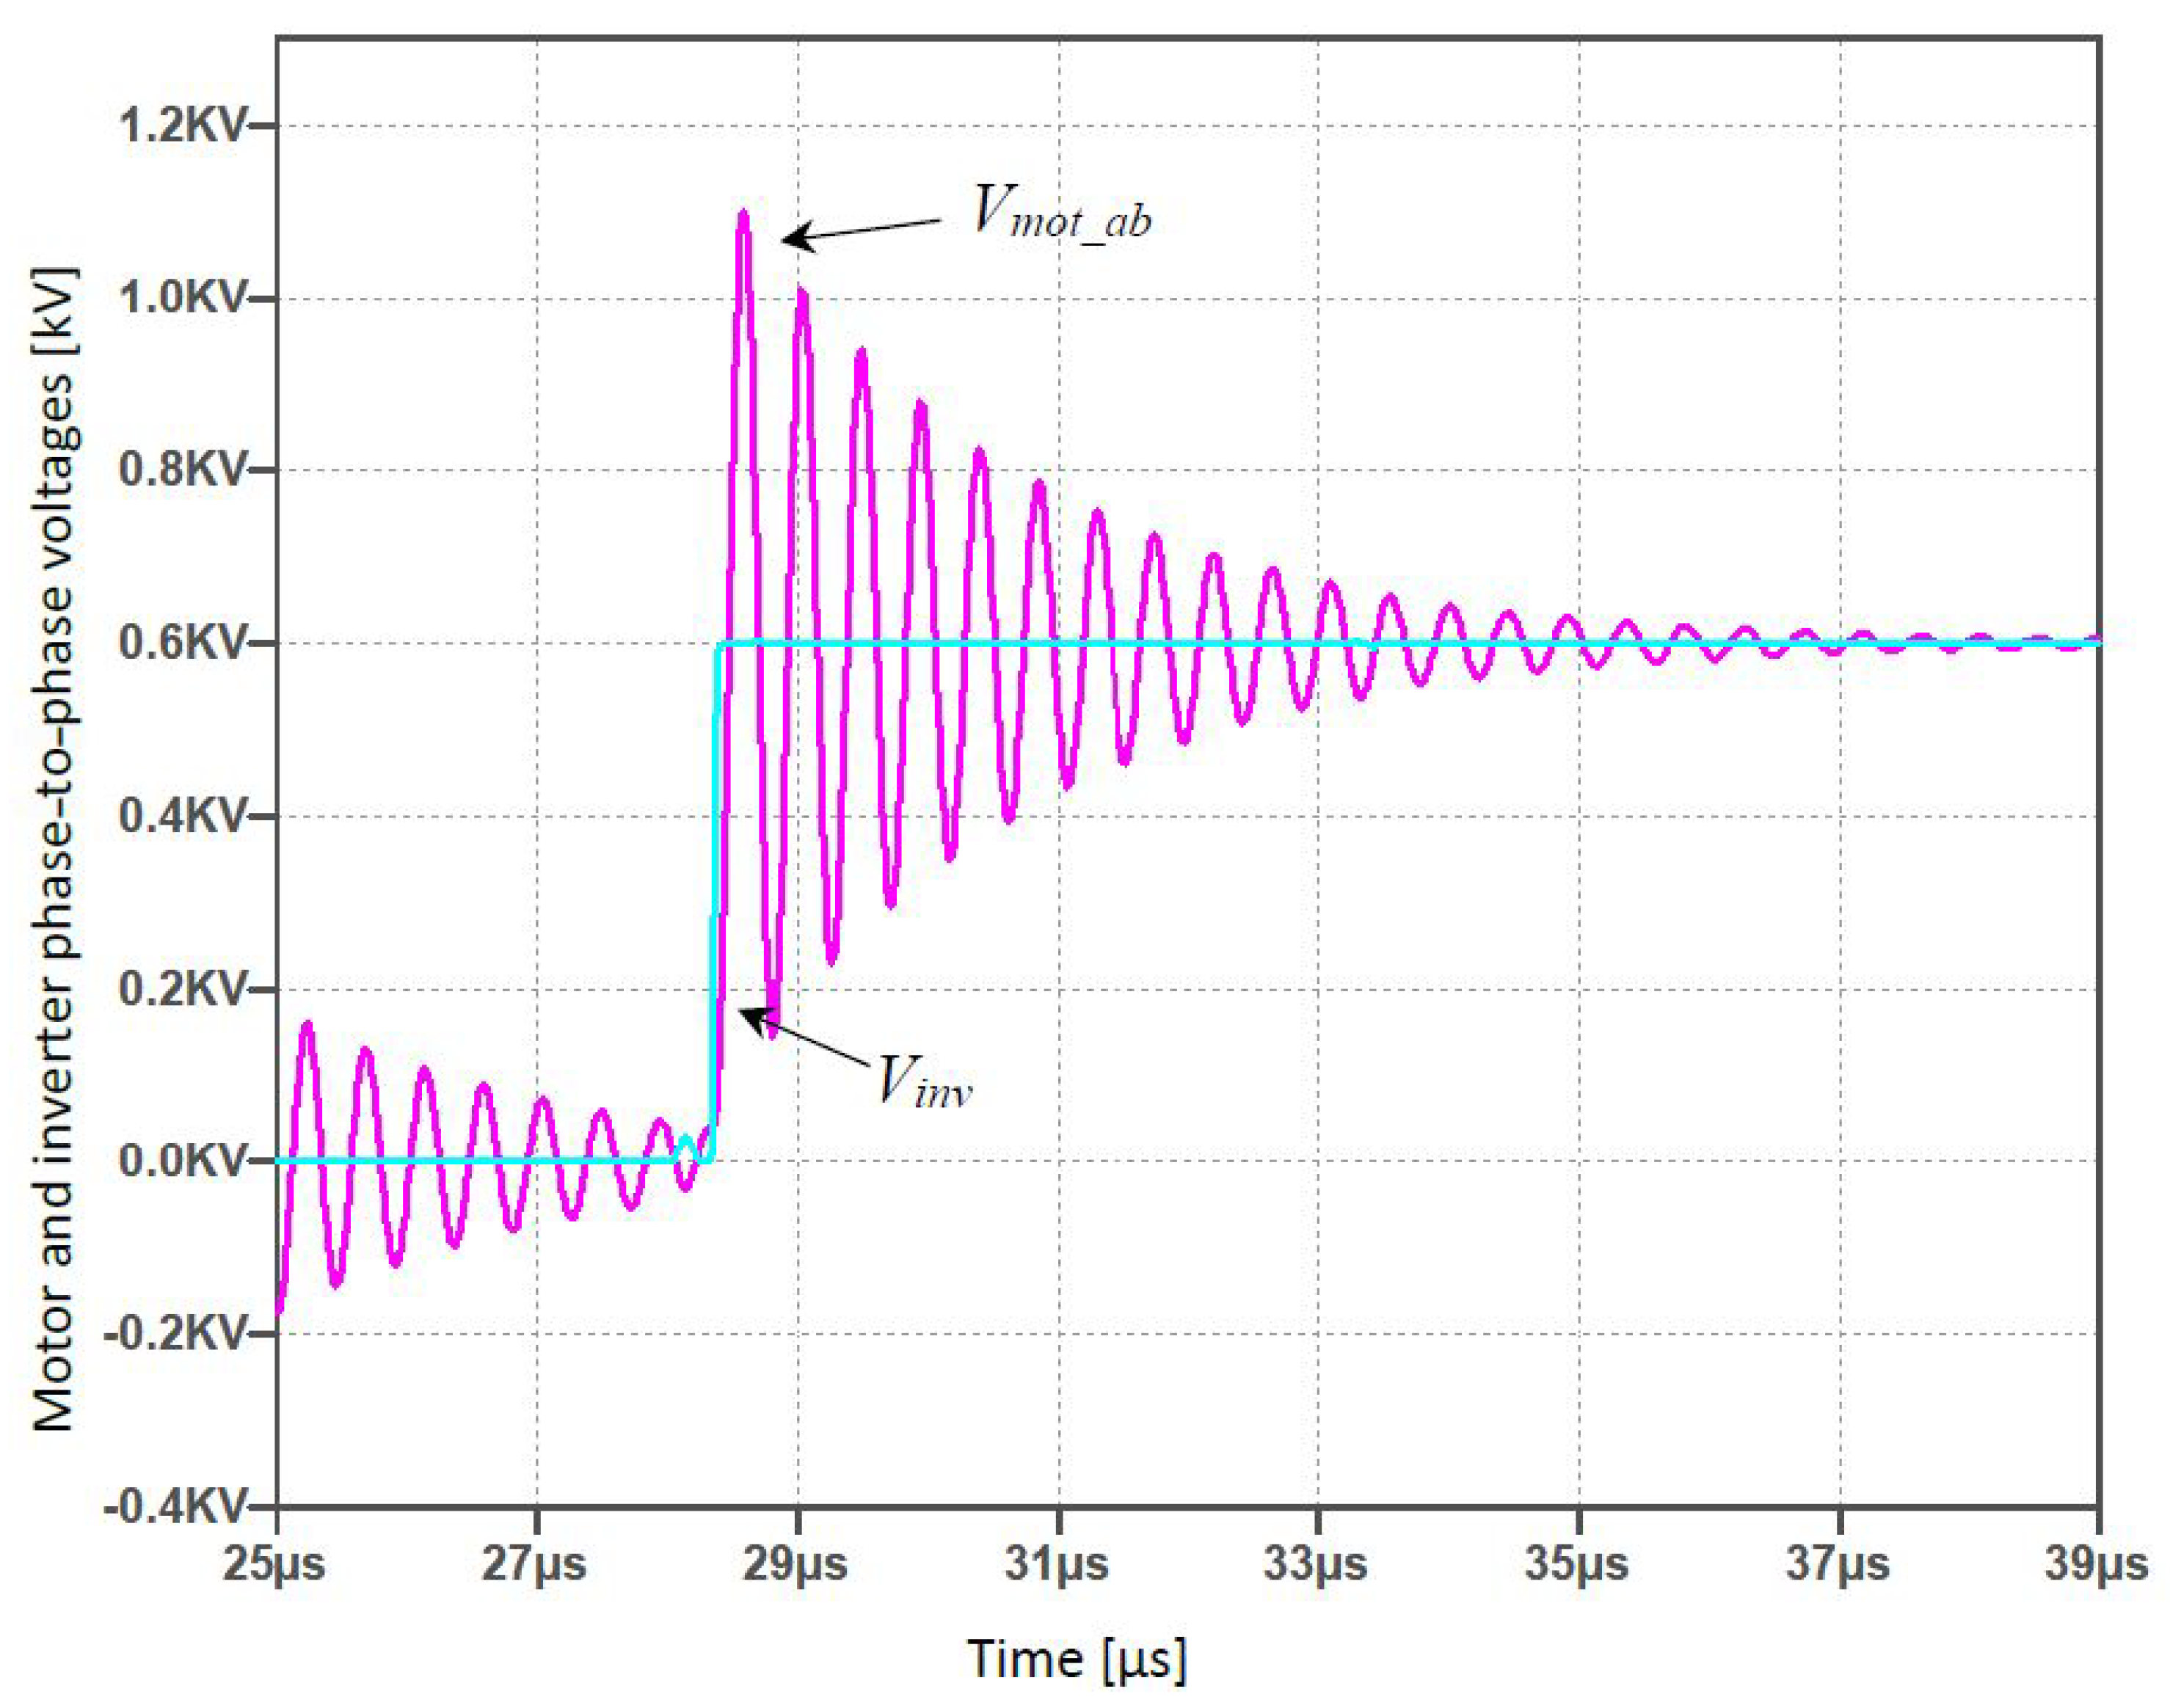
. In the case of long power cable from the inverter to the motor, a significant overshoot due to the reflected wave phenomenon can be observed. For some of the cable lengths, the voltage waveform is reflected continuously across the cable resulting in persistent oscillations at motor terminals. Namely, in
Figure 4 is represented the example of
at motor terminals, for the cable length of 5 m.
These overvoltages are favouring the partial discharge phenomenon and could degrade the reliability and efficiency of motor drive systems. Apart from the effects of the overvoltages on the whole winding, the stress on the inter-turn insulation of the motor winding should be considered, especially in the case of small rise times. Namely, such steep voltages can produce large variations on one coil turn, going beyond the inter-turn insulation design limit considered under sinusoidal operation [
9].
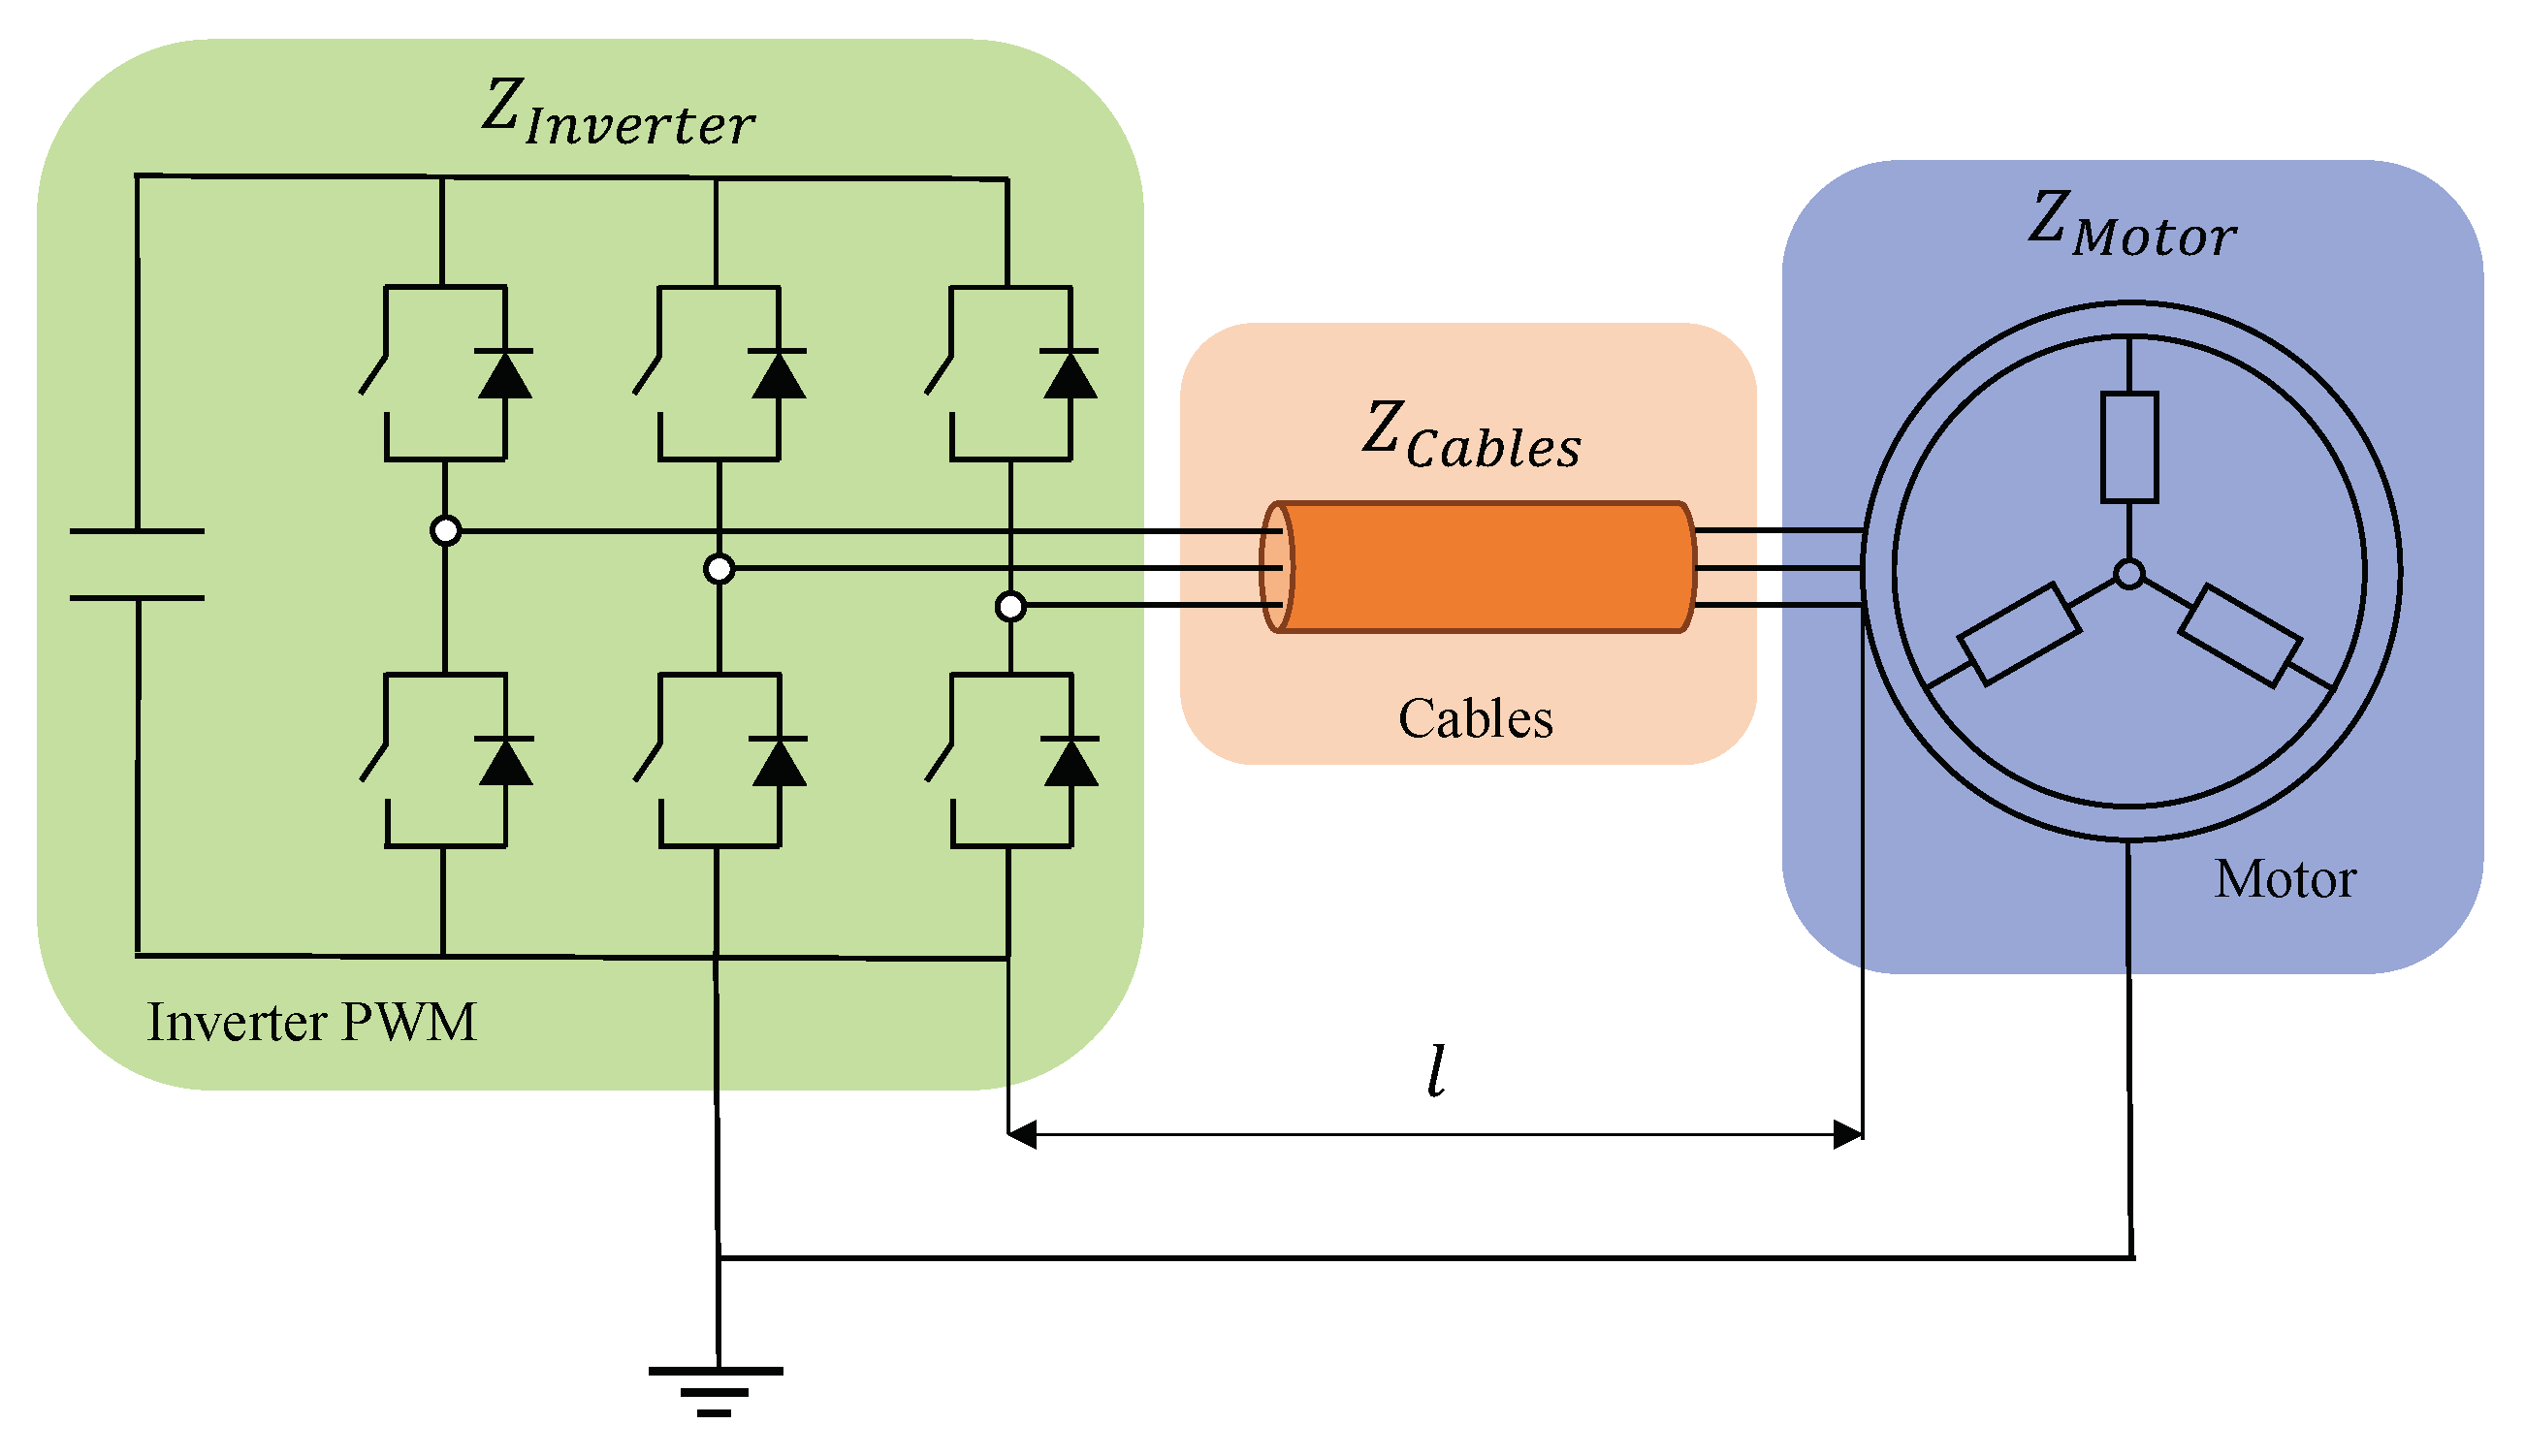
It is demonstrated in various works that there is a direct relationship between the overvoltage occurring at the winding terminals of the electrical machine and the length of the cable connecting the inverter and the motor. Especially by increasing the length of the cable between the inverter and the motor, the voltage at the ends of the induction motor winding increases [
43,
44,
45,
46]. This is due to the reflected waves travelling over the connecting cable, which creates an amplification of the voltage supplying the electrical machine. In fact, when a voltage waveform travels from the inverter to the motor along a transmission line that does not terminate at its characteristic impedance, it is reflected when it encounters a first discontinuity on its way.
Figure 5 shows a diagram of the inverter-motor system with their respective impedances.
The reflection coefficient is defined as the ratio between the reflected wave and the incoming wave,
.
Using the diagram in
Figure 5, it is possible to represent Formula (
1) as follows, considering that the motor impedance is much greater than that introduced by the cable
.
While the negative reluctance coefficient describes the reflected wave at the inverter terminals, in this case the impedance of the converter is much smaller than that of the cable, and therefore its contribution can be neglected
.
For the same rated power, the number of turns forming the winding decreases with the size of the motor; a small motor will have more turns than a larger one. The motor’s impedance, proportional to the frequency and inductance of the machine, will be greater when the motor is small at high speed, so the reflection coefficient will be close to unity, and the reflected voltage will have the same order of magnitude as that from the source. Therefore, in the new high-speed electric drives equipped with WBG semiconductor devices, these reflected waves will be more and more evident.
Although new power converters based on WBG devices are becoming increasingly popular, the authors feel there is a lack in the literature of an in-depth survey of PDs for the electrical drives supplied by these new converters but also in the standardization practise. There are many experimental investigations conducted so far and described in this review that examine the effects of PWM signals on isolation for both simple (microscopic effects) and complex systems (macroscopic effects), but for frequencies limited to a few kHz, and they can not be compared to the operating frequencies of modern WBG devices. However, the studies that have been carried out in the literature, even though they cannot faithfully represent the real complex systems of the new generation of converters with WBG semiconductor devices, certainly provide useful results for understanding the phenomenon of insulation ageing.
In his work [
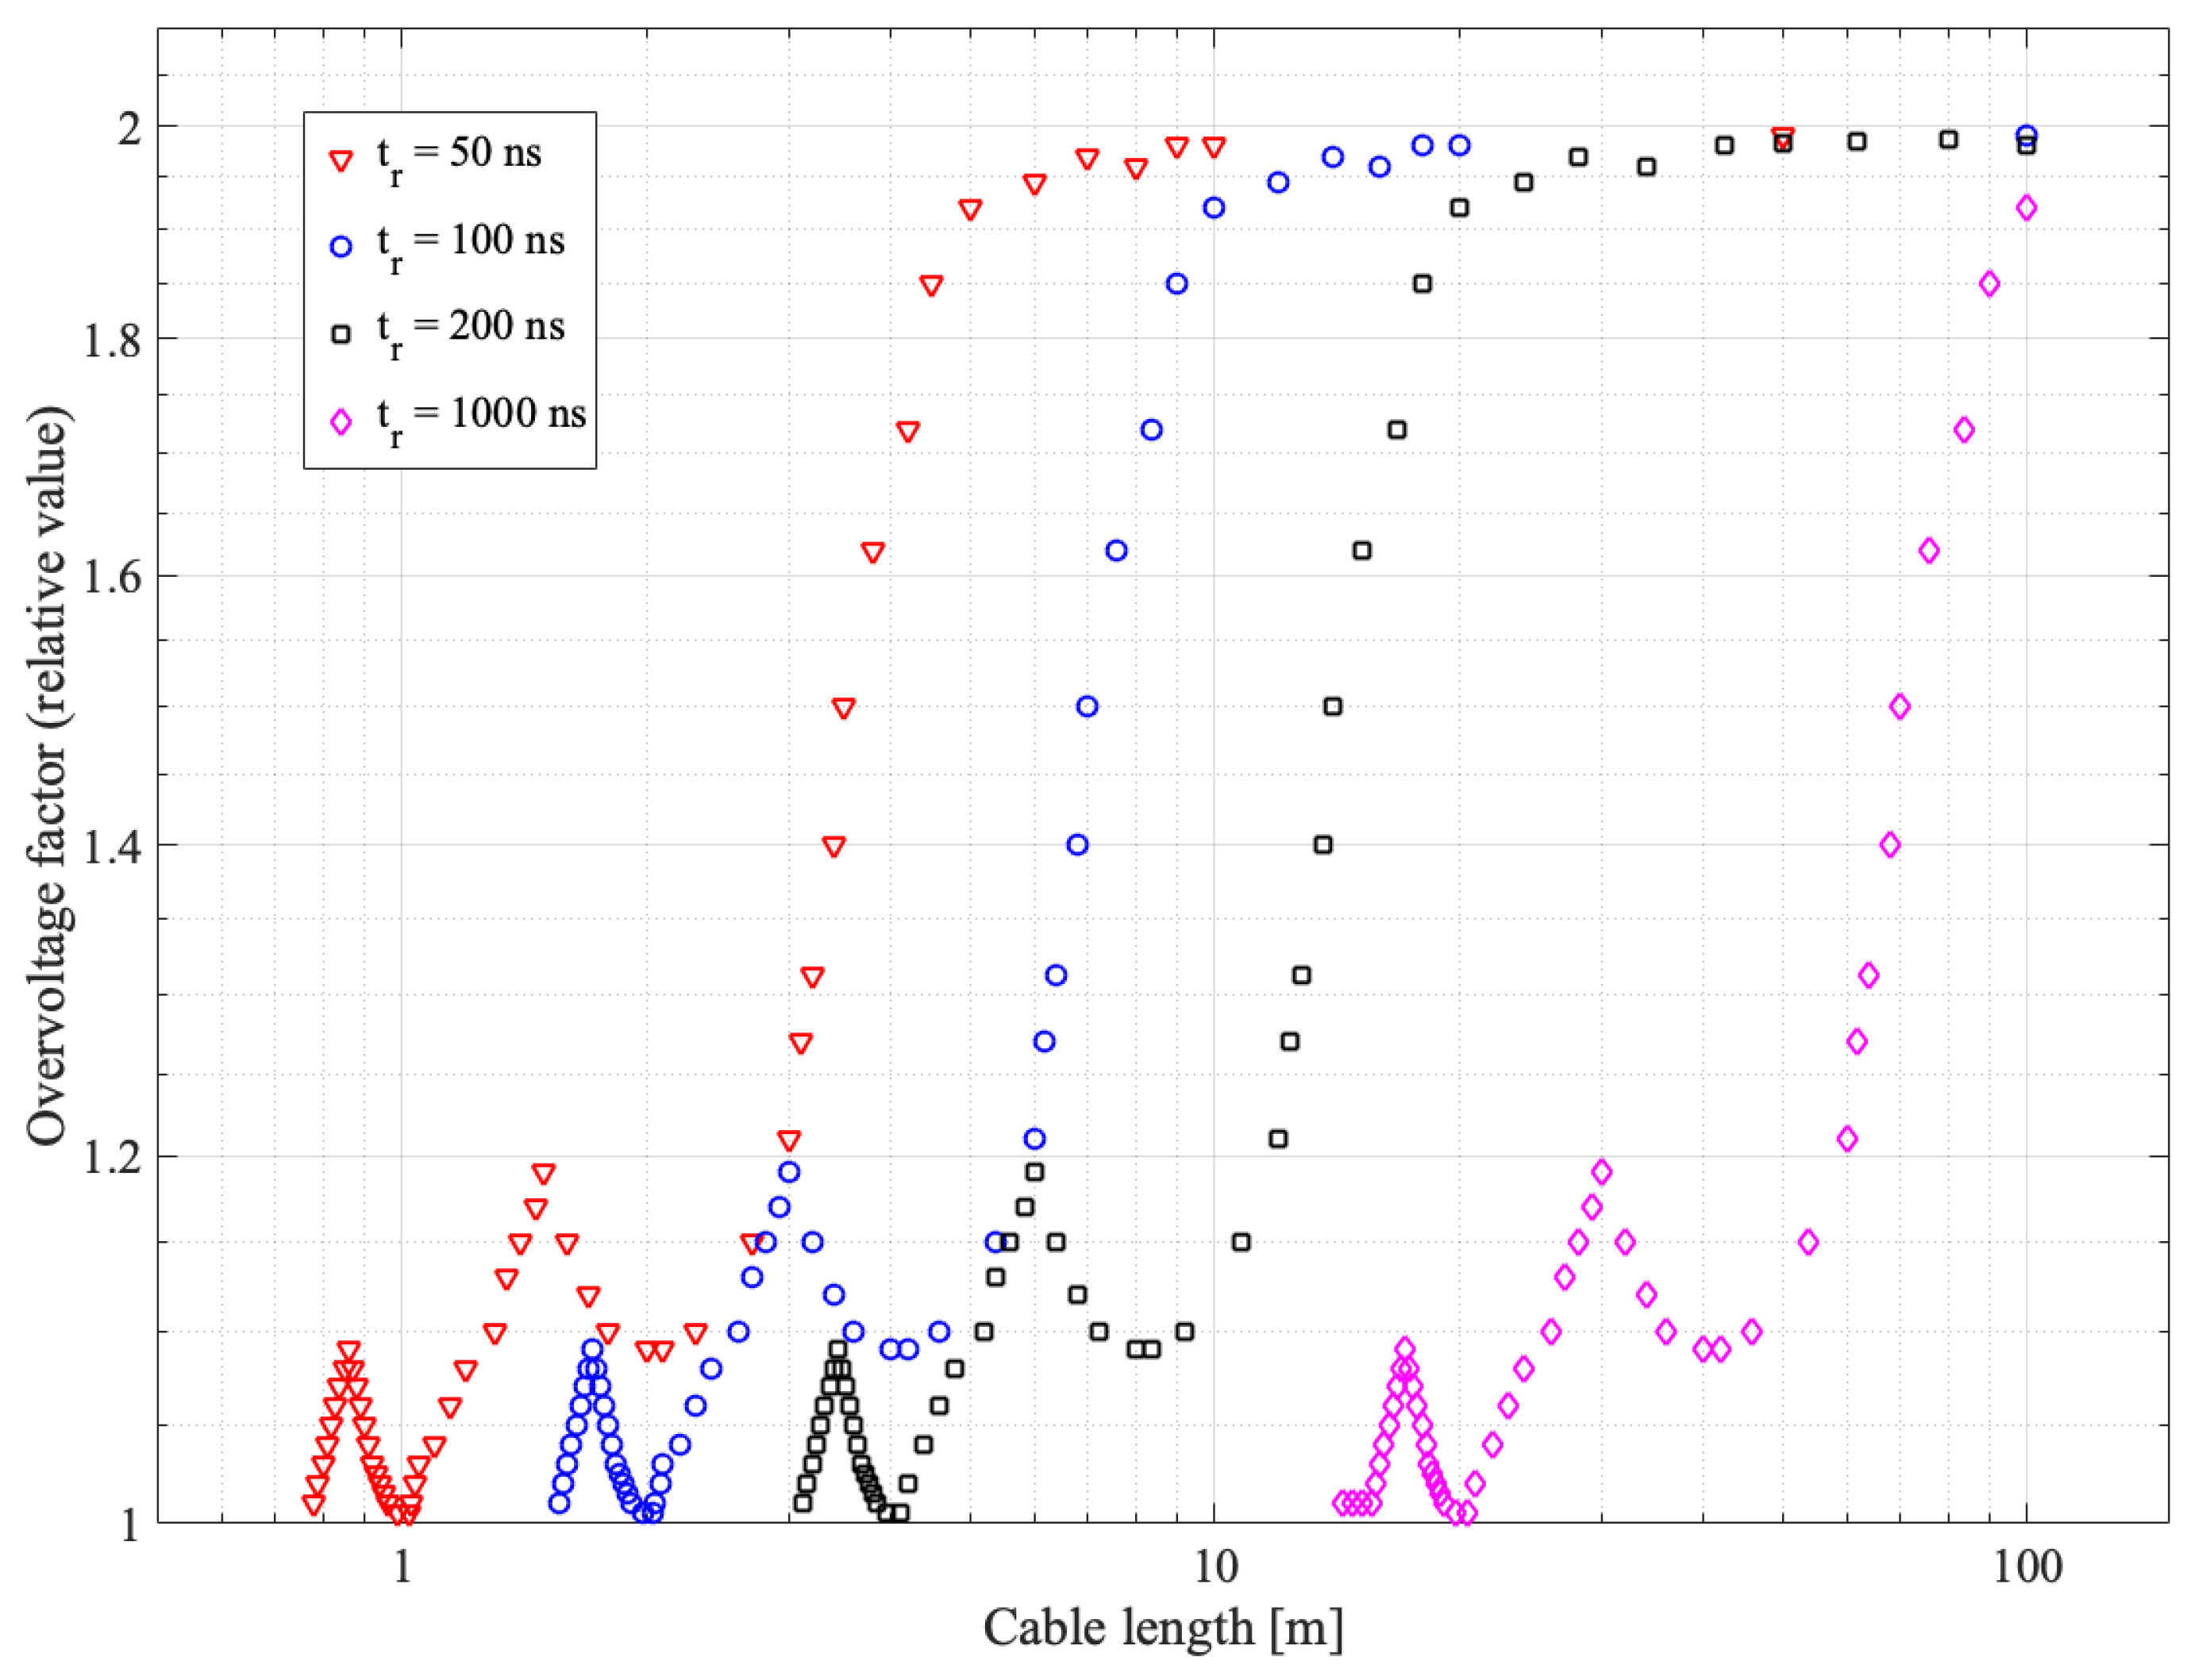
43], Jeremy C.G. Wheeler raised the importance of the increased aging of the drives supplied by the power converters and in particular the influence of the short rise times of the pulses coming from the inverter, the voltage overshoot at the motor terminals, and the repetition frequency of the pulses, making reference to the IEC standards. An example of the overvoltage for different cable lengths and rise times of the PWM signal of the converter is shown in
Figure 6, which is also presented in the IEC Standard.
Using the following equation, it is possible to calculate the critical length of the cable
, which leads to the full overvoltage for a known voltage rise time
:
where
and
v are the propagation time and velocity, respectively. For conventional inverters characterised by PWM signals with PWM rise times greater than 1000 ns, the overvoltage occurs for a cable length of 100 m, whereas for PWM signal rise times less than 50 ns generated by modern inverters, the overvoltage occurs for short cables, already with the cable of about 10 m. Consequently, although an increase in the switching frequency has the advantage of reducing the size and weight of the new converters, at the same time by reducing the pulse rise times, high
overvoltages are already reached even in the case of short cables. He also suggested to continue updating the IEC 60034-18-41 and IEC 60034-18-42 standards in order to fit the purpose of the purchased converter-fed machines to their users.
In addition to the reflection of voltage waveforms, the non-uniform distribution of voltage along the coil of the winding is considered to be another main cause of the increased electrical stress on the insulation system and leading to the generation of partial discharges. The non-uniform voltage distribution along the coil turns is caused by the parasitic capacitance introduced by the insulation, which has a significant value at high frequency. A detailed analysis of the irregular voltage distribution at the winding terminals of an electric motor powered by a PWM inverter was proposed by Don-Ha Hwang et al. [
44]. It has been shown by both simulation and experiment that the voltage
has a higher amplitude when the rise time of the PWM signal is lower; moreover, the first and last coils of the winding are often placed next to each other by construction and separated by a thin layer of insulation, and it is in this situation that the highest voltage occurs and can cause insulation breakdown.
Petrarca et al. [
47] analysed the dynamics of partial discharges and the electrical stress experienced by the stator windings using a multi-conductor transmission line model. Due to the parasitic capacitance of the insulation system, a non-uniform voltage distribution is produced along the stator windings. This work can be regarded as a valuable contribution to the design of electrical machine insulation.
The effect of insulation degradation of AC electric motors when fed by converters with a PWM voltage waveform will be analysed in the following sections. Firstly, studies of the microscopic effects of electrical ageing on simple systems will be presented (e.g., as single wires or dielectric defects of known geometry) by examining the relationships between the characteristics of PWM signals and the generation of partial discharges [
41,
43,
44,
46,
47,
48,
49,
50,
51]. Secondly, studies of the macroscopic effects of electrical ageing on complex systems (e.g., whole stator windings) subjected to thermal and electrical stress will be examined [
52,
53,
54,
55,
56,
57,
58,
59,
60].
3.1. Microscopic Effects
The components of the insulation system of an electric motor in a high-speed drive are subjected to repetitive PWM waveform voltages that affect the lifetime of the insulation. In order to understand which factors of the PWM signals are most damaging to the insulation, it is necessary to test and analyse the effect of these voltage waveforms in simple systems, i.e., in a single coil of the stator winding, in small samples of dielectric material with defects of known geometry or with air gaps, etc. IEC Standard 60034-18-41 indicates the characteristics of PWM signals that most affect insulation as shown in
Table 1 below.
For example, the peak-to-peak voltage at a fundamental frequency and the peak-to-peak impulse voltage (meaning the peak-to-peak of one level of a multilevel converter) are highlighted as the most significant in affecting the insulation. Rather than the standards that are analysing the peak-to-peak voltages such as for example in
Figure 6, in the literature treating this topic, the peak-to-peak voltage is usually kept constant in order to test other features, such as the rise time, the frequency, etc. For this reason, in the next sections, the following features will be included in the analysis and for the comparison: the voltage polarity, the rise time, and the frequency. Even though the these features are referring to macroscopic systems, i.e., a Type I machine insulation system, they can viably be adopted also in microscopic systems, as it is more easy to access the different parts of the dielectric.
In the literature, there are several works examining the degradation of insulation systems of AC motors produced by PWM voltage waveform signals. Many researchers have identified a significant correlation between voltage waveforms and the development of partial discharges and consequently insulation ageing mechanisms [
61].
By analysing the rise times, frequency, and duty cycle of the PWM signals and measuring the physical characteristics of the partial discharges, it is possible to derive an estimate of the life of the isolation system. This is precisely what has been done in [
41,
48,
50,
51,
62,
63,
64], where an estimate of the state of the insulation can be obtained as a function of the rise time, the frequency of the PWM signals, and the type of the PWM pulse (unipolar or bipolar).
3.1.1. Effect of the Voltage Pulse Polarity
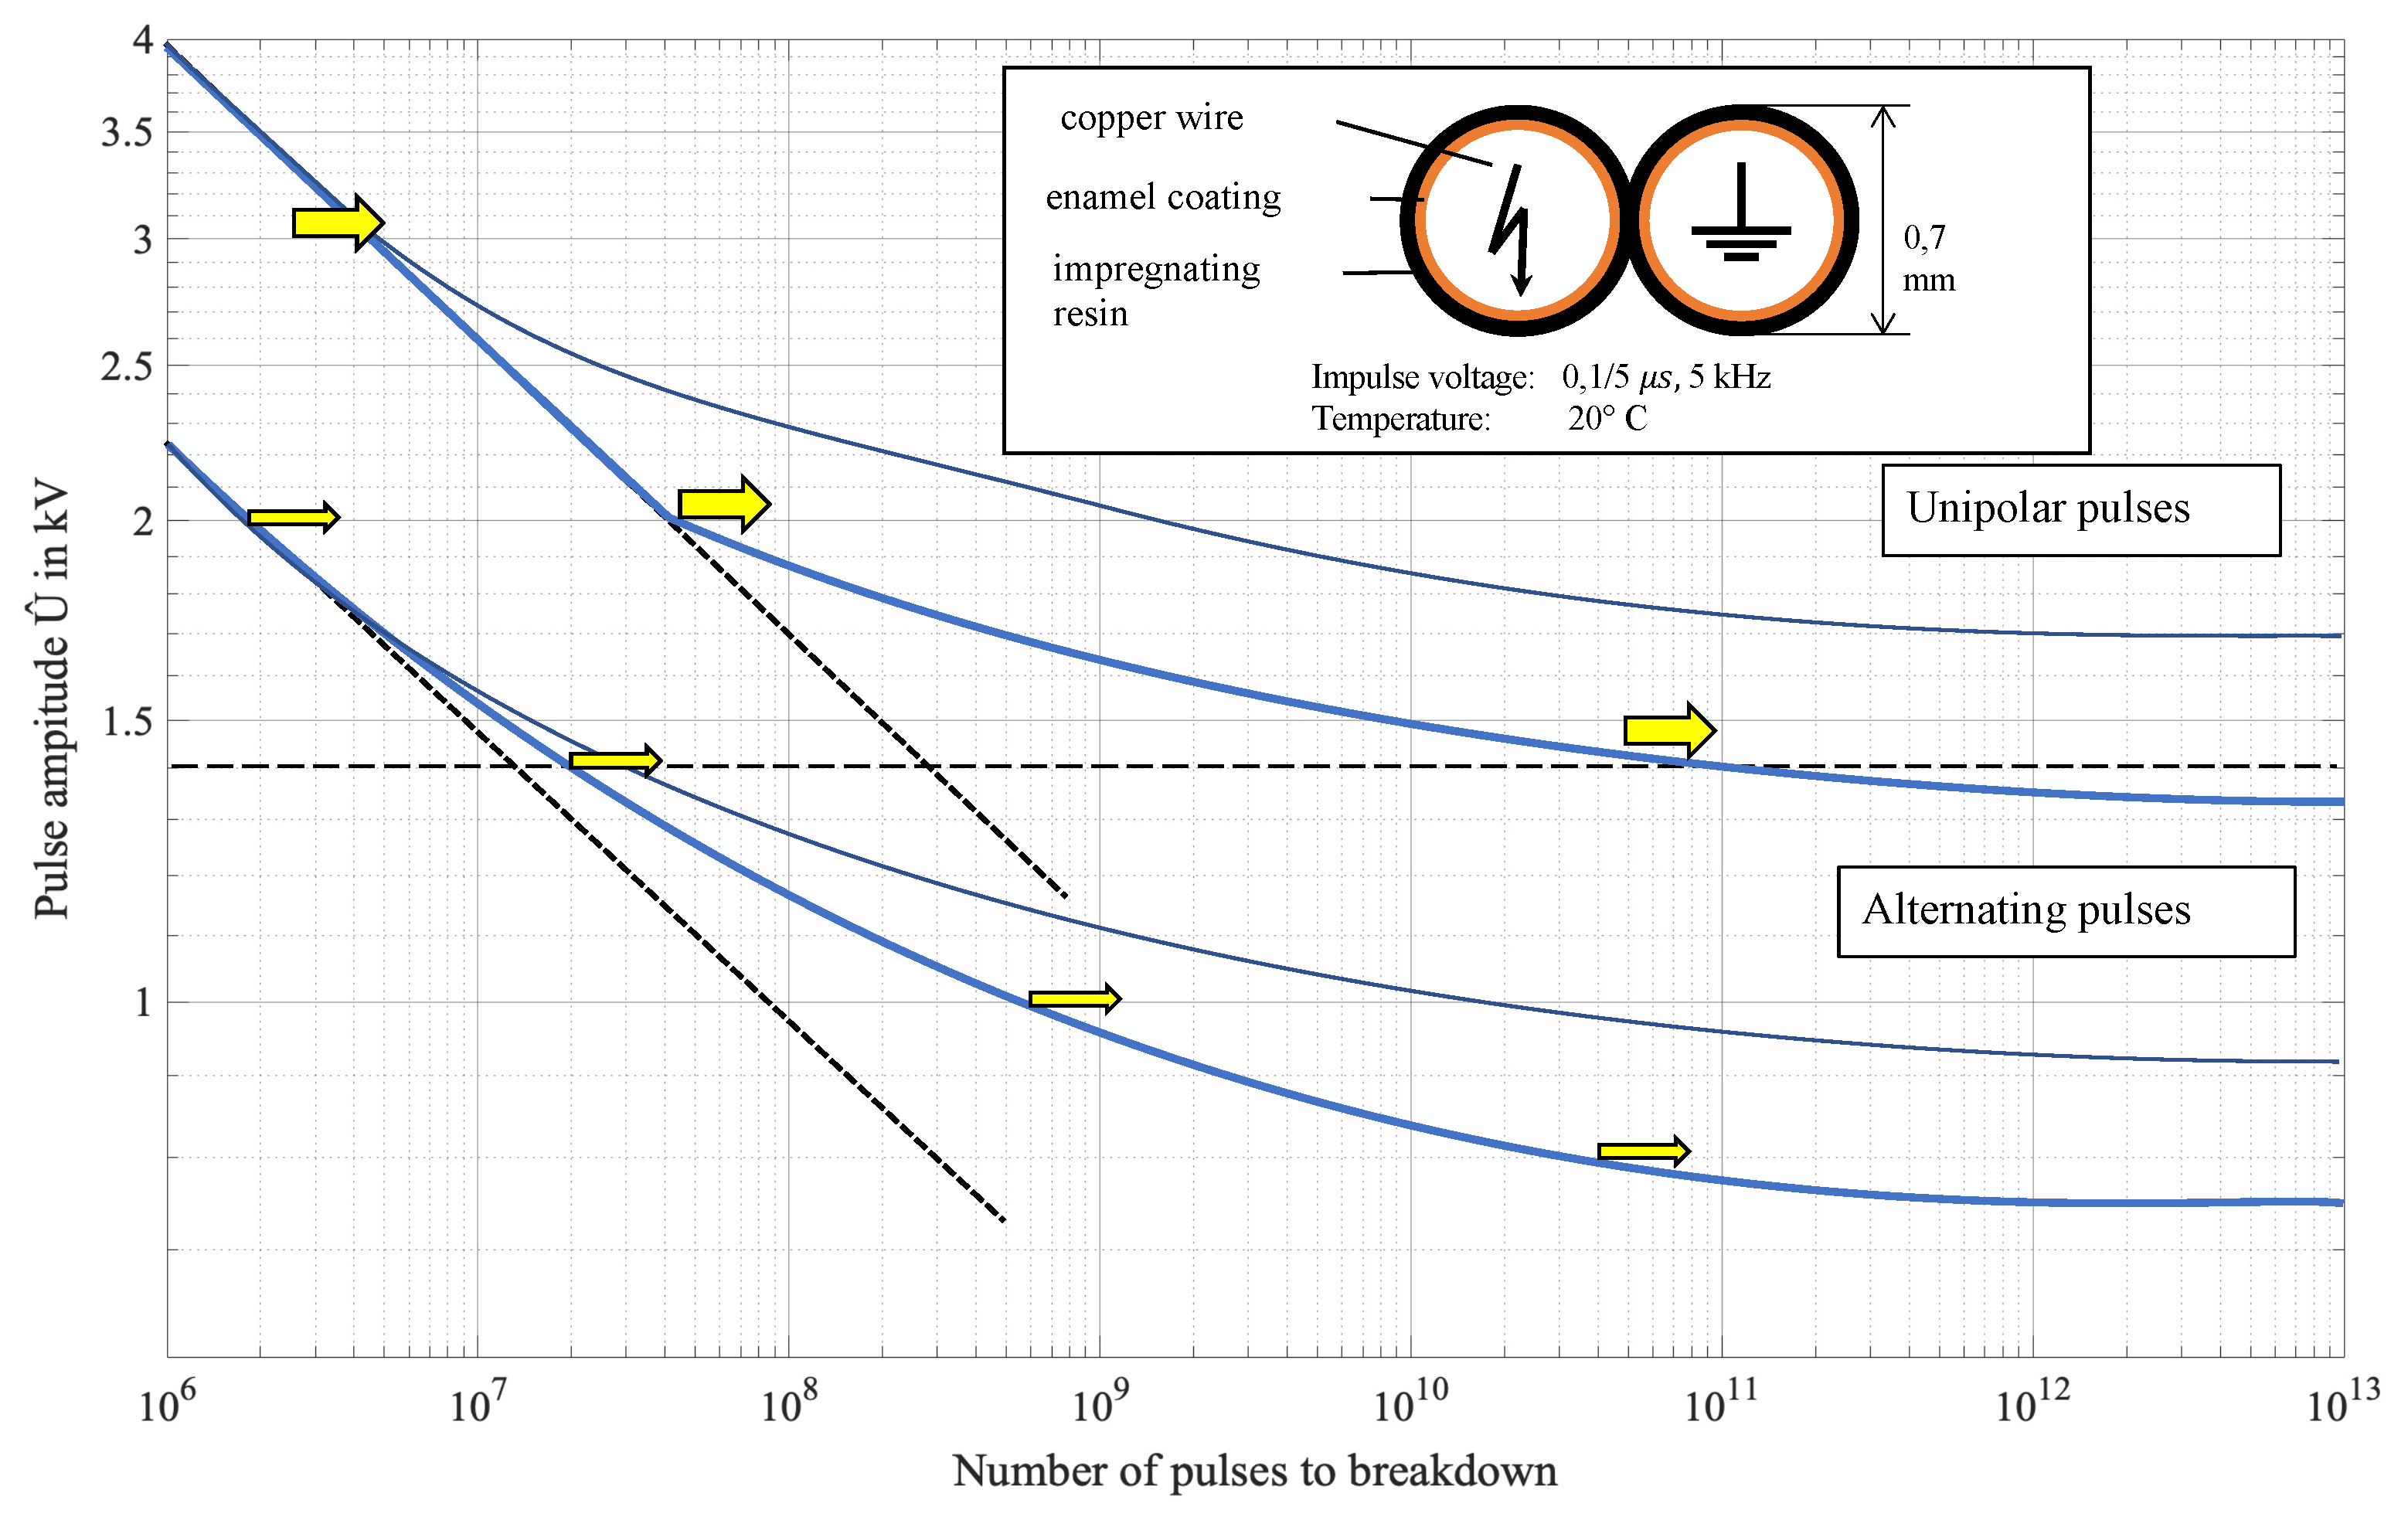
In the literature, the analysis has been conducted on the distinction of the type of impulse produced from the power converter, which can be bipolar or unipolar, and their influence on the lifetime of isolation systems. In Kaughold et al. [
41,
48], both were examined to analyse the ageing phases of the winding insulation of a high-speed drive induction motor. In addition, the authors provide an interesting relationship between PDs and the breakdown behaviour of an insulator. Bipolar pulses produce a higher electrical stress to the insulator, as shown in
Figure 7, where duration and partial discharge probability curves are shown for different voltage levels. The bipolar signal has a higher probability of generating a PD with a lower threshold voltage than the case of the unipolar pulse.
Yin in [
50] studied the failure mechanism of winding insulations in inverter-fed motors also subjected to insulation samples consisting of 3 mm thin wires with the same geometry to three different pulses: bipolar and unipolar positive and negative. The tests were carried out on standard 18 HAPTZ samples applying a peak-to-peak voltage Vpp of 2 kV with the switching frequency of 20 kHz and a rise time of 0.025
s. From the results, the author highlighted three different failure times, and in particular the samples subjected to bipolar pulses showed a shorter failure time than the cases applying unipolar signals. Therefore, a bipolar pulse causes a higher electrical stress to the insulation, and one explanation for this phenomenon is the continuous change of the voltage sign, which generates a counter field that has the same direction as the applied field, generating a higher local field. On the other hand, samples subjected to a positive unipolar pulse have a higher time to failure than negative ones with the same applied voltage and material geometry. The author formulated a possible explanation for the difference in the resulting life between the two cases, which lies in the formation of space charges under positive pulses. As the concentration of space charges increases to a certain value, the resulting field is limited by the space charges [
50].
In contrast, more recent work by Wang et al. [
62] has shown that the different polarity of the voltage square wave signal for frequencies of 5 kHz and 3 kHz does not lead to significant differences in insulation lifetime. It was only when testing the samples at a frequency of 1 kHz that a significant difference in lifetime was found between tests carried out with two different voltage polarities. The authors do not explain the physical reason behind this phenomenon but deduce that it resulted from a different duty cycle of the applied signal (
for 1 kHz and
and
for 3 kHz and 5 kHz, respectively).
3.1.2. Effect of Rise Time
In the work of Yin [
50] and later Wang et al. [
62,
63,
64], the effect of the rise time of PWM signals has been extensively studied. Yin noted that the faster the rise time, the higher the electrical stress and the shorter the isolation lifetime. In fact, it has been studied that for fast rise times of about 0.1
s, there is a thickening of the voltage potential on the first coils of the winding, which overstresses the insulation. Yin’s tests have shown that the rise time of the PWM signal is a factor that influences the lifetime of the insulation. To investigate this phenomenon, on the isolation samples were applied different rise times from 0.04
s to 0.1
s at a fixed frequency of 20 kHz with a 50% duty-cycle and a peak-to-peak voltage of 4 kV. It was noticed that for short rise times of less than 0.07
s, the insulation breakdown times were the same and lowest, while, on the other hand, subjecting the samples to longer rise times the dielectric breakdown time increased proportionally. The author therefore deduced that a short rise time with a high repetitive switching frequency accelerates the insulation degradation, even though the breakdown times are the lowest in this case. This is probably due to the dielectric heating effect.
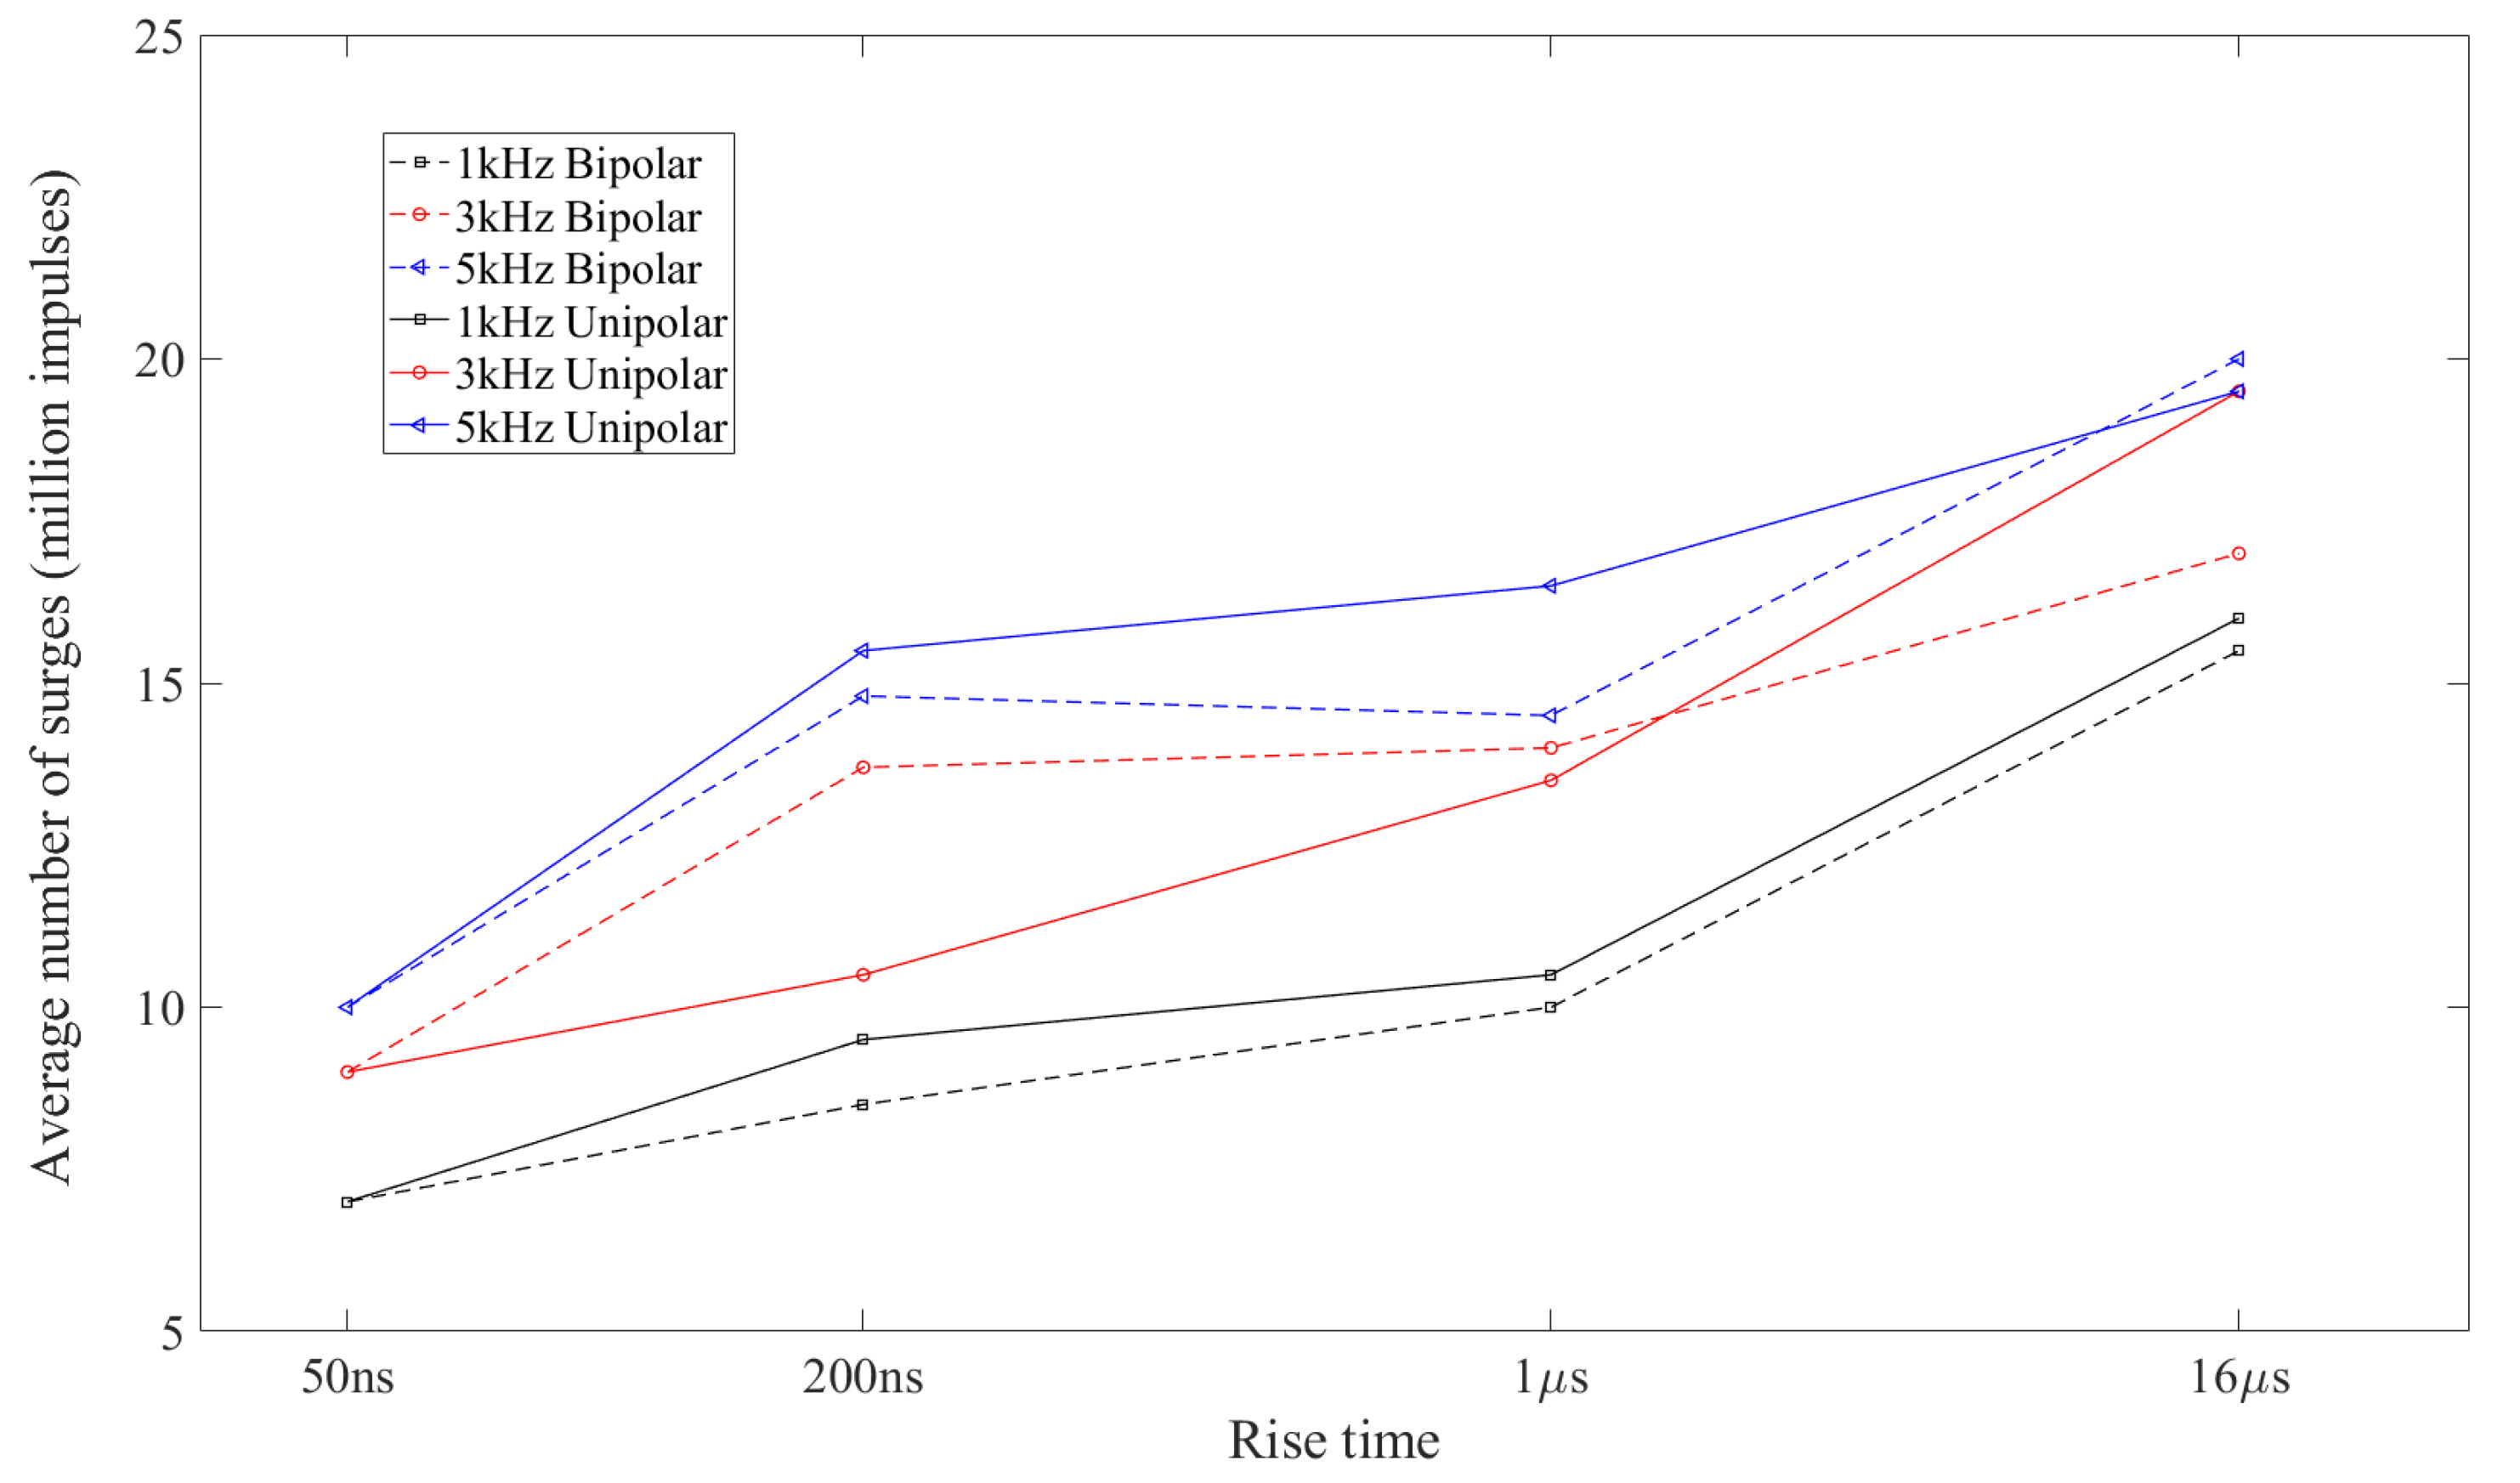
Work published in the 2000s by Wang et al. [
62] was done on small insulation samples and studied the effect of rise time, using the number of surges leading to insulation breakdown as a parameter to compare different rise times.
Figure 8 shows the average number of surges to failure as a function of the rise time for several rise times and frequencies. In particular, the number of surges to failure tends to be lower when samples are subjected to signals with lower values of the rise time, i.e., 50 ns. The same figure also shows that the number of surges to breakdown decreases with the impulse voltage frequency. Therefore, from the results of the tests that the authors conducted, it was found that short rise times lead to the generation of a single large PD event with a discharge energy 7–8 ev higher, which is certainly more damaging than that produced by some smaller PDs induced by long rise times. The authors explain that the magnitude of larger PDs for shorter rise times lies precisely in the mechanism of initiation of partial discharges, their stochastic delay due to the availability of the starting electron. Both the results by Wang and Yin agree on the danger of short rise times. However, it should be noted that these two works were performed under very different operating conditions; Yin tested the samples at a frequency of 20 kHz and a rise time of 0.04
s to 0.1
s, while Wang et al. tested at a frequency of 1 kHz to 5 kHz and with a rise time of 50 ns to 16
s, as depicted in
Figure 8. For these reasons, the effects of switching frequency on insulation degradation should be studied in more detail, moving to even higher switching frequencies and shorter rise times.
Multilevel PWM signals with variable rise times have recently been investigated in [
49], as a future solution to reduce the magnitude of PDs or even eliminate them. In particular, an attempt was made to lengthen the duration of the rise times at times when the electrical stress on the insulator is greatest and the magnitude of the PD is reduced considerably. The tests were carried out using three- and four-level PWM voltage waveforms. The author proposed a technique to decrease the wear and tear on the insulation system, while the ability to use shorter rise times was retained and therefore could be well suited for new WBG semiconductor devices without taking unnecessary risks for the insulation health.
3.1.3. Effect of the Frequency
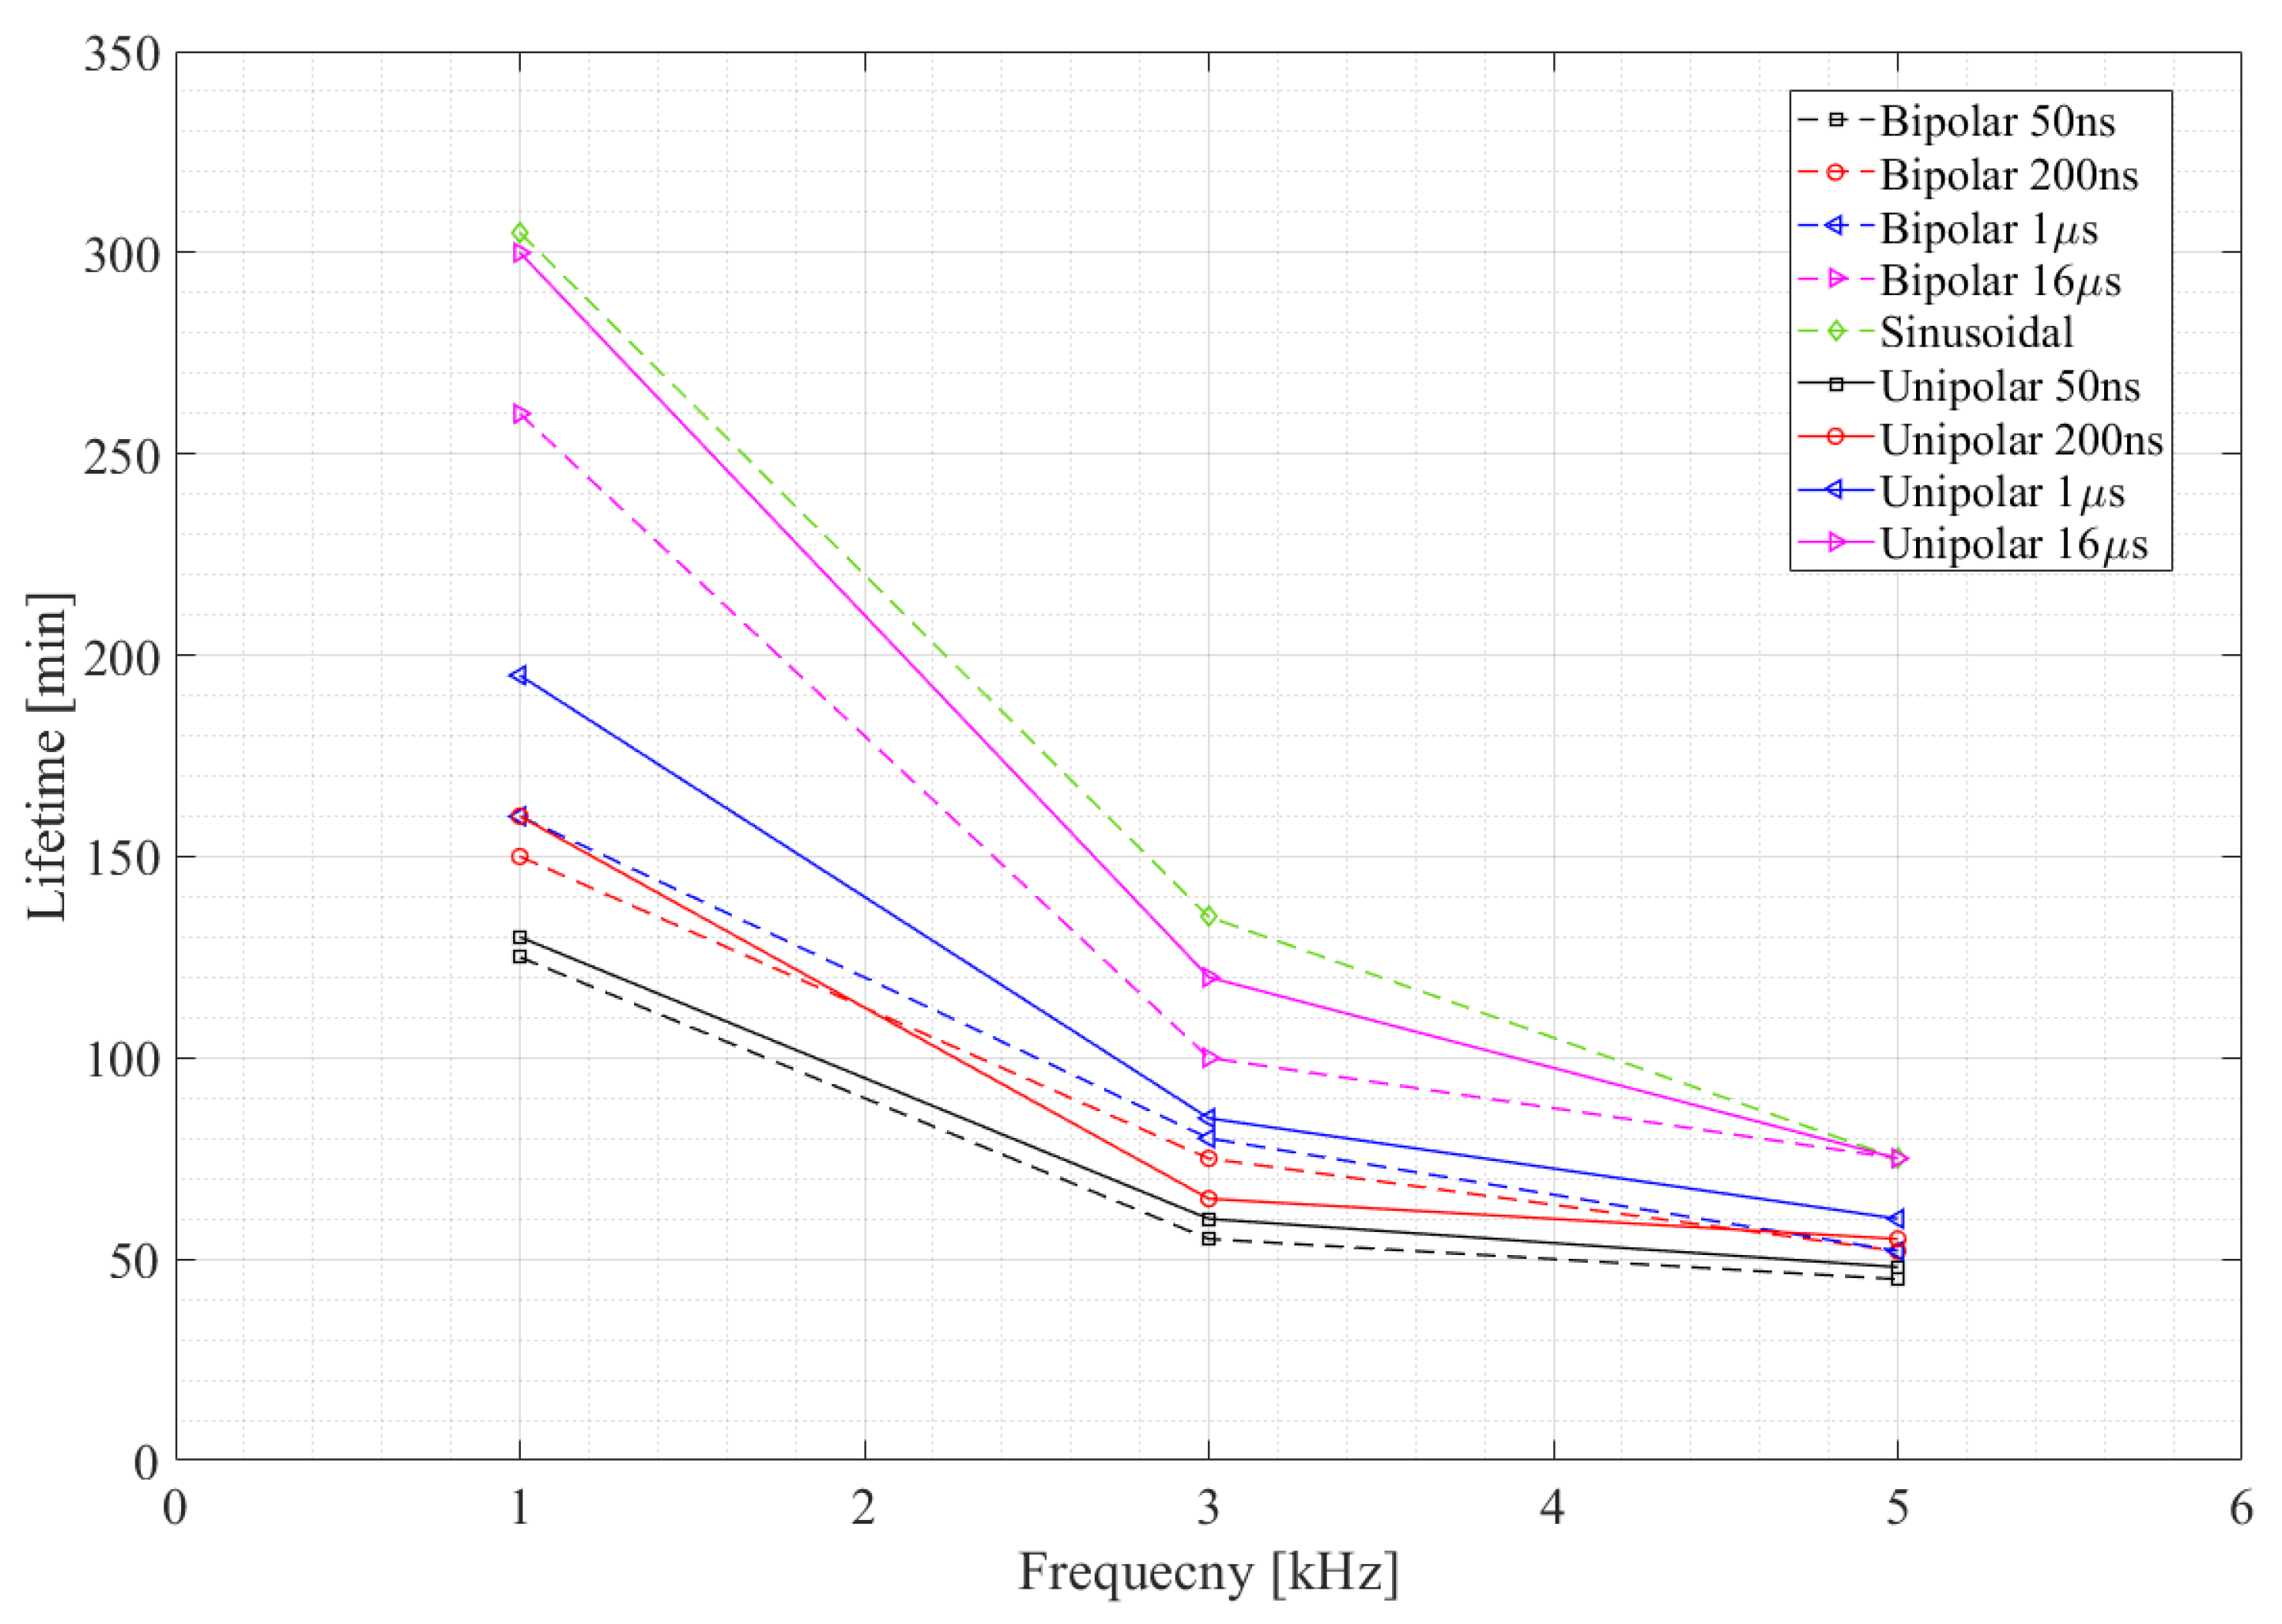
From the results highlighted in the works of Wang et al. [
62,
63,
64], it emerges that statistically the effect of the frequency of PWM signals has a direct relationship on the generation and amplitude of partial discharges. From Wang’s results shown in
Figure 9, the failure time is approximately inversely proportional to the increase in the frequency of the PWM signals. At the higher frequency of 5 kHz the life of the insulation is reduced compared to tests carried out at lower frequencies. The authors also deduce important considerations regarding the frequency of the pulses. Operating with a low-frequency signal and therefore long rise and fall times, experimental verification has shown that the PDs generated have a greater amplitude than those obtained at high frequencies. The reason for this is that longer times favour the trapping of the surface charge left by the previous PDs, hence larger statistical delays and consequently higher overvoltages.
These works provide a good basis for understanding the causes that can affect the insulation system the most, when subjected to PWM square wave signals. The relationships between the lifetime of the insulation and the characteristics of the PWM signals provide important information for safeguarding the insulation and understanding when discharge activity may occur during motor operation. However, the frequency, voltage, and rise-time values of the signals used in the state-of-the-art analysis are not updated for modern high-speed electric drives. As has been shown, the tests examined in these articles are limited to a PWM signal with a maximum switching frequency of 20 kHz if not lower, far from the frequency commonly used today by new generation converters (up to 100 kHz). There is certainly a lack of analyses and tests carried out at higher frequencies, which can more faithfully represent the new high-speed drives.
3.2. Macroscopic Effects
In the previous paragraphs, the main phenomena responsible for the initiation of partial discharges and the effects of PWM waveforms on samples of dielectrics or twisted wires were introduced to describe the main ageing mechanisms in insulation systems, described as microscopic effects. However, the effects of PDs and the ageing estimation on more complex systems have been studied in the literature. Research in this area has also investigated the possibility of estimating the ageing of entire randomly wound stators by measuring easily accessible quantities and studying the macroscopic effects of PDs acting on thermal [
52,
53,
56,
57] and electrical ageing [
58,
59,
60], such as variations in impedance and high-frequency currents. In particular, of interest is to analyse the phase current in both time domain and high frequency spectra, as well as the high frequency impedance or the insulation capacitance. In both time and frequency spectra it is possible to notice the changes in the healthy and degraded insulation.
In this section, the literature aimed at studying the overall ageing of the insulation system of entire windings will be reviewed, and on-line and off-line techniques for estimating the life state of the insulation will be defined. The considerations made in this survey may be a good starting point to modify the current standards and guidelines for electrical insulation systems used in rotating electrical machines supplied by voltage source converters, such as IEC Std. 60034-18-41 [
16] or NEMA Std. MG1-31 [
65].
In particular, a comparison of the overvoltages allowed at motor terminals given by the two standards is shown in
Table 2. In order to compare the overvoltages, it is assumed that the minimum DC bus voltage, i.e.,
= 1.6
, where
is defined as rms line-to-line rated motor voltage in [
65]. PD-free voltage in NEMA standard is intended to correspond to the upper limit of the moderate stress category in IEC Std. 60034-18-41; in fact, it is slightly lower than the maximum possible voltage of the B category. On the other hand, for the IEC Std. 60034-18-42 [
17] rgw Type II category has been described and is expected to withstand partial discharge activity in any part of the insulation system throughout their service lives. Examples of the enhancements that are produced for various rise times and cable lengths in the case of a two-level converter are given in
Figure 6. Supposing a 10 m cable length and the lowest rise time (50 ns), an overvoltage 20.4
kV/
s can be calculated, which is comparable to the withstand voltage defined by the NEMA Standard. To summarize, the NEMA limits are slightly lower for both insulation categories, i.e., 6–8%. It is to be noted that these standards do not consider lower rise times, which can be observed in modern WBG-based converters.
An accelerated ageing campaign is required to study the degradation of the stator winding insulation system. The standard IEEE 1776-2008 [
66] provides guidelines and directives for accelerated ageing of an insulation system through thermal cycles. In order for the test to be performed correctly, the stator winding should be subjected to repeated thermal cycles, mechanical stress, exposure to moisture, and finally a voltage test to analyse the condition of the insulation. The test is repeated for several cycles until a failure is determined by the voltage test. These tests aim to evaluate the macroscopic effects of thermal deterioration of the insulation so that changes in the physical properties of the insulation can be highlighted.
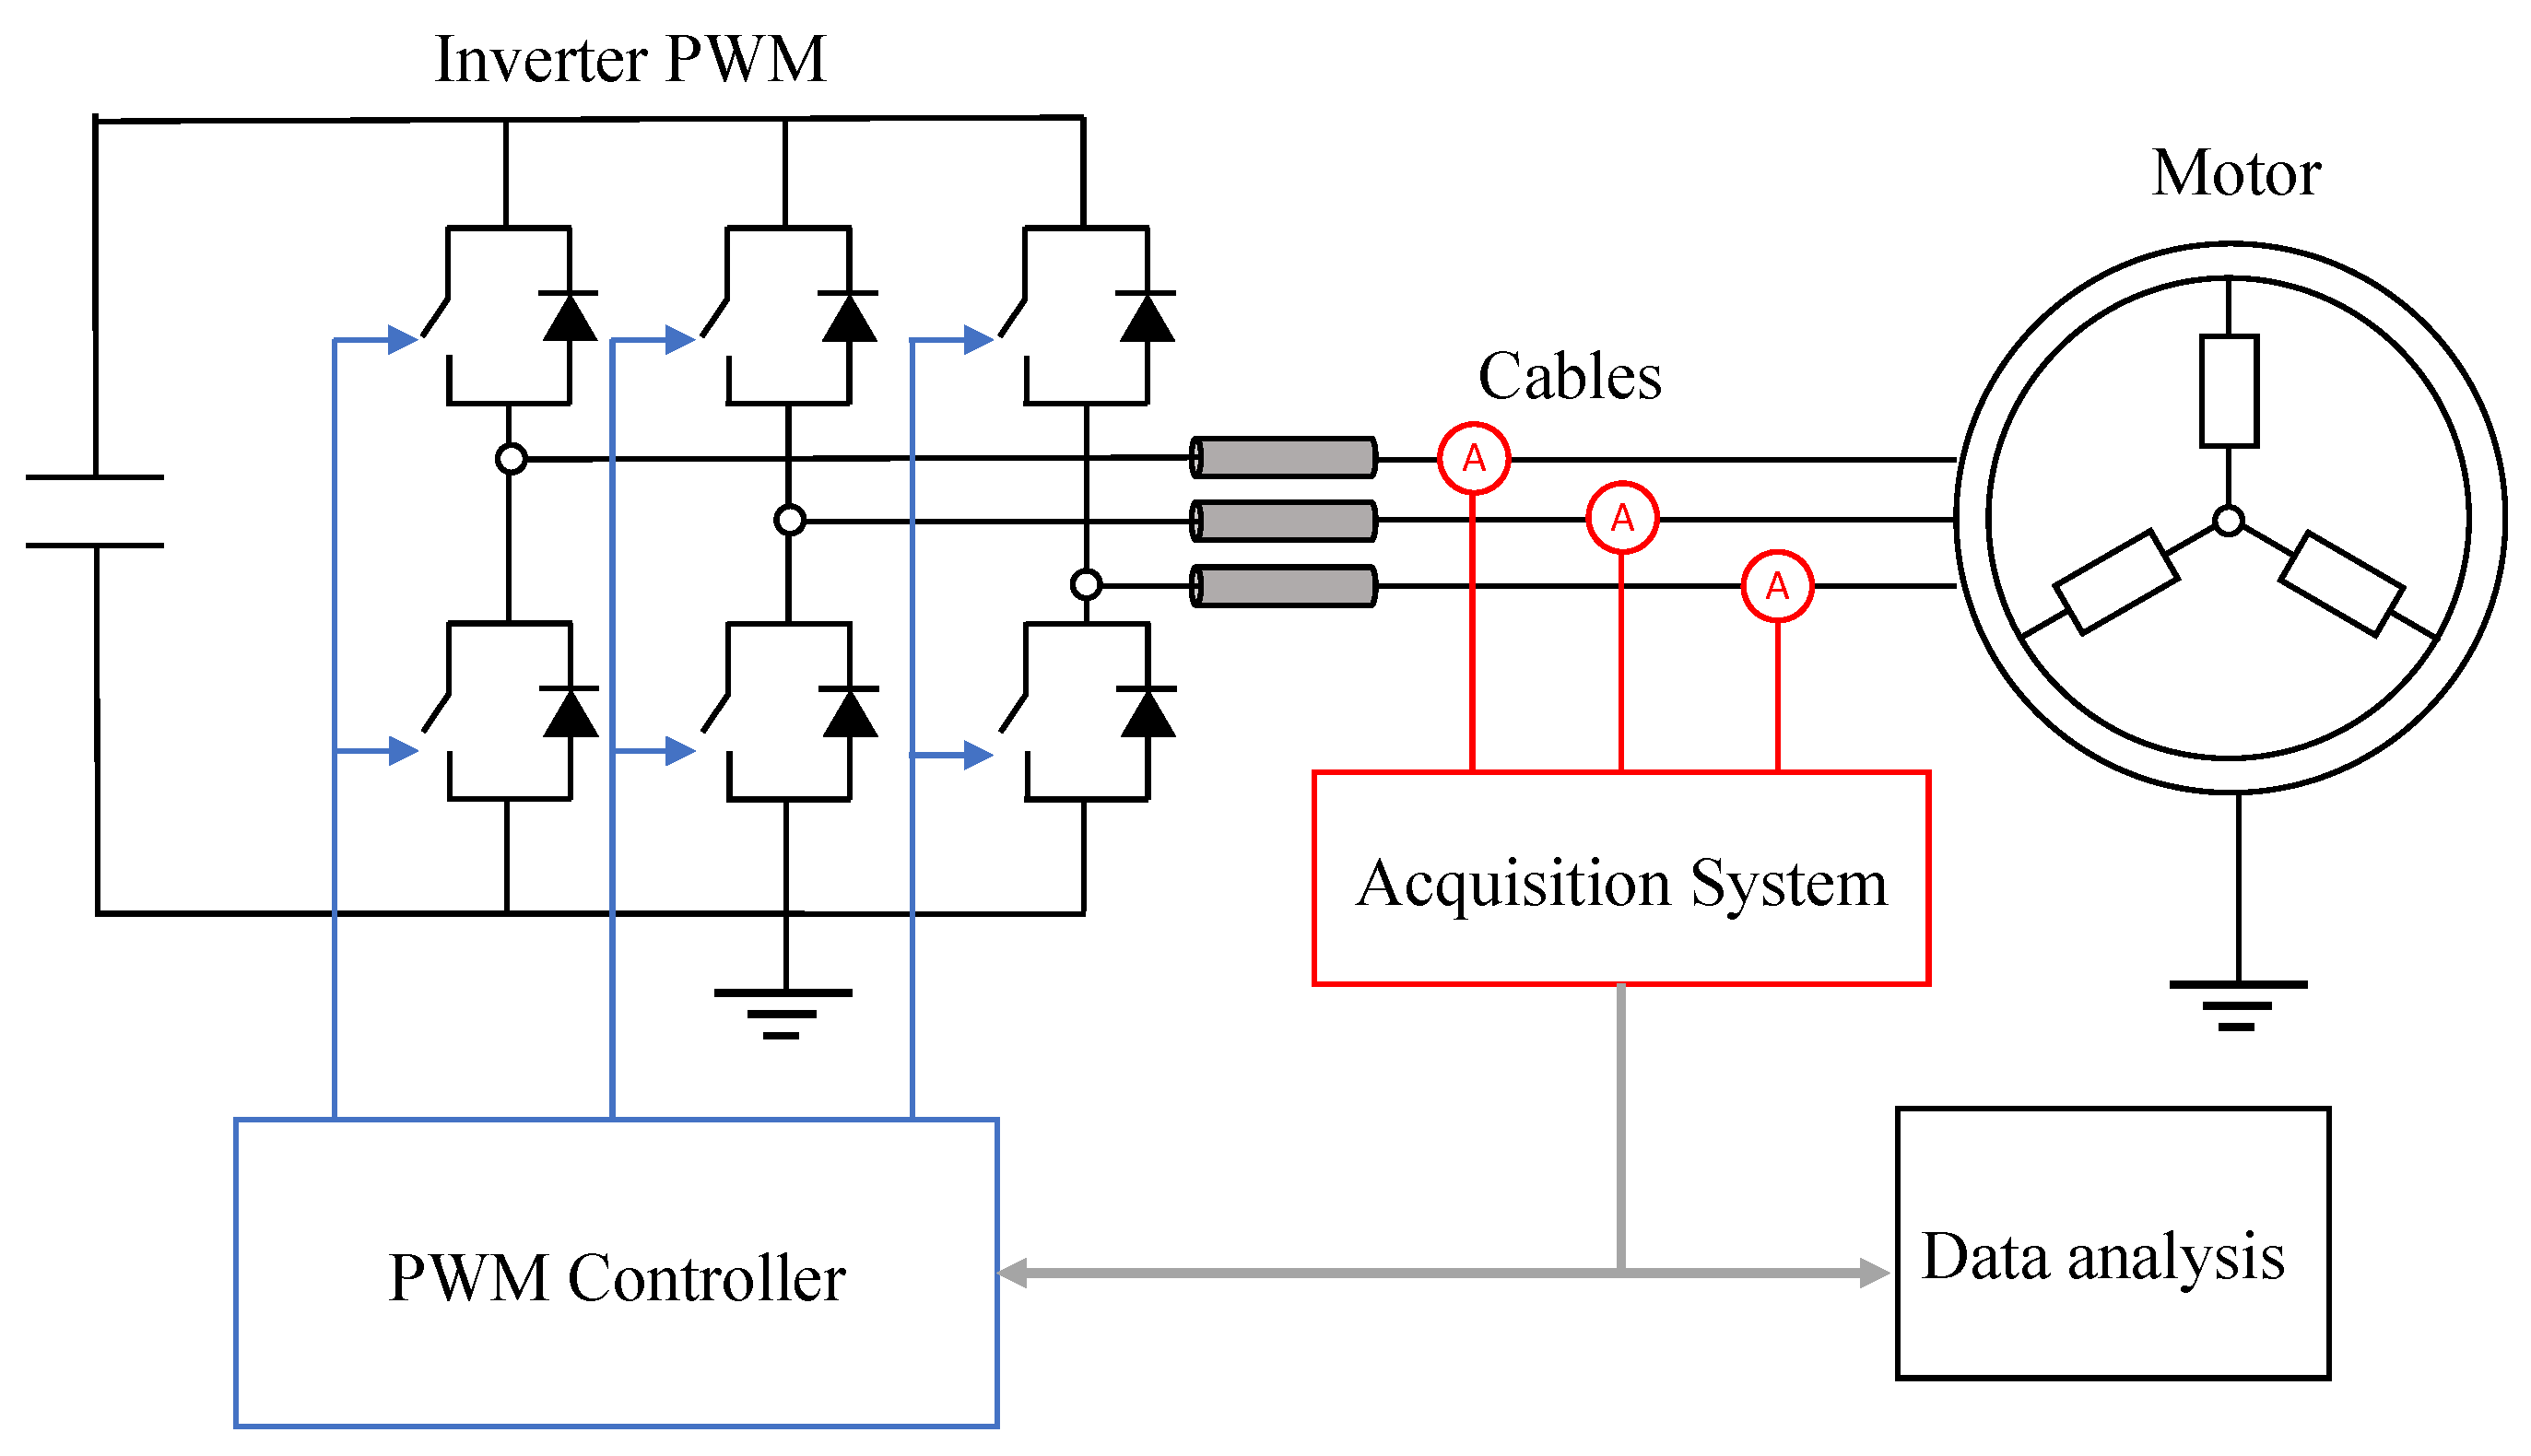
A work using these thermal ageing campaigns of stator winding coils was provided by Zoeller et al. [
52]. Subsequently, the authors, based on their observations from the ageing tests, proposed a technique for monitoring the deterioration of the insulation system of a stator winding. By analysing the phase current transients of the stator winding, the authors examined the change in dielectric resistance and thus the health of the insulation. In addition, ageing campaigns were carried out on stator winding samples, which showed that the capacitance introduced by the insulation system is a key parameter in quantifying the degree of ageing of the dielectric material. Such a monitoring technique is of fundamental importance to ensure the reliability of the electrical machine and to optimise the electrical drive. A general schematic of how these techniques are performed is described in
Figure 10.
Leakage current is a useful quantity to evaluate the state of the insulation because it has a direct dependence with the variation in the electrical properties of the dielectric during ageing. Jensen et al. [
53] proposed an online monitoring technique based on the extended Kalman filter (EKF) and estimated the insulation state without the use of expensive equipment by monitoring the leakage current. This state observer performs the estimation of state variables using a recursive algorithm, i.e., it updates the estimated value with that of the next step. The prediction of state variables is reliable even if noise affected measurements are used as input. EKF is probably the most widely used estimation algorithm for nonlinear systems. The one designed by Jensen et al. processes the measured leakage currents through series resistors and estimates the remaining useful life (RUL) of the machine insulation, obtaining reliable and useful results for monitoring the insulation of the electrical machine during its operation. Although this state observer is easy to implement, it very often has a very high computational cost, especially when implemented in very non-linear systems. Moreover, relying on the linearization of the state variables, it has a first-order accuracy that can lead to filter instability [
67]. Jensen et al. designed the state observer with a low sampling rate, finding a trade-off between the estimation accuracy and the computational cost of the technique.
Previous work has studied the macroscopic effects of thermal ageing on complex systems. However, it is also interesting to analyse other works in the literature that deal with the effects of electrical ageing on the insulation of the stator winding coils of AC motors. In [
58], the effects of stator insulation ageing in wet and dry conditions and under electrical stress from overvoltages of three times the nominal voltage in a cyclic manner were investigated. From the tests the authors were able to estimate the change in insulation resistance and frequency domain spectroscopy (FDS) from which useful information on the condition of the insulation could be deduced. Analysing the degradation of the insulation of a stator coil during electrical stress allowed the authors in [
59] to identify the bending area of the coil as one of the points where ageing occurs most rapidly. In order to reduce wear and tear on the insulation, it is necessary to increase the bending radius of the copper edge of the conductor. The authors are convinced that the type of manufacturing process of an electrical machine winding influences the unevenness of insulation degradation.
As seen in the previous paragraphs, the insulation of the stator winding of an electric machine is one of the most fragile elements and is the most frequent failure in electric motors [
14,
15]. During normal operation of an electric motor, the insulation is subjected to electrical, mechanical, and thermal stresses and in the long run can break down, causing catastrophic failure. Therefore, the need has arisen to implement insulation condition monitoring techniques that also allow preventive machine maintenance to be scheduled with the aim of achieving optimum maintenance schedules to minimise downtime. In addition, a condition monitoring system provides an early indication to maintenance personnel so that they can organise the procurement of necessary spare parts before a major machine failure occurs.
In this regard, several monitoring techniques, both on-line and off-line, have been investigated to assess the remaining useful life (RUL) of the insulation. A comprehensive review of testing and monitoring methods for stator isolation systems in machines was provided by Grubic et al., analysing both the most common off-line and on-line techniques in the industry [
10].
On-line tests are widely used because they are performed during the nominal operation of the machine and are able to examine quantities such as temperature, electromechanical forces, machine voltages, and currents during normal motor service and thus detect most faults in the stator and rotor windings of an electric motor, without ever disconnecting the machine from service. Although these methods are very promising and lead to reliable results, a large amount of capital is required to implement them due to the large number of sensors that need to be installed for each motor to be monitored such as high-frequency current transformers (HFCTs) [
68].
The tests carried out when the machine is disconnected from the system are off-line tests, and they can be done when the machine is partially disassembled or simply performed directly on the terminals of the motor stator winding [
54,
55]. Yang et al. proposed an off-line analysis method to detect the stator insulation degradation of an inverter-powered electrical machine. This method provides an effective and low-cost solution to monitor the insulation ageing status so that the maintenance of the machine can be efficiently planned according to its current condition. One of the main limitations of off-line techniques is that tests are performed years apart, so if tests are not performed under the same conditions, they do not provide useful results for estimating the remaining life of the insulation or its current condition. In addition, downtime is often long, and the machine is disconnected from the drive for more than a day.
4. Selection of the HF Motor Model
Industrial electric drives are commonly consisting of an electric motor and a power electronic converter, offering in this way optimal performance and flexibility. With the developments of the WBG devices and the high-switching operation, the models of the electric motor that could describe in more details the high-frequency behaviour of the motor have become the crucial point. This kind of model can be seen as a key tool to better understand the overvoltage problems in PWM drives and conducted EMI but also for the development and benchmarking of the mitigation techniques, which can suppress the overvoltages such as for example the filter.
For this purpose, the low-frequency equivalent circuit should be modified by including parasitic elements in winding structures, as they play a dominating role in the behaviour of the system. There are mainly three kinds of high-frequency motor models: the lumped-parameter model (widely investigated), the multi-section model, and the transmission line model. The lumped-parameter model, where the interturn insulation parameters are not modelled, cannot show the inner structure of the stator winding, and the relationship between the parameters and the insulation ageing is not easy to study, at least in the specific location. They are, however, very useful to predict the overvoltages at the motor terminals [
69,
70,
71,
72,
73,
74,
75,
76,
77,
78,
79,
80,
81,
82]. On the contrary, the multi-section model can describe the inner structure of the winding and is suitable for online monitoring and detecting techniques. One example of the model is given in [
83]. However, this model does not fit the experimental results well. Another model has been proposed in [
84] with improved accuracy, but it still needs further research to fully distinguish the groundwall and interturn insulation ageing. The transmission line model considers the stator winding as a uniform transmission line [
85], but being the interturn that ages a non-uniform process, it is hard to represent it properly.
The importance of the accurate modelling of AC motors in the high-frequency range is evident, as it plays the key role in investigating the motor overvoltage, responsible for higher occurrence of the partial discharge phenomenon and eventually breakdown of the motor insulation. In the following, mainly the lumped-parameter models were analysed in more details, as they can accurately predict the overvoltages applied at motor terminals, give the insight of the parameters directly connected with the insulation problems in terms of macroscopic effects in case of high dv/dt, and help develop the overvoltage mitigation techniques. These models can be applied to motors with different power ratings, naturally parametrized according to the HF motor model parameters, usually provided in the different works. They can also be used in any simulation tool due to their simplicity, preferably allowing dynamic simulation.
The HF model of the motor was firstly introduced in Grandi et al. [
69], where the winding of the motor was considered as the “mush wound coils,” instead of a “form wound coils”, taking into account only a single-coil model. The equivalent circuit takes into account turn-to-turn and turn-to-iron stray capacitance. It also considers the eddy currents and the laminated iron core dissipating phenomenon. The model allows to predict both common- and differential-mode conducted EMI in PWM AC drive but can viably be used also for the evaluation of the voltage distribution along the windings. The equivalent circuit is represented in
Figure 11.
The overall inductances
represent the sum of the inductance of the wires in the overhang region and the inductance of the wires in the slot region. These values have been determined on the basis of the extrapolation done on a coils with a reduced number of turns in order to limit the parasitic capacitive effects. The resistors
represent the AC wire resistance. It takes into account the skin and proximity affects, but for the sake of simplicity it has been fixed at the mean value, as the skin and proximity phenomena are affecting the air-core coil behaviour only up to few hundred kilohertz, which is the lower bound of the considered frequency range in this case. The resistors
take into account the dissipative phenomena due to HF capacitive currents and dielectric losses. The capacitances
take into account the overall parasitic capacitances of the randomly distributed turns, which cannot be determined on the basis of the coil geometry due to its random nature. The
represent the turn-to-ground resistance and capacitance, since the laminated iron core is electrically connected to motor frame, which is usually grounded. The single-coil model has been extended to the multi-coil model in [
70], including mutual inductances to describe the magnetic coupling among the phases. In this article, the series connection of two resonators of a real coil was adopted for each phase to represent the part of the winding embedded in the stator slots and the end windings. The mutual inductances were measured, and mutual capacitances were neglected, since they are negligible when compared to phase-to-ground capacitances.
Another early per-phase model can be found in Boglietti et al. [
71] based on lumped parameters, proposing an AC motor model of a single phase, which presents between the phase and the neutral:
Series connection of the stator/rotor resistance R and the leakage inductance to describe the low-frequency behaviour, which can be obtained by the locked rotor test with a fundamental frequency. However, the suggested value of the leakage inductance to be used in the HF motor model is not the one obtained by the locked rotor test but is calculated and estimated on the basis of the high-frequency impedance measurements.
Resistance to account for eddy currents inside the magnetic core and the frame, estimated from the high-frequency impedance measurements.
Capacitance representing the turn-to-turn distributed capacitive coupling, calculated and estimated according to the high frequency impedance measurement. Usually a very small value, which is much smaller than the winding to ground distributed capacitive coupling.
Besides these elements, there is a capacitor between the phase and the ground and an equal capacitor between the neutral and the ground to model such distributed capacitive coupling of the winding. An attempt to merge the HF motor model with the low-frequency
dq motor model has been made, but no results have been reported [
72]. The same model has been used to obtain more results on several types and sizes of industrial AC motors, including induction, synchronous reluctance (without interior permanent magnets), and brushless motors in [
73].
The model presented in [
71] and depicted in
Figure 12 has also been extended to the complete AC PWM drive, from the transformer of the main power source to the electrical motor [
74]. The transformer is represented by the standard short circuit parameters; the inverter is modelled as an ideal voltage source, and a stray capacitance between the substrate and the heat sink of each IGBT was measured with an RLC meter. The cable was represented by the single T cell, and for the motor the models developed in [
71,
72] have been used, described only with the input capacitance due to the winding insulation and the motor frame resistance. In the second attempt, the skin effect on the inverter inductances has also been accounted for in the final model. The obtained model allows analysing in the time domain the effects of the high
dv/dt applied by the PWM inverter and the leakage currents that flow through the stray capacitance of the system.
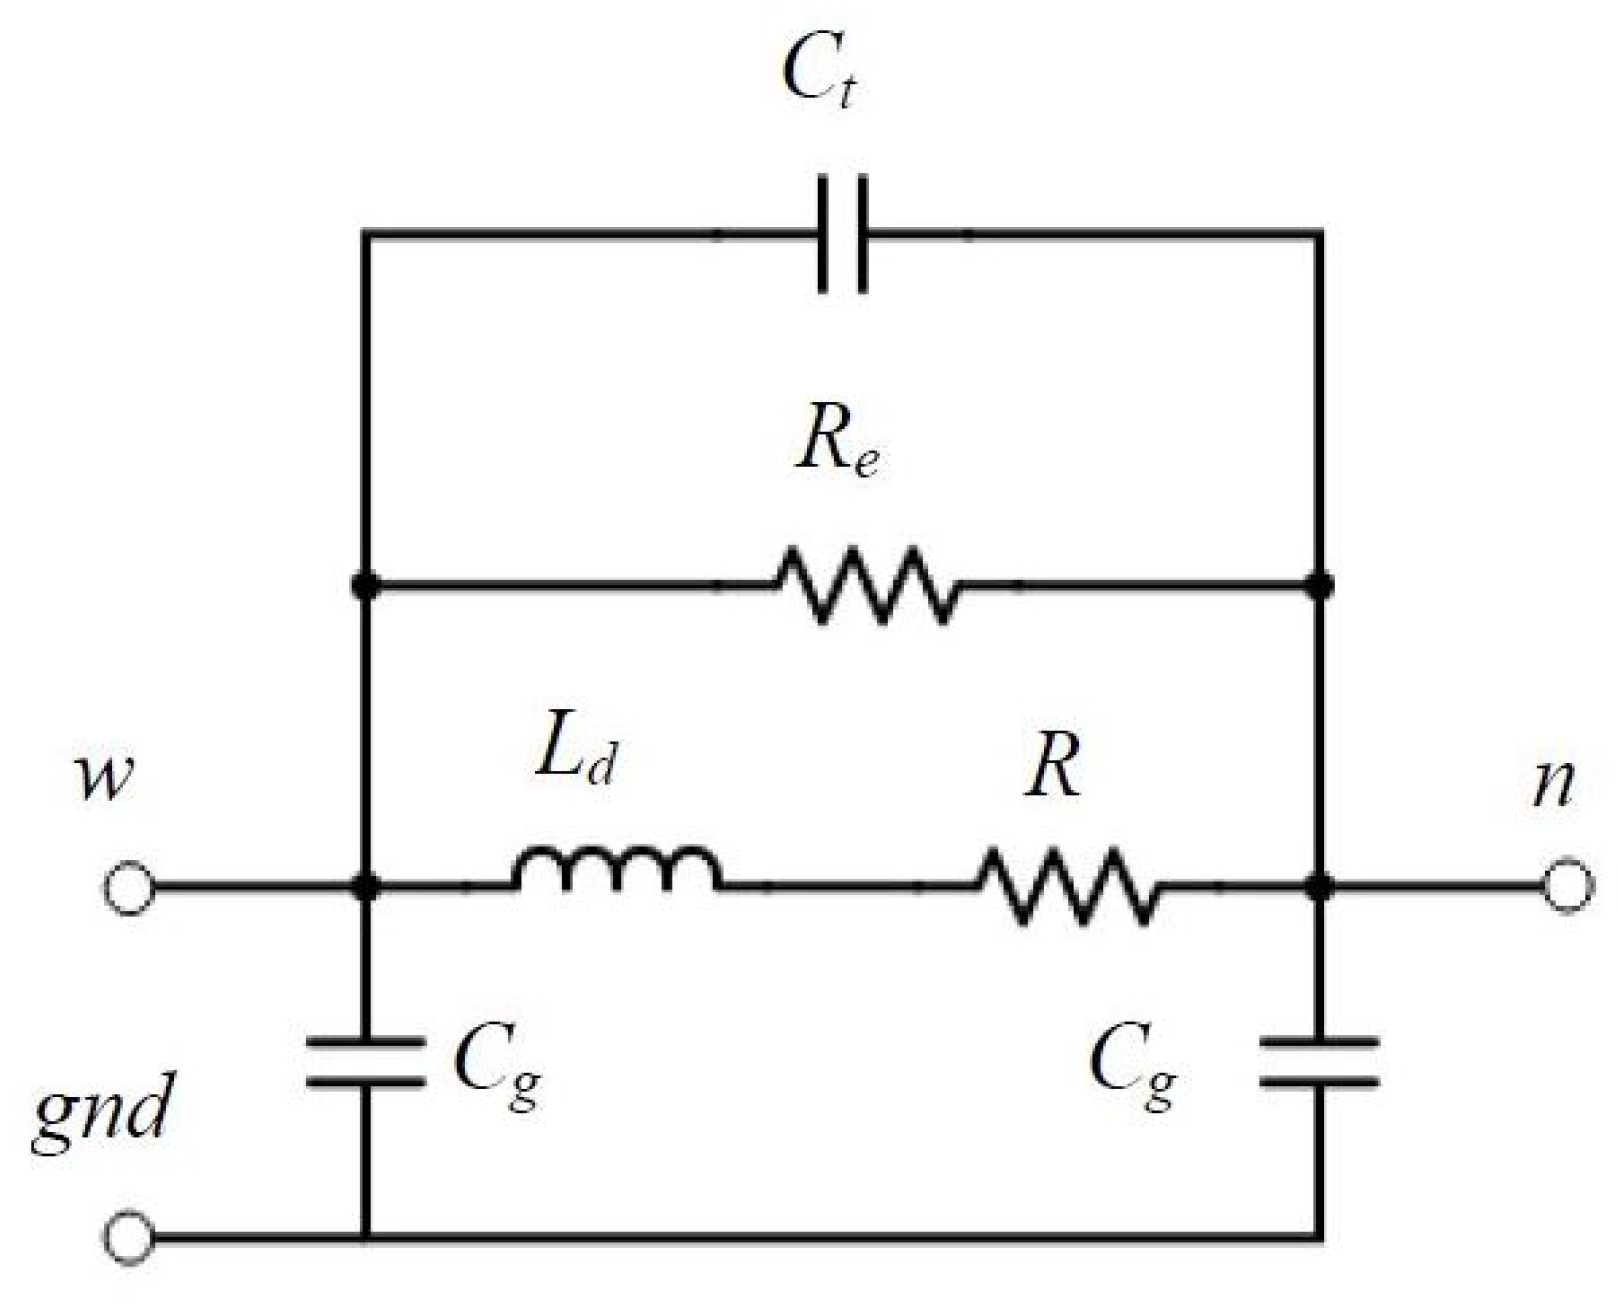
Moreira et al. [
75] propose a per-phase model for the motor and cable, with a HF motor model similar to the models presented in [
69,
71] as represented in
Figure 13:
The parameter Cg represents the winding-to-ground capacitance. The parameter Rg is added in the circuit to represent the dissipative effects that are present in the motor frame resistance.
The circuit formed by the parameters , , and is the part of the network responsible to capture the second resonance in the frequency response, which is related to the winding turn-to-turn capacitance.
The parameter is responsible to account for the losses introduced by the eddy current inside the magnetic core.
To estimate the parameters of the high-frequency part of the model, it is suggested to replace the motor model by a lumped-inductance, which represents the leakage inductance of the machine winding.
Moreover, in [
75] the importance of the adequate estimation of the cable parameters has also been highlighted, in order to have an accurate computation of the overvolatges. In this case, the power cable is represented as a transmission line with lossy characteristics and is modelled using several lumped parameter segments. These models can be feasibly integrated in a MATLAB-based program for the analysis of the overvoltage phenomena in long-cable PWM drives.
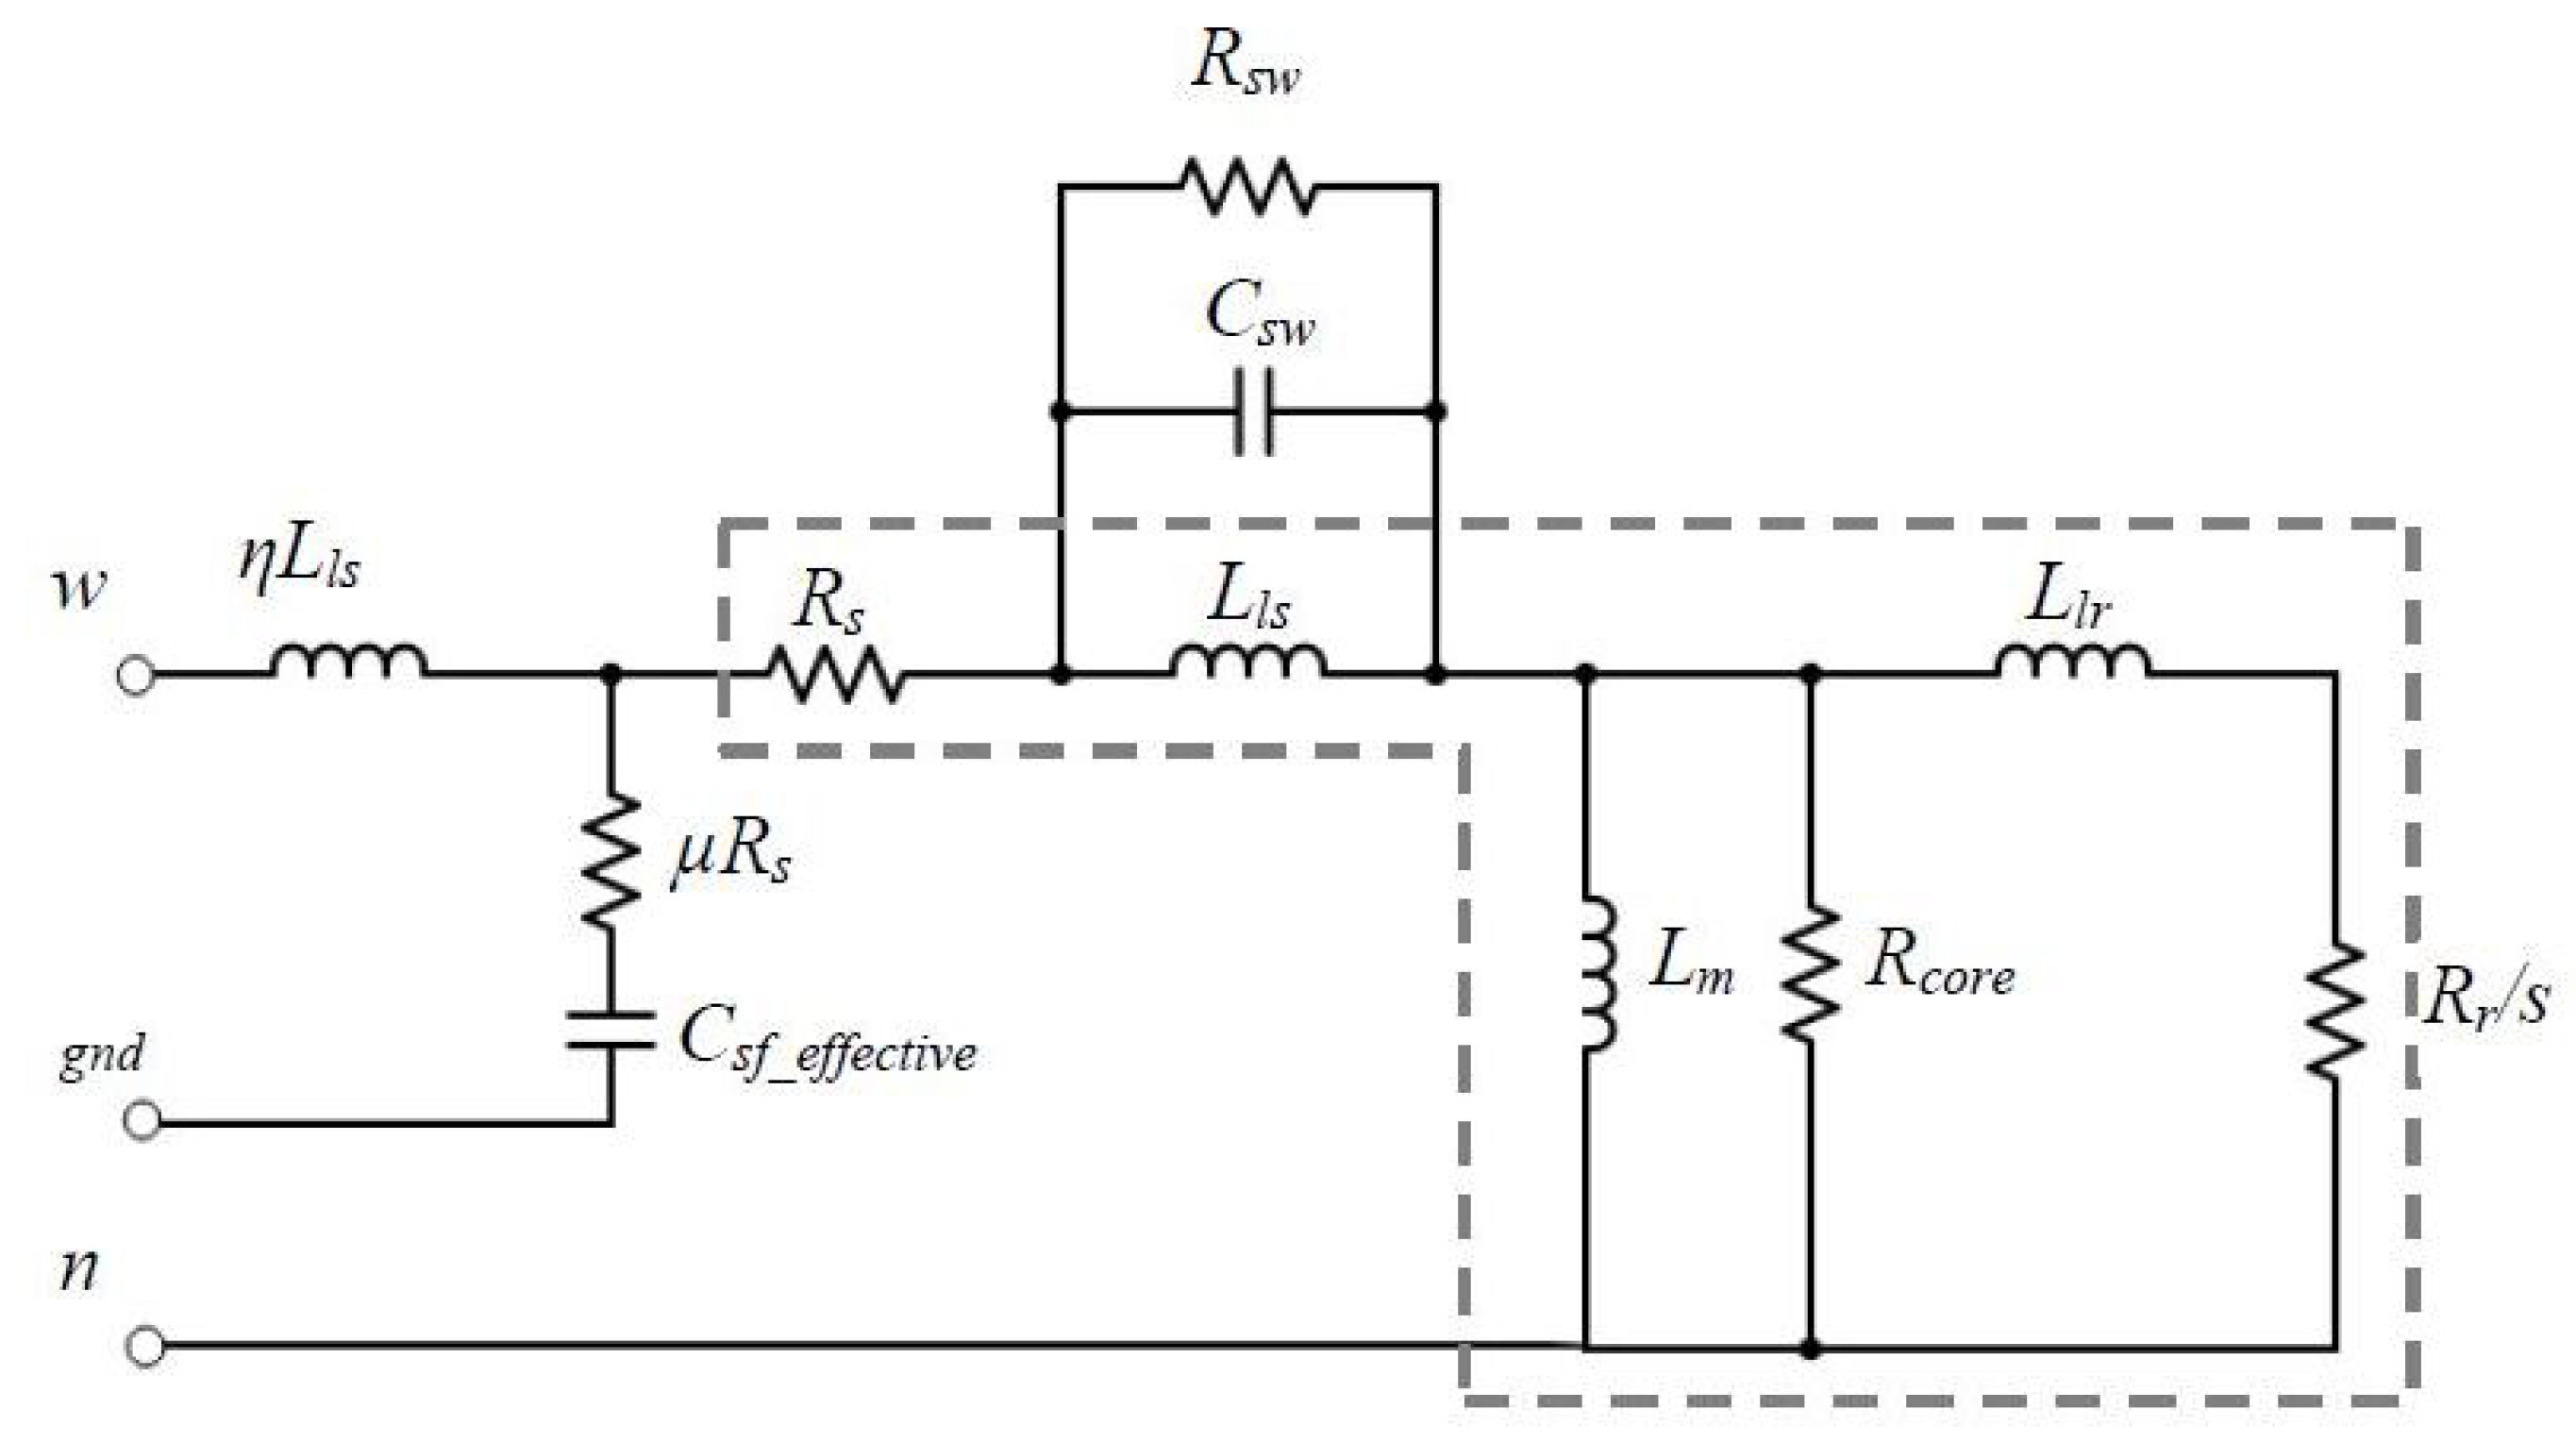
The universal model has been presented by Mirafzal et al. [
76] (
Figure 14 for a single-phase system), containing the common-mode (CM), the differential-mode (DM), and the bearing circuit models combined into one three-phase equivalent circuit model for wide frequency range analysis. In addition to the single-phase model represented in
Figure 14, the three-phase system contains also a bearing current and a shaft voltage model, connected from the neutral terminal to the ground terminal. It takes the IEEE 112 recommended per-phase low frequency equivalent circuit (market by the grey dotted line) and adds parameters to model the HF characteristics of the induction machine. The single-phase model contains the following parameters:
Stator resistance , obtained from the manufacturer’s tests.
Core loss resistance , which together with have an effect on rounding the reflected wave ringing wave shape. The value of is estimated.
Rotor resistance , rotor inductance , and slip s determined by using the manufacturer T-equivalent circuit values.
Magnetizing inductance and IEEE Standard 112 fundamental frequency circuit value has been used.
Stator Leakage Inductance and IEEE Standard 112 fundamental frequency circuit value has also been used for the determination of its value.
Stator First Turn Leakage Inductance : one of the critical parameters in defining the DM motor high-frequency impedance, predicting the antiresonance point and setting the correct EMI leakage current to the ground in the CM circuit. It accounts for the fact that only a fraction of the total stator leakage inductance is attributed to the high-frequency antiresonance point, in particular the first few turns. It is estimated according to winding data and machine geometry.
Stator-frame capacitance : effective stator-to-frame capacitance of the first slot per phase, calculated from the machine geometry.
Stator Turn-to-Turn Winding Capacitance : this parameter can be determined in different ways, for example by the heuristic method as a function of .
Stator initial frame-to-ground damping resistance : this component is the AC resistance of the fractional part of the total stator resistance associated with . It affects the peak CM current as well as the damping of oscillations in the CM current to the ground, and, as it needs further research, it was not accounted for this analysis.
The simulated overvoltage, its waveform shape, and its ringing frequency at the machine terminal are in good agreement with the measured values. However, the peak simulation values of the CM current are much higher that of the measured CM current, suggesting the fact that the ferrite CM saturating inductance used in the drive was not simulated. This model has been improved later on in [
77], by using more analytical approach for the parameters determination.
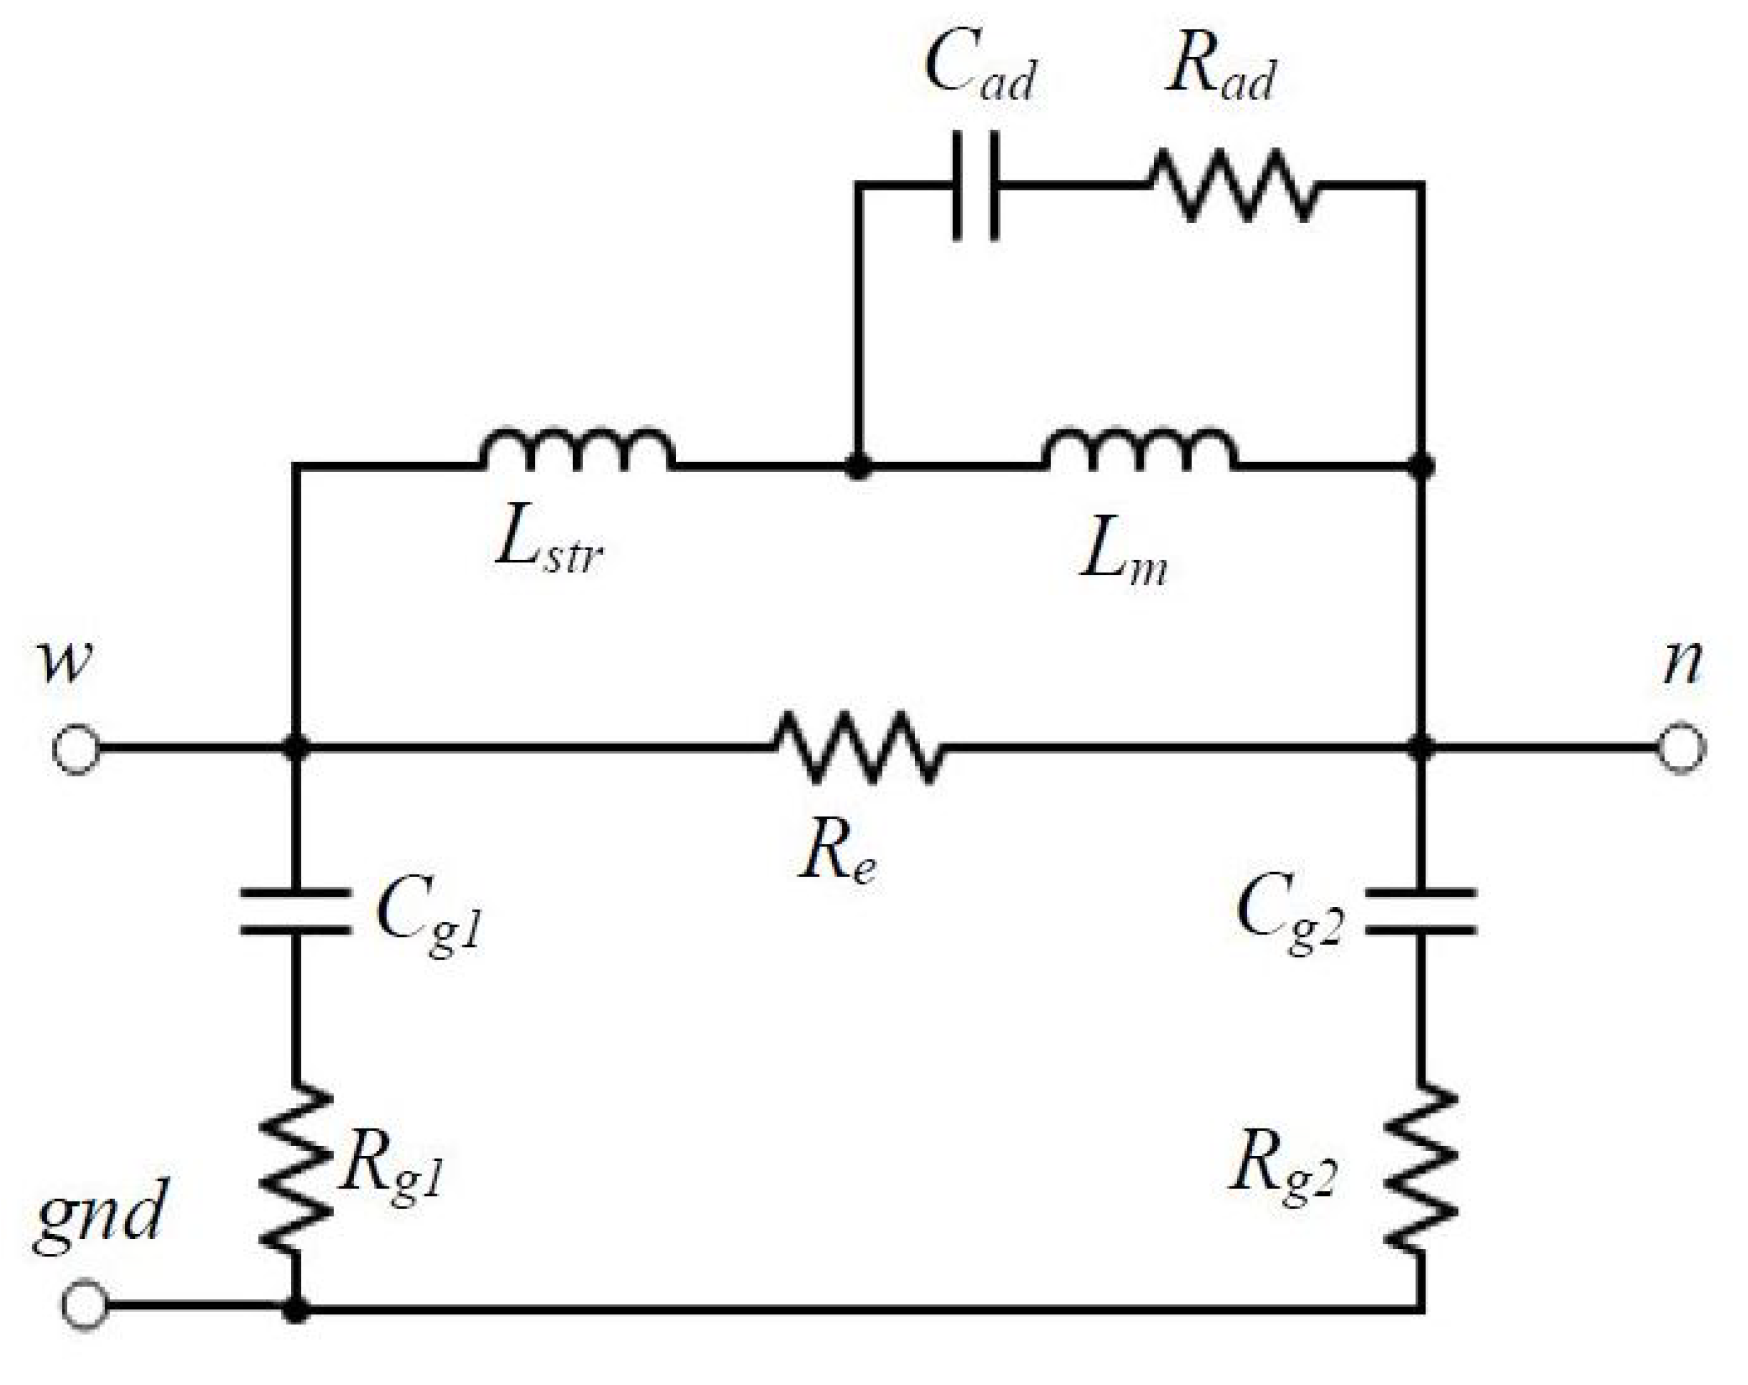
Another model capable of accurately capturing the high-frequency DM and CM impedance characteristics has been proposed by Schinkel et al. [
78] (
Figure 15). It consists of a fully coupled inductance
, a stray inductance
,
accounting for the iron loss of the stator winding, parasitic capacitances to the stator
and
, and resistances
and
on that current paths. These parameters are calculated on the basis of the CM and DM impedance characteristics measured in the frequency domain. The capacitance
and resistance
form a series resonance together with
, but it is difficult to estimate them analytically. Trials and adjustments are required with the help of frequency-domain simulations to achieve satisfactory results.
Yet another model, similar to the one of [
78], capable of accurately capturing the HF, DM, and CM impedance characteristics has been proposed by Wang et al. [
79] (
Figure 16).
The proposed HF motor model uses a similar model structure and parameterization procedure. The main difference is the introduction of a series , , branch instead of a and branch without sacrificing model accuracy. In addition to the HF motor model, the time-domain frequency-dependent cable model, which includes both the skin and proximity effects and the dielectric losses for the high-frequency range, was included in the analysis. The following parameters in the HF motor model can be identified:
and represent the parasitic resistance and capacitance between the stator winding and the motor frame, respectively.
and represent the parasitic resistance and capacitance between the stator neutral and the motor frame, respectively.
represents the stator winding leakage inductance.
represents the high-frequency iron loss of the stator winding.
and are introduced to capture the second resonance in the motor impedance characteristic, caused by the skin effect and interturn capacitance of the stator windings.
All the parameters from the per-phase equivalent circuit are identified through the DM and CM impedance characteristics measured in the frequency domain.
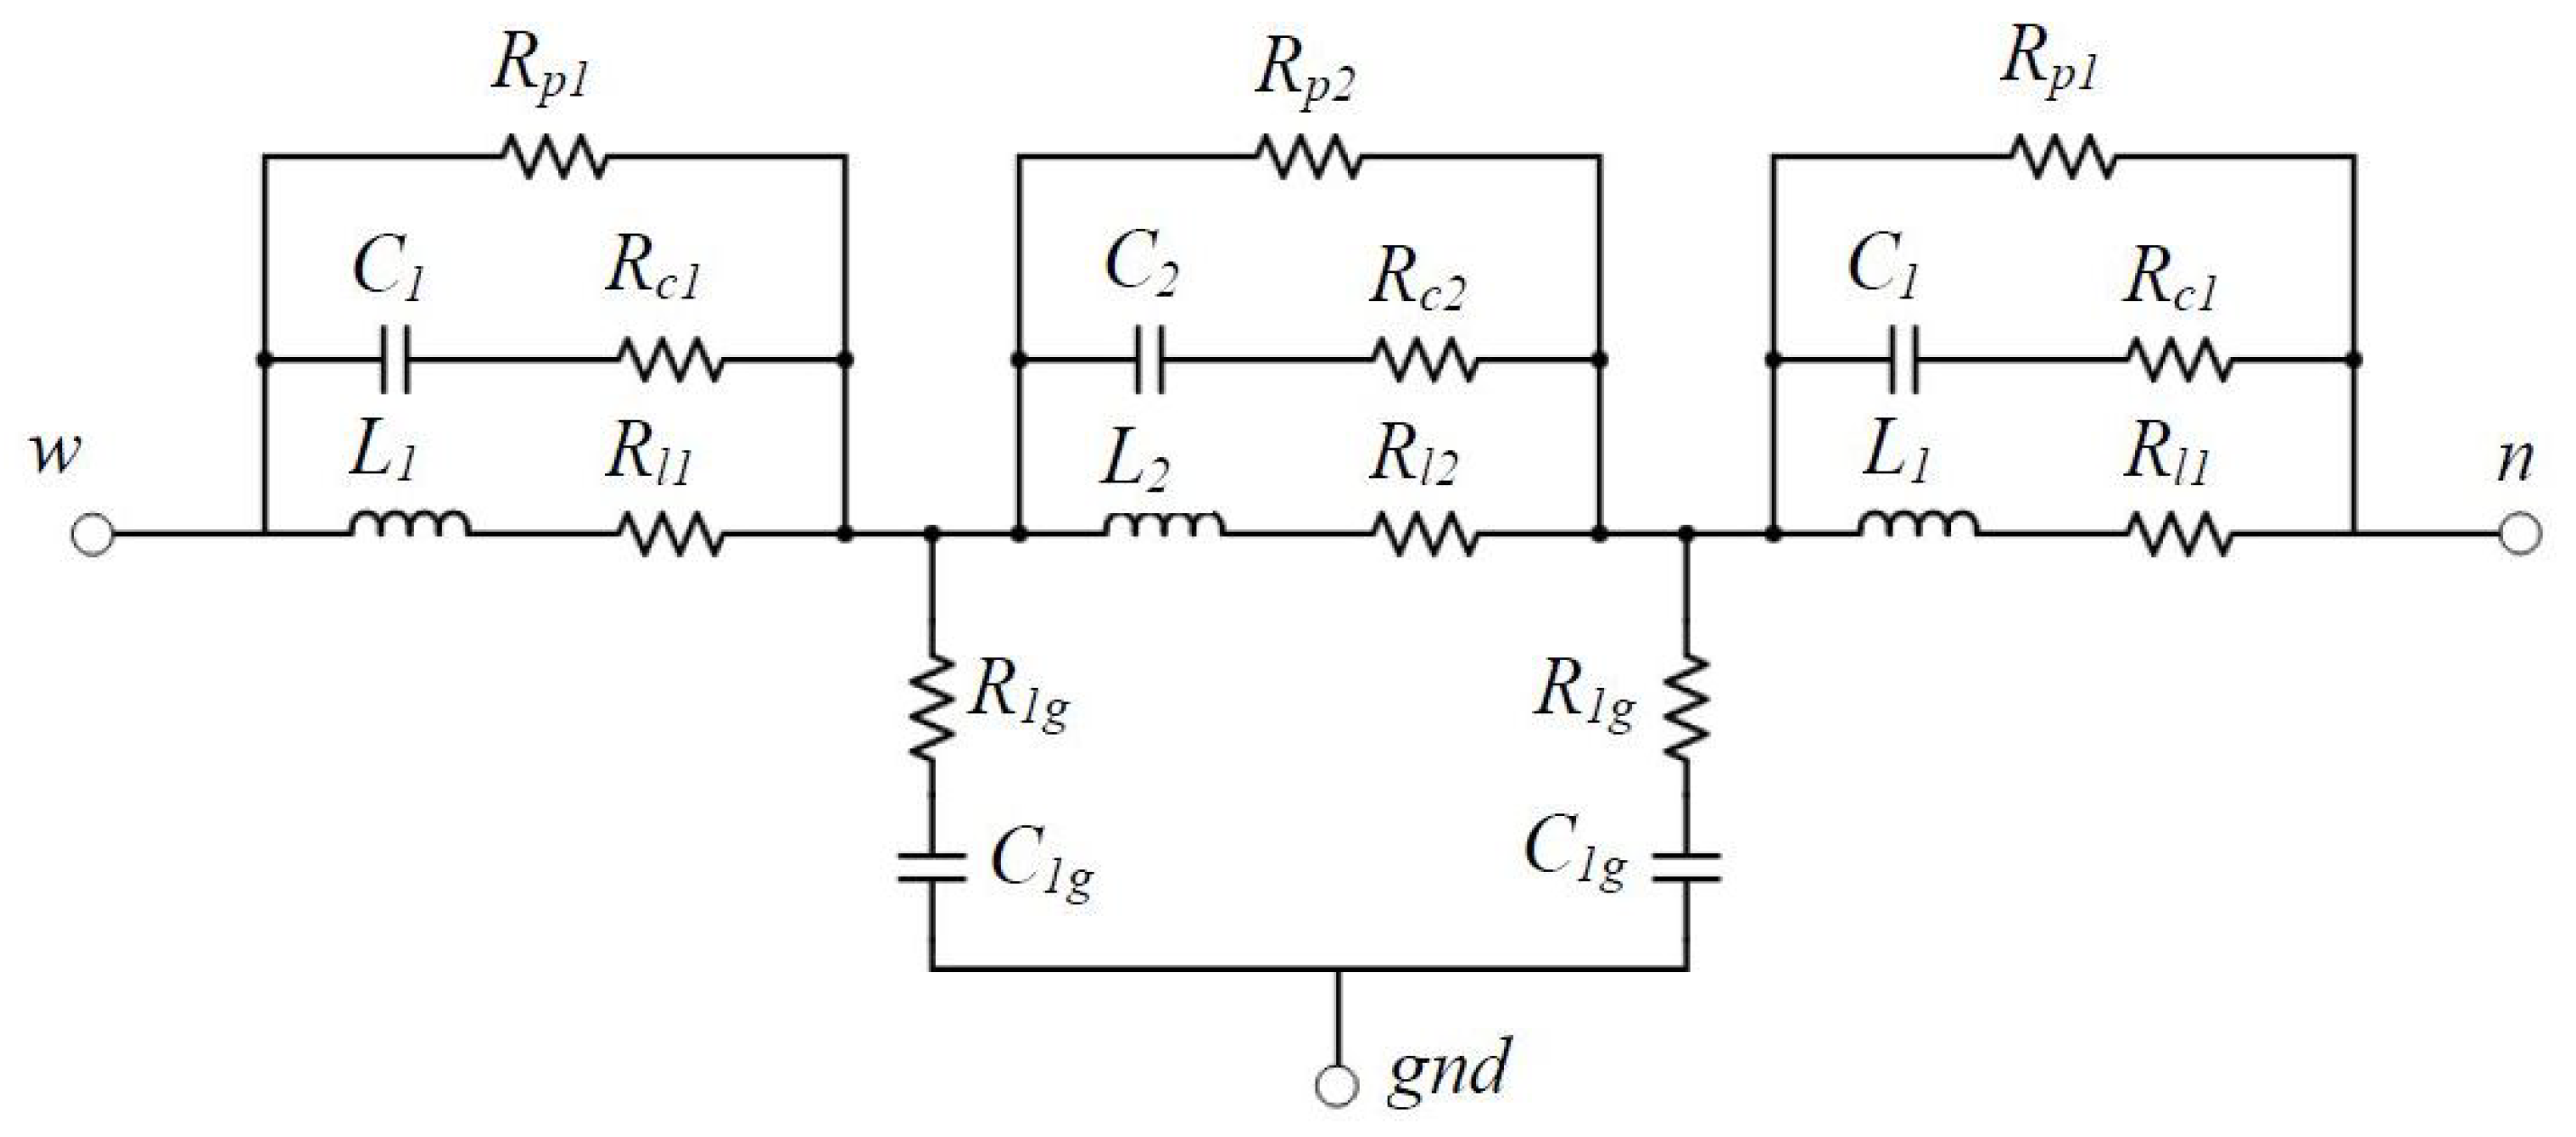
Degano et al. [
80] analysed a similar circuit to one of the [
70], with the difference of one more additional coil-like network, as presented in
Figure 17. In fact, the two coil-like network models from [
70] presented significant discrepancies when HF impedance estimations were compared to corresponding HF impedance experimental measurements taken on the motor. The genetic algorithm (GA) has been implemented to optimize the selection of the circuit parameter values. It is the automatized procedure relying on the matching between the impedance experimental measurements and the values obtained by the model simulation.
Vidmar et al. [
81] proposed a universal HF per-phase machine model suitable for delta and star connections (
Figure 18). The model assumes the distributed line of the stator winding to be represented by series lumped equivalent circuits. The first few turns of the winding are used to model the HF characteristics, as HF components of the supply voltage penetrate only at the first few turns. This path consists of resistor
representing resistive losses in the CM and DM current path, stray inductance of the machine terminals and connector wires to winding
, and the beginning part of the winding-to-stator stray capacitances
. The LF characteristics, as LF components of the supply voltage can further penetrate into the winding, are represented by winding stray inductances
and
, eddy-current loss resistances
and
, and the central part of winding-to-stator stray capacitance
. The symmetry necessary for the delta and star connection is obtained by the identical parameters on both sides of the model, represented by the
,
,
,
, and
. Moreover, this model permits modelling of the interturn effects, represented by the lumped parameters
,
, and
.
Another, more complex model for a star connection permanent magnet synchronous machine has been presented by Wu et al. [
82]. It consists of three parts, each one contributing to CM impedance or DM impedance in the low and medium frequency ranges.
Table 3 summarizes the properties of nine different HF motor models, including several features such as the frequency range, the type of winding connection, the physical meaning, the modelling of the inter-turn effects, analytical expressions for the parameters calculation, and the model accuracy.
It can be noted that models presented in [
71,
75,
81] have similar characteristics, except that in [
81] a greater number of parameters is present in the phase model. The models presented in [
70,
80] are missing the explicit expressions for the parameters calculation. In [
70] some parameters are missing the expressions for its calculation, and some have been obtained by fitting procedure, and in [
80] the generic algorithm tuning procedure has been conducted for the parameters estimation. Models presented in [
76,
78,
79] have the highest frequency range. In [
78] the mismatching at some resonance point of the high-frequency impedance measurement has been reported, but it has been proven that the proposed model is suitable for simulations on the system level including high-frequency behaviour. Additionally, the extended model has been proposed in order to improve the accuracy. Almost all models are suitable for the analysis of inter-turn effects, except the model presented in [
78].
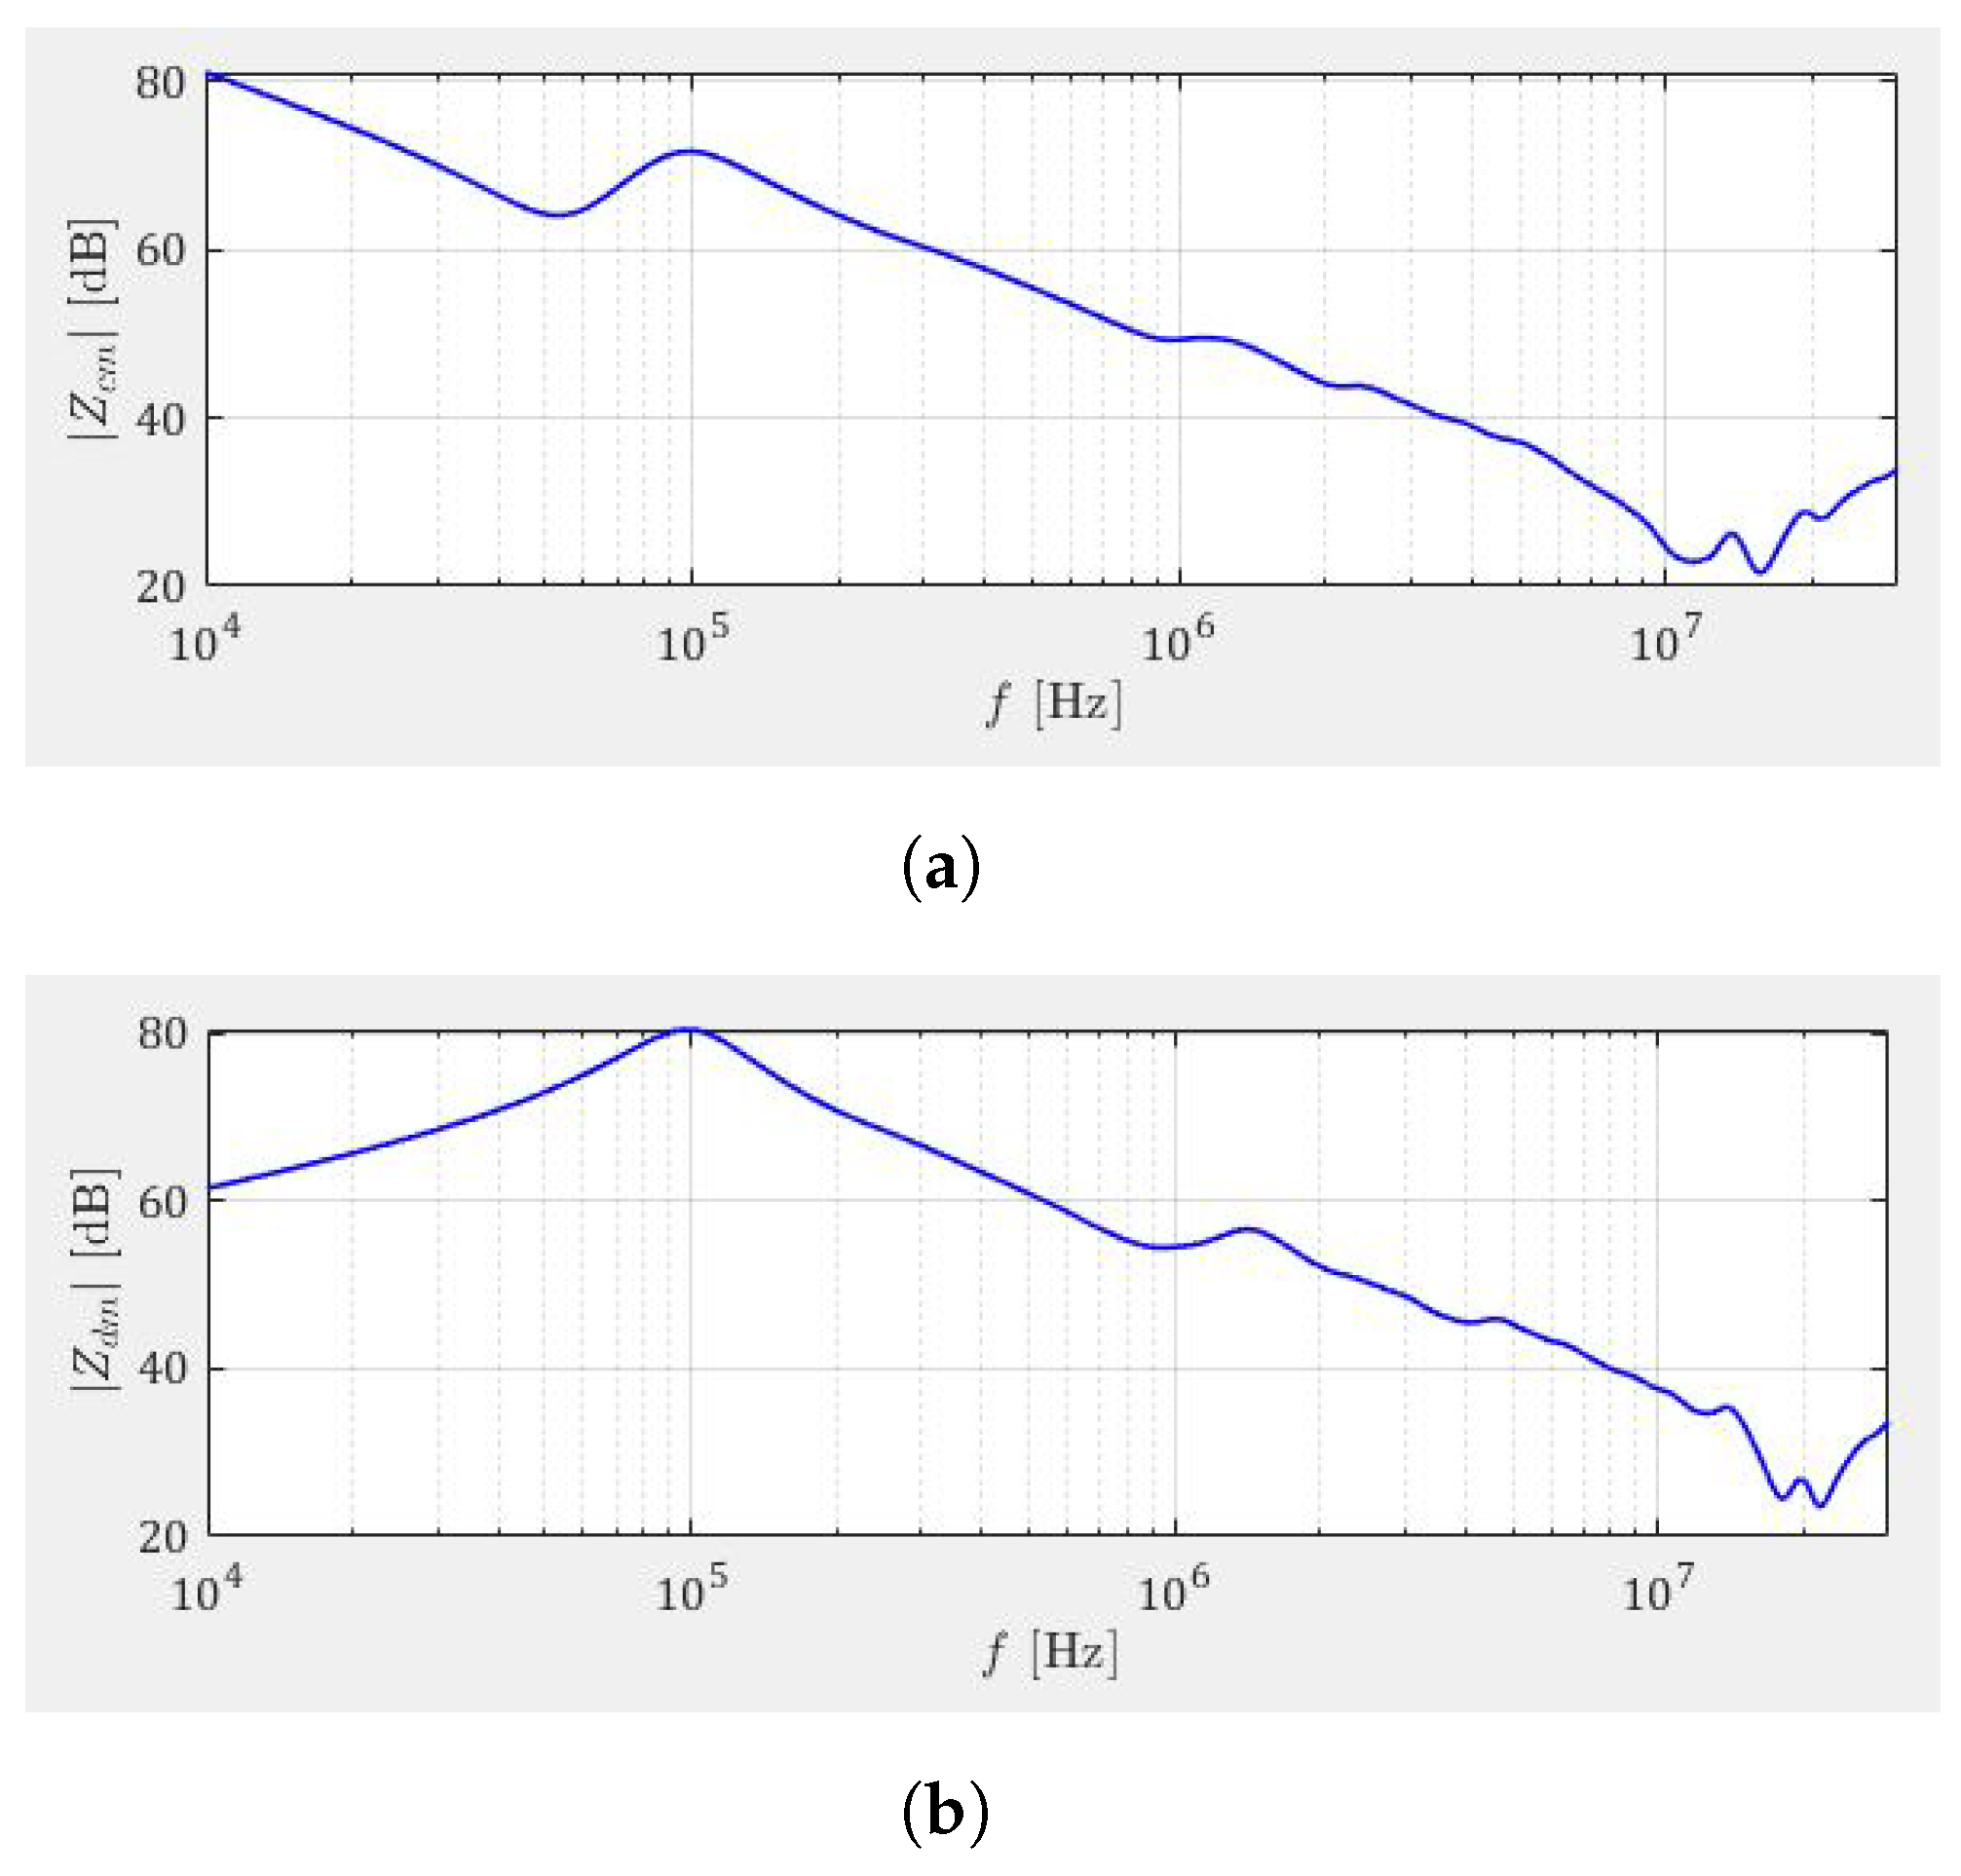
Comparison of Dynamic Behaviour of Different HF Motor Models
In order to compare the different models, an induction motor with the parameters listed in
Table 4 was tested. The common mode and differential mode impedances are shown in
Figure 19.
An impedance analyser was employed to measure the machine impedance in a wide frequency range. It can span a frequency range between 100 Hz and 40 MHz, with high accuracy. Afterwords, the parametrization according to different motor models (i.e., [
71,
75,
78,
79,
80]) was done. Different models were implemented in the LTspice simulation tool, having the inverter-cable-motor system per one phase as shown in
Figure 20, where the example of the model developed in [
80] is given. For both the simulation and the experiment, a two-level SiC-MOSFET-based inverter with switches from Rohm (SCT3022KL) rated for a maximum blocking voltage of 1200 V and a nominal current of 95 A at 25 °C was supplying different HF motor models (or the motor given in
Table 4 in the case of experiment) through a 30 m long cable, to enhance the voltage waveform reflection and achieve high overvoltage at the machine terminals. In the simulation, the realistic dynamic models of power switches obtained from the manufacturer’s experimental tests (Rohm SCT3022KL) were used. The inverter was operated with a DC-link voltage of 540 V. In the simulation, the cable was modelled as a RLC circuit, with the resistance
, inductance
, and capacitance
. More information on the measured cable parameters used for the simulation are given in
Table 4.
The experimental voltage at motor terminals was compared with the simulation results done with different HF motor models. The switching frequency used for both the simulation and the experiment was of 32 kHz, and a total gate resistance of 8 was applied to the gate of the switching devices.
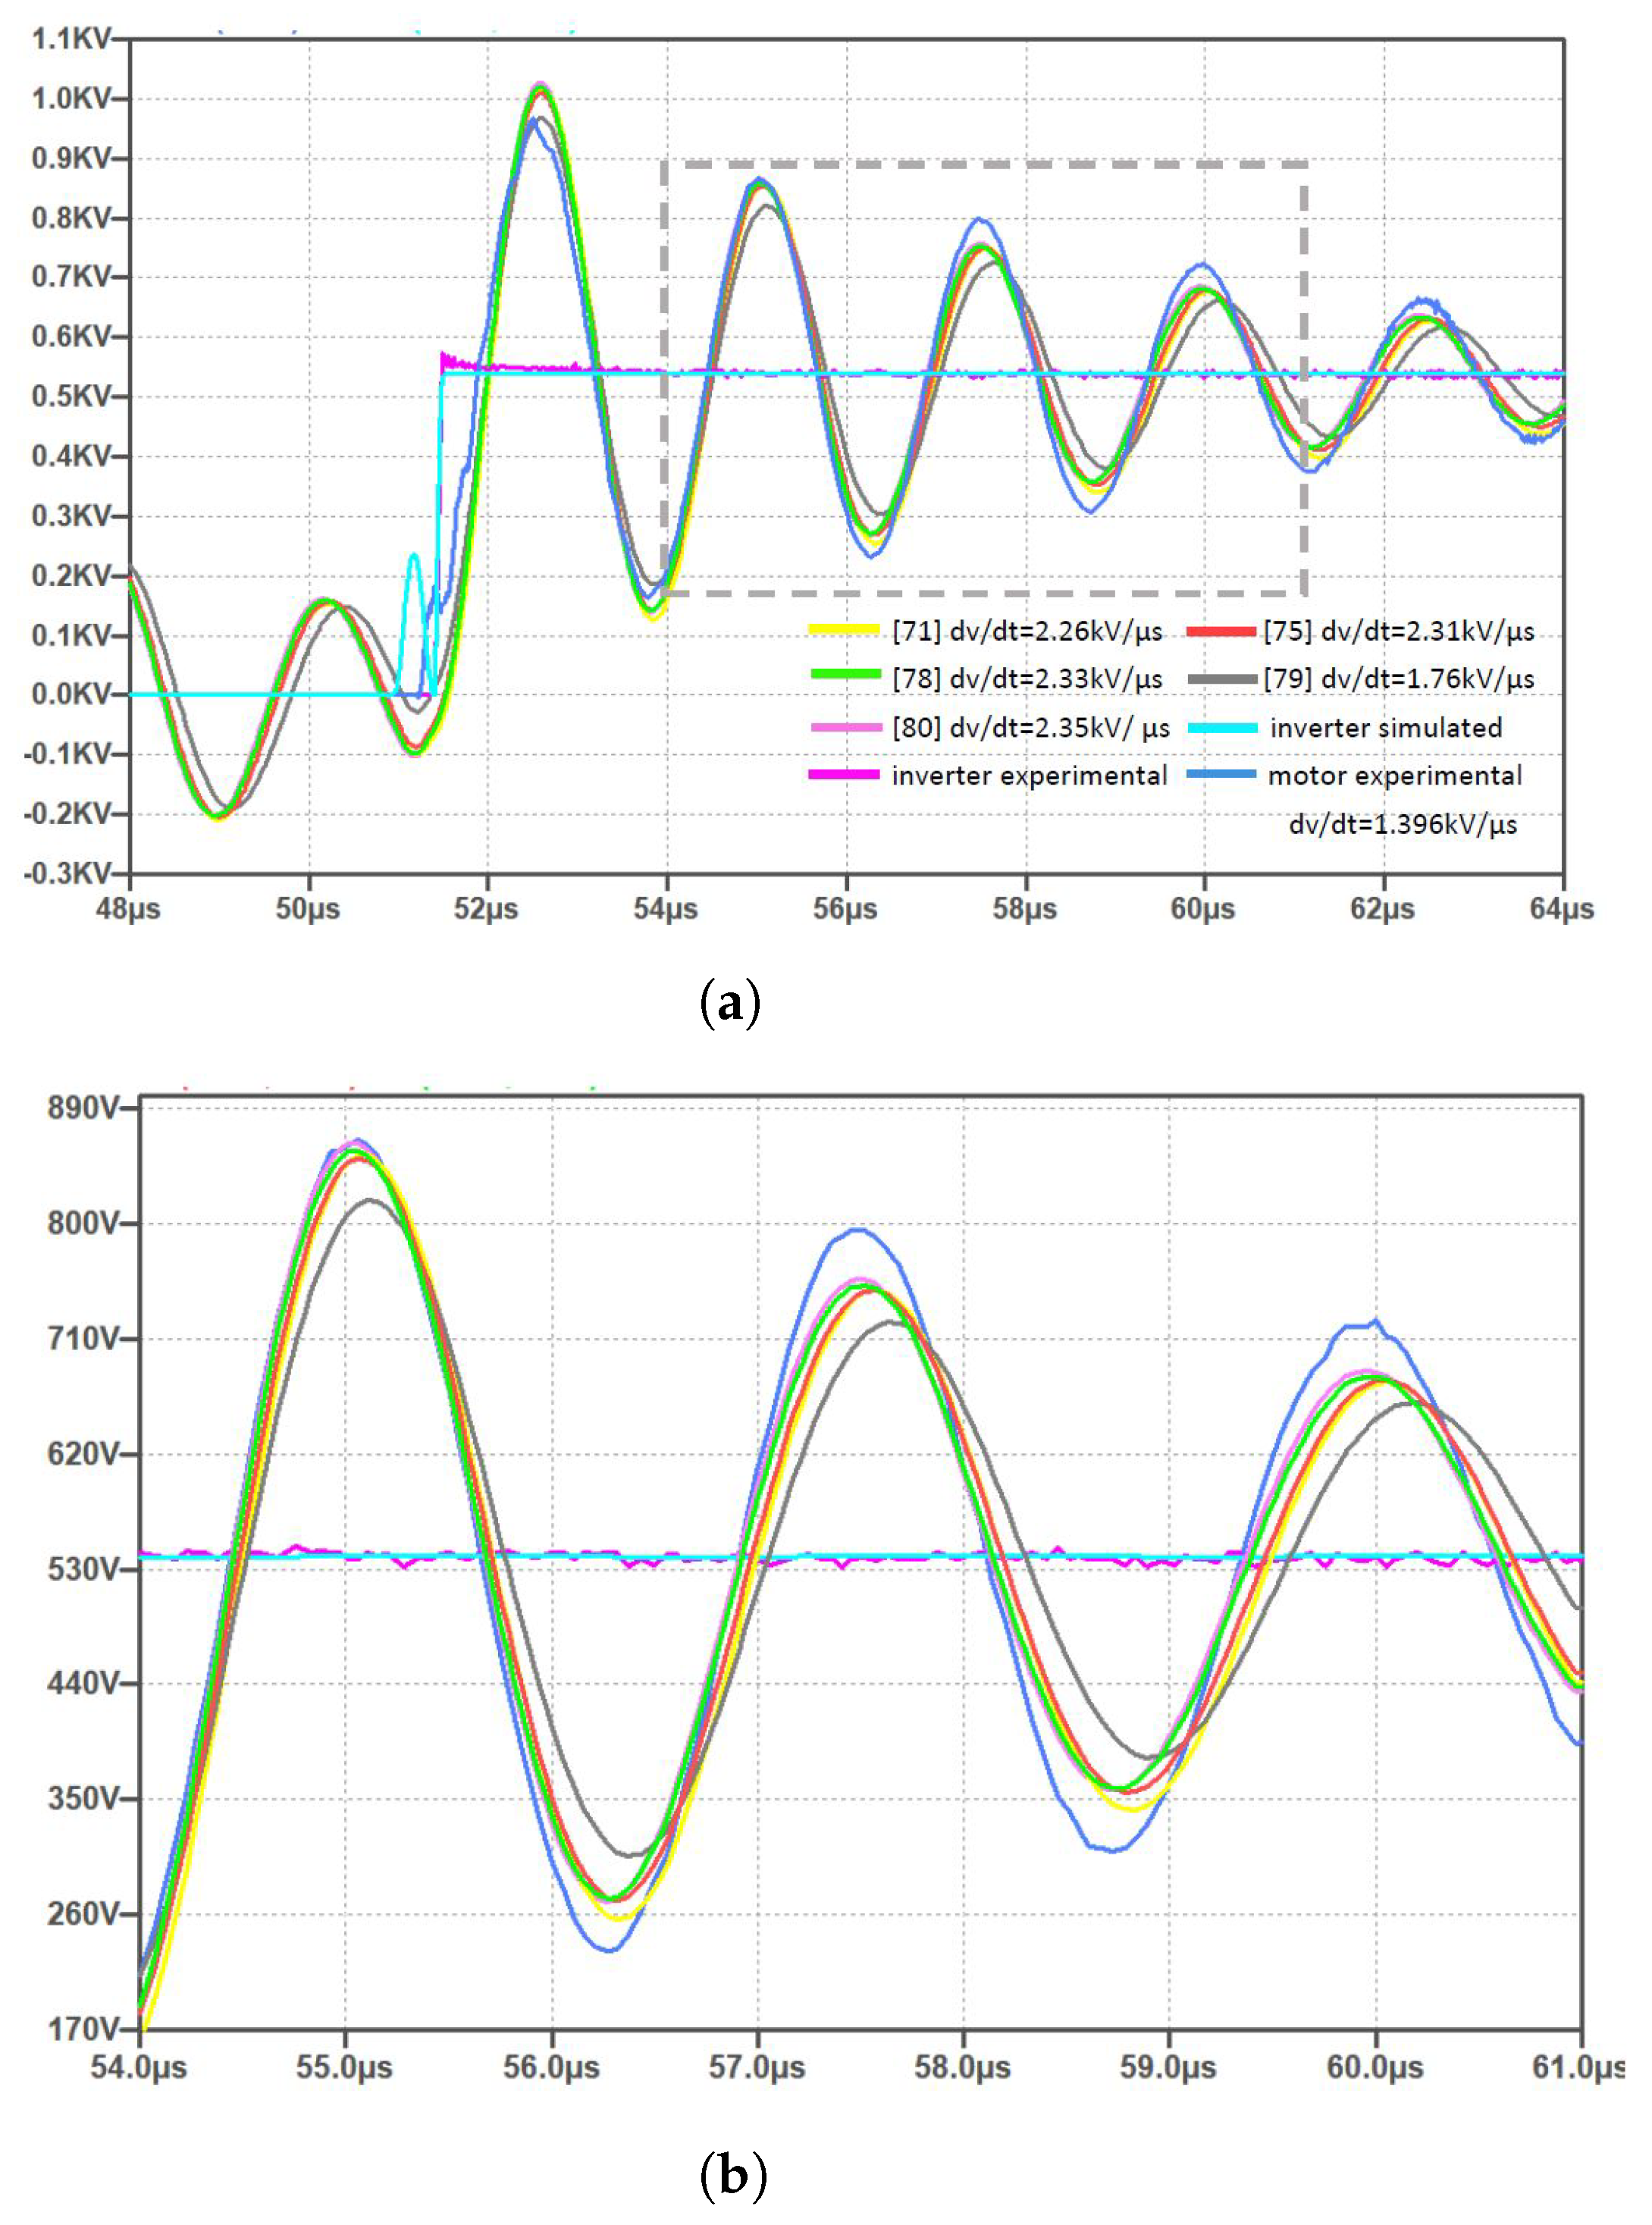
The result of the comparison is given in
Figure 21, where different voltages are presented together with the inverter phase-to-phase voltages (pink-experimental and turquoise-simulated traces). In general, the good matching between the experimental (blue trace) and simulated voltage waveforms can be noted. The model presented in [
79] had the best matching with the experimental waveform when looking to the first oscillation, in terms of peak voltage (960 V) and
, but later on showed progressively lower values compared to other models whose behaviour was similar, as can also be noted in the zoom shown in
Figure 21b. The experimental
was 1.396 kV/
s, while the simulated ones were 21–59% higher, with the lowest difference for the model presented in [
79]. The other models had similar
, ranging from 2.26 kV/
s up to 2.35 kV/
s, and similar peak voltage values (around 1 kV). Additionally, the model presented in [
78] showed a good matching with the experimental waveform, even though a simpler model (with only seven components) was used in the simulation, confirming the fact that the model is suitable for simulations on the system level with HF behaviour. The
was practically the same to those in [
75,
80], accounting for 19 and 9 components in total, respectively.
It can also be noted that all the overvoltages in this case comply with the IEC and NEMA standards and are rather low. The explanation for this can be seen in the high values for the cable parameters, where a cable as long as 30 m was employed.
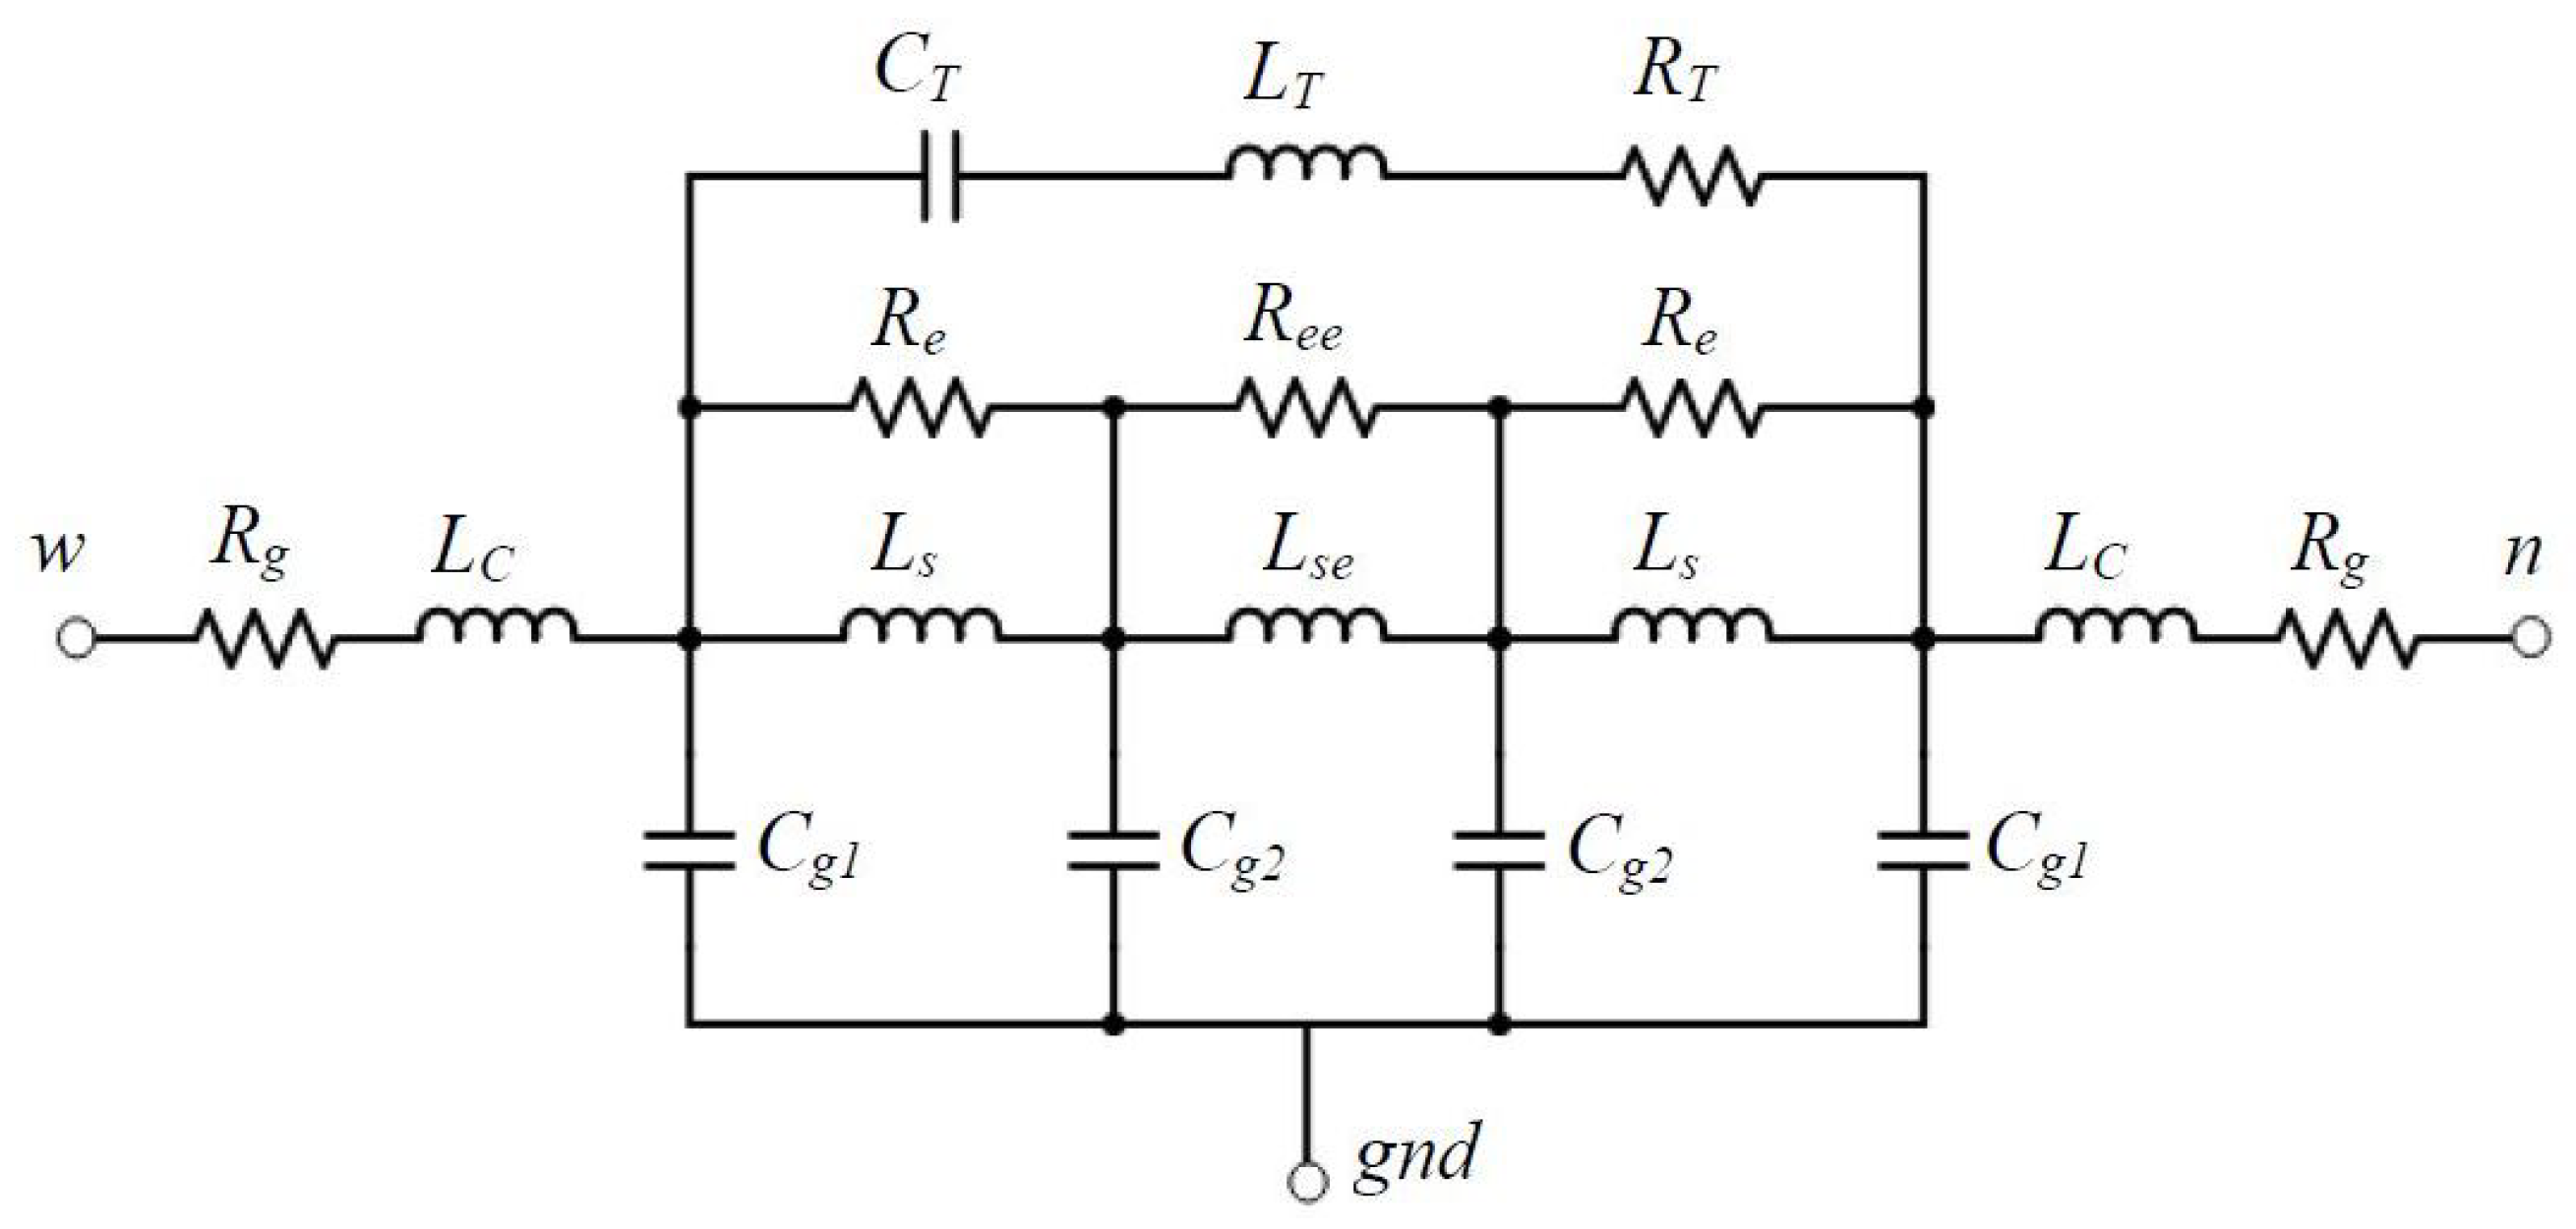
Degano et al. in [
80] presented the model made up of three resonators: the two external ones model the terminal part of the windings, while the central resonator describes the behaviour of the active part of the winding, making possible the study of the effects of steep voltages coming from the inverter on different parts of the winding, which is not feasible with other models. In addition to presenting these advantages, ref. [
80] also has a good matching with the experimental results, remaining the most close to the experimental waveform when looking to
Figure 21b. For these reasons, it is the model that represents the most advantages, when compared to other HF motor models.


 ,
, 


