Article

Performance Degradation of a Shell-and-Tube Heat Exchanger Due to Tar Deposition

Department of Engineering (DE), University of Ferrara, 44122 Ferrara, Italy
*
Author to whom correspondence should be addressed.
Energies 2022, 15(4), 1490; https://doi.org/10.3390/en15041490
Submission received: 17 January 2022 / Revised: 9 February 2022 / Accepted: 14 February 2022 / Published: 17 February 2022
(This article belongs to the Special Issue Mathematical Modelling of Energy Systems and Fluid Machinery 2022)

Abstract

:
Biomass represents a programmable renewable energy source that is useful for reducing issues related to the transfer from fossil fuels to the renewable energy era. The exploitation of biomass is strongly related to the development of power technologies that are designed to improve efficiency; however, at the same time, they have to be designed to improve the life cycle of the entire installation—especially in relation to maintenance operations. In this paper, a numerical analysis is proposed to assess the performance of a heat exchanger used for separating condensing tar from syngas generated by the gasification of lignocellulosic wood chips and pellets. The analysis included clean, fouled, and clogged conditions. Flow maldistribution characterized the inlet section of shell-and-tube configurations and was responsible for clogging phenomena. Starting from field detection, analyses of fouled and clogged conditions showed a reduction in the effectiveness of the heat exchanger, causing dangerous conditions for the internal combustion engine used to exploit the syngas flow.

1. Introduction

Negative environmental impacts from fossil fuels have encouraged researchers to look for greener energy sources. Among all renewable energy sources, biomass appears to be one of the most attractive [1]. The gasification process is considered a key technology for the conversion of biomass to biofuels [2] because of its high efficiency and flexibility [3]. The solid feedstock is converted into a gaseous fuel (syngas), whose main components are carbon monoxide (CO), hydrogen (H2), methane (CH4), carbon dioxide (CO2), and nitrogen (N2) [2]. Cogeneration systems based on biomass gasification can utilize syngas as a fuel gas in internal combustion engines or gas turbines for electricity and heat production [4].
Despite the numerous advantages of biomass gasification, the technology is still in the development stage due to issues related to the process itself. During gasification, undesirable byproducts such as particulate matter, ammonia, sulfur compounds, and tar are unavoidably produced and entrained in the fuel gas. The types of syngas contaminants and the potential problems associated with their presence have been reported by Belgiorno et al. [5]. Since these impurities can cause severe issues in downstream equipment, cleaning syngas is essential before its being utilized [6]. In particular, reducing tar content is one of the most significant challenges in biomass gasification [7]. Tar condensation can indeed occur if the local temperature drops until the tar dew point is reached, leading to fouling and clogging of fuel lines, heat exchangers, filters, and engines [8].
As pointed out by Morf [9], there is no clear and uniform definition for the term “tar” in the literature because of the complexity of the mixture of organic compounds that represent “tar”. A comprehensive overview of operational “tar” definitions used by researchers is given in [10]. The tar composition in syngas is strongly dependent on its formation conditions. Evans and Milne [11,12] identified four major tar product classes: primary products derived from cellulose, hemicellulose, and lignin; secondary products, characterized by phenolics and olefins; alkyl tertiary products, which include methyl derivatives of aromatics; and condensed tertiary products, which include the polyaromatic hydrocarbon series without substituents. Primary products are destroyed before the tertiary products appear [13]. Kiel et al. [14] derived a different tar classification based on the behavior of tar components in downstream processes. In this respect, two significant tar properties compounds were considered, i.e., condensation behavior and water solubility. The proposed classification system groups tar components into five classes [14]: GC-undetectable tars (class 1)—namely, the heaviest tars that condense at high temperatures even at very low concentrations; heterocyclic compounds (class 2), which generally exhibit high water solubility due to their polarity; aromatic compounds (class 3), i.e., light hydrocarbons that do not show condensation or water solubility issues; light polyaromatic hydrocarbons (class 4), which condense at relatively high concentrations and intermediate temperatures; and heavy polyaromatic hydrocarbons (class 5), which condense at relatively high temperatures at low concentrations.
As stated above, an essential property for tar condensation is its dew point. The tar dew point is the temperature at which the actual total partial pressure of tar equals its saturation pressure [14]. The Energy Research Center of The Netherlands developed a model for calculating tar dew point Tdp for different tar classes as a function of tar-class concentration C [14] (Figure 1). The model includes vapor/liquid equilibrium data for tar components in syngas based on the ideal gas behavior. Raoult’s law is applied to calculate the mixture of hydrocarbons, using the vapor pressure data of individual compounds [14].
Several approaches for tar reduction are reported in the literature. Tar removal technologies can be broadly divided into two groups, i.e., primary and secondary measures, depending on the location where the tar is removed. According to Devi et al. [15], primary methods can be defined as all the measures taken in the gasification step to prevent or convert tar formed in the gasifier. The authors provided a thorough overview of the primary methods used for tar elimination during biomass gasification. In particular, they pointed out the importance of the proper selection of operating parameters (temperature, pressure, gasifying medium, residence time, etc.), the use of adequate bed additives or catalysts during gasification, and a proper gasifier design. Secondary measures are conventionally employed as syngas treatments outside the gasifier [15]. As outlined by Anis and Zainal [16] in their review, secondary methods include both chemical (catalytic and thermal cracking) and mechanical/physical treatments—the latter being further classified into dry (cyclones, rotating particle separators, various types of filters, adsorbers, etc.) and wet (wet scrubbers, wet electrostatic precipitators, wet cyclones, etc.) gas cleanup systems.
Among all the wet cleaning techniques, wet scrubbers are necessary devices that use water scrubbing to condense tar and simultaneously remove particulates from syngas [16]. However, crucial issues related to wet scrubbing systems involve expensive wastewater treatment and decreases in both syngas heating values and process net energy efficiency [16]. To overcome the disadvantages of conventional wet cleaning technologies, Thapa et al. [17] developed a cleanup system consisting of a single-tube heat exchanger for syngas cooling followed by a dry biomass-based filter with wood shavings as filter media. The use of an indirect heat exchanger (no contact between hot syngas and chilled water) eliminates the need for wastewater treatment, while filter media can be reused as gasification feedstock. The application of the system for cleaning the syngas produced in a 20 kW downdraft gasifier resulted in a tar reduction efficiency of 61%. More recently, Thapa et al. [18] designed a tar removal technology that uses a vegetable oil bubbler in series with a shell-and-tube heat exchanger. The authors tested the ability of the system to remove tar from the syngas generated in a pilot-scale downdraft gasification plant. About 60% of the tar was condensed in the heat exchanger, which cooled the syngas below the tar dew point, and 96% of the remaining tar was absorbed by the oil bubbler. However, even if syngas cleanup techniques based on indirect heat exchangers for promoting tar condensation appear promising, the accumulation of tar deposits on heat transfer surfaces can lead to extremely short maintenance intervals.
This work presents a numerical investigation of performance degradation due to tar deposits on a shell-and-tube heat exchanger installed in a small-scale biomass gasification plant. The novelty of the present research is related to using a numerical simulation to comprehend the cooling process of the syngas and the consequent tar separation. The use of heat exchangers as a tar trap means that the common rules and methods used in the design of a shell-and-tube heat exchanger must be balanced with the need to condense the greatest amount of tar with the widest overhaul intervals. At first, the flow distribution and heat transfer performance were analyzed for the heat exchanger with clean surfaces. Then, to evaluate if favorable conditions are established for tar condensation and to predict the potential deposition zones, Eulerian–Lagrangian simulations were carried out for the clean heat exchanger. Finally, based on on-field fouling observations, different fouled heat exchanger models were developed to examine the progressive deterioration of heat transfer performance due to solid deposit build-up.

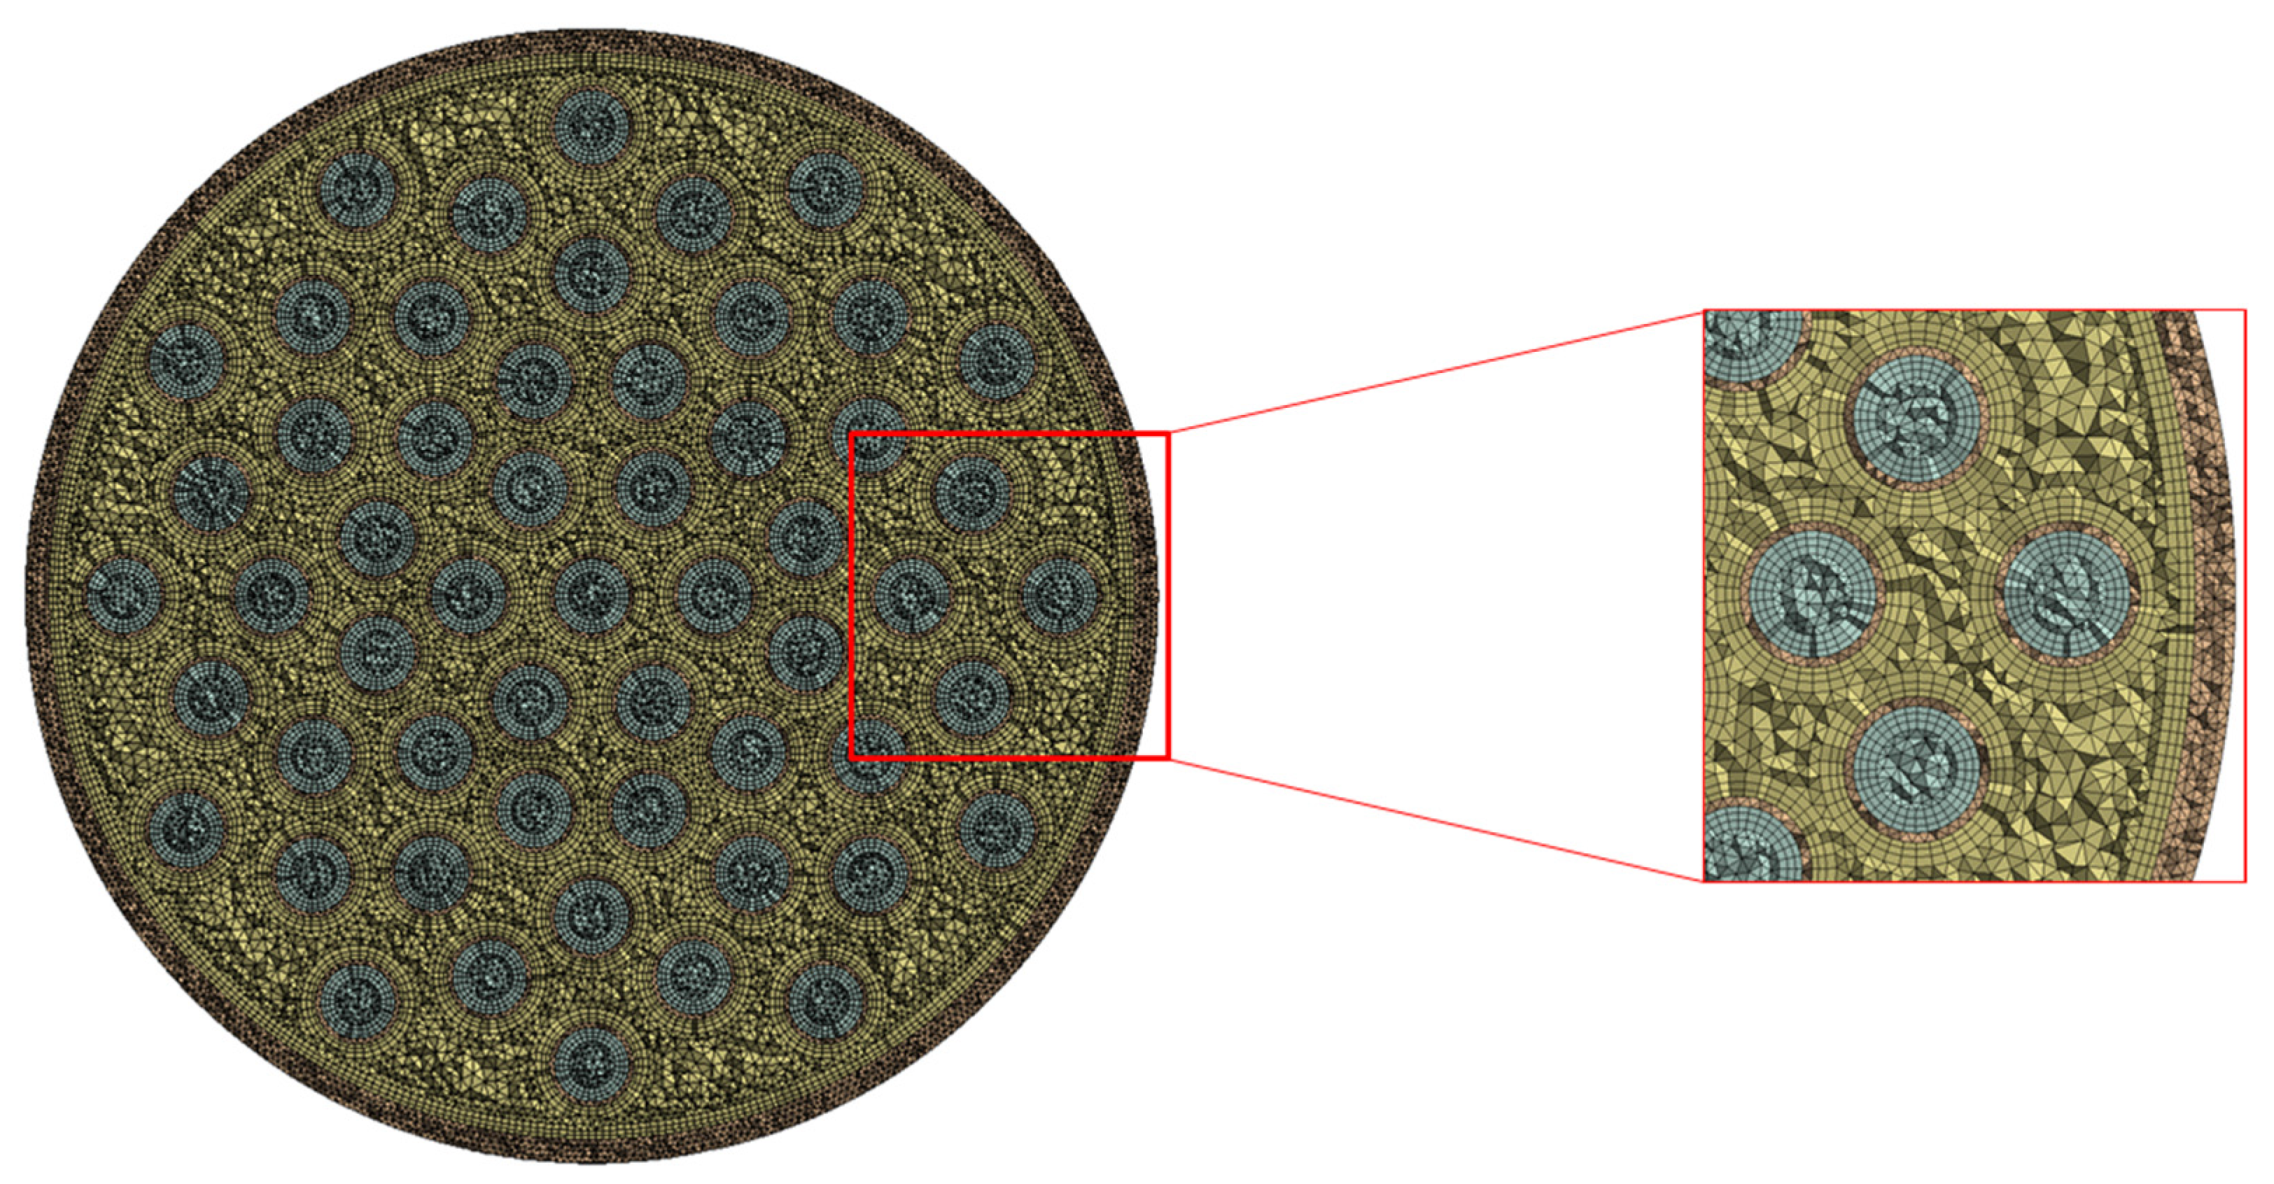
2. Conjugate Heat Transfer Methodology

The heat exchanger under study is part of a commercial-grade system for the gasification of lignocellulosic wood chips and pellets coupled to a cogeneration unit located inside the campus of the University of Parma within the context of project SYNBIOSE, which is aimed at building a knowledge base and the best practices for promoting small-scale gasification and CHP for the tertiary sector [19,20]. The project involved Siram S.p.A., the Center for Energy and Environment of the University of Parma (CIDEA), and the Department of Engineering of the University of Ferrara.
The purpose of the heat exchanger was to cool the syngas stream that feeds a 125 kW internal combustion engine and, at the same time, to clean the fuel gas by promoting tar condensation. As can be seen from Figure 2, it is a vertical shell-and-tube heat exchanger with one pass on both the shell and tube sides. The syngas enters the heat exchanger from the upper header and flows inside 55 carbon steel tubes with an inner diameter of 30 mm, a wall thickness of 2.3 mm, and a length of 1400 mm. The tubes are accommodated in a carbon steel shell, characterized by an inside diameter of 450 mm and a thickness of 9.5 mm, according to a triangular layout with variable tube pitch (44–60 mm). The shell-side fluid is water, which is fed from the bottom and forced to flow across the tube bundle by 11 segmental baffles with a spacing of 110 mm and a baffle cut of 33%. Since tar condensation occurs during the heat exchanger operation, the vertical configuration of the device allows the liquid to flow out of the tubes and collect in a condensate tank connected to the bottom header.
The starting point of the numerical analysis was the creation of a three-dimensional model for the heat exchanger. Since the three-dimensional model of the device was not available, its virtual geometry was reconstructed from technical drawings and on-field measurements (Figure 2). During this phase, the geometry of the heat exchanger was slightly simplified to reduce the computational effort of the subsequent simulations. In particular, the connections of the bottom header to the inspection door and the condensate tank were removed from the three-dimensional model, as well as small discontinuities related to the flanged and welded joints.

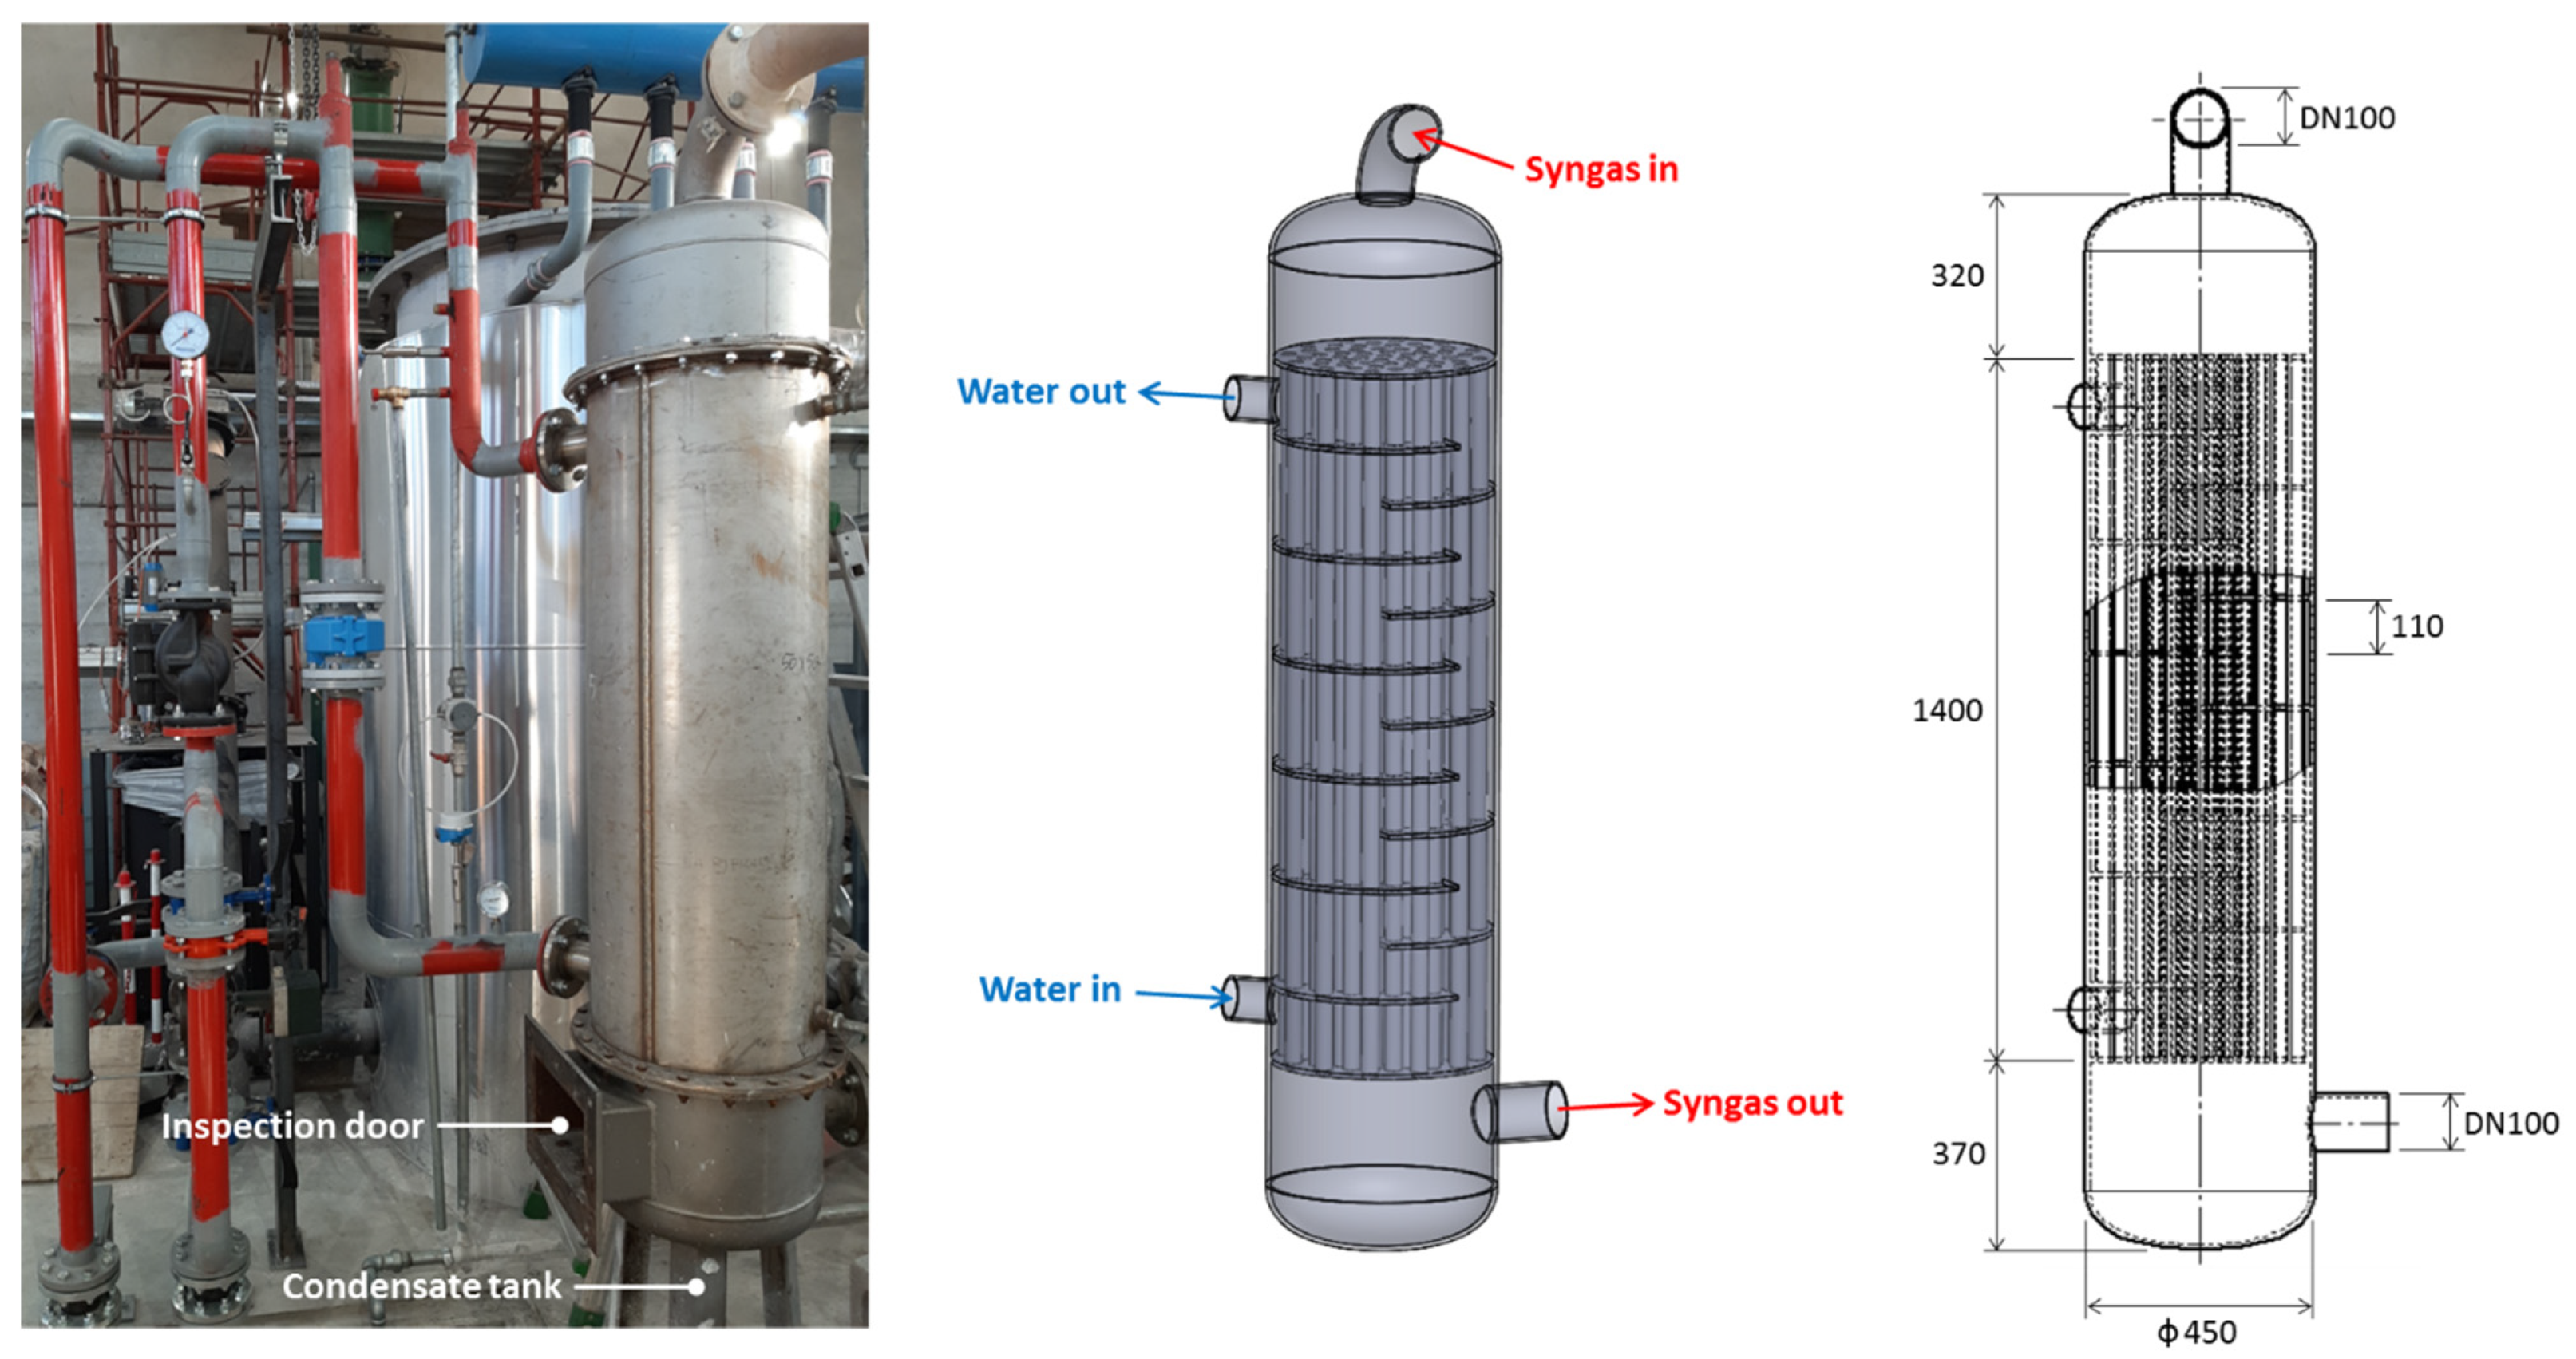
Operating Conditions and Model Setup

To characterize the performance of the shell-and-tube heat exchanger, steady conjugate heat transfer simulations were performed with the commercial CFD code ANSYS CFX 20.2 under its nominal operating conditions, which are outlined in Table 1. The computational domain for the analysis of the clean device consisted of two fluid domains (syngas and water) and one solid domain. Since all heat exchanger components (shell, tube bundle, tube plates, baffles, headers) were merged to form a single solid domain, thermal contact resistances at the interfaces between adjacent elements were neglected. A grid sensitivity analysis was performed, checking the variation of the power of the heat exchanger and the pressure losses of the syngas compared to a progressive refinement of the mesh from about 40 million to 70 million elements. The chosen grid was composed of about 61 million elements. The mesh was generated by employing near-wall refinements, with 3 prism layers added to the solid walls (Figure 3).
The fuel gas produced in the downdraft gasifier was sampled, and its overall composition is reported in Table 2. Since no reaction is expected within the heat exchanger except for tar condensation (which would involve only a slight change in the gas composition), the composition was considered to be uniform over the corresponding fluid domain. Therefore, the syngas was approximated as an ideal gas mixture, whose thermophysical properties were assumed to be constant and was evaluated by weighted averaging of the properties of the components according to their molar fractions (Table 3).
The boundary conditions for the conjugate heat transfer calculations reflected the previously highlighted nominal operation point of the device. For the tube-side fluid (syngas), the inlet relative pressure and temperature were specified at the inlet section of the domain, while the mass flow rate was imposed at the outlet section. For the shell-side fluid (water), the mass flow rate and inlet temperature were set at the domain inflow boundary, whereas a zero relative pressure was applied at the outflow boundary. Solid walls that were wet by the fluids were treated as hydraulically smooth, and thermal conditions on the external surfaces were specified by imposing a heat transfer coefficient of 10 W/(m2∙K), representative of natural convection over a vertical surface according to [21]. Finally, a reference temperature for the environment was set at 15 °C. The turbulence model used in the simulations was the standard k-epsilon model, and near-wall effects were modeled with scalable wall functions [22]. A second-order high-resolution advection scheme was adopted for both the flow and turbulence equations.

3. Clean Heat Exchanger Performance

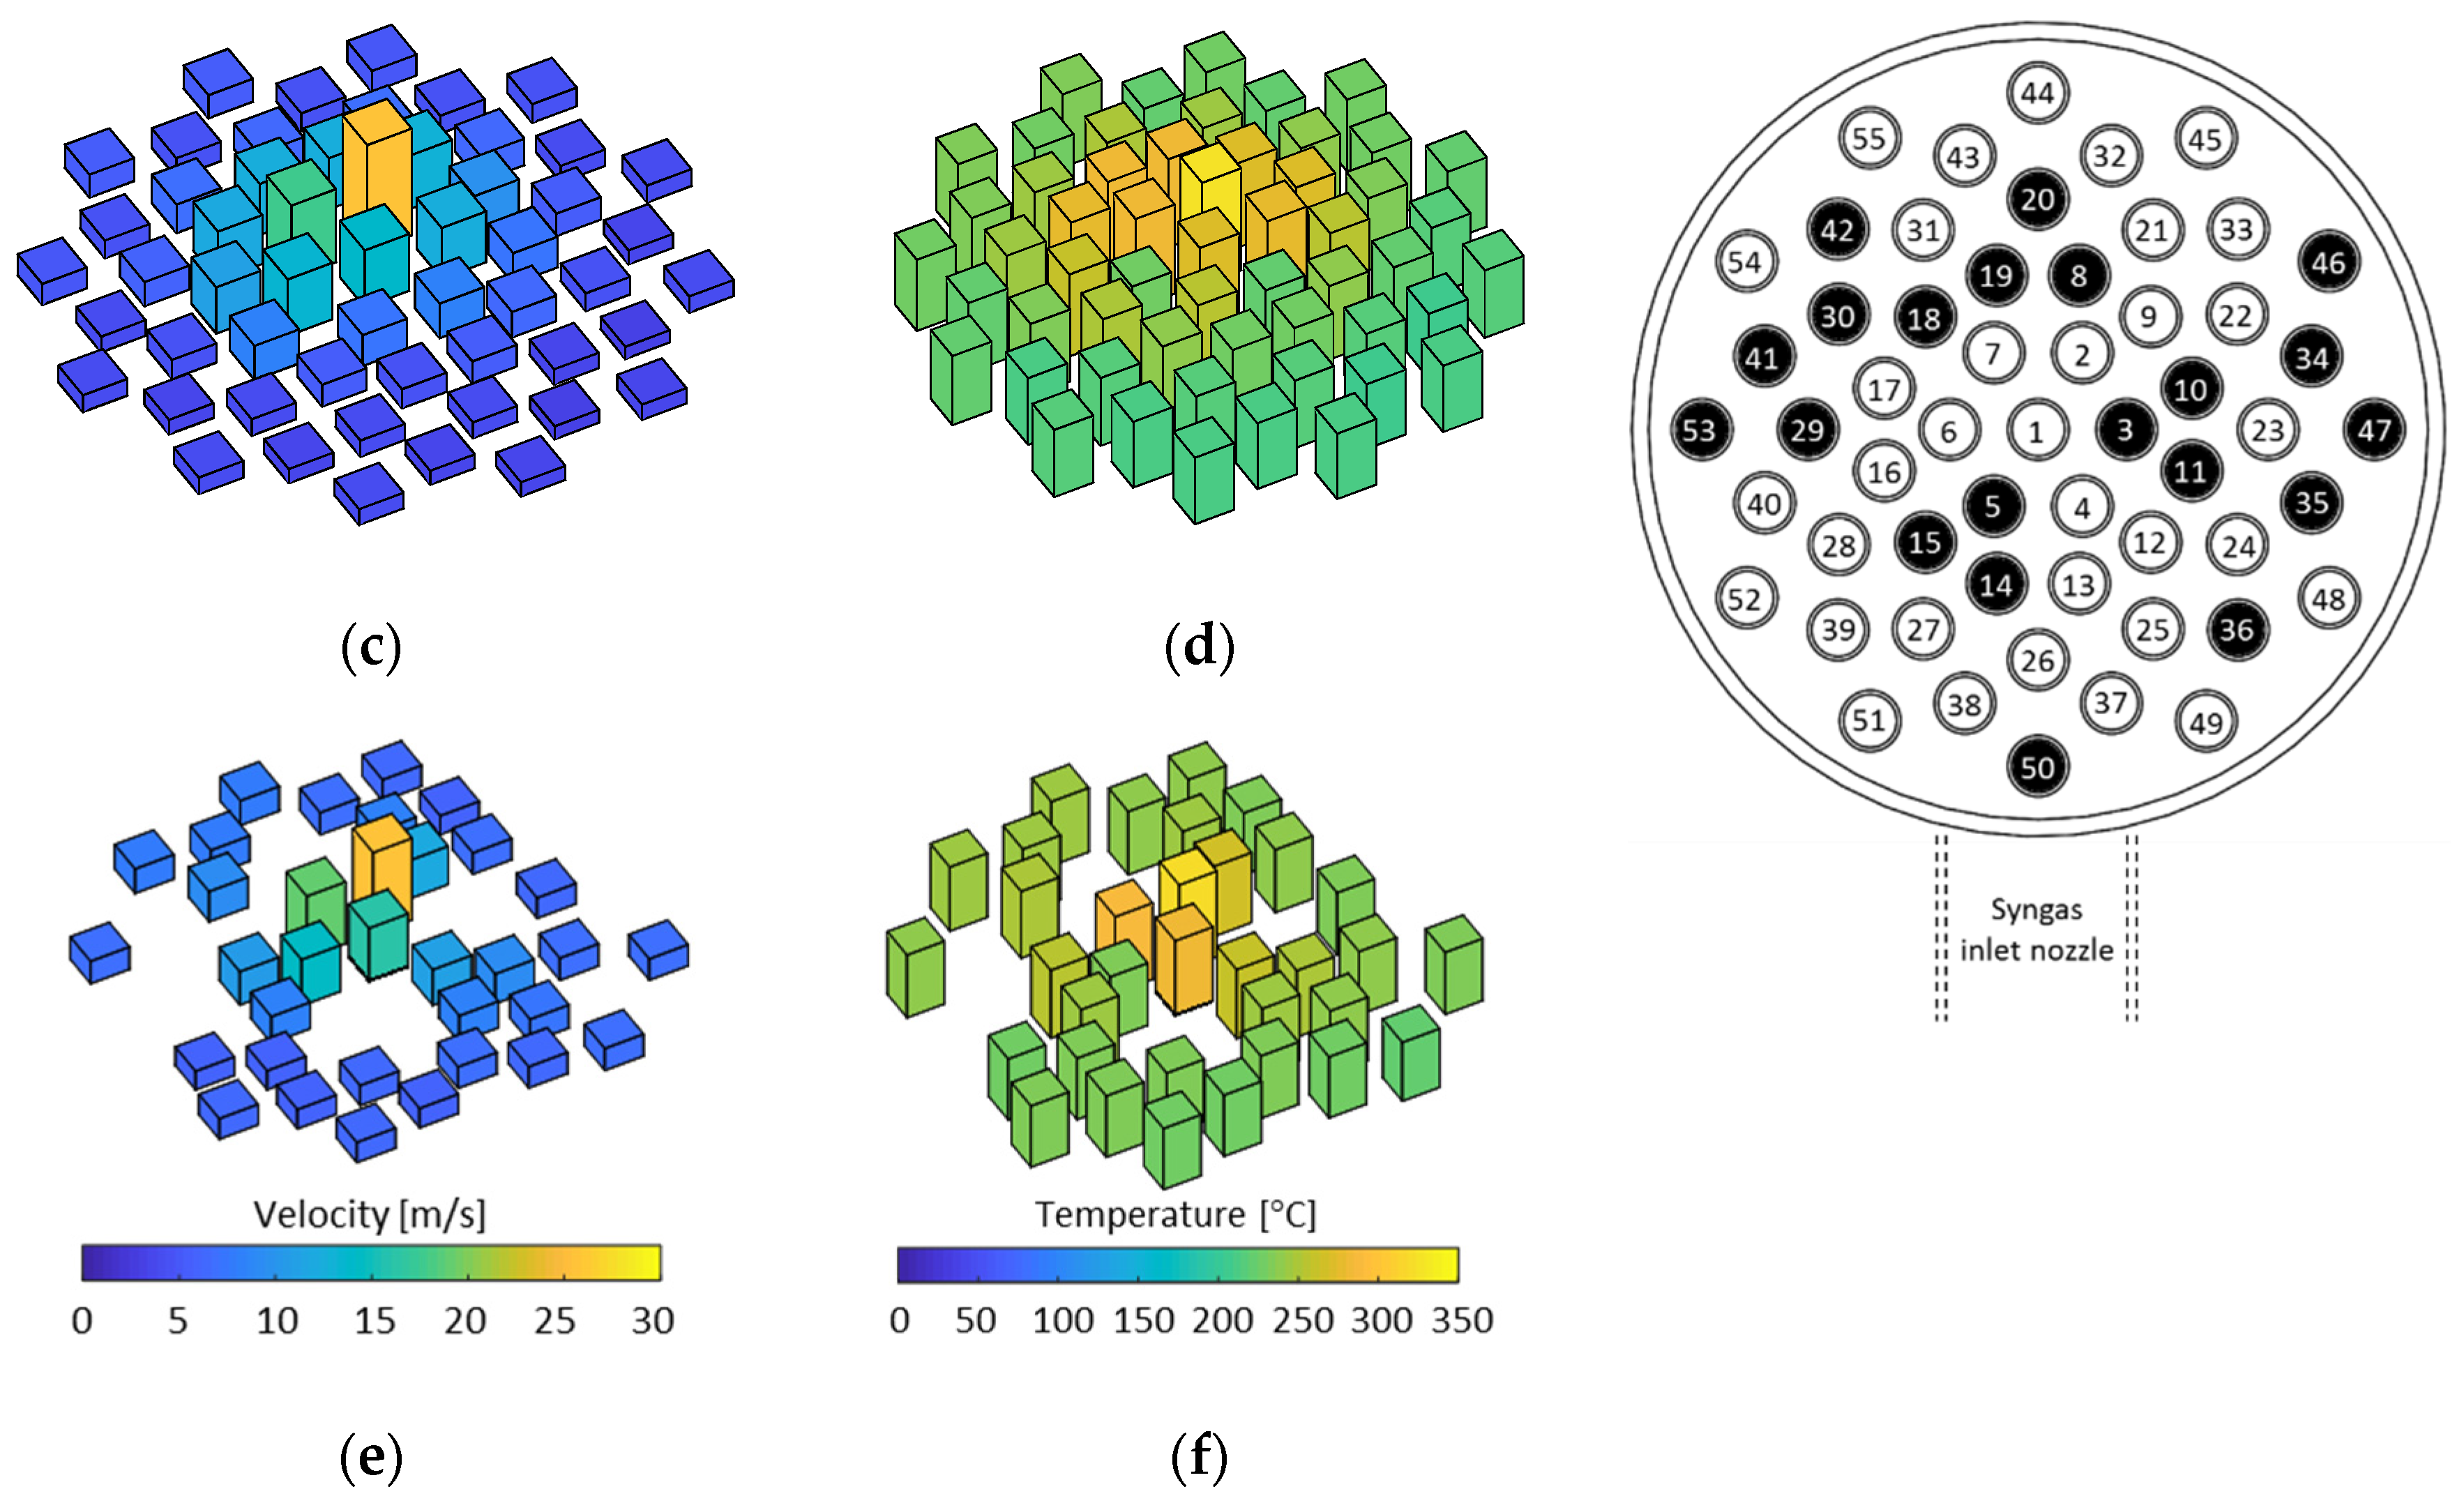
3.1. Flow Distribution Analysis

A uniform distribution of flow in the tube bundle of shell-and-tube heat exchangers is assumed in conventional designs. Nevertheless, as stressed by Mohammadi and Malayeri [23], in practice, flow maldistribution is an inevitable occurrence, which may have severe implications on heat exchanger performance. Among the different causes of flow maldistribution identified by the authors, gross flow maldistribution is caused by the geometrical characteristics of the device. This type of maldistribution can significantly increase the tube-side flow pressure drop and result in a reduced heat transfer rate [23]. In particular, Kim et al. [24] demonstrated that the configuration of the inlet nozzle and intake header strongly influences the flow distribution in the tube bundle.
Figure 4, which shows a clean heat exchanger under examination, illustrates the velocity field of syngas within the upper header on two section planes orthogonal to each other, passing through the header axis (the left section contains the axis of the inlet nozzle). It is possible to observe that the syngas flow coming from the inlet nozzle was not uniformly distributed among the tubes. In such a configuration of the intake header, the tubes in line with the nozzle are preferentially fed by the gas flow. Moreover, a significant flow recirculation occurred when syngas entered the header, resulting in extended dead zones.
In order to visualize the flow maldistribution in the tube bundle, Figure 5 depicts the velocity field of the syngas on a cross-section at the mid-length of the bundle, together with the numbering scheme adopted for the identification of the tubes (dashed lines clarify the orientation of the inlet nozzle). A noticeable flow non-uniformity could be detected, with syngas velocities up to 17 m/s in some of the preferentially fed tubes (tubes 2 and 7). However, several tubes facing the dead zone that formed below the 90° bend characterizing the inlet nozzle showed velocities in the order of 1 m/s. From a quantitative point of view, it is possible to express the flow maldistribution in the tube bundle in terms of a velocity deviation δ, defined as [23]:
δ = v V V
where v is the local average fluid velocity in a tube and V is the average fluid velocity in the whole tube bundle, equal to 4.6 m/s (design value). The histogram in Figure 6 shows the distribution of the velocity deviation in the tubes; the quantity on the vertical axis is the ratio between the number n of tubes characterized by a velocity deviation that falls within a specific interval and the total number N of tubes in the bundle. As can be noticed, only about 3.5% of the tubes presented with a local average velocity almost equal to the design value. The local average fluid velocity was lower than 4.6 m/s in about 67% of the tubes. On the contrary, the velocity deviation exceeded 100% in about 16% of the tubes (preferentially fed tubes). These results confirm the highly questionable assumption of bundle uniform flow for shell-and-tube heat exchangers [23,24].

3.2. Temperature Distribution Analysis

The temperature field of the syngas within the intake header for the clean heat exchanger is illustrated in Figure 7 on the same section planes considered in Figure 4. The syngas temperature distribution reflects the velocity field analyzed in the previous paragraph. The tubes aligned with the inlet nozzle were fed by a gas stream with a temperature slightly lower than 350 °C (syngas inlet temperature). At the same time, those facing the recirculating flow regions of the header were characterized by a lower entrance temperature. In fact, before entering these tubes, the gas flows over the upper tube plate (whose wall temperature ranged from 85 °C to 100 °C), separating the syngas from water.
In order to evaluate the gas cooling process within the tube bundle, the graph in Figure 8 outlines the evolution of the syngas temperature T along the tube axis (l refers to the tube length) for five characteristic tubes, whose location in the bundle is highlighted in red in the schematic (tube 1 is the central pipe, while tubes 44, 47, 50 and 53 are adjacent to the shell wall). The overall temperature drop ranged from 125 °C, for tube 1, to 140 °C, for tube 44. The maximum gas cooling was thus obtained in tube 44, in which the average fluid velocity was almost equal to the design value of 4.6 m/s (Figure 5). Therefore, the flow maldistribution imposed different heat transfer conditions for the tubes, generating a set of passages affected by flow conditions far different from those designed. This condition reflects a non-homogeneous condensation, reported in detail below. In contrast, the syngas temperature drop was lowest in tube 1, for which the velocity deviation exceeded 100%. The flow maldistribution finally resulted in a non-uniform gas exit temperature among the tubes.

4. Tar Condensation Assessment

For a qualitative assessment of tar droplet formation and deposition within the clean shell-and-tube heat exchanger, steady Eulerian–Lagrangian simulations were carried out. This analysis investigated if favorable conditions were established for tar condensation and predicted the potential deposition zones by tracking the droplet trajectories. Since the sampling of the tar produced in the biomass gasification plant of Parma was not available at the moment of writing, the composition and concentration of tar in the syngas were assumed based on literature data. In accordance with Casari et al. [20], who studied the deposition of tar in the piping system downstream of the heat exchanger under examination, the tar compound concentrations found by Dufour et al. [25] were employed. As can be observed from Table 4, tar components were grouped here according to the classification system proposed by Kiel et al. [14], and the dew point for the different tar classes was calculated as a function of tar-class concentration with the model developed in [14] (Figure 1).

4.1. Simulation Strategy

As explained above, the condensation of tar occurs when the local temperature of the syngas drops until the tar dew point is reached, leading to aerosol formation [8]. Such droplets are likely to keep increasing in size as the condensation process continues. In the simplified simulation strategy adopted, based on the Eulerian–Lagrangian approach, a distribution of fixed-diameter particles (discrete phase) was injected onto the previously solved gas flow field (continuous phase).
d u p d t = F D + ρ p ρ ρ p g ,
Particles were released at the same local velocities as the gas flow from the inflow boundary of the inlet nozzle, with equally spaced, randomly positioned injection points. In accordance with Casari et al. [20], the particle diameter distribution was specified starting from the experimental results of Vasudevan et al. [26]. In particular, three characteristic diameters representing the reported particle size distribution were considered for each tar class: 0.1 μm, 5.6 μm, and 12.3 μm. These fixed-diameter particles represented 54.2%, 21.4%, and 24.4%, respectively, of the total volume of injected particles. Since the particle volume fraction was very low (<<10%), it was assumed that particles did not affect the fluid flow (one-way coupling approach). The trajectories of individual particles were computed by integrating a force balance equation on the particle, where the left-hand side represents the inertial force per unit mass acting on the particle and up is the particle velocity vector. The first and the second term on the right-hand side are the drag force and the buoyancy force per unit particle mass, respectively—where ρp is the particle density, ρ is the gas density, and g is the gravity acceleration vector. In the present analysis, the drag coefficient for spherical particles was expressed according to the empirical correlation of Schiller and Naumann [27]. Furthermore, the turbulent dispersion of particles in the fluid phase was predicted using the stochastic model of Gosman and Ioannides [28].
In order to assess if favorable conditions were established for tar condensation within the heat exchanger, the convective heat transfer between particles and fluid was accounted for with the model proposed by Ranz and Marshall [29,30]. If the particle temperature reaches the tar dew point, a droplet with a diameter equal to that of the particle is assumed to form instantly. Injected particles can thus be considered as probes, whose temperature is monitored to detect the potential condensation of tar in the syngas flow. When the particle impacts a surface, the computation of its trajectory is interrupted (null restitution coefficients), and the impact temperature is evaluated; if this temperature is lower than the tar dew point, tar droplet deposition is supposed to occur. The thermophysical properties of tar relevant to particle trajectory and heat transfer calculations were taken from the work of Euh et al. [31]. The density, specific heat, and thermal conductivity of tar were set equal to 1153 kg/m3, 1470 J/(kg∙K)] and 0.150 W/(m∙K), respectively.

4.2. Potential Tar Deposition Zones

The analysis of particle impact temperature for the different tar classes showed that tar condensation/deposition was possible only for class 5. For the tar-class concentrations taken into consideration, the temperature of injected particles could only reach the dew point with the class 5 tar within the heat exchanger. A completely different scenario was found by Casari et al. [20] in the piping system downstream of the heat exchanger due to the lower temperatures of the syngas. Except for class 3, whose dew point falls below 0 °C, tar deposits inside the piping were predicted for each tar class.
Figure 9, which shows the class 5 tar, depicts the impact patterns for the considered particle diameters by means of colored particle plots. Each dot, representing a single particle hitting the surface, is colored red or blue depending on whether its impact temperature was higher or lower than the tar dew point. In the second case, tar droplet deposition is assumed to occur. For the sake of clarity, heat exchanger surfaces were grouped into three zones, which were analyzed separately: (i) the upper zone, comprising the inlet nozzle, and the upper header and plate, (ii) the tube bundle, and (iii) the bottom zone, which comprises the bottom header and plate, and the outlet nozzle. As can be noticed, favorable conditions were not established for tar condensation within the upper zone due to the high-temperature values of the gas flow (Figure 7). The deposition of tar droplets was first detected in the lower part of the tube bundle. In particular, tar deposition started earlier for the tubes adjacent to the shell wall, in which the syngas reached the lowest temperatures (Figure 8). However, fewer tar deposits formed in these tubes than in the preferentially fed ones, due to the flow maldistribution in the bundle (Figure 5). Therefore, tar droplet deposition also occurred on the bottom zone surfaces. Within the bottom header, the presence of low-temperature recirculating flow regions—analogous to those illustrated in Figure 7 for the intake header—promotes the condensation of tar, which also deposits on the outlet nozzle surface.
The preceding considerations are further clarified by Figure 10, which still refers to the class 5 tar. The particle impacts along the heat exchanger height h are reported as a function of the impact temperature T, for particles with a diameter of 0.1 μm and 12.3 μm. Each dot, representing a single particle hitting the surface, is colored red, green, or blue depending on whether the impact took place over the upper zone, the tube bundle, or the bottom zone surfaces, respectively. For an immediate identification of impacts that, in accordance with the adopted strategy, resulted in tar droplet deposition, a dashed line is drawn in correspondence to the class 5 tar dew point (equal to 162.6 °C).

5. Fouled Heat Exchanger Analysis

5.1. On-Field Fouling Observations

The visual inspection of shell-and-tube heat exchanger surfaces during maintenance operations revealed the presence of solid deposits due to the condensation of tar. As can be noted from Figure 11, which shows the aspect of the upper tube plate before (left) and after (right) mechanical cleaning, the deposit build-up resulted in the clogging of several tubes. The presence of solid tar on the upper plate affected a significant portion of the surface, and no preferential regions can be detected. The condensation of tar during the heat exchanger operation was due to a combination of tar concentration, syngas velocity, and temperature conditions, together with flow recirculation and vortex phenomena responsible for carrying the tar droplets through the heat exchanger. Therefore, the visual inspection of the actual heat exchanger is fundamental to detect the fouling magnitude and the position of the fouled and clogged tubes. As remarked in the description of the numerical simulation strategy, the tar concentration was imposed according to literature data [20,26] and was not directly related to the operating conditions of the considered plant. Therefore, only a qualitative comparison was possible between the numerical condensation pattern and the actual one.
Starting from these on-field detections, a representative clogged configuration for the heat exchanger was determined, in which 21 tubes (38%) were considered wholly blocked by deposits. Moreover, to investigate the progressive performance degradation resulting from the accumulation of tar deposits on tube bundle heat transfer surfaces, a further fouled model for the heat exchanger was developed. In this model, which represents an intermediate fouled condition between the clean configuration and the clogged one, a uniform-thickness tar layer was assumed to reduce the cross-sectional area of each of the aforementioned 21 tubes by 50%. The numerical model setup for both the fouled and clogged configurations was analogous to that described for the heat exchanger with clean surfaces. The only difference to the previous setup concerned the definition of the computational domain, which involved an additional solid domain for tar deposits.

5.2. Performance Deterioration Assessment

Table 5 reports the performance of the shell-and-tube heat exchanger for each of the configurations taken into consideration. For the sake of completeness, the conditions reported in Table 5 refer to the clean (the heat exchanger is not affected by tar deposition), fouled (the tube bundle of the heat exchanger presents a reduced passage area due to a partial obstruction coming from tar deposition), and clogged (the worst operating condition for the heat exchanger, with several tubes completely obstructed by tar deposits) conditions. In particular, the heat transfer rate from syngas (Qsyngas) to water (Qwater) and ambient air (Qair), the heat transfer effectiveness (ε), and the tube-side flow pressure drop (∆psyngas) are outlined. The heat transfer effectiveness is defined as the ratio between the actual heat transfer rate from the syngas and the maximum possible heat transfer rate in the heat exchanger, equal to 30,828 W. The heat transfer rate from syngas to water (Qwater) progressively decreased as tar deposits accumulate on the tube bundle. For the fouled configuration, this was primarily due to the additional conductive resistance represented by the tar layer, which resulted in a reduction in the overall heat transfer coefficient. For the clogged configuration, the decrease in the rate of heat transfer was instead mainly due to the reduced total heat transfer surface. As can be seen, the heat transfer rate from syngas to ambient air (Qair) showed an opposite behavior, since it increased due to solid deposit build-up. This phenomenon was due to a progressive reduction in the gas cooling within the tube bundle, which led to an increase in the heat transfer between the syngas and ambient air through the bottom header wall. Nevertheless, the increase in Qair did not compensate for the decrease in Qwater and, due to this, the heat transfer effectiveness decreases, passing from the clean to the clogged configuration. Therefore, the deposition of tar caused an increase in the temperature of the gas leaving the heat exchanger, and the pressure drop of the tube-side flow (Table 5). These factors resulted in a reduction in the fuel gas density that fed the internal combustion engine of the combined heat and power plant and, hence, a decrease in its power. At the same time, the reduction in the syngas cooling within the heat exchanger decreased the capacity of the device in promoting the condensation of tar, which was able to reach the engine, causing fouling problems for its components.

5.3. Flow Distribution Modification

The velocity and temperature distributions of syngas in the tube bundle for the considered configurations of the heat exchanger are depicted in Figure 12 by means of three-dimensional histograms. The velocity and temperature values refer to the cross-section at the mid-length of the bundle and were taken at the center of each tube. The position of the fouled/clogged tubes is also indicated according to the adopted numbering scheme. These velocity and temperature representations help in the interpretation of the data reported in Table 5. As stated above, fouling and clogging phenomena induced the modification of heat exchanger performance by reducing the total heat transfer surface. In fact, due to the flow maldistribution, even in the presence of clogged tubes, the distributions of the syngas flow rate (velocity) and temperature through the tubes appeared almost unchanged. However, the gas velocity values in the peripheral tubes slightly increased when passing from the clean to the clogged condition. Similarly, the gas temperature values in the peripheral tubes were not so different when comparing the clean and the clogged conditions. This means that the configuration adopted for the heat exchanger design affected (i) the performance of the clean device (design condition), and also (ii) its sensitivity to the presence of fouling or, more generally, the off-design operating conditions.

6. Conclusions

In the present paper, a numerical analysis of clean and degraded operating conditions of a shell-and-tube heat exchanger used in a syngas-fed power plant is proposed. The syngas was obtained through a gasification process based on lignocellulosic wood chips and pellets. Depending on its temperature, a condensing tar could be generated within the plant. The numerical model was developed based on the actual heat exchanger geometry, and the clean operating condition was studied according to on-field measurements. The analysis of the designed geometry showed a relevant flow maldistribution in relation to the intake header, which was responsible for a non-uniform flow distribution over the tubes. These flow and thermal fields were compared to those coming from the analyses of fouled and clogged conditions. The latter analyses were carried out by generating a degraded flow domain originating from on-field detections of the device after several operating hours. The condensing tar imposed a progressive obstruction of the flow passages and resulted in a modification of the heat exchanger performance during its operation. The present analysis shows how fouled and clogged conditions cause a decrease in heat exchanger effectiveness, imposing even more dangerous operating conditions for the internal combustion engine. The capability of the heat exchanger to condense, and thus, separate the tar from the syngas flow has to be kept at a sufficient level to preserve safe conditions for the combustion engine. With any reduced effectiveness, the capability of the heat exchanger to condense tar and separate it from the gas stream decreases, and the safety margin of the plant operation is reduced accordingly. Furthermore, maintenance intervals have to be scheduled according to the tar concentration and the design features of the heat exchanger. Fluid dynamic analysis is fundamental to discovering how the tubes and the intensity of the tar deposition are involved in flow passage.

Author Contributions

Conceptualization, N.A., N.C., M.P., A.S., A.V.; methodology, N.A., M.P., A.S.; software, N.A.; validation, N.A., M.P., A.S.; formal analysis, N.A., M.P., A.S.; investigation, N.A., N.C., M.P., A.S., A.V.; data curation, N.A.; writing—original draft preparation, N.A.; writing—review and editing, N.A., M.P., A.S.; project administration, M.P., A.S.; funding acquisition, M.P. All authors have read and agreed to the published version of the manuscript.

Funding

This work was carried out within the framework of the research project “SYNBIOSE—Gassificazione di biomasse lignocellulosiche in sistemi di cogenerazione di piccola taglia (<200 kW) per applicazioni nel settore terziario” (CUP G96G16000800003) funded by “Cassa per i servizi energetici e ambientali” within the call “Bando di gara per progetti di ricerca di cui all’art. 10, comma 2, lettera b) del decreto 26/1/2000, previsti dal Piano triennale 2012–2014 della ricerca di sistema elettrico nazionale e dal Piano operativo annuale 2013”.

Conflicts of Interest

The authors declare no conflict of interest. The funders had no role in the design of the study, in the collection, analyses, or interpretation of data, in the writing of the manuscript, or in the decision to publish the results.

References

  1. Srirangan, K.; Akawi, L.; Moo-Young, M.; Chou, C.P. Towards sustainable production of clean energy carriers from biomass resources. Appl. Energy 2012, 100, 172–186. [Google Scholar] [CrossRef]
  2. Molino, A.; Chianese, S.; Musmarra, D. Biomass gasification technology: The state of the art overview. J. Energy Chem. 2016, 25, 10–25. [Google Scholar] [CrossRef]
  3. Heidenreich, S.; Foscolo, P.U. New concepts in biomass gasification. Prog. Energy Combust. Sci. 2015, 46, 72–95. [Google Scholar] [CrossRef]
  4. Ahrenfeldt, J.; Thomsen, T.P.; Henriksen, U.; Clausen, L.R. Biomass gasification cogeneration—A review of state of the art technology and near future perspectives. Appl. Therm. Eng. 2013, 50, 1407–1417. [Google Scholar] [CrossRef] [Green Version]
  5. Belgiorno, V.; De Feo, G.; Della Rocca, C.; Napoli, R.M.A. Energy from gasification of solid wastes. Waste Manag. 2003, 23, 1–15. [Google Scholar] [CrossRef]
  6. Asadullah, M. Biomass gasification gas cleaning for downstream applications: A comparative critical review. Renew. Sustain. Energy Rev. 2014, 40, 118–132. [Google Scholar] [CrossRef]
  7. Han, J.; Kim, H. The reduction and control technology of tar during biomass gasification/pyrolysis: An overview. Renew. Sustain. Energy Rev. 2008, 12, 397–416. [Google Scholar] [CrossRef]
  8. Li, C.; Suzuki, K. Tar property, analysis, reforming mechanism and model for biomass gasification—An overview. Renew. Sustain. Energy Rev. 2009, 13, 594–604. [Google Scholar] [CrossRef]
  9. Morf, P.O. Secondary Reactions of Tar during Thermochemical Biomass Conversion. Ph.D. Thesis, Swiss Federal Institute of Technology, Zurich, Switzerland, 2001. [Google Scholar]
  10. Milne, T.A.; Evans, R.J.; Abatzoglou, N. Biomass Gasifier “Tars”: Their Nature, Formation and Conversion; National Renewable Energy Laboratory (NREL): Golden, CO, USA, 1998. [Google Scholar]
  11. Evans, R.J.; Milne, T.A. Molecular Characterization of the Pyrolysis of Biomass. 1. Fundamentals. Energy Fuels 1987, 1, 123–137. [Google Scholar] [CrossRef]
  12. Evans, R.J.; Milne, T.A. Molecular Characterization of the Pyrolysis of Biomass. 2. Applications. Energy Fuels 1987, 1, 311–319. [Google Scholar] [CrossRef]
  13. Evans, R.J.; Milne, T.A. Chemistry of Tar Formation and Maturation in the Thermochemical Conversion of Biomass. In Developments in the Thermochemical Biomass Conversion; Bridgwater, A.V., Boocock, D.G.B., Eds.; Springer: Dordrecht, The Netherlands, 1997; Volume 2. [Google Scholar]
  14. Kiel, J.H.A.; van Paasen, S.V.B.; Neeft, J.P.A.; Devi, L.; Ptasinski, K.J.; Janssen, F.J.J.G.; Meijer, R.; Berends, R.H.; Temmink, H.M.G.; Brem, G.; et al. Primary Measures to Reduce Tar Formation in Fluidised-Bed Biomass Gasifiers; Energy Research Centre of the Netherlands (ECN): Petten, The Netherlands, 2004. [Google Scholar]
  15. Devi, L.; Ptasinski, K.J.; Janssen, F.J.J.G. A review of the primary measures for tar elimination in biomass gasification processes. Biomass Bioenergy 2003, 24, 125–140. [Google Scholar] [CrossRef]
  16. Anis, S.; Zainal, Z.A. Tar reduction in biomass producer gas via mechanical, catalytic and thermal methods: A review. Renew. Sustain. Energy Rev. 2011, 15, 2355–2377. [Google Scholar] [CrossRef]
  17. Thapa, S.; Bhoi, P.R.; Kumar, A.; Huhnke, R.L. Effects of Syngas Cooling and Biomass Filter Medium on Tar Removal. Energies 2017, 10, 349. [Google Scholar] [CrossRef] [Green Version]
  18. Thapa, S.; Indrawan, N.; Bhoi, P.R.; Kumar, A.; Huhnke, R.L. Tar reduction in biomass syngas using heat exchanger and vegetable oil bubbler. Energy 2019, 175, 402–409. [Google Scholar] [CrossRef]
  19. Gambarotta, A.; Manganelli, M.; Morini, M. A model for filter diagnostics in a syngas-fed CHP plant. Energy Procedia 2018, 148, 400–407. [Google Scholar] [CrossRef]
  20. Casari, N.; Pinelli, M.; Suman, A.; Candido, A.; Morini, M. Deposition of syngas tar in fuel supplying duct of a biomass gasifier: A numerical study. Fuel 2020, 273, 117579. [Google Scholar] [CrossRef]
  21. Bergman, T.L.; Lavine, A.S.; Incropera, F.P.; DeWitt, D.P. Fundamentals of Heat and Mass Transfer, 8th ed.; John Wiley & Sons Inc.: Hoboken, NJ, USA, 2017. [Google Scholar]
  22. ANSYS CFX User Manual—V 20.2.; ANSYS, Inc.: Canonsburg, PA, USA, 2020.
  23. Mohammadi, K.; Malayeri, M.R. Parametric study of gross flow maldistribution in a single-pass shell and tube heat exchanger in turbulent regime. Int. J. Heat Fluid Flow 2013, 44, 14–27. [Google Scholar] [CrossRef]
  24. Kim, M.I.; Lee, Y.; Kim, B.W.; Lee, D.H.; Song, W.S. CFD modeling of shell-and-tube heat exchanger header for uniform distribution among tubes. Korean J. Chem. Eng. 2009, 26, 359–363. [Google Scholar] [CrossRef]
  25. Dufour, A.; Masson, E.; Girods, P.; Rogaume, Y.; Zoulalian, A. Evolution of Aromatic Tar Composition in Relation to Methane and Ethylene from Biomass Pyrolysis-Gasification. Energy Fuels 2011, 25, 4182–4189. [Google Scholar] [CrossRef]
  26. Vasudevan, T.V.; Gokhale, A.J.; Mahalingam, R. Phoretic Phenomena in Tar Vapor-Particulate Mixture Separation from Fuel Gas Streams. Can. J. Chem. Eng. 1985, 63, 903–910. [Google Scholar] [CrossRef]
  27. Schiller, L.; Naumann, A. A drag coefficient correlation. Z. VDI 1933, 77, 318–320. [Google Scholar]
  28. Gosman, A.D.; Ioannides, E. Aspects of computer simulation of liquid-fueled combustors. J. Energy 1983, 7, 482–490. [Google Scholar] [CrossRef]
  29. Ranz, W.E.; Marshall, W.R. Evaporation from drops: Parts I. Chem. Eng. Prog. 1952, 48, 141–146. [Google Scholar]
  30. Ranz, W.E.; Marshall, W.R. Evaporation from drops: Parts II. Chem. Eng. Prog. 1952, 48, 173–180. [Google Scholar]
  31. Euh, S.H.; Kafle, S.; Lee, S.Y.; Lee, C.G.; Jo, L.; Choi, Y.S.; Oh, J.H.; Kim, D.H. Establishment and validation of tar fouling mechanism in wood pellet boiler using kinetic models. Appl. Therm. Eng. 2017, 127, 165–175. [Google Scholar] [CrossRef]
Figure 1. Tar dew point for different tar classes as a function of tar-class concentration.
Energies 15 01490 g001
Figure 2. Shell-and-tube heat exchanger for syngas cooling: actual geometry and reconstructed three-dimensional model.
Energies 15 01490 g002
Figure 3. Cross-sectional view of heat exchanger numerical grid (detail of the mesh around the tubes shown in a close-up).
Energies 15 01490 g003
Figure 4. Syngas velocity distribution within the intake header for the clean heat exchanger.
Energies 15 01490 g004
Figure 5. Syngas velocity distribution on a cross-section at the mid-length of the tube bundle for the clean heat exchanger (numbering scheme used to identify tubes reported on the right).
Energies 15 01490 g005
Figure 6. Velocity deviation distribution in the tube bundle for the clean heat exchanger.
Energies 15 01490 g006
Figure 7. Syngas temperature distribution within the intake header for the clean heat exchanger.
Energies 15 01490 g007
Figure 8. Evolution of syngas temperature along the tube axis for five characteristic tubes (location in the bundle highlighted in red in the schematic on the right).
Energies 15 01490 g008
Figure 9. Tar class 5 deposition patterns according to droplet diameter.
Energies 15 01490 g009
Figure 10. Particle impacts along with the heat exchanger height as a function of impact temperature, for particles with a diameter of 0.1 μm and 12.3 μm (tar class 5).
Energies 15 01490 g010
Figure 11. Upper tube plate before (left) and after (right) mechanical cleaning.
Energies 15 01490 g011
Figure 12. Syngas velocity and temperature distributions on a cross-section at the mid-length of the tube bundle for: (a,b) the clean heat exchanger; (c,d) the fouled heat exchanger; (e,f) the clogged heat exchanger (position of fouled/clogged tubes reported on the right by solid black color).
Energies 15 01490 g012aEnergies 15 01490 g012b
Table 1. Nominal operating conditions of the heat exchanger.
QuantityValue
Syngas mass flow rate [kg/s]0.10
Syngas inlet relative pressure [Pa]−15,000
Syngas inlet temperature [°C]350
Water volume flow rate [m3/h]11
Water inlet temperature [°C]80
Table 2. Syngas composition.
ComponentMolar Fraction
H20.150
O20.020
N20.420
CH40.015
CO0.230
CO20.165
Table 3. Thermophysical properties of syngas and water.
PropertySyngasWater
Density [kg/m3]variable971.8
Specific heat [J/(kg∙K)]11424197
Dynamic viscosity [Pa∙s]1.655 × e−53.55 × e−4
Thermal conductivity [W/(m∙K)]0.02440.670
Table 4. Tar compound classification, tar-class concentrations, and corresponding dew point.
Tar ClassMajor CompoundsConcentration [mg/m3]Dew Point [°C]
Class 1Undetectable0-
Class 2Phenol, toluene100098.4
Class 3m-Xylene1745−23.3
Class 4Phenanthrene, naphthalene2250108.4
Class 5Pyrene5162.6
Table 5. Heat exchanger performance for the considered configurations.
ConfigurationQsyngas [W]Qwater [W]Qair [W]εpsyngas [Pa]
Clean21,404 18,193 (85.0%)3211 (15.0%)0.694244
Fouled21,05317,806 (84.6%)3247 (15.4%)0.683253
Clogged20,79617,526 (84.3%)3270 (15.7%)0.675269
Publisher’s Note: MDPI stays neutral with regard to jurisdictional claims in published maps and institutional affiliations.

