Abstract
The article analyzes the thermal degradation in the inert and oxidative atmosphere of waste vinyl panels, the main component of which is PVC. Both pyrolysis and incineration of plastic waste are difficult, complex and multifaceted processes due to several physical and chemical phenomena occurring during their performance. The coupled TG-MS (thermogravimetry-mass spectrometry) analysis combined with the Fourier transform infrared spectrometry (TG-FTIR) analysis was used to identify the decomposition mechanisms of waste vinyl panels. Thermogravimetric tests were carried out for two heating rates of 5 and 20 K/min in the temperature range of 40–1000 °C, mass losses were determined, and products resulting from thermal degradation were identified. It was found that the individual components decompose at different temperatures depending on the heating rate and the choice of an inert or oxidative atmosphere. Vinyl floor panels were treated in terms of secondary raw material, which, in the light of the circular economy, may constitute a potential energy or chemical resource.
1. Introduction
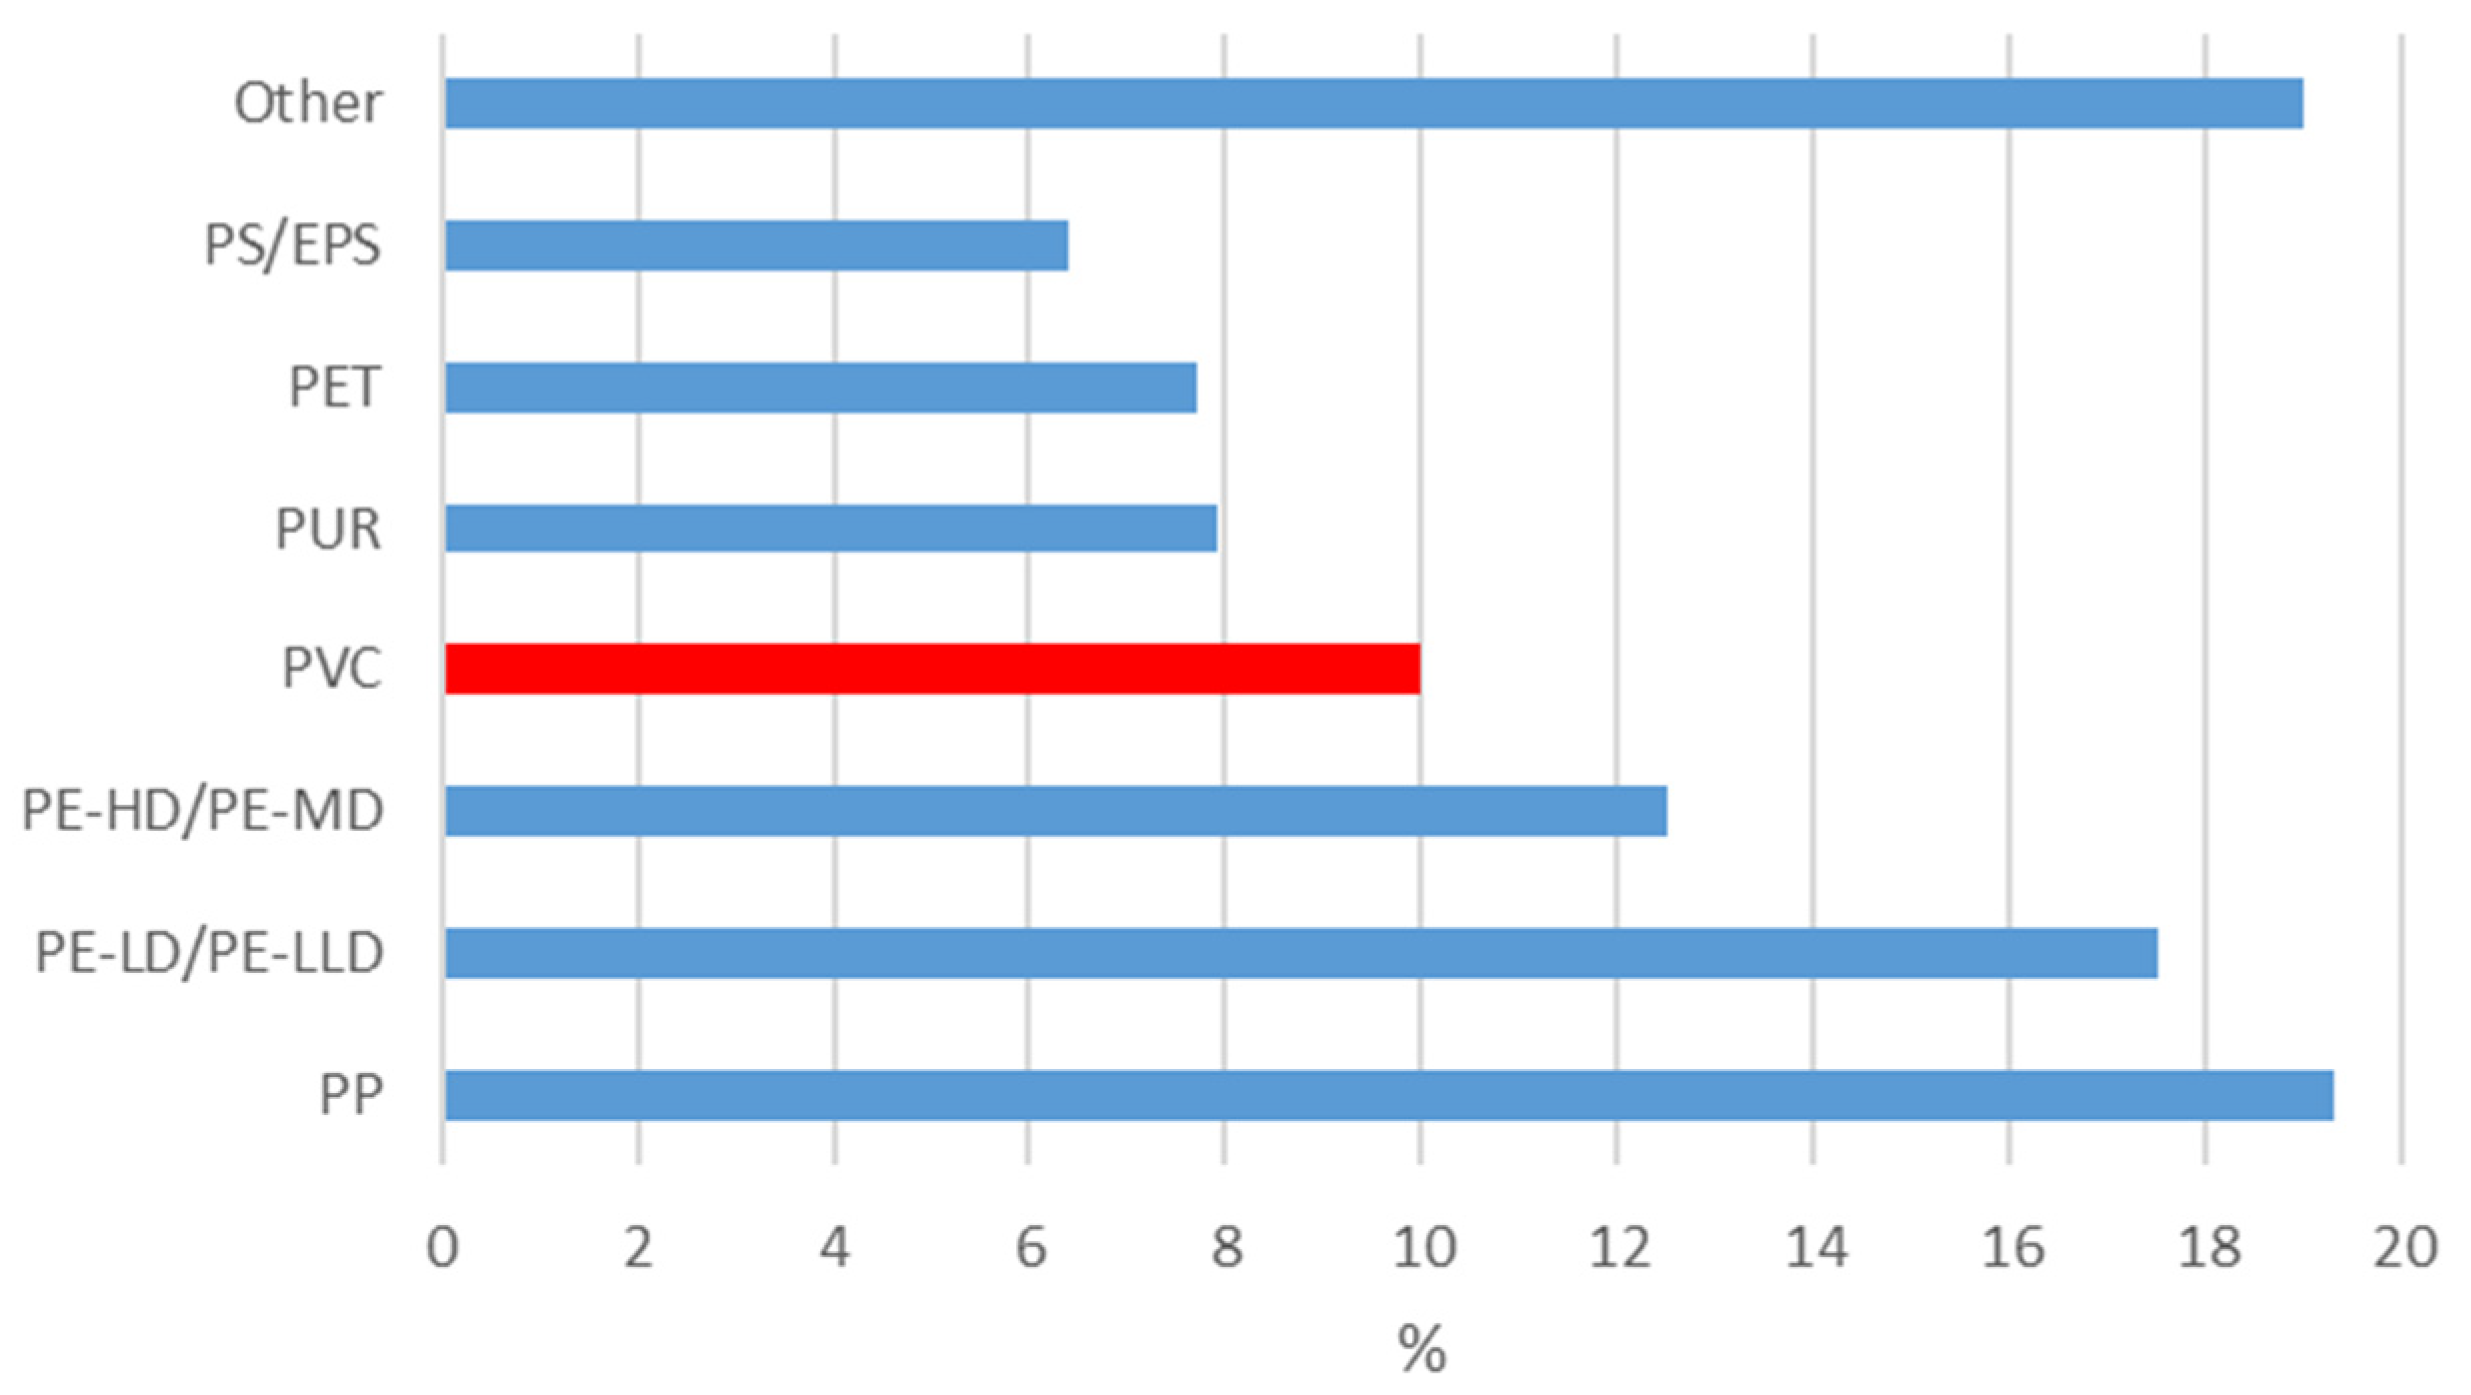
In connection with the progressive development of civilization, a continuous increase in the amount of generated waste is observed, including plastics. Due to their versatile properties and price, they successfully displace materials such as glass, metals, or wood. The scale of the demand for plastics can be proved by their annual production in the world, which in 2018 amounted to 359 million Mg, including in Europe—61.8 million Mg [1]. The management of most plastics is not a huge problem, as they can be recycled or converted into fuel in the first place. Highly contaminated plastics can be sent to a waste incineration plant. Among plastics, there is special attention placed on polyvinyl chloride (PVC), the management of which causes many problems due to the high content of chlorine, which can transform into dangerous substances, such as HCl, hydrogen cyanide, dioxins, etc. [2,3,4,5]. It is a material that is widely used, among other applications, in construction and industrial materials (automotive, aviation, medicine) and articles for everyday use. This is due to its thermoplasticity, good abrasion resistance, water, and chemical resistance. In addition, it is flame-retardant [6,7,8,9,10]. Among the produced plastics, PVC constitutes about 10%, as shown in Figure 1. A total of 70% of the PVC produced is used in construction, mostly as siding, floors, windows, doors, fences, sanitary pipes, siphons, or cable sheathing [1,6,8,9].

Figure 1.
Plastics demand distribution by resin types 2018 [1].
The article addresses the topic of waste vinyl panels, which have been gaining popularity in recent years as an interior finishing material. As reported [9], the global amount of the vinyl flooring market was estimated at USD 25.6 billion in 2018. It is forecasted to increase by 7.4% by 2025. According to [10], PVC in vinyl flooring should be separated from other materials in the product before it will be reused in other products. It is not an easy process—additional problems include floor additives such as colors, ultraviolet light inhibitors, stabilizers, plasticizers, fillers, and adhesives used to connect vinyl floors to the substrate [10,11,12,13,14,15]. Stabilizers are used in the processing of PVC mainly due to the instability of PVC [11,12], while dosing the appropriate concentration of the plasticizer allows obtaining the desired degree of flexibility of the material [13,14,15]. Hence, the management of waste vinyl flooring causes environmental concerns.
Chemical Recycling
Chemical recycling can be a way to recycle mixed and multi-material plastics, composite materials, and other complex products. Thus, it can complement material recycling and contribute to reducing the waste stream, including PVC, from landfills and waste incineration plants. This is justified in the light of sustainable development and economics. As a result of chemical recycling through thermochemical processes, plastic waste is broken down into oils and gaseous products that can be used as raw materials in the chemical industry. They can also replace some fossil raw materials when creating new products [16].
Waste of vinyl panels was treated in terms of secondary raw material, which, in the light of the circular economy, may constitute potential energy or chemical resource. To a large extent, the circular economy in waste management is currently focused on resource recovery, rational management of non-renewable resources, and prevention of negative environmental impact [17,18,19,20,21].
A literature review and research show that waste vinyl panels do not have a high calorific value and, at the same time, with a high chlorine content, they are not suitable as a high-energy fuel. Following the circular economy principles, attention was paid to the R3 recovery method Recycling or recovery of organic substances that are not used as solvents (including composting and other biological transformation processes). This item includes the methods of using raw materials and products of gasification and pyrolysis, for example, in the production of chemical reagents [6,7,22,23,24,25]. Apart from gasification and pyrolysis, an example of chemical recycling can also be the chemical depolymerization of PVC [6].
In numerous articles, one can find reports on the co-pyrolysis of PVC with biomass (PVC/straw; PVC/wood; PVC/olive) [6,26,27,28], with other plastics (PVC/PP; PVC/PE; PVC/PS; PVC/ABS, etc.) [6,29], with compounds metals or supercritical water [6,30]. The authors [31] propose chemical recycling of polyvinyl chloride (PVC) waste by liquid-phase treatment, while [6] proposes catalytic dechlorination. An interesting solution that fits into the circular economy is the use of PVC waste as fine aggregate in mortars as a sand substitute [32].
The conducted research is a response to a new product appearing on the market in the form of vinyl floor panels, vinyl panels with a mineral core, and other, similar products, which will become a waste over time. The study aims to initially investigate the potential of vinyl floor panels in terms of the possibility of using them in chemical recycling, taking into account the circular economy. Therefore, the waste was then subjected to indirect pyrolysis and incineration processes. From the comparison of both processes, it was found that pyrolysis is the appropriate process for the recovery of chemical raw materials. The research results presented in the article will be used to plan a further experiment. Currently, research is being carried out on pyrolysis and co-pyrolysis (vinyl panels/wood waste) on a laboratory and semi-industrial scale on a low-temperature pyrolysis furnace. Also, the possibility to substitute fine aggregates (sand) for the waste is examined.
2. Material Characteristics and Methods
Physicochemical tests were performed on a vinyl panel. In the article, the marking of the panel was adopted as follows:
- Vinyl Floor Panel VP1
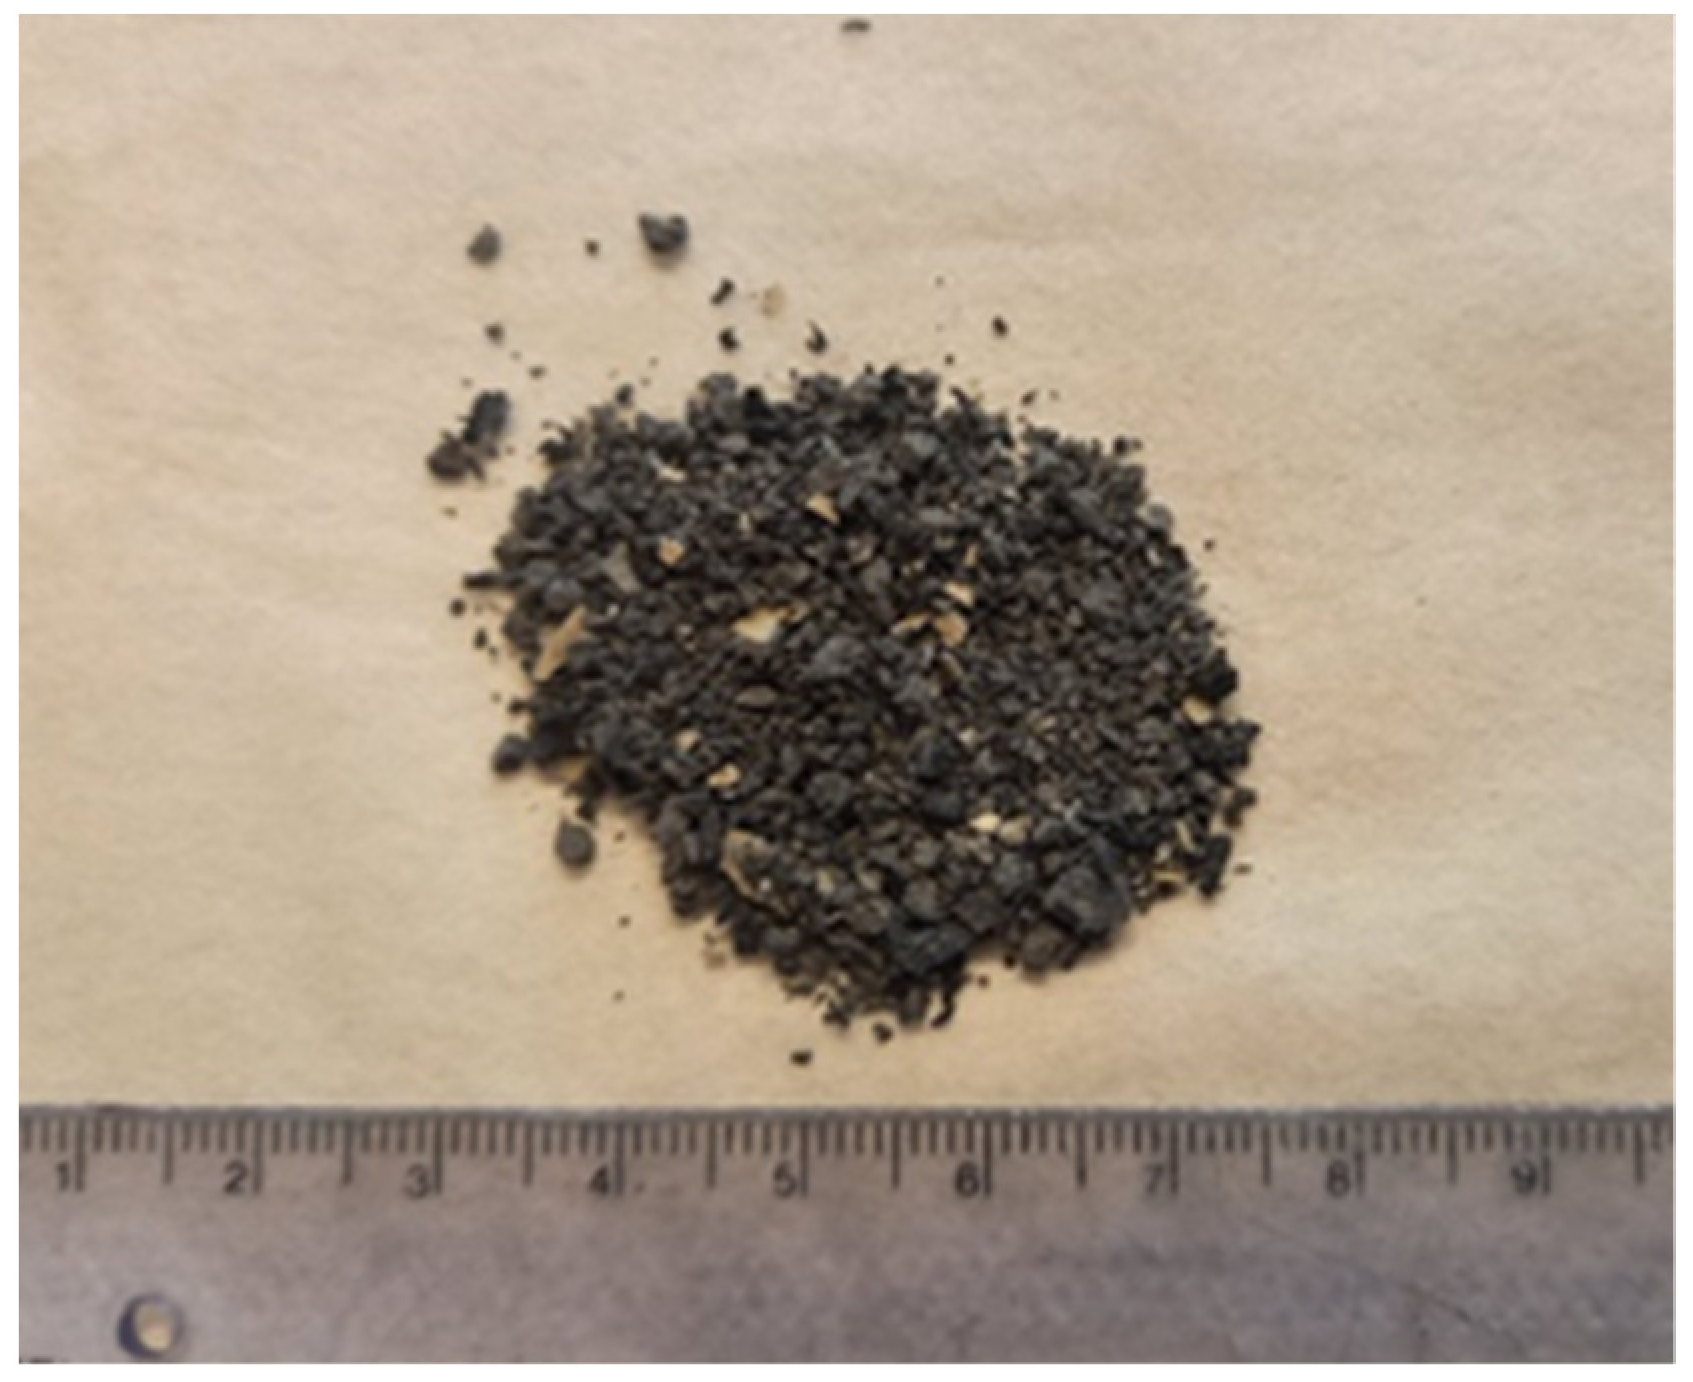
The panel in the form of cuttings were obtained from the renovation of residential buildings. Before carrying out the physicochemical analysis, the panel was cut into 2–3 cm pieces, then ground in an IKA laboratory mill to fractions that did not exceed 3 mm. Figure 2 shows the analyzed sample.
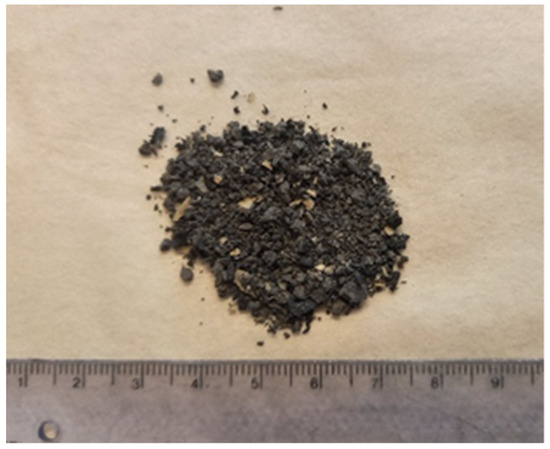
Figure 2.
Analysed sample—VP1.
2.1. Physicochemical Analysis
The goal of the analysis was to determine specific fuel properties and elemental composition [33]. The primary tests were conducted with the application of the following standards: PN-EN 15934:2013-02. Determination of Moisture Content [34]; PN-EN 15403:2011 solid secondary fuels—determination of ash content [35]; PN-G-04516:1998 solid fuels—determination of volatile matter content [36]; PN-ISO 1928:2002 solid fuels—determination of combustion heat in a calorimetric bomb and calculation of calorific value [37]; PN-G-04523:1992 solid fuels—determination of nitrogen content by the Kjeldahl method [38]; PN-EN-15407:2011 solid secondary fuels—methods for the determination of carbon (C), hydrogen (W) and nitrogen (N) content [39]; PN-ISO 334:1997 solid fuels—determination of total sulfur (Eschka’s method) [40]; PN-ISO 587:2000 solid fuels—determination of the chlorine content using the Eschka mixture [41].
2.2. TG-MS/FTIR Measurements
Testing via TG-MS/FTIR was carried out using the STA 409 PG Luxx thermogravimetric analyzer from Netzsch (NETZSCH-Gerätebau GmbH, Selb, Germany) on a TG carrier coupled with a quadrupole mass spectrometer QMS Aeolos (NETZSCH-Gerätebau GmbH, Selb, Germany) and a medium infrared spectrometer (FTIR) Tensor 27 from Bruker (Billerica, MA, USA). The tests were carried out in two ways, analyzing the processes of both pyrolysis and combustion [25,33].
- Pyrolysis
The pyrolysis analysis was performed in an argon atmosphere (purity class 5.0, flow 25 mL/min), from 40 to 1000 °C, with two heating rates of 5 and 20 K/min. The sample weight was 10 ± 0.1 mg. The analysis was carried out in crucibles with Al2O3 with a lid. The VP1 sample was ground in a cryogenic mill to a grain size below 0.2 mm to ensure its homogeneity and proper contact with the bottom of the crucible. In order to eliminate traces of oxygen in the thermal mixer, the OTS (Oxygen Trap System) system was used [33]. The corrections were applied three times to the measurements to compensate for the uncertainty.
- Combustion
The combustion analysis was performed in an argon atmosphere (purity class 5.0, flow 25 mL/min) and synthetic air (purity class 5.0, flow 50 mL/min), from 40 to 1000 °C, with two heating rates of 5 and 20 K/min. The samples were placed in crucibles with Al2O3 without a lid with a mass of approximately 10 ± 0.1 mg in each test. The VP1 sample was also ground in a cryogenic mill to a grain size of less than 0.2 mm [33]. The corrections were applied three times to the measurements to compensate for the measurement uncertainty.
3. Results and Discussion
3.1. Physicochemical Properties of the Sample
An analysis of the fuel properties and elemental composition of the VP1 sample was carried out, and the obtained results can be found in Table 1.

Table 1.
Physicochemical properties of the sample.
The tested sample of the vinyl panels was characterized by a low moisture content below 0.50%. The panel had a high ash content. Sample VP1 was found to have an ash content of 37.33%. The content of volatile particles in the sample was 42.49%. The calorific value of the VP1 sample was in the order of 10.06 MJ/kg. The low calorific value may have resulted from flame-retardant additives and several substances responsible for such properties as non-slip, elasticity, and conductivity [10,12,15]. A low content of total nitrogen and sulfur was noted. The nitrogen content of the tested sample did not exceed 0.15%. In turn, the sulfur content was below 0.29%. A very high chlorine content was found. The chlorine content was recorded in the VP1 sample at 12.61%. Considerable differences in the chlorine content are visible; the chlorine content in panel VP1 is 2–3 times lower than in other PVC-containing wastes. For example, the chlorine content of new and aged cable sheaths was at a level of 34.61–40.67% [7]. According to [42,43], the chlorine content in pure PVC reaches 57%. As is known, PVC contains chlorine which plays a role in chemical stability, e.g., flame retardancy, dual and oil/chemical resistance. On the other hand, chlorine must be removed from the waste PVC as it is harmful to installations and equipment [31]. The carbon content for the VP1 sample was 32.39%. The sample was characterized by a low hydrogen content of less than 1.26%.
3.2. Pyrolysis
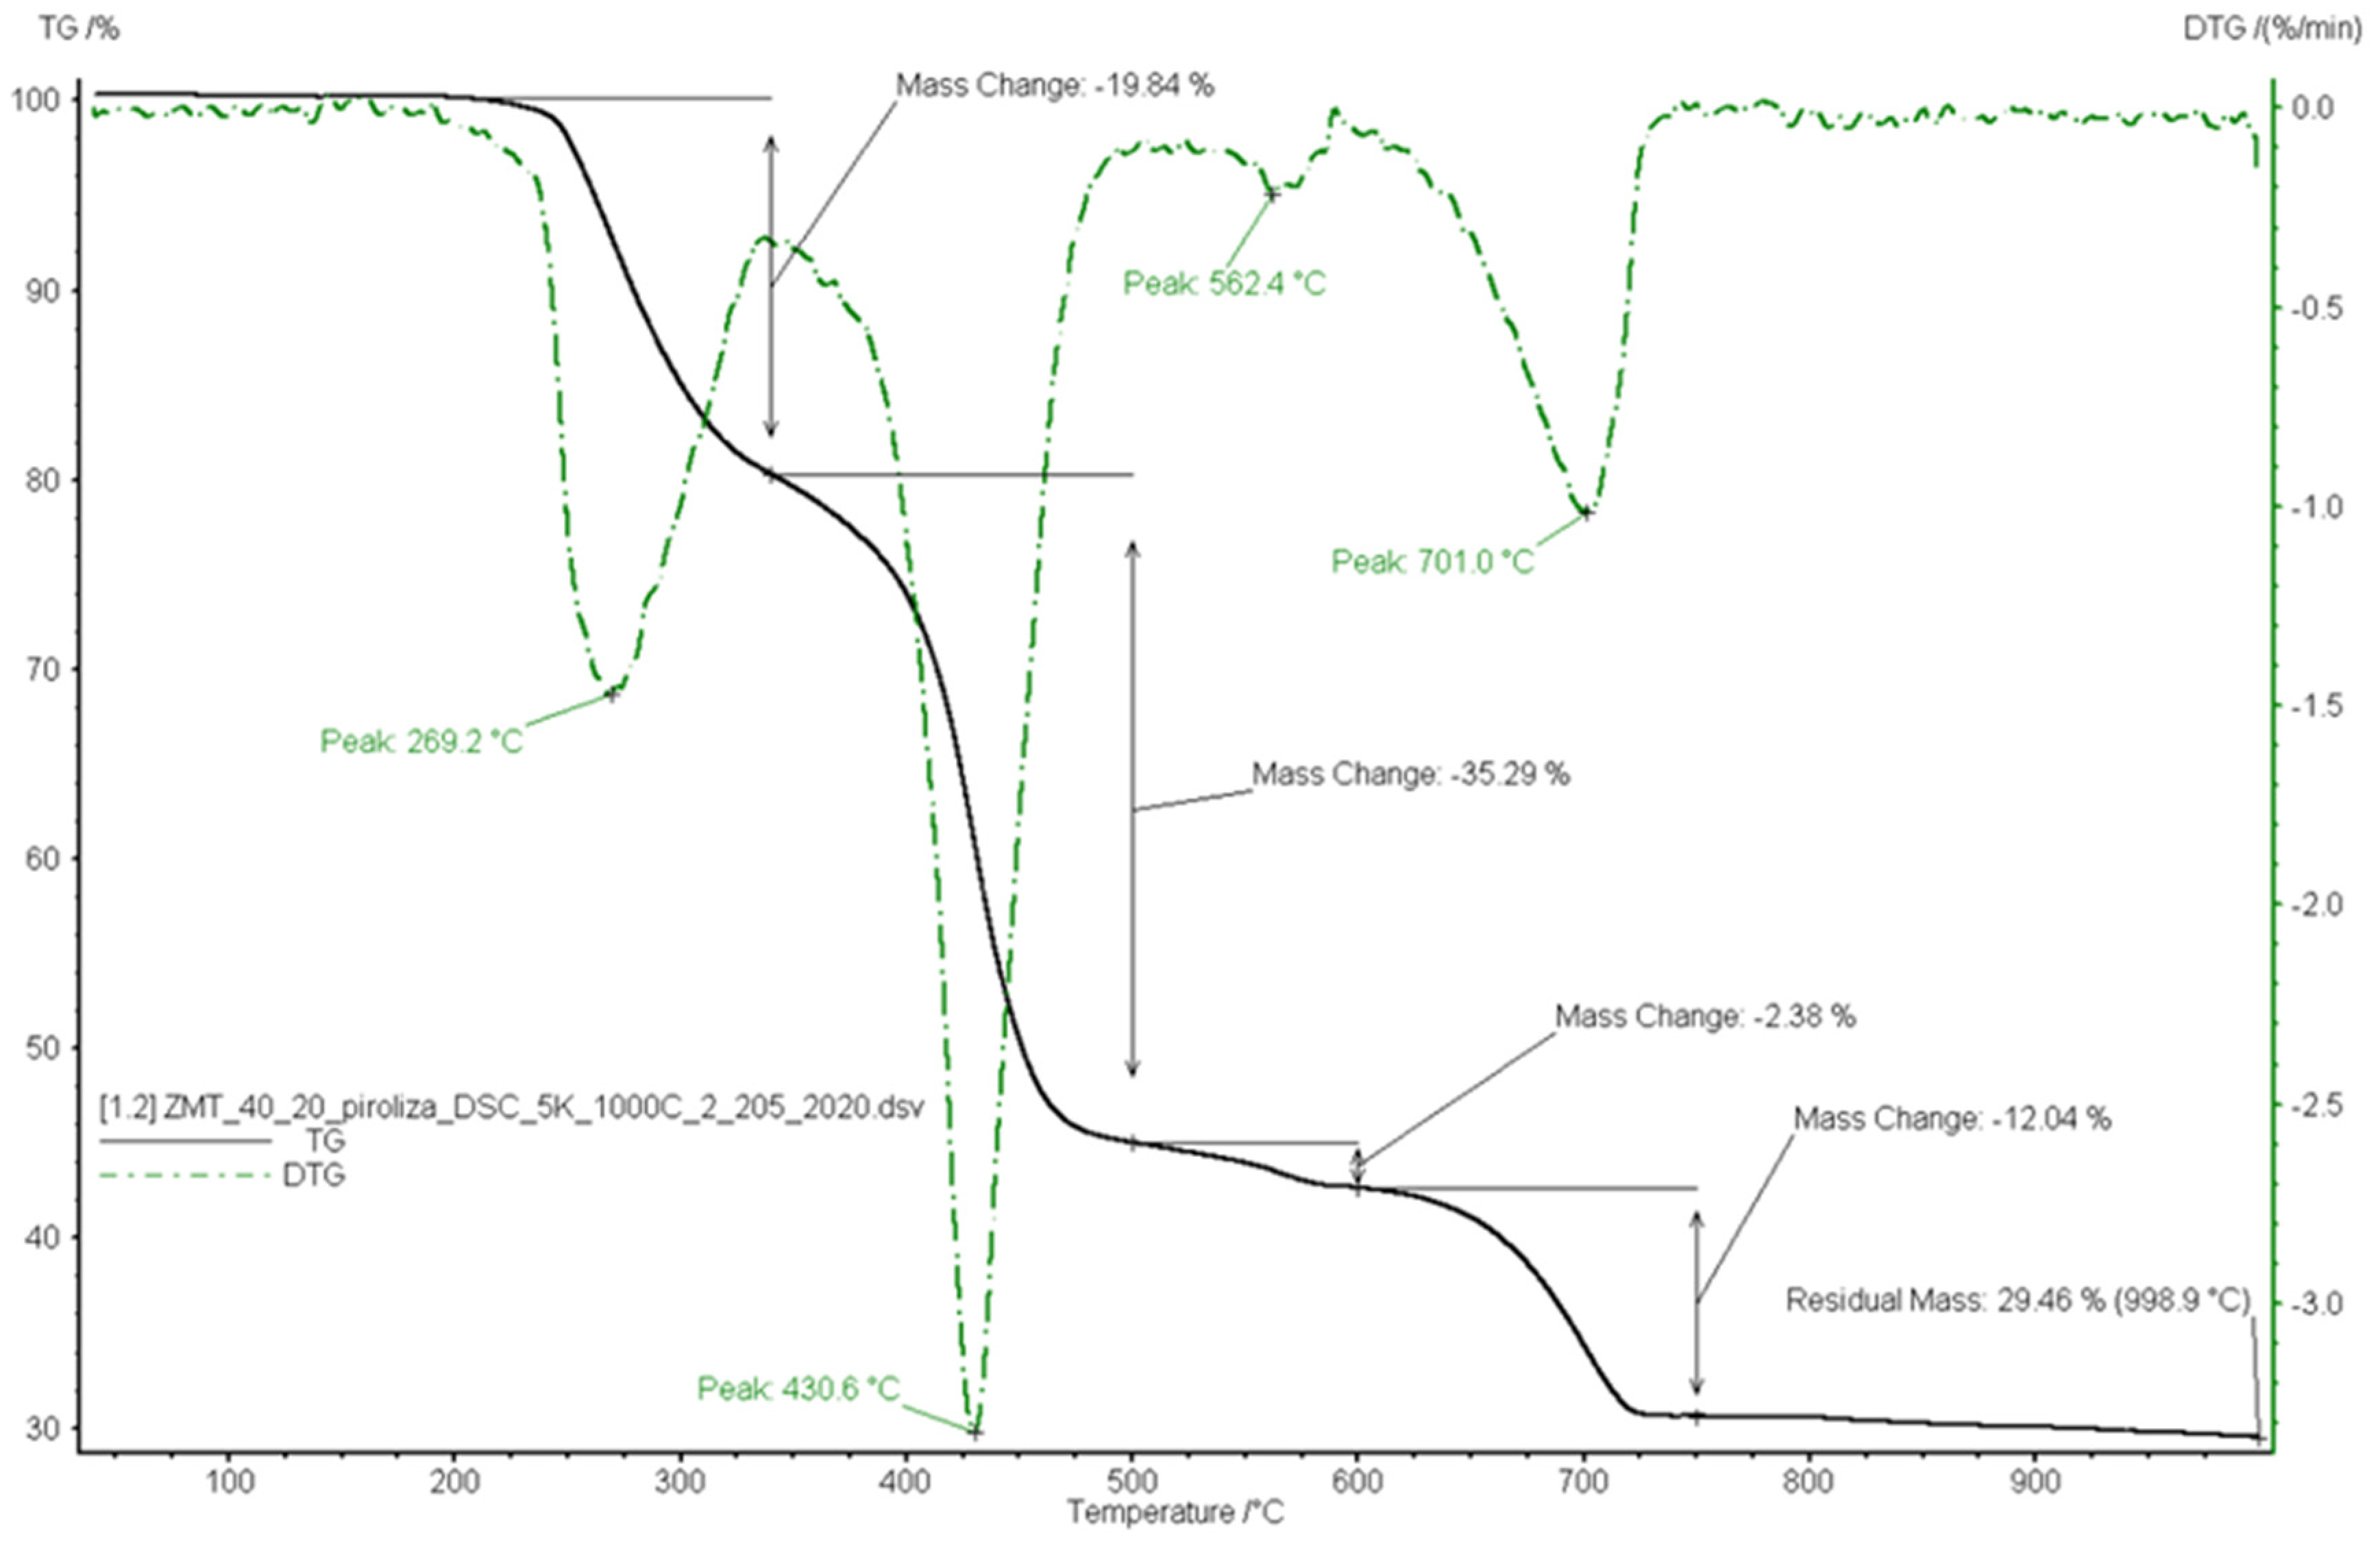
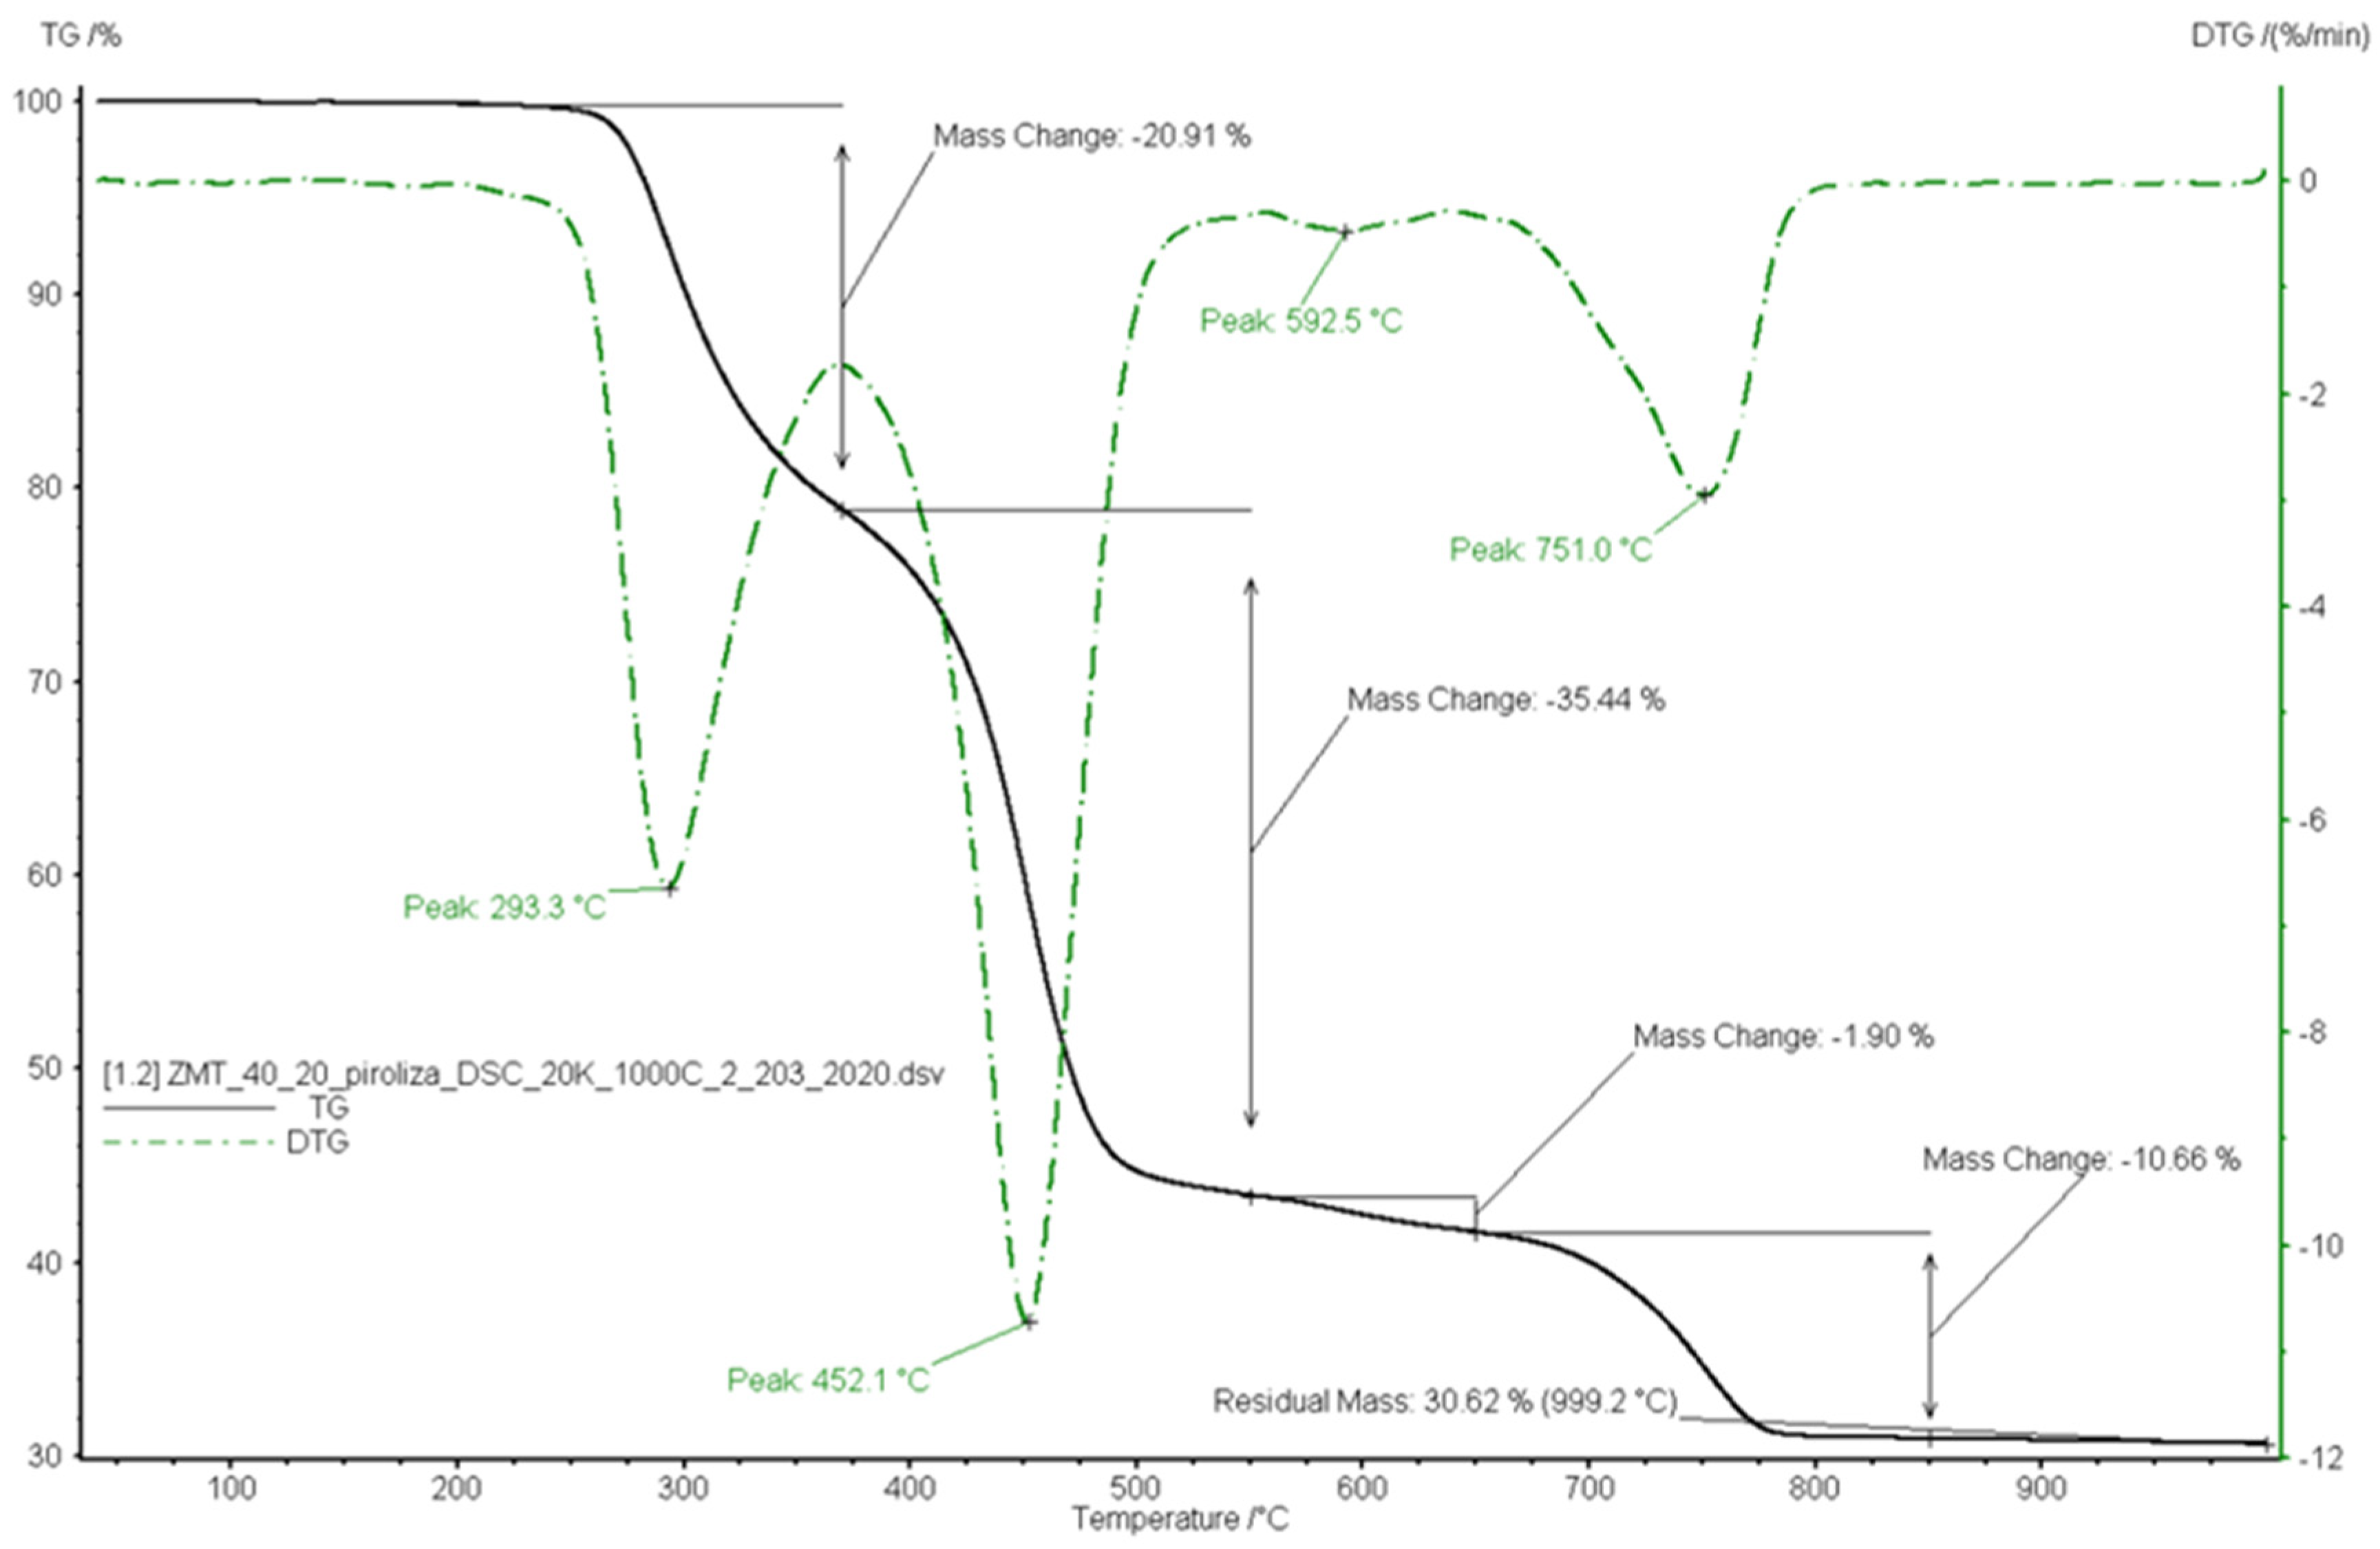
Figure 3 and Figure 4 show the mass loss curves for the VP1 sample. It was found that the VP1 undergoes thermal decomposition in four stages. The first stage ranges from 200 to 340 °C and from 200 to 370 °C 20 K/min. The sample loses about 20 wt% of initial mass at this stage, in the temperature range from 340 to 500 °C for the heating rate of 5 K/min and from 370 to 550 °C for the heating rate of 20 K/min. It has been reported that in the second stage, the sample loses about 35 wt% of the initial mass. In the third stage, in the temperature range of 500 to 600 °C (for the heating rate of 20 K/min from 550 to 650 °C), the sample lost about 2 wt% of its initial mass.
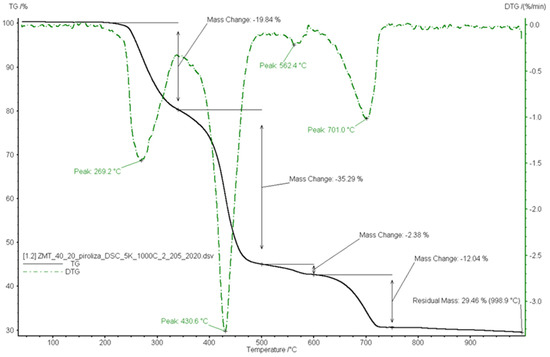
Figure 3.
Thermogravimetric analysis TG/DTG curves of sample VP1-pyrolysis 5 K/min.
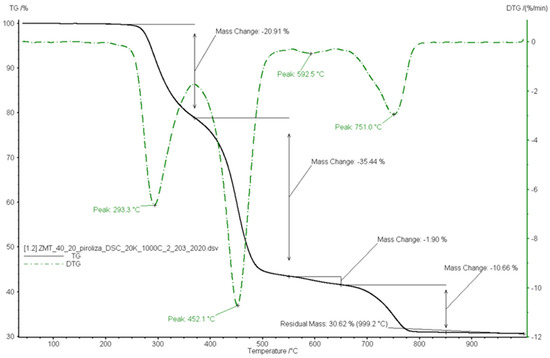
Figure 4.
Thermogravimetric analysis TG/DTG curves of sample VP1-pyrolysis 20 K/min.
In the last stage, occurring above 600 °C (for the heating rate of 20 K/min above 650 °C), the sample loses about 11 wt% of the initial mass. The mass loss is related to gas evolution during the pyrolysis process. The mass of the char after pyrolysis is about 30% by the weight of the initial mass of the sample. The conducted research showed differences in the course of the pyrolysis process. For [7,31,44], the thermal decomposition takes place in 2 stages, There is a temperature shift of the peaks in relation to the VP1 test. In the case of the tested sample, we distinguished four stages of pyrolytic decomposition.
The qualitative tests of the gases released during the pyrolysis process were carried out using the Fourier transform infrared analysis. The spectra were presented in the form of 3D-FTIR plots for the VP1 sample at the heating rate of 5 and 20 K/min in the tested wavenumber range (4000–500 cm−1). The spectra show the changes taking place during pyrolysis, as shown in Figure 5a,b.
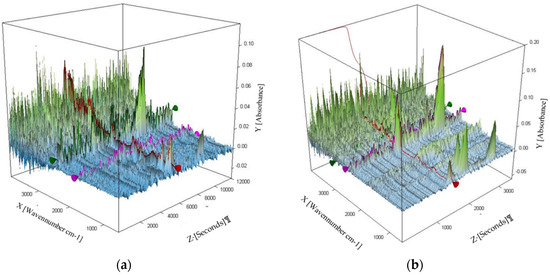
Figure 5.
3D FTIR spectrum recorded during pyrolysis of the sample: (a) for the heating rate of 5 K/min, (b) for the heating rate of 20 K/min.
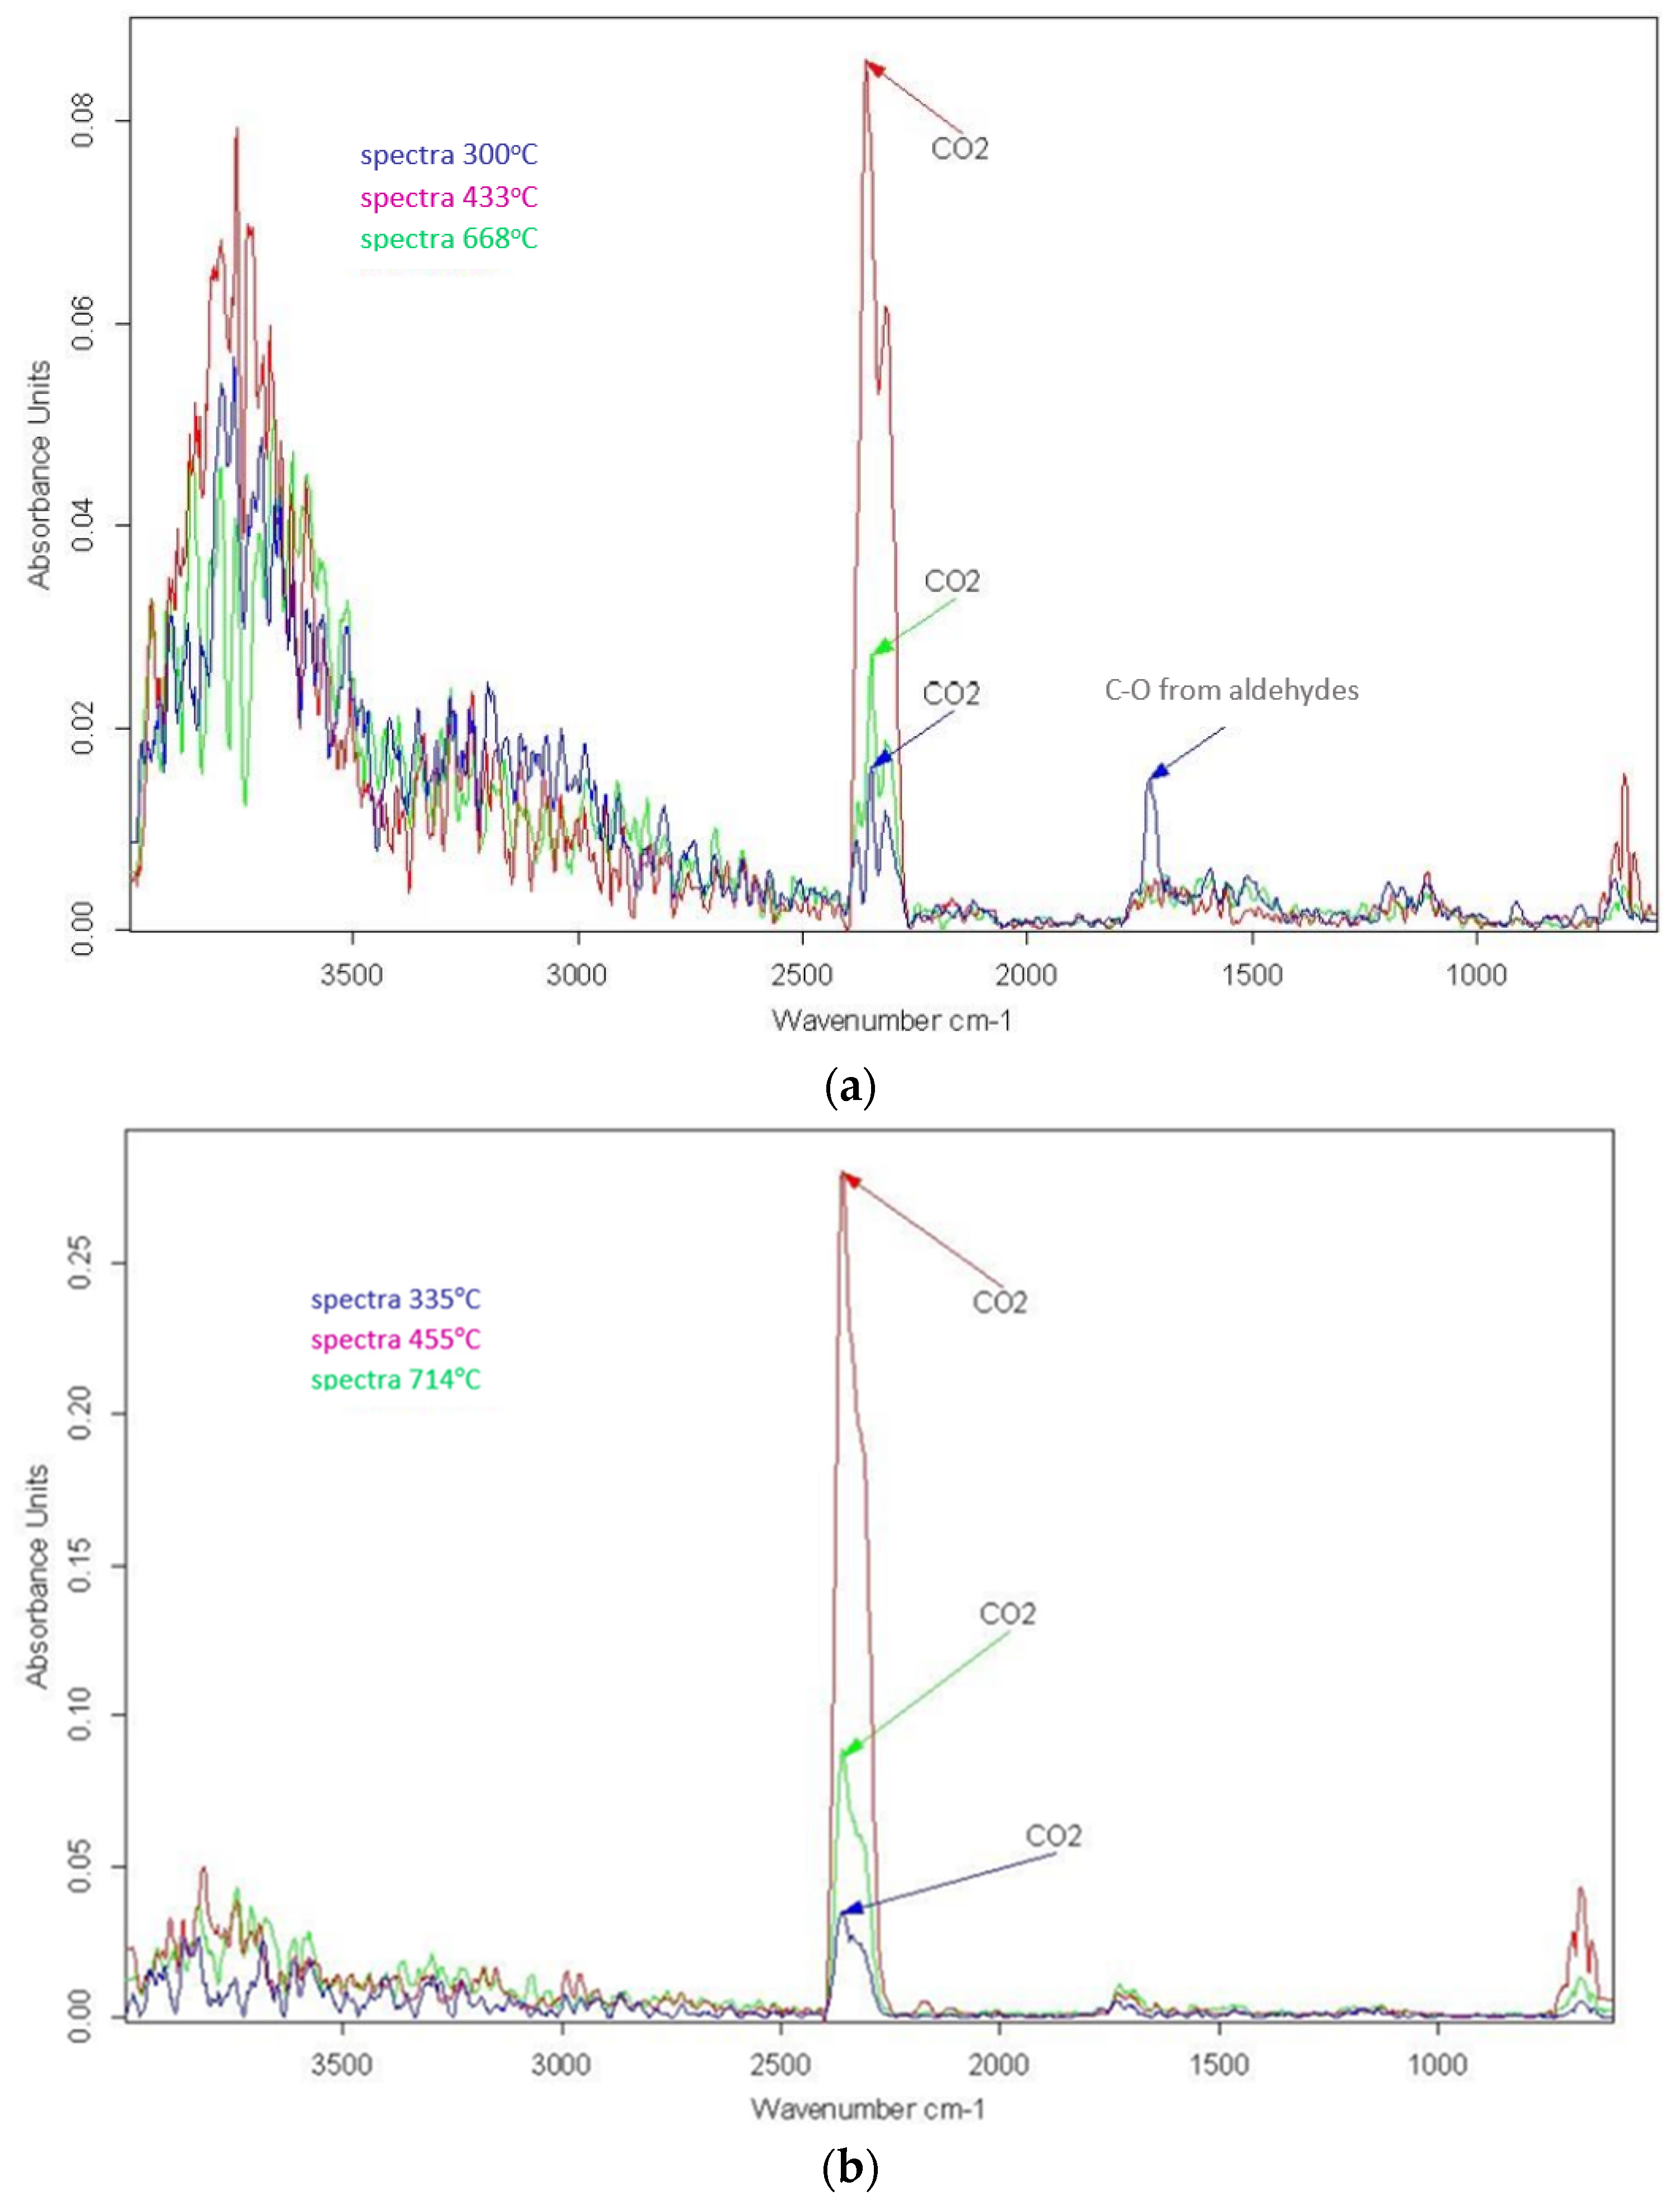
The FTIR spectra of the VP1 panel obtained as a result of the analysis are additionally shown in Figure 6a,b, where selected maxima are marked. These studies were used to extract the FTIR spectra for the maximum gas release rates.
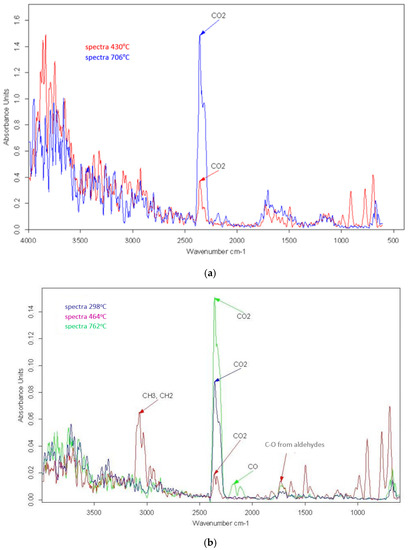
Figure 6.
FTIR spectra recorded at temperatures of the highest emission rate of pyrolysis products at (a) a heating rate of 5 K/min, and (b) a heating rate of 20 K/min.
For the heating rate of 5 and 20 K/min, the presence of bands derived from stretching vibrations, such as CO2, was found, in addition, for the heating rate of 20 K/min, the presence of species that could indicate the presence of compounds that would contain functional groups such as CH3, CH2, C-O from aldehydes. Based on the available literature [7,44,45,46], the following can be additionally concluded. The H2O absorption band for VP1 corresponds to the ranges of 1800–1300 cm−1 and 4000–3500 cm−1 [7,44,45]. The stretching of alkanes C-H was observed at about 2934 cm−1 [44]. The spectrum band of 2400–2260 cm−1 is associated with carbon dioxide (CO2) [7,44]. Hydrochloric acid (HCl) can be noted around 3100–2600 cm−1, while absorption around 850–550 cm−1 is attributed to the stretching vibrations of C-Cl [7,44,45]. The signal at about 1458 cm−1 can be associated with a C-H aliphatic bending bond [44,47], and the band at about 1240 cm−1 with C-H bending near Cl [44,47,48].
Table 2 summarizes the band assignments and wavenumbers for the VP1 sample.
Table 2.
FTIR absorption of sample VP1.
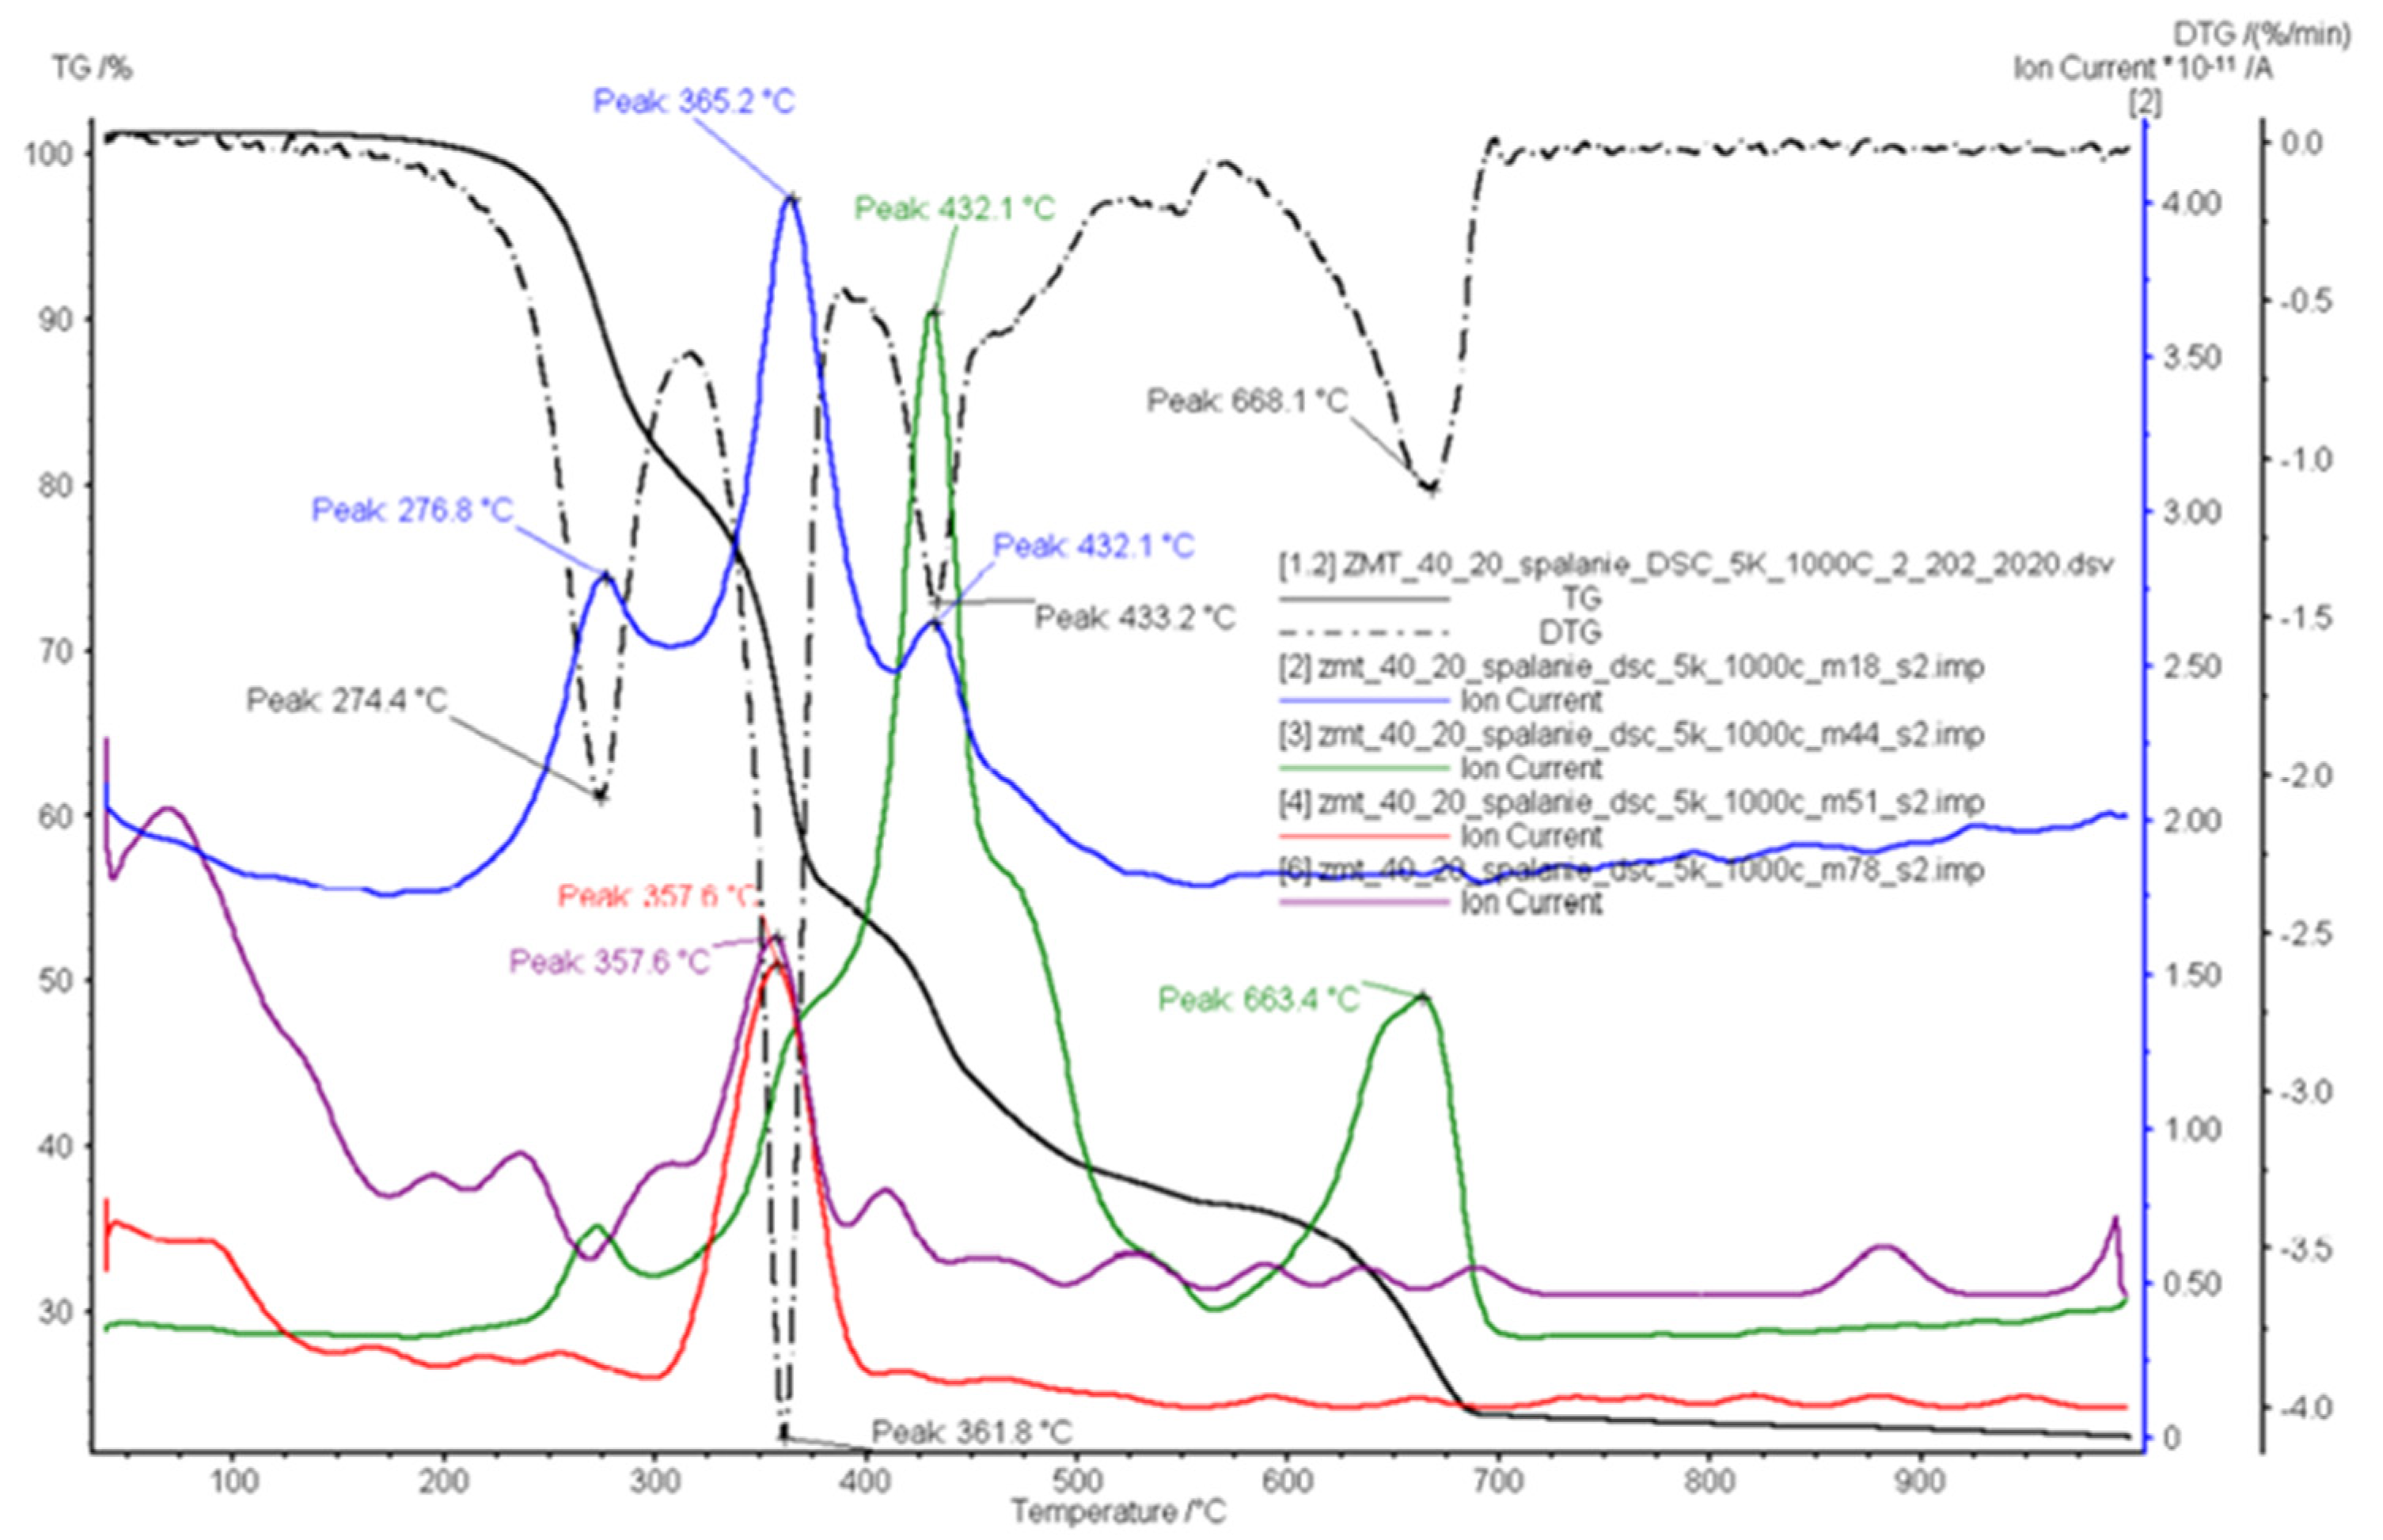
Figure 7 and Figure 8 show the results obtained from the mass spectrometer concerning the the thermal degradation of the VP1 sample in an inert atmosphere.
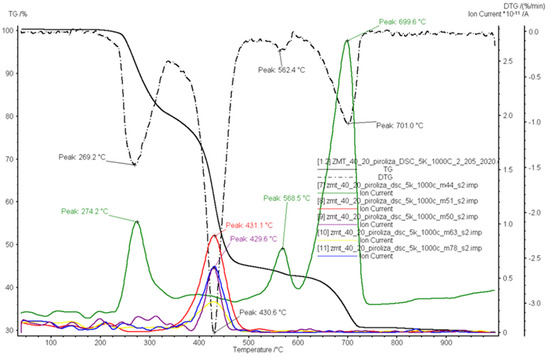
Figure 7.
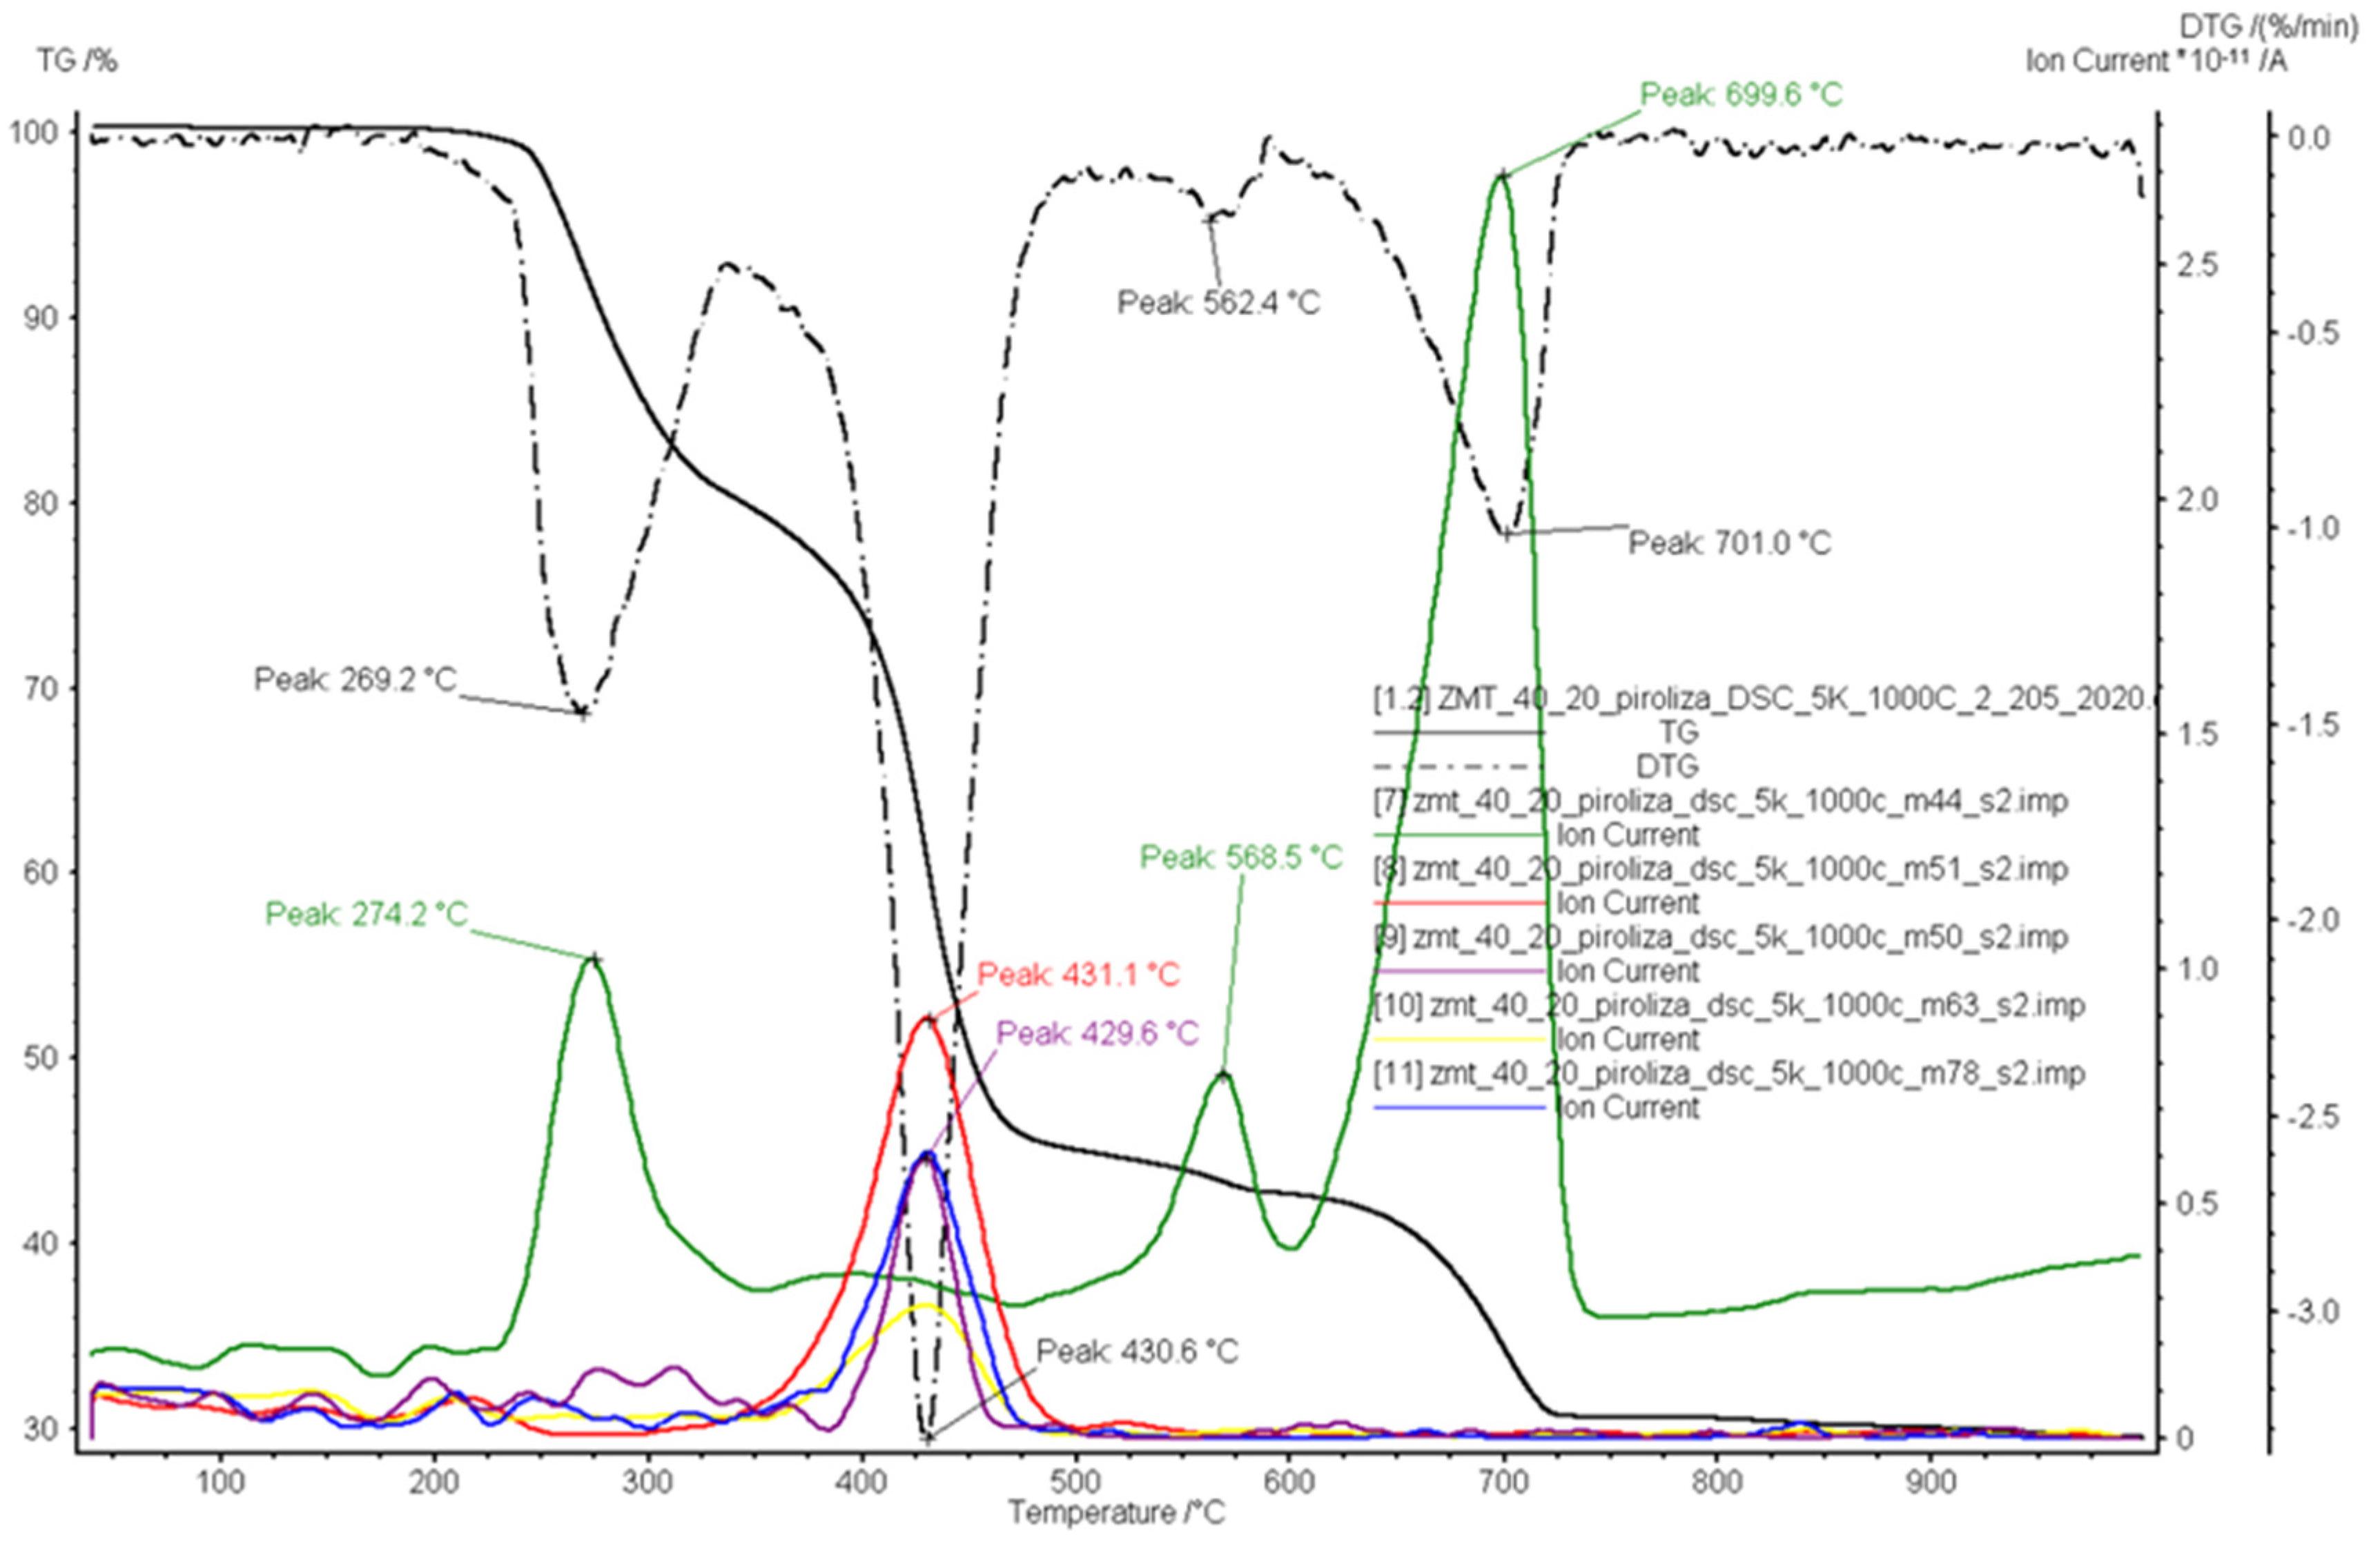
TG and DTG, curves and ion current intensity for the VP1 sample at a 5 K/min heating rate.
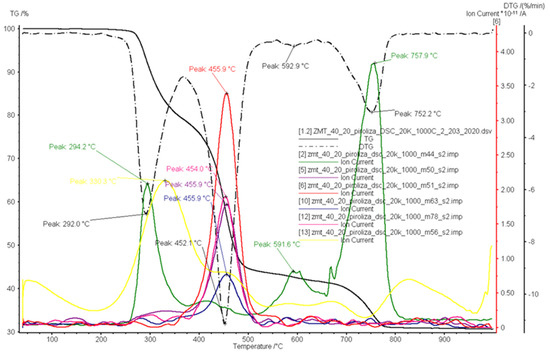
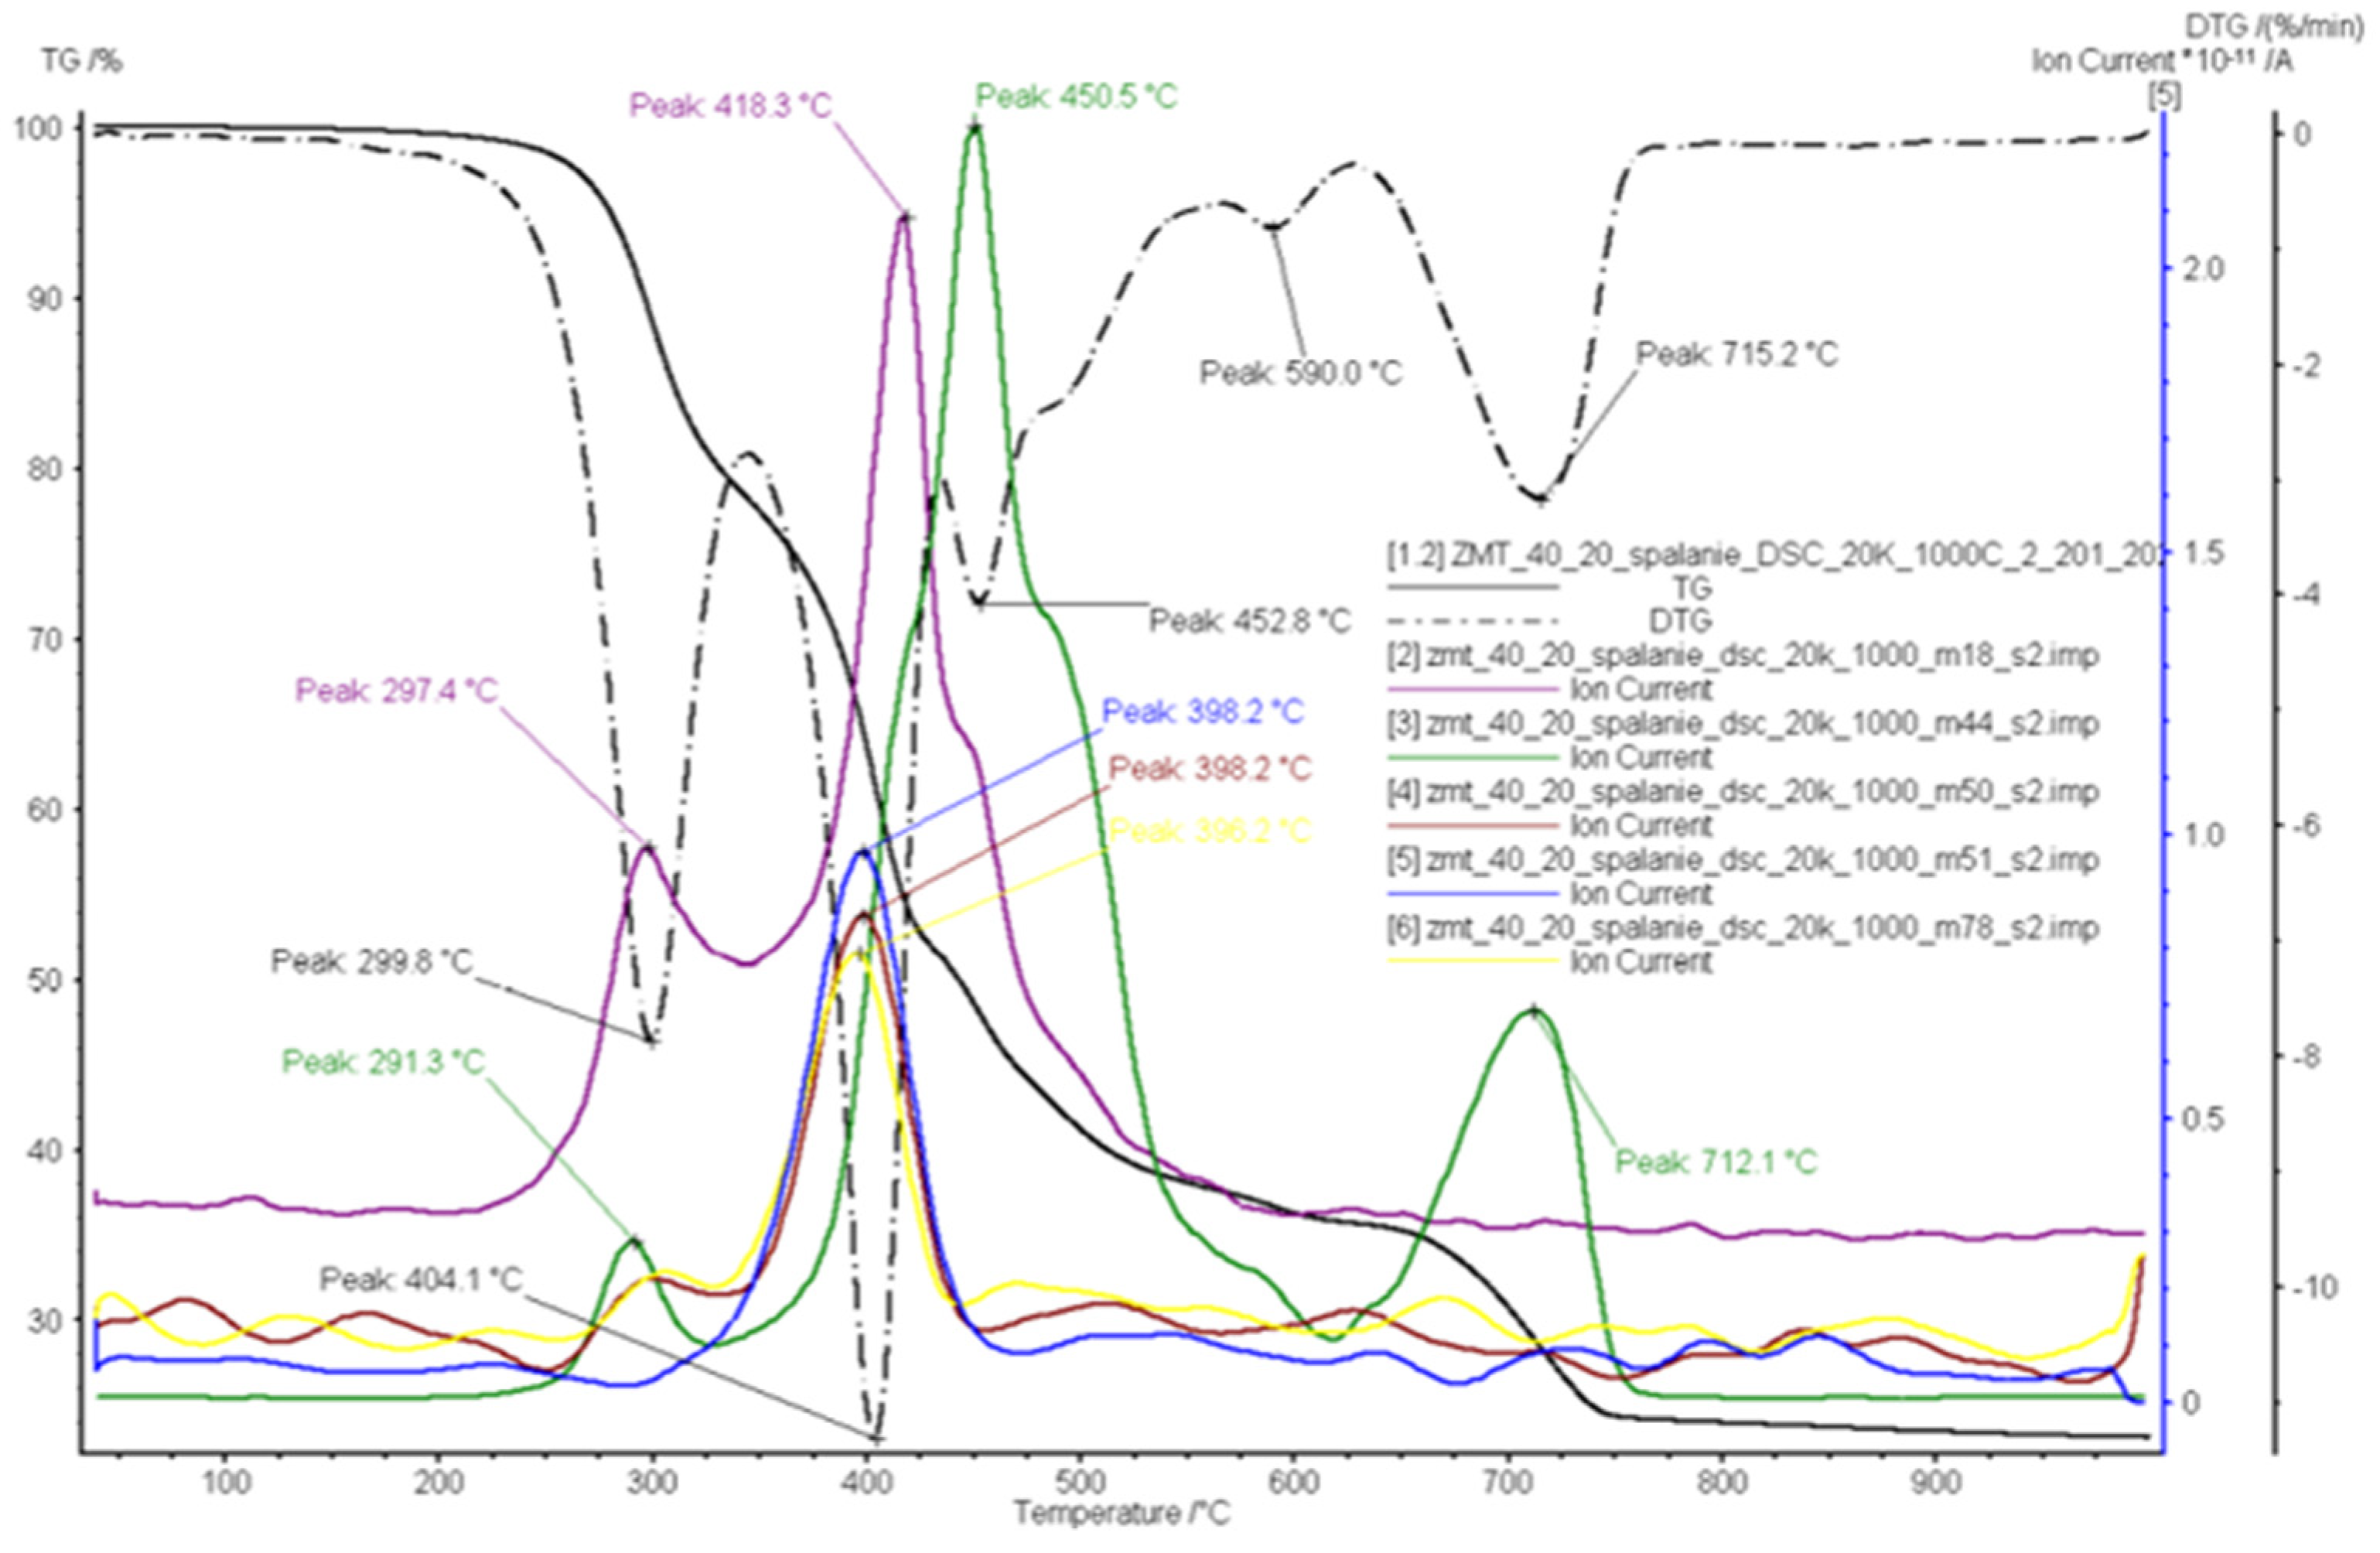
Figure 8.
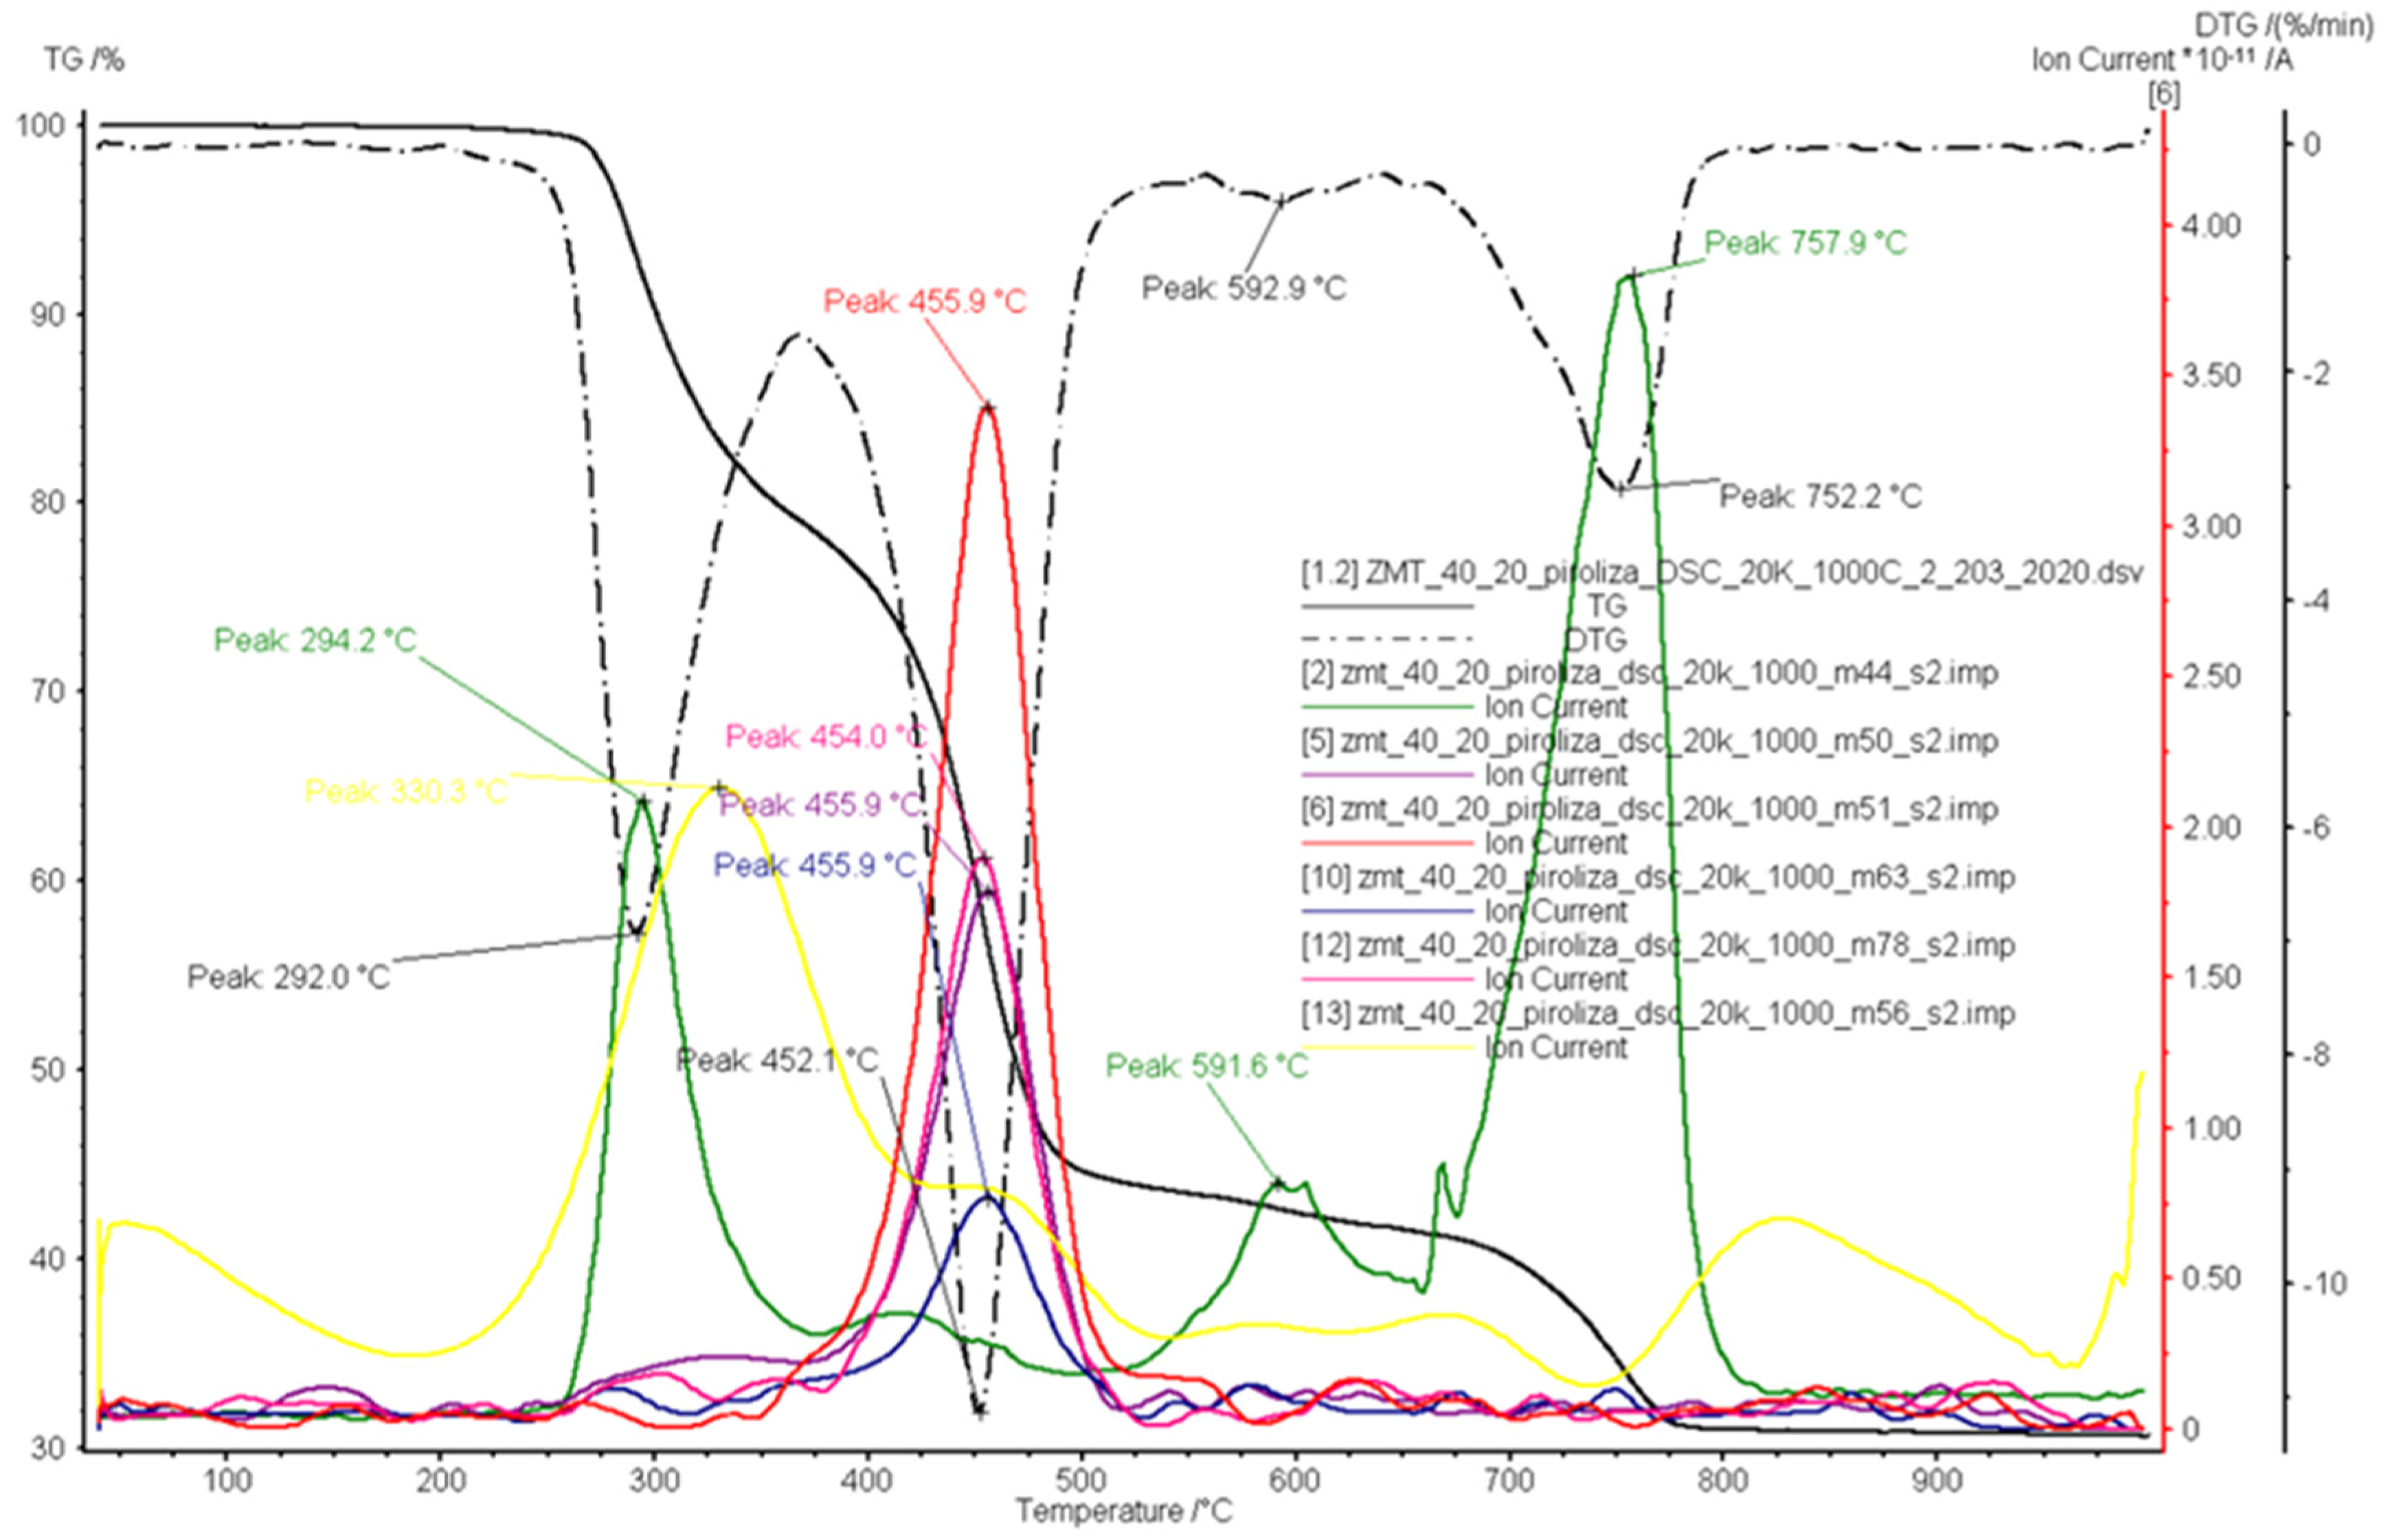
TG and DTG, curves and ion current intensity for the VP1 sample at a 20 K/min heating rate.
The tests showed that the m/z 44 ion signal was CO2/C3H8 [48,49,50], which was confirmed by FTIR analysis. The excerpt of m/z 50 and 51 likely belonged to compounds C, such as 1,3-butadiyne (C4H2), vinylacetylene (C4H4) or 1,3-butadiyne (C4H6). The m/z 63 signal is likely ascribed to the 1,3-cyclopentadiene C5H6 [49,50]. According to [48,49], excerpts of m/z 78 belong to benzene (C6H6). For the heating rate of 20 K/min, the excerpt m/z 56 can also be observed; according to [49,50], it belongs to 1-butene/2-methylpropene(C4H8) or the butyl radical (C4H9).
Based on the ionic signal, the identified substances are summarized in Table 3.
Table 3.
Ion current intensity for the VP1 sample.
3.3. Combustion
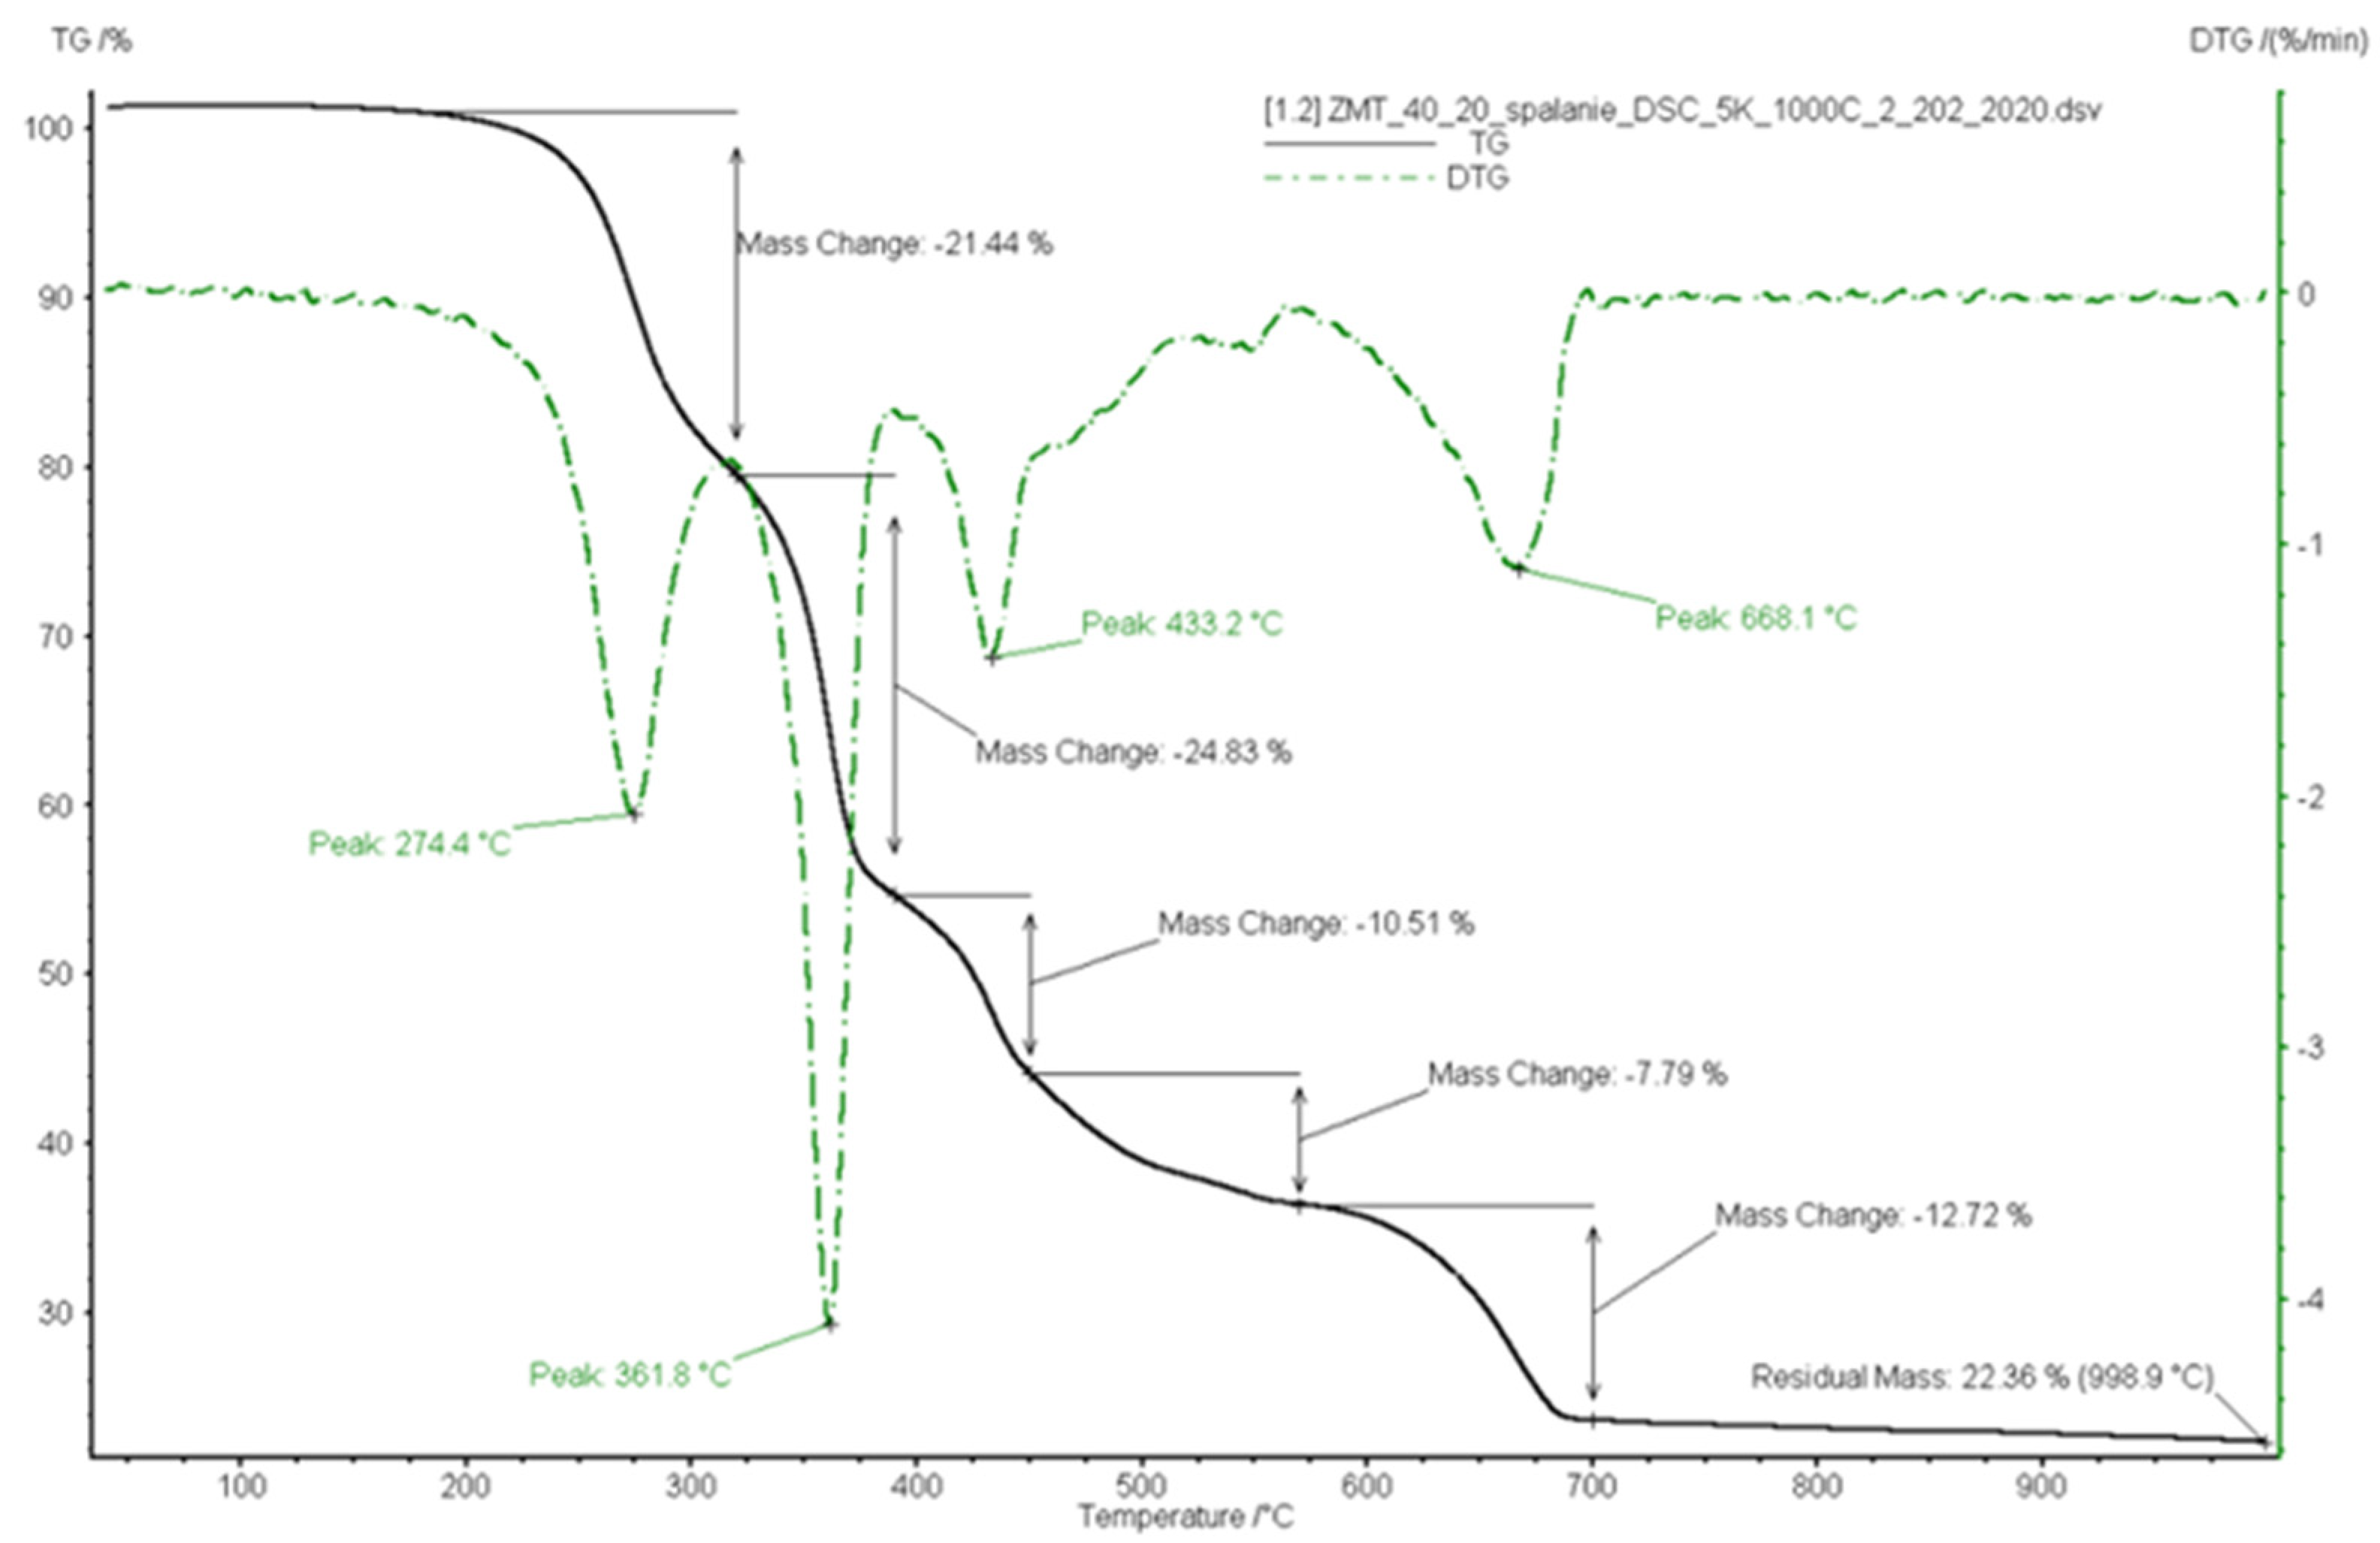
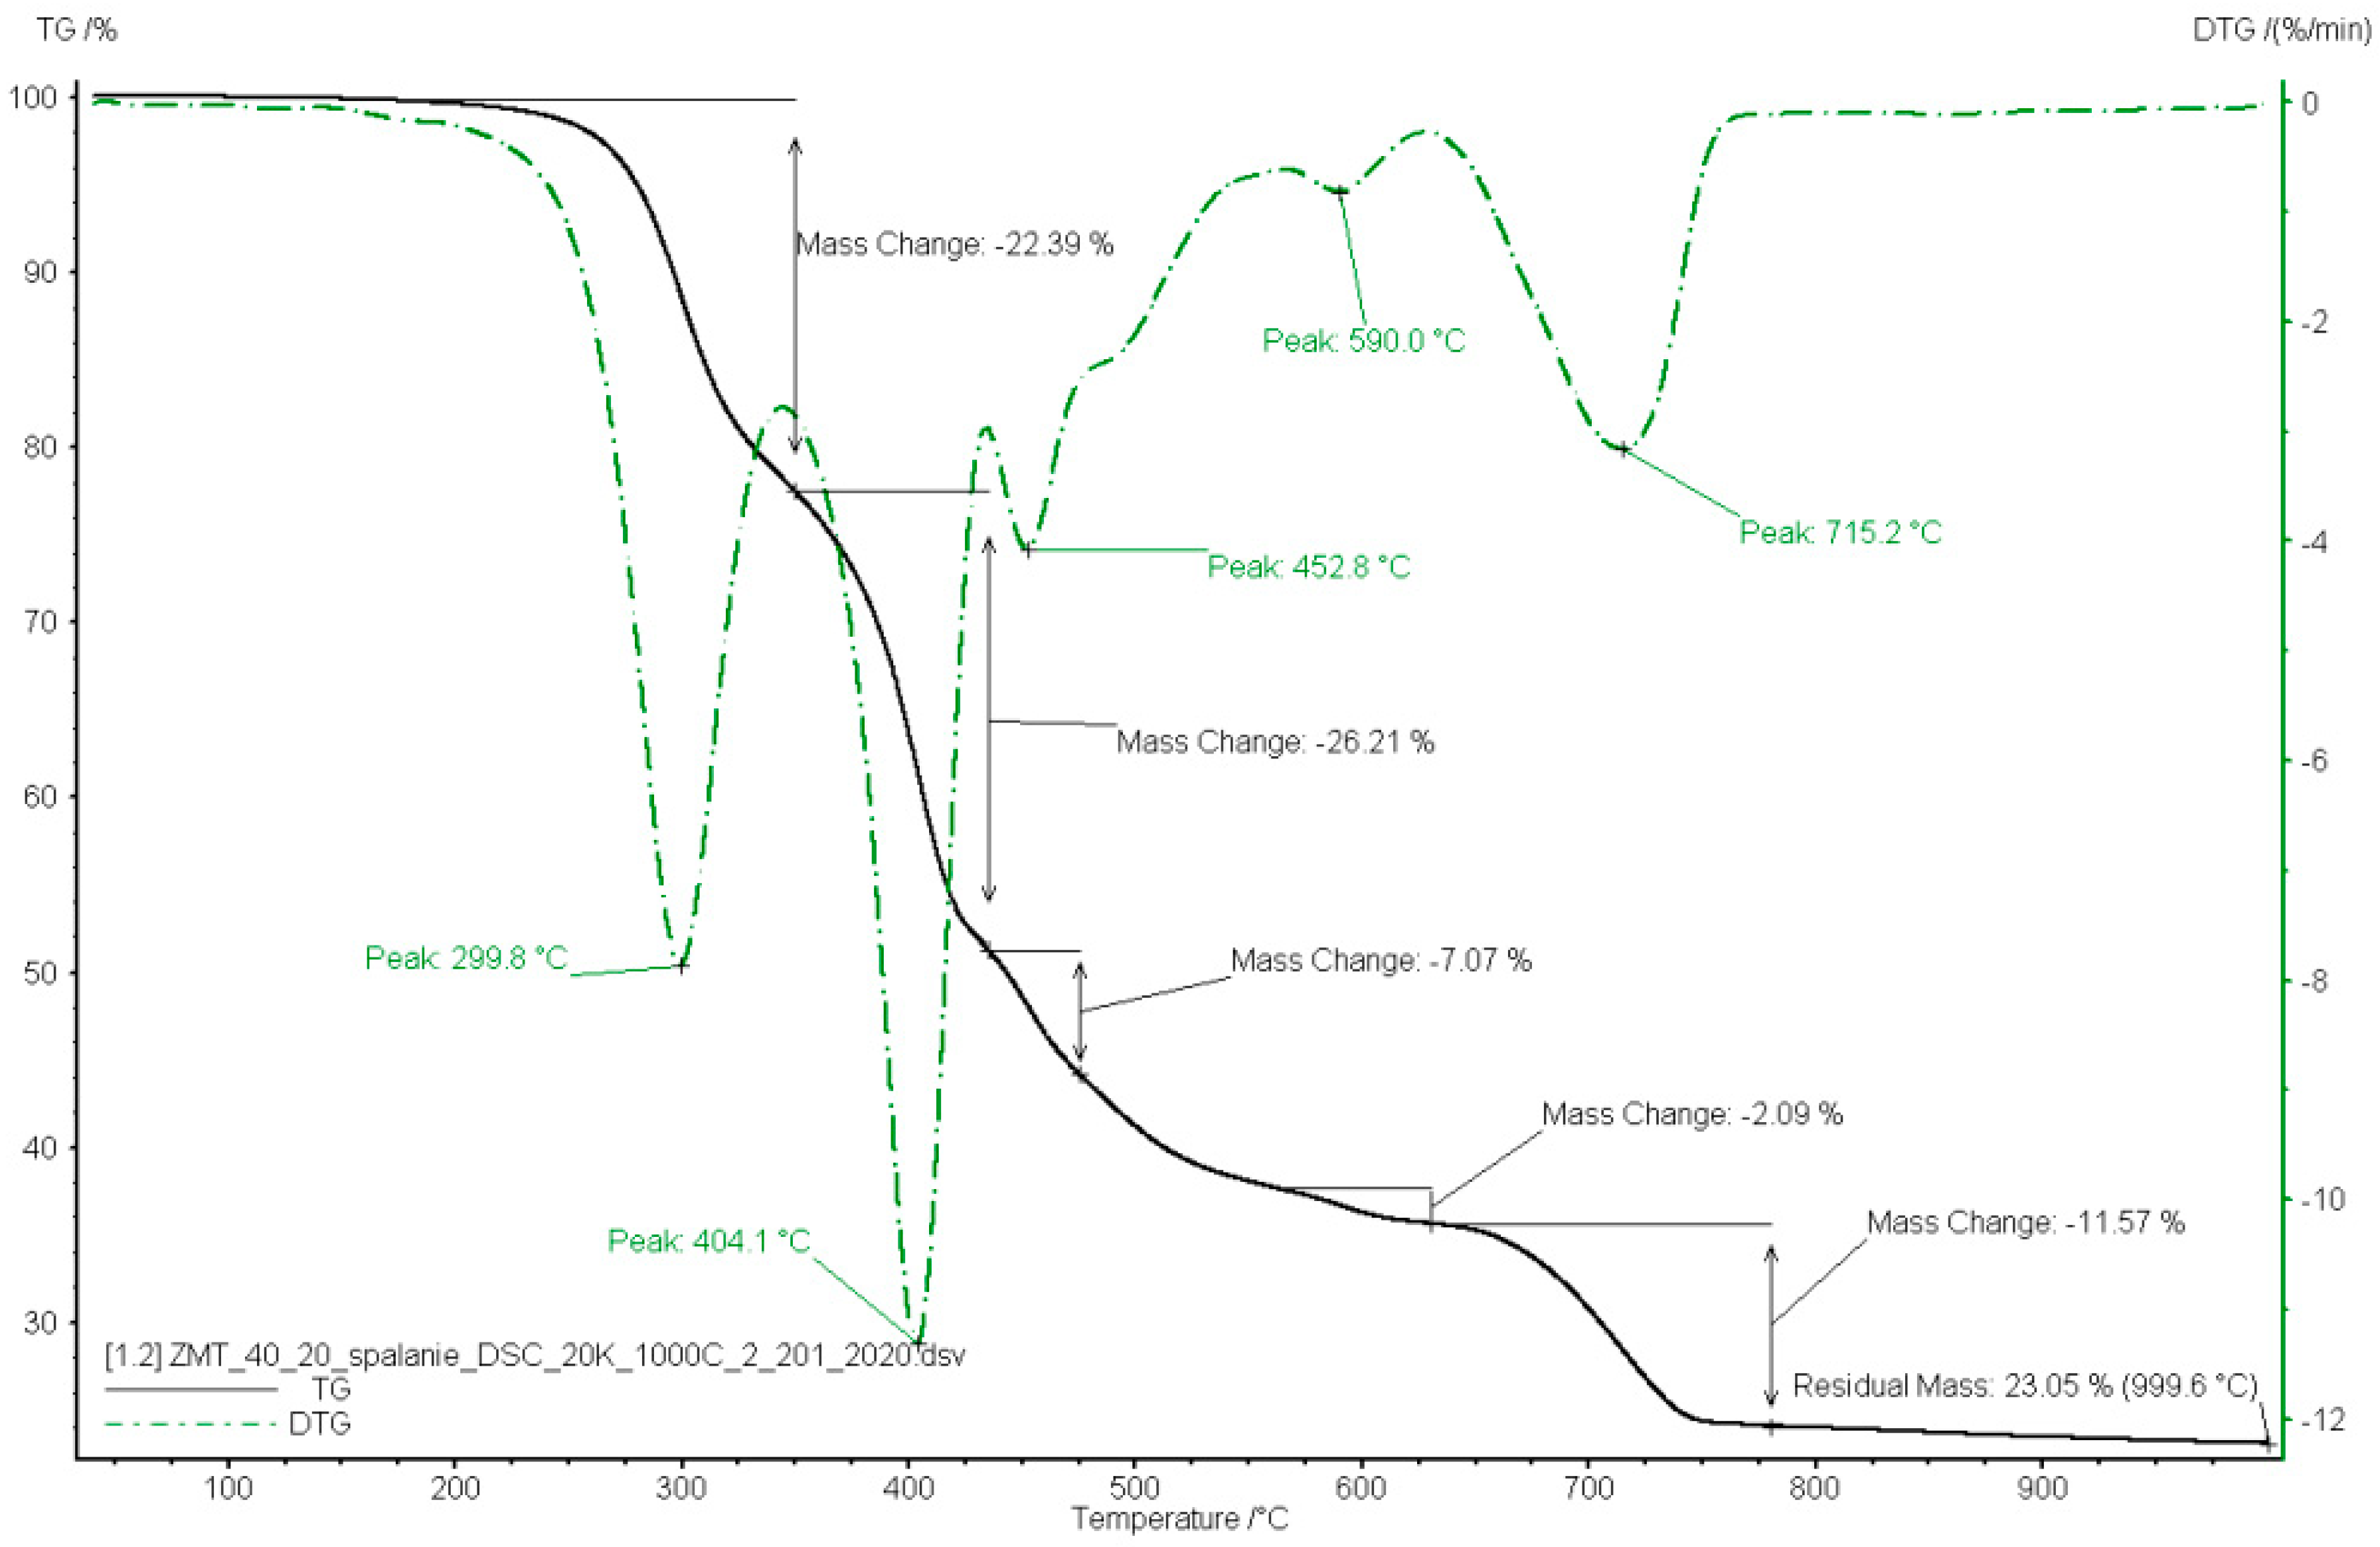
The analysis of Figure 9 and Figure 10 shows that the VP1 sample, unlike the pyrolysis process, burns in 5 stages. The first stage is mass loss due to the evaporation of moisture, for the heating rate of 5 K/min, which takes place at a temperature of 170 to 320 °C, and for the heating rate of 20 K/min at 150 to 350 °C. The sample loses about 22 wt% initial mass. The greatest mass loss of about 25% by weight was recorded in the second step in the temperature range of 320 to 390 °C for the heating rate of 5 K/min and from 350 to 435 °C for a heating rate of 20 K/min. At the third stage, in the temperature range from 390 to 450 °C (for the heating rate of 20 K/min between 435 to 475 °C), the sample loses about 8 wt% initial mass. The fourth stage, the slowest, takes place in the temperature range from 450 to 570 °C for the heating rate of 5 K/min, and for the heating rate of 20 K/min from 435 to 475 °C. The mass loss ranges from 2 to 7% by weight of the initial mass. In the fifth stage, in the temperature range of 570 to 700 °C for the heating rate of 20 K/min from 630 to 780 °C, the sample lost about 12 wt% initial mass. The ash mass remaining after combustion was about 23 wt% of the initial mass of the sample.
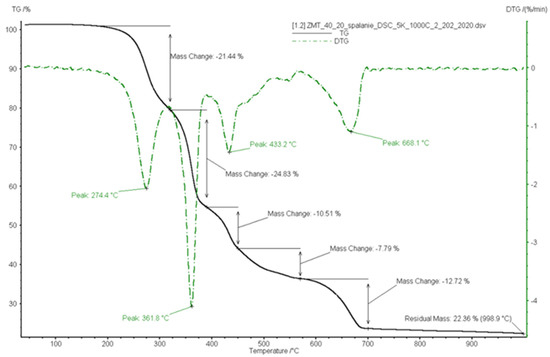
Figure 9.
Thermogravimetric analysis TG/DTG curves of sample VP1—combustion 5 K/min.
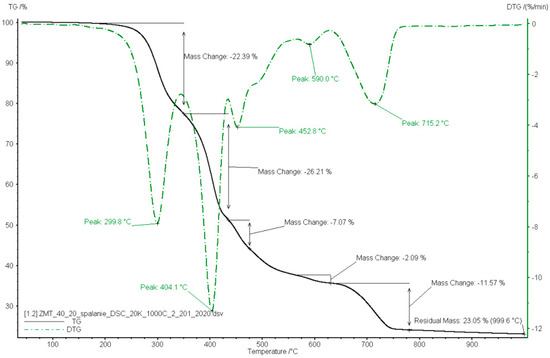
Figure 10.
Thermogravimetric analysis TG/DTG curves of sample VP1—combustion 20 K/min.
Figure 11a,b show the 3D-FTIR spectra of the evolved gases recorded during the combustion of the VP1 sample. Maxima appearing during the combustion process are visible. Figure 12a,b show the spectra recorded in the maximum gas evolution in the VP1 at two heating rates of 5 and 20 K/min. The presence of bands originating from stretching vibrations such as CO2 (2400–2260 cm−1), C-O from aldehydes (1700–1800 cm−1), H2O (4000–3500 cm−1) was found [7,46]. It is presumed that the presence of Cl− containing groups is evidenced by vibration bands 650–550 cm−1 [7,44,51].
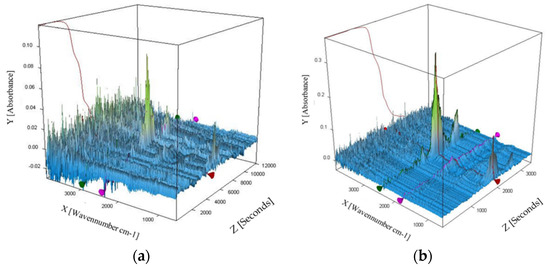
Figure 11.
3D FTIR spectrum recorded during sample combustion: (a) a heating rate of 5 K/min, (b) a heating rate of 20 K/min.
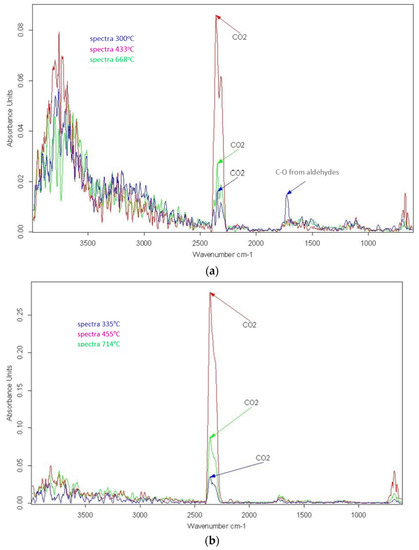
Figure 12.
FTIR spectra recorded at temperatures of the highest emission rate of combustion products for: (a) a heating rate of 5 K/min, (b) a heating rate of 20 K/min.
In addition to the excerpts detected in the inert atmosphere, new fragments were observed in the oxidative atmosphere (Figure 13 and Figure 14) due to the presence of the O2 atom: m/z 18 can be attributed to water (H2O), z/m CO2 to carbon dioxide (CO2) [25,49,50]. Ion peaks during combustion occur in the following temperature ranges: 300–400 °C for m/z 51, 78, for m/z 18 in the range of 250–450 °C and for m/z 44 in the range of 400–700 °C. At the heating rate of 20 K/min, maxima were recorded for m/z 50, 51, 78 in the range of 350–450 °C [25,48,49,50].
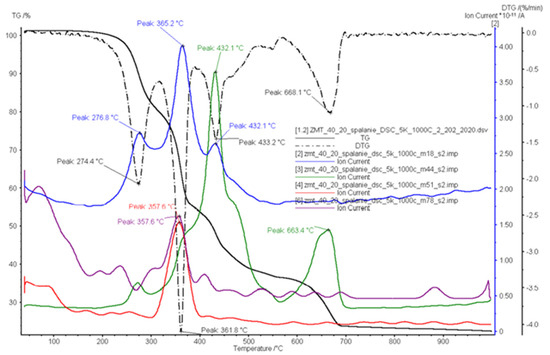
Figure 13.
TG and DTG, curves and ion current intensity for the VP1 sample, a heating rate of 5 K/min.

Figure 14.
TG and DTG, curves and ion current intensity for the VP1 sample, a heating rate of 20 K/min.
Table 4 summarizes the ion signals and the corresponding combustion products.
Table 4.
Ion current intensity for the VP1 sample.
4. Conclusions
Due to the growing popularity of vinyl joinery, issues were discussed related to the possibilities of managing this type of waste by pyrolysis with the recovery of chemical substances.
In the literature, one can find a lot of publications on the pyrolysis and incineration of PVC-based waste. However, they apply to materials such as electric cable sheaths, plastics used in medicine, pipes, old-generation vinyl floors, and pure PVC. There is more and more discussion about the role and place of composite materials, in this case, vinyl panels, in the circular economy. Hence, the idea of conducting research aimed at recognizing the basic properties of vinyl panels and providing data related to their degradation in an oxidizing and inert atmosphere. This knowledge will be used to plan a further experiment.
When looking holistically at the waste management of vinyl panels, the best available techniques should be analyzed. The conducted research allowed for the narrowing down of the optimal and pro-ecological methods for chemical recycling to the pyrolysis process. The choice of the method was dictated by the analysis of the chemical properties of the tested waste (calorific value, impurities related to the material matrix, chlorine content), which will translate into the final product of the process.
Then, the combustion and pyrolysis processes using the TG-MS/FTIR technique were compared. It was found that a relatively low calorific value and high chlorine content can make energy recovery difficult. The research shows that pyrolysis is the appropriate process for the recovery of chemical raw materials, which can be used in the chemical or petrochemical industry. There is considerable potential for vinyl flooring to be used in chemical recycling, considering the circular economy. Research on the use of waste vinyl panels as a sand substitute seems to be equally promising. Knowledge of the mechanisms of pyrolysis and combustion of waste vinyl panels will influence the recycling of this waste and the conversion of energy, which merits further research. The development of the infrastructure is in line with the circular economy and will allow for achieving the goals for recycling levels for the construction sector.
Author Contributions
Conceptualization, M.C. and M.K.-S.; methodology, M.C. and M.K.-S.; validation M.C. and M.K.-S.; formal analysis, M.C. and M.K.-S.; writing—original draft preparation, M.C. and M.K.-S.; writing—review and editing, M.C. and M.K.-S. All authors have read and agreed to the published version of the manuscript.
Funding
Publishing supported by the pro-quality grant. The Silesian University of Technology, 08/030/RGJ21/0088. The publication was funded by a subsidy allocated for 2022 (08/030/BK_22/0101).
Institutional Review Board Statement
Not applicable.
Informed Consent Statement
Not applicable.
Data Availability Statement
Not applicable.
Conflicts of Interest
The authors declare no conflict of interest.
Nomenclature
| TG-MS | thermogravimetry-mass spectrometry |
| DTG | differential thermogravimetry |
| TG-FTIR | thermogravimetry-Fourier transform infrared spectroscopy |
| 3D-FTIR | three-dimensional thermogravimetric analysis-Fourier transform infrared |
| PVC | polyvinyl chloride |
References
- Plastics—The Facts 2019. An analysis of European Plastics Production, Demand and Waste Data. Available online: https://plasticseurope.org/wp-content/uploads/2021/10/2019-Plastics-the-facts.pdf (accessed on 28 July 2021).
- Zhu, H.; Jiang, X.; Yan, J.; Chi, Y.; Cen, K. TG-FTIR analysis of PVC thermal degradation and HCl removal. J. Anal. Appl. Pyrolysis 2008, 82, 1–9. [Google Scholar] [CrossRef]
- Huggett, C.; Levin, B.C. Toxicity of the Pyrolysis and Combustion Products of Poly (Vinyl Chlorides): A Literature Assess-ment. Fire Mater. 1987, 11, 131–142. [Google Scholar] [CrossRef] [Green Version]
- Knümann, R.; Bockhorn, H. Investigation of the Kinetics of Pyrolysis of PVC by TG-MS-Analysis. Combust. Sci. Technol. 1994, 101, 285–299. [Google Scholar] [CrossRef]
- Lee, T.; Oh, J.-I.; Kim, T.; Tsang, D.C.; Kim, K.-H.; Lee, J.; Kwon, E.E. Controlling generation of benzenes and polycyclic aromatic hydrocarbons in thermolysis of polyvinyl chloride in CO2. Energy Convers. Manag. 2018, 164, 453–459. [Google Scholar] [CrossRef]
- Yu, J.; Sun, L.; Ma, C.; Qiao, Y.; Yao, H. Thermal degradation of PVC: A review. Waste Manag. 2016, 48, 300–314. [Google Scholar] [CrossRef] [PubMed]
- Wang, Z.; Wei, R.; Wang, X.; He, J.; Wang, J. Pyrolysis and Combustion of Polyvinyl Chloride (PVC) Sheath for New and Aged Cables via Thermogravimetric Analysis-Fourier Transform Infrared (TG-FTIR) and Calorimeter. Materials 2018, 11, 1997. [Google Scholar] [CrossRef] [PubMed] [Green Version]
- Reynolds, L. Vinyl: The Plastic Found in (Almost) Everything. Available online: https://www.treehugger.com/vinyl-plastic-found-almost-everything-4847568 (accessed on 28 July 2021).
- Vinyl Flooring Market Size, Share & Trends Analysis Report By Product (Vinyl Sheets, Vinyl Tiles, Luxury Vinyl Tiles), By Application (Residential, Commercial), By Region, And Segment Forecasts, 2019–2025. Available online: https://www.grandviewresearch.com/industry-analysis/vinyl-flooring-market (accessed on 28 July 2021).
- Czy Podłogi Winylowe Można Poddać Recyklingowi? 2021. Available online: Pl.EcoBuilderz.com (accessed on 4 November 2021).
- McKeen, L. Introduction to Plastics and Polymers. In The Effect of Sterilization Methods on Plastics and Elastomers, 4th ed.; William Andrew, an imprint of Elsevier: Oxford, UK, 2018; pp. 41–61. [Google Scholar]
- Gilbert, M.; Patrick, S. Poly(Vinyl Chloride). In Brydson’s Plastics Materials, 8th ed.; William Andrew, an imprint of Elsevier: Oxford, UK, 2017; pp. 329–388. [Google Scholar]
- Chaudhary, B.; Liotta, C.; Cogen, J.; Gilbert, M. Plasticized PVC. Ref. Modul. Mater. Sci. Mater. Eng. 2016. [Google Scholar] [CrossRef]
- Biron, M. Recycling Plastics: Advantages and Limitations of Use. In A Practical Guide to Plastics Sustainability; William Andrew, an imprint of Elsevier: Oxford, UK, 2020; pp. 411–467. [Google Scholar]
- Shrivastava, A. Additives for Plastics. In Introduction to Plastics Engineering; Elsevier: Oxford, UK, 2018; pp. 111–141. [Google Scholar] [CrossRef]
- BASF. We create chemistry. Available online: https://www.kongrespolskachemia.pl/files/84723514/basffactsheet-chemcyclingengot-2pl_1.pdf (accessed on 31 January 2022).
- Communication from the Commission to the European Parliament, the Council, the European Economic And Social Committee and the Committee of the Regions a European Strategy for Plastics in a Circular Economy COM/2018/028 final. Available online: https://op.europa.eu/en/publication-detail/-/publication/2df5d1d2-fac7-11e7-b8f5-01aa75ed71a1/language-en (accessed on 4 November 2021).
- Sobiecka, E. Thermal and physicochemical technologies used in hospital incineration fly ash utilization before landfill in Poland. J. Chem. Technol. Biotechnol. 2016, 91, 2457–2461. [Google Scholar] [CrossRef]
- Ciuła, J.; Kozik, V.; Generowicz, A.; Gaska, K.; Bak, A.; Paździor, M.; Barbusiński, K. Emission and Neutralization of Methane from a Municipal Landfill-Parametric Analysis. Energies 2020, 13, 6254. [Google Scholar] [CrossRef]
- Kicińska, A.; Caba, G. Leaching of Chlorides, Sulphates, and Phosphates from Ashes Formed as a Result of Burning Conventional Fuels, Alternative Fuels, and Municipal Waste in Household Furnaces. Energies 2021, 14, 3936. [Google Scholar] [CrossRef]
- Kosa, B.; Kicińska, A.; Filipowicz, M.; Dudek, M.; Olkuski, T.; Styszko, K. Coal from the waste disposal site of the Siersza mine (Trzebinia, Poland) and its properties as a possible alternative fuel. E3S Web Conf. 2016, 10, 39. [Google Scholar] [CrossRef] [Green Version]
- Ustawa o odpadach (Dz. U. 2013 poz. 23 z póz. zm). Available online: http://prawo.sejm.gov.pl/isap.nsf/DocDetails.xsp?id=WDU20130000021 (accessed on 26 July 2021).
- Zeller, M.; Netsch, N.; Richter, F.; Leibold, H.; Stapf, D. Chemical Recycling of Mixed Plastic Wastes by Pyrolysis—Pilot Scale Investigations. Chem. Ing. Tech. 2021, 93, 1763–1770. [Google Scholar] [CrossRef]
- Beneš, M.; Milanov, N.; Matuschek, G.; Kettrup, A.; Plaček, V.; Balek, V. Thermal degradation of PVC cable insulation studied by simultaneous TG-FTIR and TG-EGA methods. J. Therm. Anal. 2004, 78, 621–630. [Google Scholar] [CrossRef]
- Jaworski, T.; Kajda-Szcześniak, M. Research on the Kinetics of Pyrolysis of Wood-Based Panels in Terms of Waste Management. Energies 2019, 12, 3705. [Google Scholar] [CrossRef] [Green Version]
- Aboulkas, A.; El Harfi, K. Co-pyrolysis of olive residue with poly(vinyl chloride) using thermogravimetric analysis. J. Therm. Anal. Calorim. 2009, 95, 1007–1013. [Google Scholar] [CrossRef]
- Czégény, Z.; Jakab, E.; Bozi, J.; Blazsó, M. Pyrolysis of wood—PVC mixtures. Formation of chloromethane from lignocellulosic materials in the presence of PVC. J. Anal. Appl. Pyrol. 2015, 113, 123–132. [Google Scholar] [CrossRef] [Green Version]
- Zhou, H.; Long, Y.; Meng, A.; Li, Q.; Zhang, Y. Interactions of three municipal solid waste components during co-pyrolysis. J. Anal. Appl. Pyrolysis 2015, 111, 265–271. [Google Scholar] [CrossRef]
- Bittencourt, P.R.S.; Scremin, F. Evolved Gas Analysis of PE:PVC Systems Thermodegradation Under Inert and Oxidizing Atmosphere. J. Polym. Environ. 2019, 27, 612–617. [Google Scholar] [CrossRef]
- Xiu, F.-R.; Lu, Y.; Qi, Y. DEHP degradation and dechlorination of polyvinyl chloride waste in subcritical water with alkali and ethanol: A comparative study. Chemosphere 2020, 249, 126138. [Google Scholar] [CrossRef]
- Nozue, K.; Tagaya, H. Chemical recycling of waste Poly Vinyl Chloride (PVC) by the liquid-phase treatment. J. Mater. Cycles Waste Manag. 2021, 23, 489–504. [Google Scholar] [CrossRef]
- Senhadji, Y.; Siad, H.; Escadeillas, G.; Benosman, A.S.; Chihaoui, R.; Mouli, M.; Lachemi, M. Physical, mechanical and thermal properties of lightweight composite mortars containing recycled polyvinyl chloride. Constr. Build. Mater. 2019, 195, 198–207. [Google Scholar] [CrossRef]
- Jaworski, T.; Kajda-Szcześniak, M. Study on the Similarity of the Parameters of Biomass and Solid Waste Fuel Combustion for the Needs of Thermal Power Engineering. Sustainability 2020, 12, 7894. [Google Scholar] [CrossRef]
- PN-EN 15934:2013-02; Determination of Moisture Content. Available online: https://sklep.pkn.pl/pn-en-15934-2013-02p.html (accessed on 1 July 2021).
- PN-EN ISO 21656:2021-08; Solid Secondary Fuels—Determination of Ash Content. Available online: https://sklep.pkn.pl/pn-en-iso-21656-2021-08e.html (accessed on 1 July 2021).
- PN-G-04516:1998; Solid Fuels—Determination of Volatile Matter Content. Available online: https://sklep.pkn.pl/pn-g-04516-1998p.html (accessed on 1 July 2021).
- PN-ISO 1928:2020-05; Solid Fuels—Determination of Combustion Heat in a Calorimetric Bomb and Calculation of Calorific Value. Available online: https://sklep.pkn.pl/pn-iso-1928-2020-05e.html (accessed on 1 July 2021).
- PN-G-04523:1992; Solid Fuels—Determination of Nitrogen Content by the Kjeldahl Method. Available online: https://sklep.pkn.pl/pn-g-04523-1992p.html (accessed on 1 July 2021).
- PN-EN 15407:2011; Methods for the Determination of Carbon (C), Hydrogen (H) and Nitrogen (N) Content. Available online: https://www.en-standard.eu/une-en-15407-2011-solid-recovered-fuels-methods-for-the-determination-of-carbon-chydrogen-h-and-nitrogen-n-content/ (accessed on 1 July 2021).
- PN-ISO 334:1997; Determination of Sulphur with the Eschki Method. Available online: https://sklep.pkn.pl/pn-iso-334-1997p.html (accessed on 1 July 2021).
- PN-ISO 587:2000; Determination of Chloride Using the Eschki Mixture. Available online: https://sklep.pkn.pl/pn-iso-587-2000p.html (accessed on 1 July 2021).
- Miranda, R.; Yang, J.; Roy, C.; Vasile, C. Vacuum pyrolysis of PVC I. Kinetic study. Polym. Degrad. Stab. 1999, 64, 127–144. [Google Scholar] [CrossRef]
- Miranda, R.; Yang, J.; Roy, C.; Vasile, C. Vacuum pyrolysis of commingled plastics containing PVC I. Kinetic study. Polym. Degrad. Stab. 2001, 72, 469–491. [Google Scholar] [CrossRef]
- Wang, C.; Liu, H.; Zhang, J.; Yang, S.; Zhang, Z.; Zhao, W. Thermal degradation of flame-retarded high-voltage cable sheath and insulation via TG-FTIR. J. Anal. Appl. Pyrolysis 2018, 134, 167–175. [Google Scholar] [CrossRef]
- Rajendran, S.; Uma, T. Conductivity studies on PVCrPMMA polymer blend electrolyte. Mater. Lett. 2000, 44, 242–247. [Google Scholar] [CrossRef]
- Gao, N.; Li, A.; Quan, C.; Du, L.; Duan, Y. TG–FTIR and Py–GC/MS analysis on pyrolysis and combustion of pine sawdust. J. Anal. Appl. Pyrolysis 2013, 100, 26–32. [Google Scholar] [CrossRef]
- Singh, R.; Pant, D. Polyvinyl chloride degradation by hybrid (chemical and biological) modification. Polym. Degrad. Stab. 2016, 123, 80–87. [Google Scholar] [CrossRef]
- Feng, J.; Hao, J.; Du, J.; Yang, R. Using TGA/FTIR TGA/MS and cone calorimetry to understand thermal degradation and flame retardancy mechanism of polycarbonate filled with solid bisphenol A bis(diphenyl phosphate) and montmorillonite. Polym. Degrad. Stab. 2012, 97, 605–614. [Google Scholar] [CrossRef]
- Qin, L.; Han, J.; Zhao, B.; Wang, Y.; Chen, W.; Xing, F. Thermal degradation of medical plastic waste by in-situ FTIR, TG-MS and TG-GC/MS coupled analyses. J. Anal. Appl. Pyrolysis 2018, 136, 132–145. [Google Scholar] [CrossRef]
- Han, J.; Li, W.; Liu, D.; Qin, L.; Chen, W.; Xing, F. Pyrolysis characteristic and mechanism of waste tyre: A thermogravimetry-mass spectrometry analysis. J. Anal. Appl. Pyrolysis 2018, 129, 1–5. [Google Scholar] [CrossRef]
- Anthony, G.M. Kinetic and chemical studies of polymer cross-linking using thermal gravimetry and hyphenated methods. Degradation of polyvinylchloride. Polym. Degrad. Stab. 1999, 64, 353–357. [Google Scholar] [CrossRef]


Publisher’s Note: MDPI stays neutral with regard to jurisdictional claims in published maps and institutional affiliations. |
© 2022 by the authors. Licensee MDPI, Basel, Switzerland. This article is an open access article distributed under the terms and conditions of the Creative Commons Attribution (CC BY) license (https://creativecommons.org/licenses/by/4.0/).