Review

The Impact of Water Hammer on Hydraulic Power Units

1
Faculty of Mechanical Engineering, University Politehnica Timişoara, Blvd. Mihai Viteazu, No. 1, 300222 Timişoara, Romania
2
Institut de Recherche d’Hydro-Québec (IREQ), 1800 boul. Lionel-Boulet, Varennes, QC J3X 1S1, Canada
3
Center for Fundamental and Advanced Technical Research, Romanian Academy–Timişoara Branch, Blvd. Mihai Viteazu, No. 24, 300223 Timişoara, Romania
4
Département de Génie Industriel, École D’ingénierie, Université du Québec à Trois-Rivières, C.P. 500, Trois-Rivières, QC G9A 5H7, Canada
*
Author to whom correspondence should be addressed.
Energies 2022, 15(4), 1526; https://doi.org/10.3390/en15041526
Submission received: 10 December 2021 / Revised: 26 January 2022 / Accepted: 10 February 2022 / Published: 18 February 2022

Abstract

:
Water hammer influences the life cycle of hydraulic passages and may even cause catastrophic structural failures. Several catastrophic failures of hydraulic power units have been reported in the literature due to the effects of transient regimes. The objective of the study is to highlight the global trend in water hammer assessment and to quantify the effect of factors influencing overpressure in hydraulic passages during load rejection in different hydropower plants. A brief and concise literature review is conducted to document the parameters associated with the water hammer phenomenon and to thereby identify the necessary prerequisites to validate theoretical and numerical results against experimental data. The purpose of the analysis is to identify extreme transient loads on hydraulic passages in order to properly adapt hydropower unit operation, to make recommendations for design and industry, and to guide the progress of adapted models and numerical simulations to capture complex phenomena. Empirical correlations are determined based on the experimental data that are transferable from one unit to another, even if a deep flow analysis is performed. The experimental results confirm that the rapid closure rate of the guide vanes has a significant impact on the phenomenon. A third order polynomial equation is applied to capture the general overpressure trends. Equation parameters change from case to case depending on the type of hydraulic power unit, closing rate and the type of hydraulic passage. The results confirm also that overpressure values depend significantly on other factors, some of which are not usually taken into account (e.g., runner speed). Experimental correlations make it possible to understand the water hammer phenomenon, which could help not just assessing and optimizing loads, but also verifying and validating more complex physical models, to ensure that hydraulic passages are reliable. A well-documented analysis also makes it possible to optimize equipment design, improve and adapt maintenance programs and to recommend appropriate operating parameters to increase equipment lifespan, while preventing incidents.

1. Introduction

In recent times, with the advent of different types of renewable energy, Hydraulic Power Units (HPUs) are often solicited to equilibrate the grid because of a lack of availability and flexibility of these new energy sources. Demand on the electrical network has changed significantly as a result. HPUs are increasingly required to provide flexible operation to regulate and balance the grid, according to March [1].
Dreyer et al. [2] note that it is essential to identify and estimate Hydraulic Passage (HYP) additional loads caused by HPU operation in transient zones. The interactions between the HPU and the HYP, which delimits the water path crossing the turbine runner, will be considered the link between HPU operating mode and the impact on the HYP aging process. More extreme HPU operating conditions will result in additional water hammer and pressure fluctuations, leading to a premature degradation of the HYP structure.
Quaranta et al. [3] state that around 50% of all hydropower plants (HPP) worldwide were commissioned more than 40 years ago. The modernization of hydropower fleets is a strategic goal leading to several benefits in terms of power generation, flexibility and safety operation. Quaranta et al. [3] enumerate several strategies to contribute to HPP modernization. It is estimated that overall energy generation could be increased by 8.4% for the European Union and 9.4% for the whole of Europe by implementing the strategies enumerated. A particular strategy called “t-strategy: start and stop improvement” mentioned in Quaranta et al. [3] is relevant for our analysis. This strategy makes it possible to increase annual operating hours, e.g., by reducing outages and maintenance, reducing manual operation activities and increasing automatized ones (by implementing digitalization), improving operation under transient conditions and reducing the duration of a start and stop cycle. The issues debated in this review paper contribute to the “t-strategy: start and stop improvement” in hydropower fleet modernization.
The research goal is to determine and estimate the additional HYP loadings caused by different HPU operating modes. The research question will be: what is the influence of the HPU-induced transient stresses induced by (for normal or accidental operating mode) HYP degradation? To answer the main research question requires answering a few specific questions: (i) what are the extreme stresses on HYP for different HPU types (Francis, Kaplan, propeller) and different HYP types (long/short, external/buried, low/high head, etc.) during HPU operation or other maneuvers, e.g., protection sequences, maintenance, tests; (ii) how does each solicitation type participate in HYP degradation?
The main objective of this study is to identify a global trend in water hammer assessment, to quantify the effect of factors influencing the phenomenon and to review their influence on HPU operation. By analyzing extreme HYP transient conditions, we want to guide the progress of adapted models and numerical simulations. This makes it possible to develop a tailored operation mode for a particular HPU, as well as recommendations for design and industry. Water hammer-related theoretical developments and numerical simulations used to investigate incidents induced by HYP-transient operating conditions over a span of more than a century are summarized in Section 2. Then, in situ experimental investigations performed to determine the influence of wicket gate closing rates on overpressure, the temporal evolution of the main factors, the influence of the second slope during the closing procedure, overpressure in the closing sequence from no-load speed and during speed adjustment are presented in Section 3. Several (catastrophic) accidents that have occurred over time in the operation of hydropower plants due to transient phenomena are summarized in Section 4. The correlation between maximum overpressure values and wicket gate closure is discussed in Section 5. Several recommendations are included in this section. Finally, conclusions and perspectives are proposed in the last section.

2. The Water Hammer Phenomenon—Literature Review

A water hammer is a hydraulic shock wave that generates a pressure surge when the flow is forced to stop or change direction suddenly. The HPG (wicket gates or other shut-off devices) causes the water hammer in the HPP and the HYP will undergo the effects. The main parts of a hydropower plant are shown in Figure 1 according to Henry [4].
In HYP, a water hammer may occur during normal HPU operation: (1) HPU emergency sequences (load rejections, rapid closure); (2) HPU starting protocol or rapid closing sequence from speed-no-load while unit goes to normal shutdown; (3) ramps to follow setpoint fluctuations in operation or during speed/frequency regulation; (4) travel or operation in transient areas or other maneuver sequences; (5) unit emergency shutdown by protections or under governor control; and (6) uncontrolled closure of the main inlet valve. Water hammers in hydropower plants are principally caused by one or a combination of the following factors: (1) wicket gate rapid closure rate—tBAF; (2) turbine runner in runaway; and (3) pressure oscillations inside the HYP.
The water hammer phenomenon is well documented in the literature, from the simplistic theories used in the design stage at the turn of the century, to the current numerical models and simulations. The intention of the present analysis is to document the other contributing factors in the phenomenon in order to formalize their influence. The identified factors will be used to ameliorate and develop the existing mathematical models.
The concept considered for the literature review is HYP longevity and the measurements of the overpressure generated by HPU operation and their impact. The key words used were water hammer, turbine transient, load rejection, commissioning hydropower generator, turbine runner model, spiral case, penstock and others. The objective of the literature review is to identify the independent variables linked to the HYP lifespan, retained as a dependent variable.
Concerns are related to the water hammer date from ancient times, even before the phenomenon had a name. The first approaches date back to the first century B.C., when Marcus Vitruvius Pollio [5] notes in his work “The Ten Books on Architecture” the impact of the water hammer on the lead pipes and stone tubes of the Roman public water network and recommends some measures to reduce damages. In time, hydraulics became an applied science, so during the XIX century and earlier, scientists from various fields conducted a wide variety of experiments and published articles related to fluid mechanics. In the meantime, theorists developed the general principles of hydrodynamics [6]. Some of them investigated the water hammer phenomenon as Menabrea [7], Michaud [8], Johannes von Kries [9], Joukowsky [10]. At that time, direct references to HPU were quite rare [9] and the analyzed models were generic, meaning that flow stopper or fluid path particularities were not necessarily taken into account. The analysis of the contributions in that period is performed by Tijsseling et al. [11,12,13]. The benefit and limitation of this basic theory is examined by Walters and Leishear [14].
Then, with the occurrence of the first major accidents due to water hammer, concerns in the field are enhanced in the hydroelectric industry. In the early XX century, Bouchayer [15,16], De Sparre [17,18,19,20] and Camichel et al. [21,22] state some simplistic theories used to design HYPs. Then, Allievi [23] takes a structured and scientific approach to the phenomenon, also making recommendations to avoid hazards related to water hammers. Next, the theory is developed by Parmakian [24] from the existing to current classic numerical models and simulations. According to Ramos and Almeida [25,26], the runner in overspeed acts like a dynamic orifice, inducing a variable pressure loss.
Concerning water hammer, Selz [27] notes that overpressure is a safety issue regarding compliance with the maximum allowable working pressure, which must be updated to the possibly degraded status of the HYP. The lifespan of steel-lined HYP (e.g., penstocks, lined pressure tunnels, shafts, spiral casings) is known to be diminished by transient conditions [28,29,30,31,32]. In terms of fatigue damage, there are different stages where defects may initiate in an undamaged section and then propagate in a stable manner until complete fracture occurs. The conditions for microdefect nucleations and the rate at which the dominant fatigue crack advances are strongly influenced by a range of mechanical, microstructural and operational factors [33,34]. Take as an example the HYP safety assessment methodology developed by Pachoud et al. [35] based on advanced models for stress evaluation [36,37].
Regarding interest in asset management, Gagnon et al. [38] show that cyclical loadings in the transient mode have a major impact on equipment reliability. The influence of the load spectrum derived from turbine strain measurements and operation history [39] and the main microstructural features observed in stainless steels commonly used for runner manufacturing [40] are examined to properly evaluate the risks associated with operation. A synoptic view of the loading features and the key issues during hydraulic turbine transient operating conditions and the impact on fatigue damage is provided in the review paper by Liu et al. [41] These effects shorten the lifetime [42], increase hydropower plant operation costs [43] and power generation loss.

2.1. 2nd Half of the XIX Century—First General Theories

The industrial revolution stimulated the development of new manufacturing processes and new technologies all over the world. Engineers and scientists in all fields were asked to bring new ideas, to make innovations, to discover, to patent inventions. All these technical advances needed theoretical and scientific support; therefore, the sciences made unprecedented breakthroughs. In this context, companies’ progress contributed to the development of hydraulics. By the end of the century, these new theories were focused on deriving hydrodynamic base equations. Some of them were later used to develop incipient fluid models in order to analyze the water hammer phenomenon and to predict over-pressure in pipes.
Among the scientists concerned about the effects of the water hammer was mathematician and engineer Menabrea, who in 1858 published the conclusions of his studies linking water hammer overpressure to pipe design [7]. He notes that before him, many engineers studied the shock produced in a pipe when water movement is abruptly stopped, but did not necessarily consider the elasticity of the pipe, material brittleness or the compressibility of water. He introduces these factors and derives a formula to calculate the required thickness of the pipe wall function of the net head and the water velocity. Not long after, in 1878, Michaud proposes devices to attenuate the effects of the water hammer in pipes and introduced formulas to calculate air chambers and safety valves. He exemplifies the calculations for different supply network configurations and for the first time, an application for a hydraulic turbine is mentioned in the scientific literature [8].
Following studies on blood flow in arteries, Johannes von Kries published in 1883 a physiological study that includes the first mention of the water hammer theory [9]. He names, without any particular reference, the fundamental equation of shock waves relating the pressure changes to the velocity changes through the fluid mass density and the sonic speed for the fluid. He states as well that the formula had not yet been validated by experiments, so he measures the propagation and reflection of slow pressure waves under different unsteady frictions and viscoelastic pipe materials (short rubber hoses). In 1892, he published the first textbook on the water hammer theory, presenting formulas for phase-velocity and damping that are frequency-dependent because of skin friction. This work is the first contribution published on the subject of unsteady friction, according to Tijsseling et al. [12,13]
Mathematician and engineer Nikolay Joukowsky, a prominent aerodynamicist, made a major contribution to the water hammer theory as well. The article on the hydraulic shock in city water pipes presented in 1898 at the meeting of the Russian Technical Society cemented him as the founder of the water hammer discipline [10]. This comprehensive study contains a theoretical treatment for the observations on the impacts fast waves measured in long steel water pipes. The experiments were carried out with pipes of 2, 4, 6 and 24 inches in diameter. A change in the hydrodynamic pressure in the tube and a propagation of this pressure along the tube were observed when the water flow was interrupted by means of a very rapid closure of the slide at the end of the tube. The results make it possible to conclude that the phenomenon of hydraulic shock can be explained by the creation and propagation of the shock wave in tubes having either an open or a closed end. The wave is caused by the compression of the water and the expansion of the tube walls. The shock waves equation linking pressure changes with velocity changes through density and sonic speed, which were mentioned earlier and validated through experiments by other scientists as well, was derived independently in this work and from then on it would be known as the “Joukowsky equation” [11,14]. The paper also concerned safe time of closing, air chambers and safety valve employment.

2.2. 1st Half of the XX Century—Early Applied Studies

In the early XX century, relatively simplistic theories were used to design HYP of HPUs and to analyze the water hammer phenomenon. The first major accidents due to water hammer-stimulated research and mitigation measures for hydroelectric power plants. HYP appropriate design was not yet among the factors taken into consideration. As an example, concrete passages were not yet considered. At that time, the analysis focused only on a singular and maximal operating time of the flow regulating device. Pressure recordings also emerged, although the devices of the time were primitive and of a low performance.
Bouchayer [15] reviews one of the first penstocks and recalls the principles used for calculations. The factors influencing the HYP lifespan identified after the first 65 years of experience with penstocks remain in the domain of classical material strength. According to the author, the field is well known and requires only rather simple formulas. In 1902, HYP conception of the HYP is rather simplistic; all the formulas are described as “very simple”. The HPU wicket gate closing time, which is a critical/major factor for water hammers, is calculated by a “very simple” formula. HYP hydraulic path is not calculated just an oversimplified estimation of the flow rate as a function of wall thickness. At the time, the network consisted of rather large consumers who could easily cause load rejections in such isolated networks. Degradation of the original design pressure over time is influenced only by corrosion and for 20 years it was believed that this phenomenon would be under control without the need to repair every 3–4 years. The impact of cyclical or fatigue stress on HYP is not taken into account, which was a shortcoming at the time.
Bouchayer [16] extends the investigation of the catastrophic event published in 1902. He reiterates that all of the factors that influence HYP, reliability must be considered at the design stage. In 1911, the approach is less simplistic, the formulas in reference are more elaborate, the design criteria, the materials, the manufacturing methods and the commissioning tests play a more significant role in HYP lifespan. Data obtained with the recorders recommended in the past have been very useful in identifying the causes of penstock rupture.
De Sparre [20] provides an overview of the advancements in the water hammer field during the First World War. He introduces the notion of the nonlinear law of closure for wicket gates and presents the experimental validation of theories and calculations. He also considers the notion of variable thickness for the pipe wall and mentions the resonance phenomena.
Allievi [23] investigates the causes of the catastrophic event that occurred in 1902 during the maintenance of the Papigno hydropower plant. He elaborates the first water hammer theory. Allievi [23] publishes the first book about water hammer theory, which follows two previous editions prepared in Italian (Teoria del colpo d’ariete, Stabilimenti grafici Stucchi, Milano, Italia, 1913) and in French (Theorie du coup de belier, Dunod Editeur, Paris, France, 1921), respectively. As the first systematic investigation of the water hammer phenomenon in HPPs, this book is a milestone.
Allievi develops the first detailed formulas for flow cut-off and flow rate variation. He considers water hammer at closure and opening, as well as the resonance phenomenon for a single gate acting on a simple conduit. He also provides designers with the first design tool elements, for example monograms for minimal penstock water flow rate, net head, pipe diameter and material as function of wall thickness. As there are limitations at this stage of research, a single gate is considered instead of the wicket gate assembly and the behavior as well as the influence of the turbine on the water flow rate is neglected.
The Hydraulic Power Committee [44] examines the effect of speed regulation and water hammer on the design of relief valves, penstocks and surge tanks. Committee members review penstocks in service with an emphasis on the fact that in the load rejection, the HPU is the main factor controlling water hammer stress on the HYP. They recall the design assumptions and design principles for water hammer stress and highlight the importance of a proper penstock design, especially the choice of design pressure. They furthermore pay particular attention to protective equipment, such as pressure relief valves.

2.3. 2nd Half of the XX Century—Theories in Modern Times

At this time, the first classic water hammer numerical models and simulations are developed. The specific profile of the HYP and the concrete passages are considered. Many devices and methods are proposed to attenuate the water hammer effects. The analyses start to include recommendations for a wicket gate operating time. Pressure recordings are more accurate, and the advent of electronics and PLC facilitate signal processing.
Parmakian [24] elaborates the theory about water hammer in HYP by applying the basic fluid mechanics equations to the HYP of HPU and the limitations of appropriate scenarios. The theories and equations about the water hammer phenomenon were further refined in 1963. The assumptions are well specified, and the boundary conditions are better defined. It can be noted that concern about the cyclical stress/fatigue begins to worry designers. Therefore, several solutions (surge tank, air chamber, accumulators) are proposed to mitigate water hammer effects. The shortcomings remaining at the time are: (i) the impact of cyclical or fatigue stress is not taken into account at all; (ii) the modeling of the cut using unrefined guidelines; (iii) the influence of closing times on the overspeed of the HPU is not considered.
The Bureau of Reclamation [45] synthesizes design criteria for welded steel HYPs from over 40 years of experience. Mainly, the HYPs that equip the HPU must simultaneously fulfill two basic functions: (i) ensure required flow and optimum hydraulic path; and (ii) respond to mechanical stresses during operation. HYP must be safe to prevent failure and those constructed from welded steel must comply with ASME Code, Section VIII.
Selz [27] reviews the concepts that govern the requalification of pressure vessels according to the strategies and methods of the ASME code. Currently, there are no specific rules; methods must be developed for this purpose based on existing standards. Designers must be prepared because there are strong economic and safety incentives for requalifying pressure vessels to values below the initial allowable pressure at the end of equipment lifetime. The steps to follow for requalification would be: (1) to collect information on design and operating conditions; (2) to perform a basic analysis to establish the maximum allowable working pressure and to identify high-demand areas; (3) to perform visual inspections and non-destructive examinations; (4) to perform detailed analyses in order to confirm the current maximum allowable pressure; and (5) to establish the recommended interval for future inspections. In this case, requalification costs are between 10% and 15% of the replacement cost.

2.4. Present Day: Current Research

Nowadays, HYP passage design is well analyzed using the method of characteristics (MoC) [46,47] and coupling MoC with CFD [48,49]. The method of characteristics is a mathematical technique applied to solve partial differential equations by reducing them to a family of ordinary differential equations. In hydrodynamics, the method of characteristics is applied to study the motion of fluid, particularly kinematic waves [50]. Different researchers adapted this method specifically to study the water hammer phenomenon [51,52,53]. Iliev et al. [54] and Pal et al. [55] conducted a comparative study and used MoC and CFD to determine the conditions for water hammer development in hydraulic systems during quick closure of the main inlet valve or turbine guide vanes.
Other analyses are performed for wicket gate closing and opening. HPU parameters including pressure are currently recorded, even in continuous mode. Large measurement campaigns, as well as a powerful signal processing capability, allow producers and designers to analyze a multitude of factors and events. The methods and devices was proposed to mitigate water hammer effects are more sophisticated and include recommendations for design, operation, maintenance and refurbishments. The newly developed water hammer dynamic models conceptualize HPU spinning as a variable pressure drop interfering with the HYP through the runner that acts as a dynamic orifice. However, the factors influencing this variation are less defined and documented. The importance of each factor is not highlighted, nor is it always linked to the HPU technical parameters, which can often be adjusted and modified for optimization.
Ramos and Almeida [25] apply a dynamic water hammer model to reaction turbines, in particular hydraulic turbines with long penstocks in order to prove that the water hammer is influenced by runner speed/overspeed. This new approach is based on the concept of an equivalent dynamic orifice, and it was developed to model the effects of a water hammer caused by HPU on HYP.
Bakken and Bjørkvoll [56] propose a mathematical model to study fatigue reliability function during unit start-stop. The authors consider the cumulative effect over time and set out to find the most appropriate operating protocol. Fatigue reliability would be influenced in operation especially by High Cycle Fatigue (HCF) having a high frequency and low amplitude, while stopping and starting by Low Cycle Fatigue (LCF) having a low frequency but with high amplitude [43]. They also carry out an experimental validation of the model using case studies. By reducing the amplitude of HCF stresses (by deformation), the stress generated was reduced by 33% in the first case and 71% in the second. These reductions in effort allow higher equipment reliability. In conclusion, the study reveals significant variations in reliability from design to design and from one starting mode to another. Turbine start–stop is required by energy market affecting the runner lifetime. The runner lifetime may be improved by minimizing overpressure loading on the blades during transients through strategic movement of guide vanes [57]. The designers have to take into account the turbine behavior under transient conditions to achieve this goal. As a result, the hydropower equipment has to be designed to operate under extreme loads that occur in transient regimes.
Bergant et al. [58] review the water hammer phenomenon with column separation. This water hammer phenomenon with column separation may occur when the pressure drops below the vapor pressure at particular locations such as closed ends, high points or joints (HYP with sudden changes in slope and section area). At these locations, the liquid column breaks and a vapor cavity begins to grow, driven by the inertia of the separating liquid columns. The vapor cavity acts as a point with low pressure delaying the liquid columns, which begin to shrink in size as the liquid columns change flow direction. Then, the collision of two columns of liquid or a column of liquid with a closed end that moves towards the shrinking cavity can cause a large and almost instantaneous increase in pressure. The large increase in pressure travels through the entire HYP inducing significant additional loads on hydraulic machines, individual pipes and support structures. This water hammer phenomenon with column separation is even more dangerous, with more occurrences of cavity formation and collapse. The vapor cavities collapse and effects of water columns may cause severe damage or, ultimately, failure of the hydraulic system. The water hammer phenomenon developed during transient procedures is induced by closure of a valve/gate or shutdown of a pump/turbine.
The two-phase flow phenomena associated with the water hammer phenomenon with column separation involves several challenges [59]. The first mathematical models of vapor cavity formation and collapse were based on the graphical method [60]. Subsequently, a variety of numerical models (e.g., the discrete vapor cavity model (DVCM) [61,62,63,64], the discrete gas cavity model (DGCM) [65,66,67], the generalized interface vapor cavity model (GIVCM)) [68] were developed leading to a better understanding of the water hammer phenomenon with column separation [69,70,71]. The numerical results were compared against experimental data to assess the limitation of the numerical models [72,73]. The extensive investigations performed by several authors have revealed that the discrepancies between the numerical results and experimental data [74,75] may be attributed to approximate modeling of column separation along the HYP resulting in discrepancies of cavity collapse and superposition of pressure waves. The differences may also come from discretization in the numerical models, unsteady friction losses approximated as quasi-steady friction losses and uncertainties in the measurements. Vítkovský et al. [76] underline that unsteady friction could be far more dominant than quasi-steady friction for even low dimensionless frequencies. It was discovered that the characteristics of the hydraulic system could affect the significance of unsteady friction and its approximation. As a result, the study of the significance of unsteady friction errors in hydraulic systems showed that the need to model unsteady friction should be assessed on a case-by-case basis. In conclusion, the numerical models implemented in the commercial water hammer codes provide a valuable tool for investigating column separation. However, the numerical results must be carefully validated against experimental data to verify that the characteristics of each type of hydraulic system are captured.
Ghidaoui et al. [77] compile a collection of theories and models with their limitations and hypotheses for calculation. This valuable update is essential for identifying directions for research/improvement in the water hammer field. A list of existing calculation software in the field is proposed (including the description of field application, the models used, and the strengths for each one), with the note that a specific adaptation for HYP and HPU would be required.
Ramos [78] recommends developing the water hammer mathematical model for the preliminary calculation applied to reaction turbines (Francis). This development extends the water hammer mathematical model presented in Ramos and Almeida [25,26]. The basic idea is that the overspeed wheel acts as a dynamic orifice, and not as a fixed/constant pressure drop.
Li et al. [79] present the results obtained with a multiple slope closure law and two desynchronized wicket gates. The closing law for the gates influences the stresses induced during load rejections: (1) two wicket gates that close asynchronously improve the HPU behavior and water hammer stresses during load rejection; (2) the use of a multiple slope closing law decreases the stresses; and (3) the best results were obtained with two wicket gates asynchronously closing using multiple slope closing law.
Zheng et al. [80] propose a transient interaction model for very large HYPs and HPUs based on the hypothesis that a suitable modeling of the hydraulic path could eliminate the undesirable effects in transient regime. Thus, optimized draft tube arrangements eliminate the surge tank. The wicket gate closing time, the speed regulator control adjustments and unit start/stop sequences have been improved. The model predictions have been improved and confirmed with experimental observations.
Chen et al. [81] propose a mathematical model for the behavior of an HPU in load rejection to consider that in load discharges, the HPU induces a water hammer solicitation on the HYP by the elastic impact model. The stability of the HPU resulting from analyzing the model can be improved by optimizing the wicket gate law of closure. The mathematical model proposed for the HPU is very sophisticated, dynamic and non-linear, including: (i) a global model for the turbine part for a Francis; (ii) a model for the alternator, a model for the speed regulator; (iii) model for the resulting torque as a function of the wicket gate opening; and (iv) six equations for the non-linear transfer coefficients to refine the modeling.
Gagnon et al. [38] propose the mechanical response of Francis runner blades to HPP control systems. An increased interest in runner blade response during transients is observed due to their significance for fatigue and life assessment. The settings for the wicket gates opening control and the air admission below the runner were at study. Three types of transient events were identified for optimization: unit start-ups, shutdowns and load rejections. The research has shown that the dynamic amplitudes of most transients can be influenced using turbine control systems, so for a turbine runner with acceptable dynamic behavior, the control system parameters could be adjusted to minimize the equipment risk of fatigue failure without negative effect on other components and objectives. The opening rate or speed set in the governor might be adjusted and can be easily used to influence the runner response during transient regimes. Air admission systems can be used to prevent vacuum in the draft tube during load rejection, since the wicket gates are used to limit overpressure in the spiral case.
March [1] notes that HPUs are under significantly increased stress from their design specifications due to changing operating conditions. The main factors to be considered in accelerated HPU and HYP degradation are ranked. He classifies flexible operation as “stress” type factors that will shorten service life and maintenance as “service”-type factors that increase service life. The author concludes, based on the literature review, that the theories, concepts as well as the opinions of the experts, that HPUs are strongly solicited to balance the mixed producer network (nuclear, solar, wind, etc.) and to level the peaks of consumptions. This flexible operation would be several times more damaging than the basic operation and it is obvious that accelerated degradation generates an increased need for maintenance.
Nicolet et al. [82] validate the “Hydro-Clone/SIMSEN” simulation method used to monitor a HYP in real time. The water hammer phenomenon, as well as fatigue, can be simulated and reproduced in real time by digital modeling in order to prevent damage to the HYP. In the analysis of a specific case for Cleuson-Dixence HPP penstock suffered a catastrophic failure in December 2000, the monitoring system proved to be reliable and mature, making it possible to monitor transient phenomena. They concluded that the approach was successful after eight months of continuous use of the proposed system.
The book published by Pejović and Gajić [83] underlines the importance of transients (e.g., hydraulic water hammer and hydraulic vibrations) and their influence on safety and economical construction of HYP. The main parameters for equipment and installations, the necessary data and the scope of the transient analysis, the most dangerous cases, the required measurements and investigations and typical transient events are presented and analyzed for all types of hydraulic systems, including large and small ones, which may require several protecting devices to prevent high pressure fluctuation due to water hammer and vibrations. The authors note that there is a general trend of decreasing design costs and simplifying the transient analysis in HYPs. In general, the smaller the hydropower plant, the greater the risk of problems due to reduced project costs. The authors indicate a direct correlation between saving money by reducing the funds allocated in the design phase and increasing the risks of transient effects in operation. A special remark is included about a poorly tuned governor, which may induce serious power and pressure oscillations in the system, which is dangerous for the HPP. Therefore, the analysis of the transient regimes is not complete if the governor and its properties are not taken into consideration. The authors point out that transient regime analyses are more complex due to boundary conditions.
Bergant et al. [84] focus their investigations on critical factors that may cause excessive water hammer loads in HPP. Excessive loads are induced in transient regimes leading to disruption of HPP operation and damage to system components. It is well known that water hammer induces a sudden increase and decrease of pressure in HYP, variation of hydraulic turbines rotational speed and water level fluctuation in surge tanks and air chambers. Therefore, they examine the design principles of water hammer control strategies including (i) operational scenarios, (ii) surge control devices or (iii) redesign of the HYP components in order to mitigate excessive loads. The methods enumerated by Bergant et al. [84] to keep the water hammer effects within the prescribed limits are the following: (1) alteration of operational regimes, (2) installation of surge control devices in the system, (3) redesign of the HYP layout. Two case studies were investigated in this paper including HPPs with long HYPs and water hammer control devices.
Dollon [85] reviews the theories and validates by experimentation the concepts that manage the turbine-dynamics behavior related to the basic structure, including the HYP. He demonstrates that the transient regimes contain useful frequency information that can be converted into modal or structural properties. He proposes a map of the excitation phenomena, based on the configuration of the unit and the zone under study. It is defined as reliable and automatic modal detection. He identifies procedures adapted to transient regimes by considering the possibility of extracting structural parameters (added mass, damping or stiffness) or modal parameters (deformation, pulsation, coefficient of amortization). He validates the consistency between the experimental and numerical results and suggests a method to predict an ideal type of test for characterization, in order to optimize the degradation, the downtime of the unit and the amount of modal information.
Dreyer et al. [86] came back with a development and more recent validation for the digital method “Hydro-Clone/SIMSEN”, making it possible to reproduce the damage caused by flexible operation on HYP. In the analysis of a specific case for La Bâtiaz hydropower plant, numerical simulation was used to reproduce stresses and fatigue in real time and to predict HYP aging. The measurements demonstrate that the model’s predictions concord with reality. There is a direct relationship between the variations in transient pressures and the stresses to which the HYP is subjected. In the flexible operation scenario, the HYP wear rate is ten times higher than in normal operation.
Klun et al. [87] proposes surveillance and monitoring program of the structures for concrete dams using vibrometry. They also point out that with the massive inclusion in the network of renewable energy sources known to be less stable, the role of HPU has increased; consequently, most HPUs designed for constant load operation today are also used for variable regimes, to provide grid peaking.

3. In Situ Experimental Investigations of the Main Parameters Associated with the Water Hammer Phenomenon

The literature review reveals that some aspects impacting the water hammer phenomenon should be examined with more attention and their influence has to be quantified [44,56,79]. Thus, the factors retained from the literature survey were considered for experimental measurements to validate HPU behavior during transient regimes.
Therefore, the actual study aims to consider the results of a test campaign organized in order to identify factors that contribute to the water hammer phenomenon and establish their influence. Establishing the link between induced stress and the effects will make it possible to optimize the HPU operating mode and to adapt the maintenance program. The found relations will help to determine the impact of: (1) extreme major events: water hammer/peak-amplitude (LCF) will have immediately visible effects by initiating cracks or even causing penstock failure; (2) hazardous operating regimes: pressure peaks/pressure-frequency cycle (HCF) will have time effects by propagating cracks and (iii) non-stationary pressure field areas: pressure or depression fluctuations, will provoke micro-cracks, fatigue and cavitation.
Lupa et al. [88] conducted experimental campaigns on the Hydro-Québec HPP fleet on 24 HPU configurations (from A to Y) for different types of runners (Francis, Kaplan, propeller, saxo) and different types of HYP (long/short, underground/external, low/high head, concrete/welded, etc.) Experimental recordings of HPU behavior during load rejections were studied. The main parameter controlled during these experiments was the rapid closing rate of the wicket gates. Factors insufficiently documented by previous research are examined and debated.
Special attention was paid to the spiral case and penstock MAWP design criteria during the test campaign performed by Lupa et al. [88] As a result, the HYP were selected based on the construction type/specific configuration and the material of the walls. Two main categories were defined: concrete and metallic structure (welded, flanged or riveted).
Specific experiments and studies were conducted for the wicket gate closing law, especially for the use of the second slope at the end of the closing sequence. The interaction between pressure fluctuation inside the draft tube and the overpressure peaks in the spiral case were investigated. Overpressures occurring at partial load and deep part load conditions, such as speed-no-load conditions, as well as during speed regulation by the governor, were analyzed. The behavior under the emergency closing sequence by rapid slope only (without a subsequent second one) was particularly studied on the saxo-type turbine. The influence of the second slope for different Kaplan configuration was investigated.

3.1. Overpressure Evolution and Trends

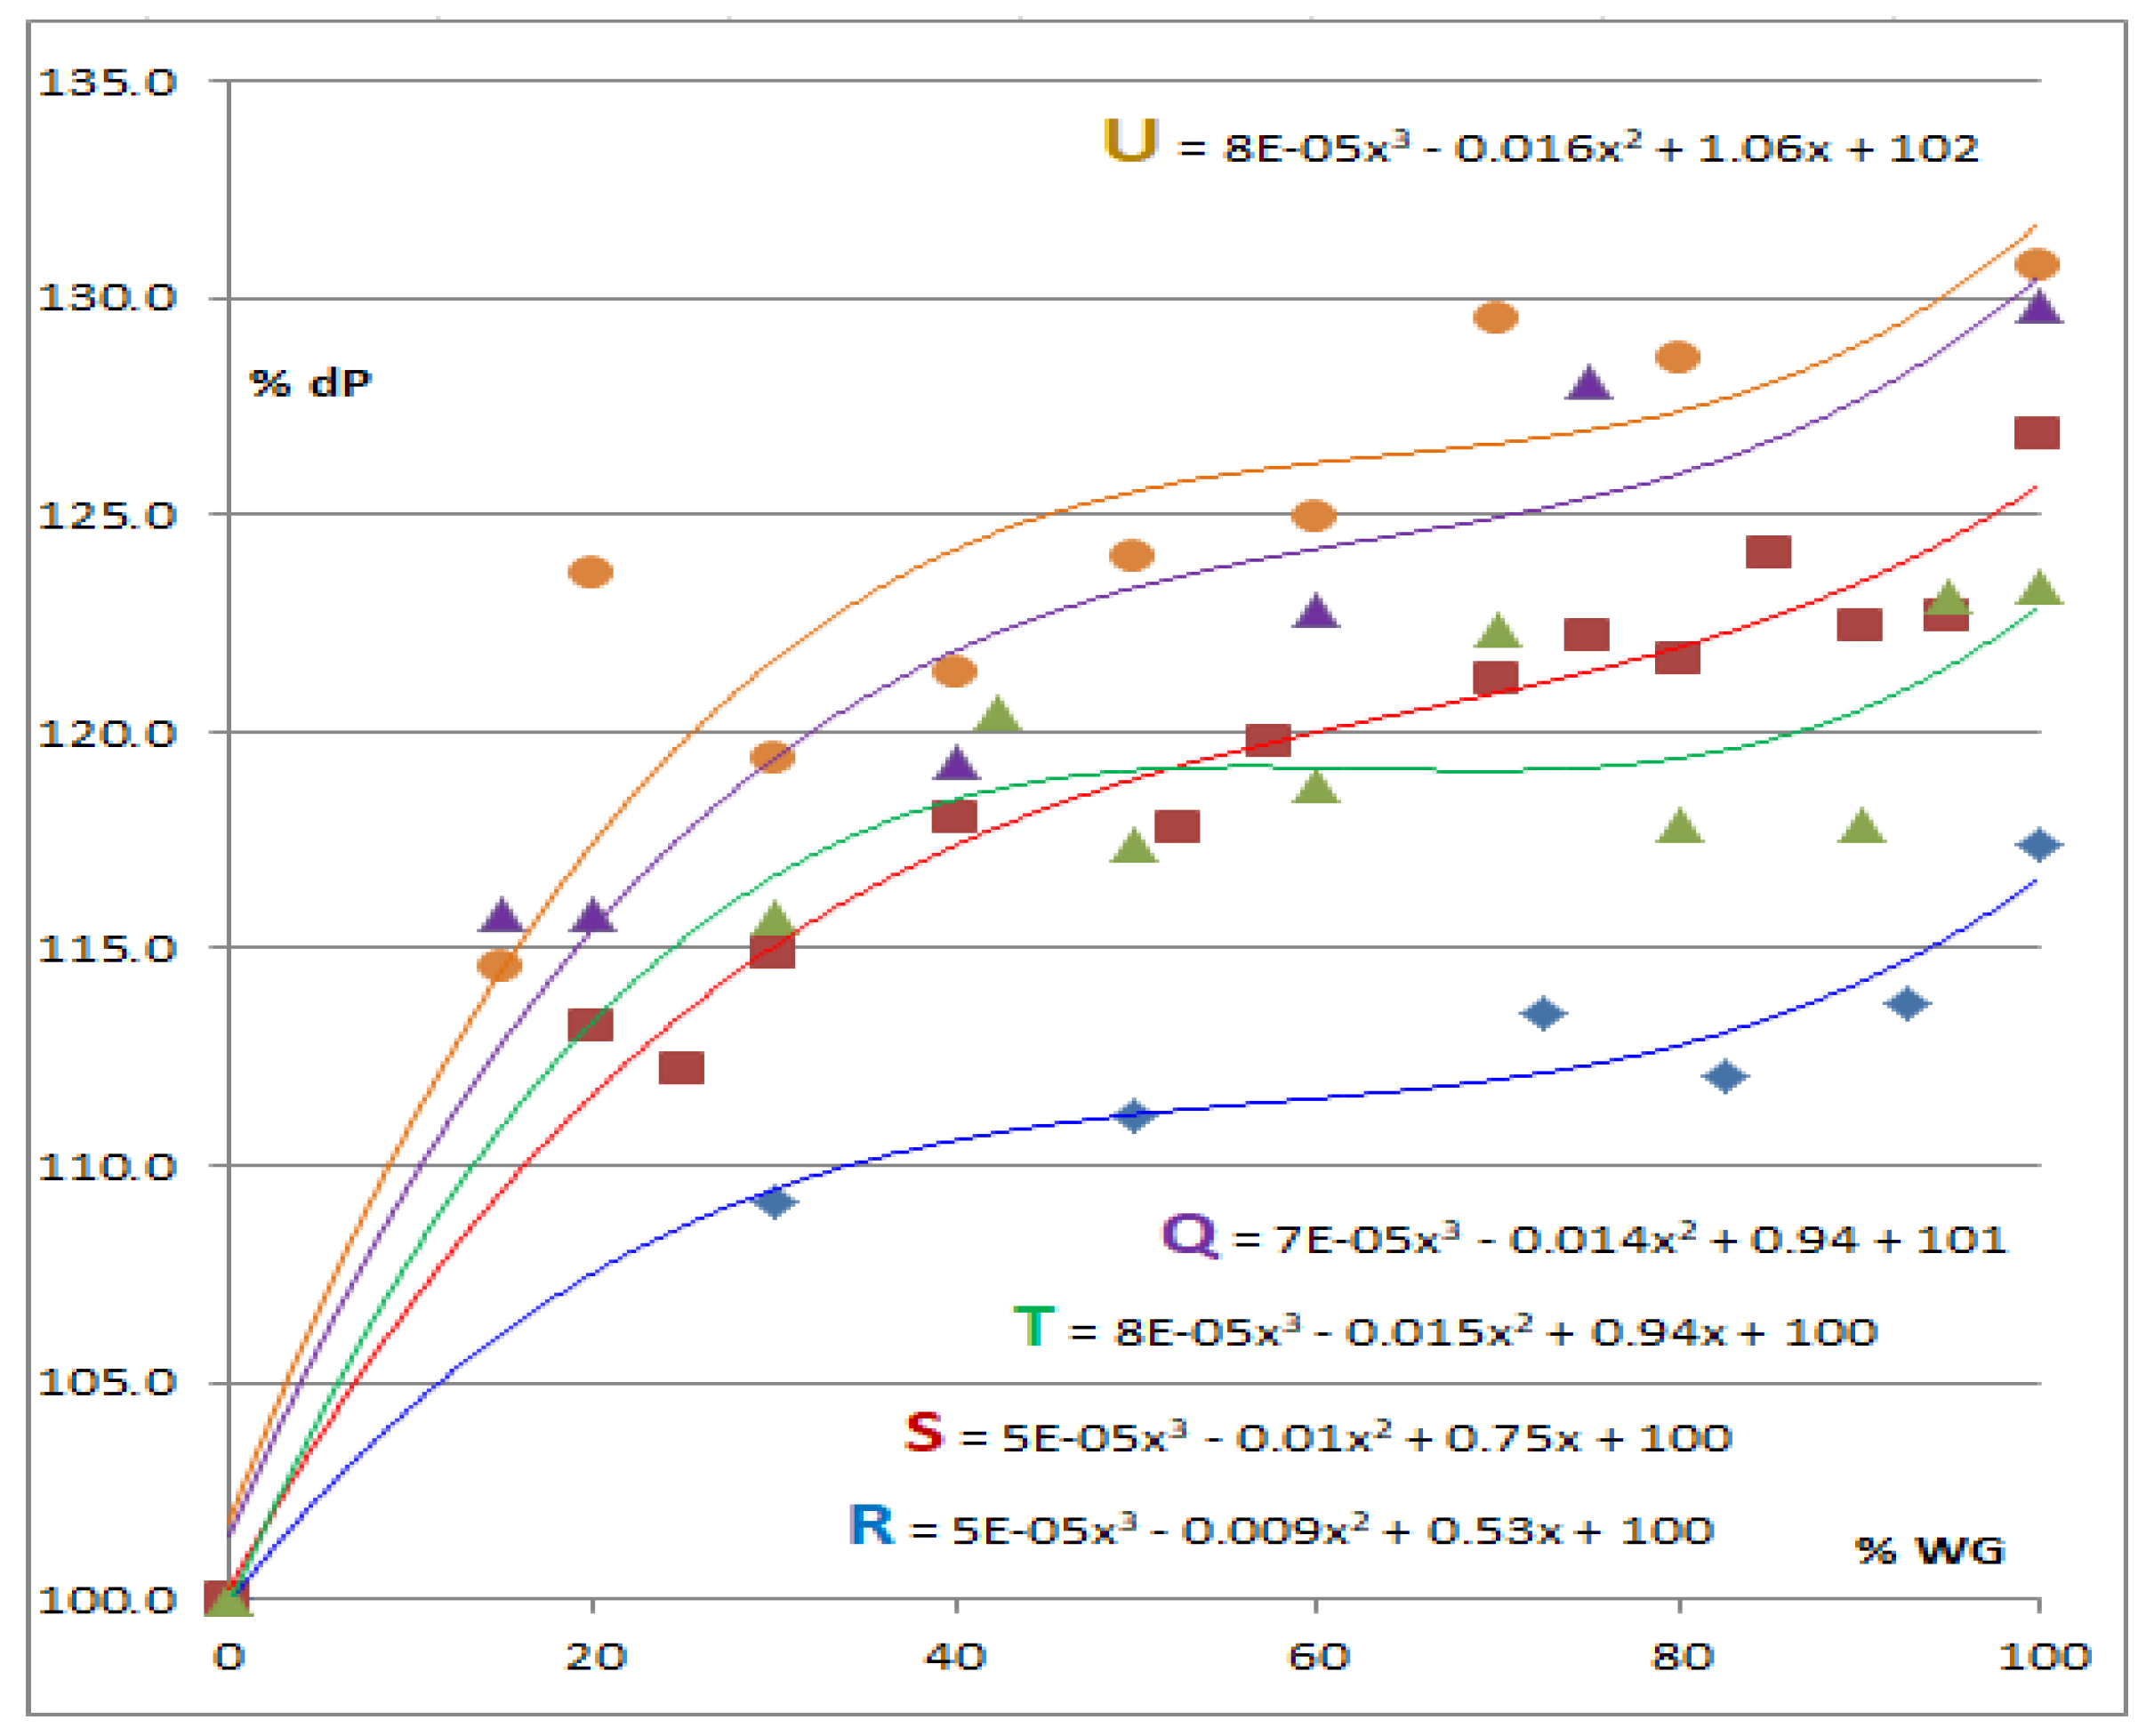
A specific maximum overpressure value trend in terms of wicket gates opening during load rejection is determined based on the experimental investigations conducted in several hydropower plants equipped with Francis turbines, see dots (●, ■, ♦, ▲) in Figure 2.
In situ investigations were carried out to determine operating behavior during the load rejection procedure for each hydropower plant. Therefore, investigations were carried out considering the predetermined settings for each hydropower plant. The maximum overpressure value is reached for this type of hydraulic turbine when the wicket gate is fully opened. Usually, then the maximum overpressure value measured during load rejection decreases with the wicket gate opening.
A third-order polynomial function captures the evolution of maximum overpressure values of the overpressure as shown in Figure 2 with solid lines. It can be noted that the maximum overpressure value (%dP) during the load rejection procedure when the wicket gate is fully open might change from approximately 117% to 132% for these five HYPs corresponding to the same category of hydraulic turbine. This dispersion of the maximum overpressure values is attributed to the HYP. These experimental data lead to the determination of empirical correlations that are transferable from one unit to another. As a result, these correlations help not just to assess and optimize the loads, but also to verify and validate more complex physical models to ensure HYP reliability.

3.2. Influence of Rapid Closure on Overpressure

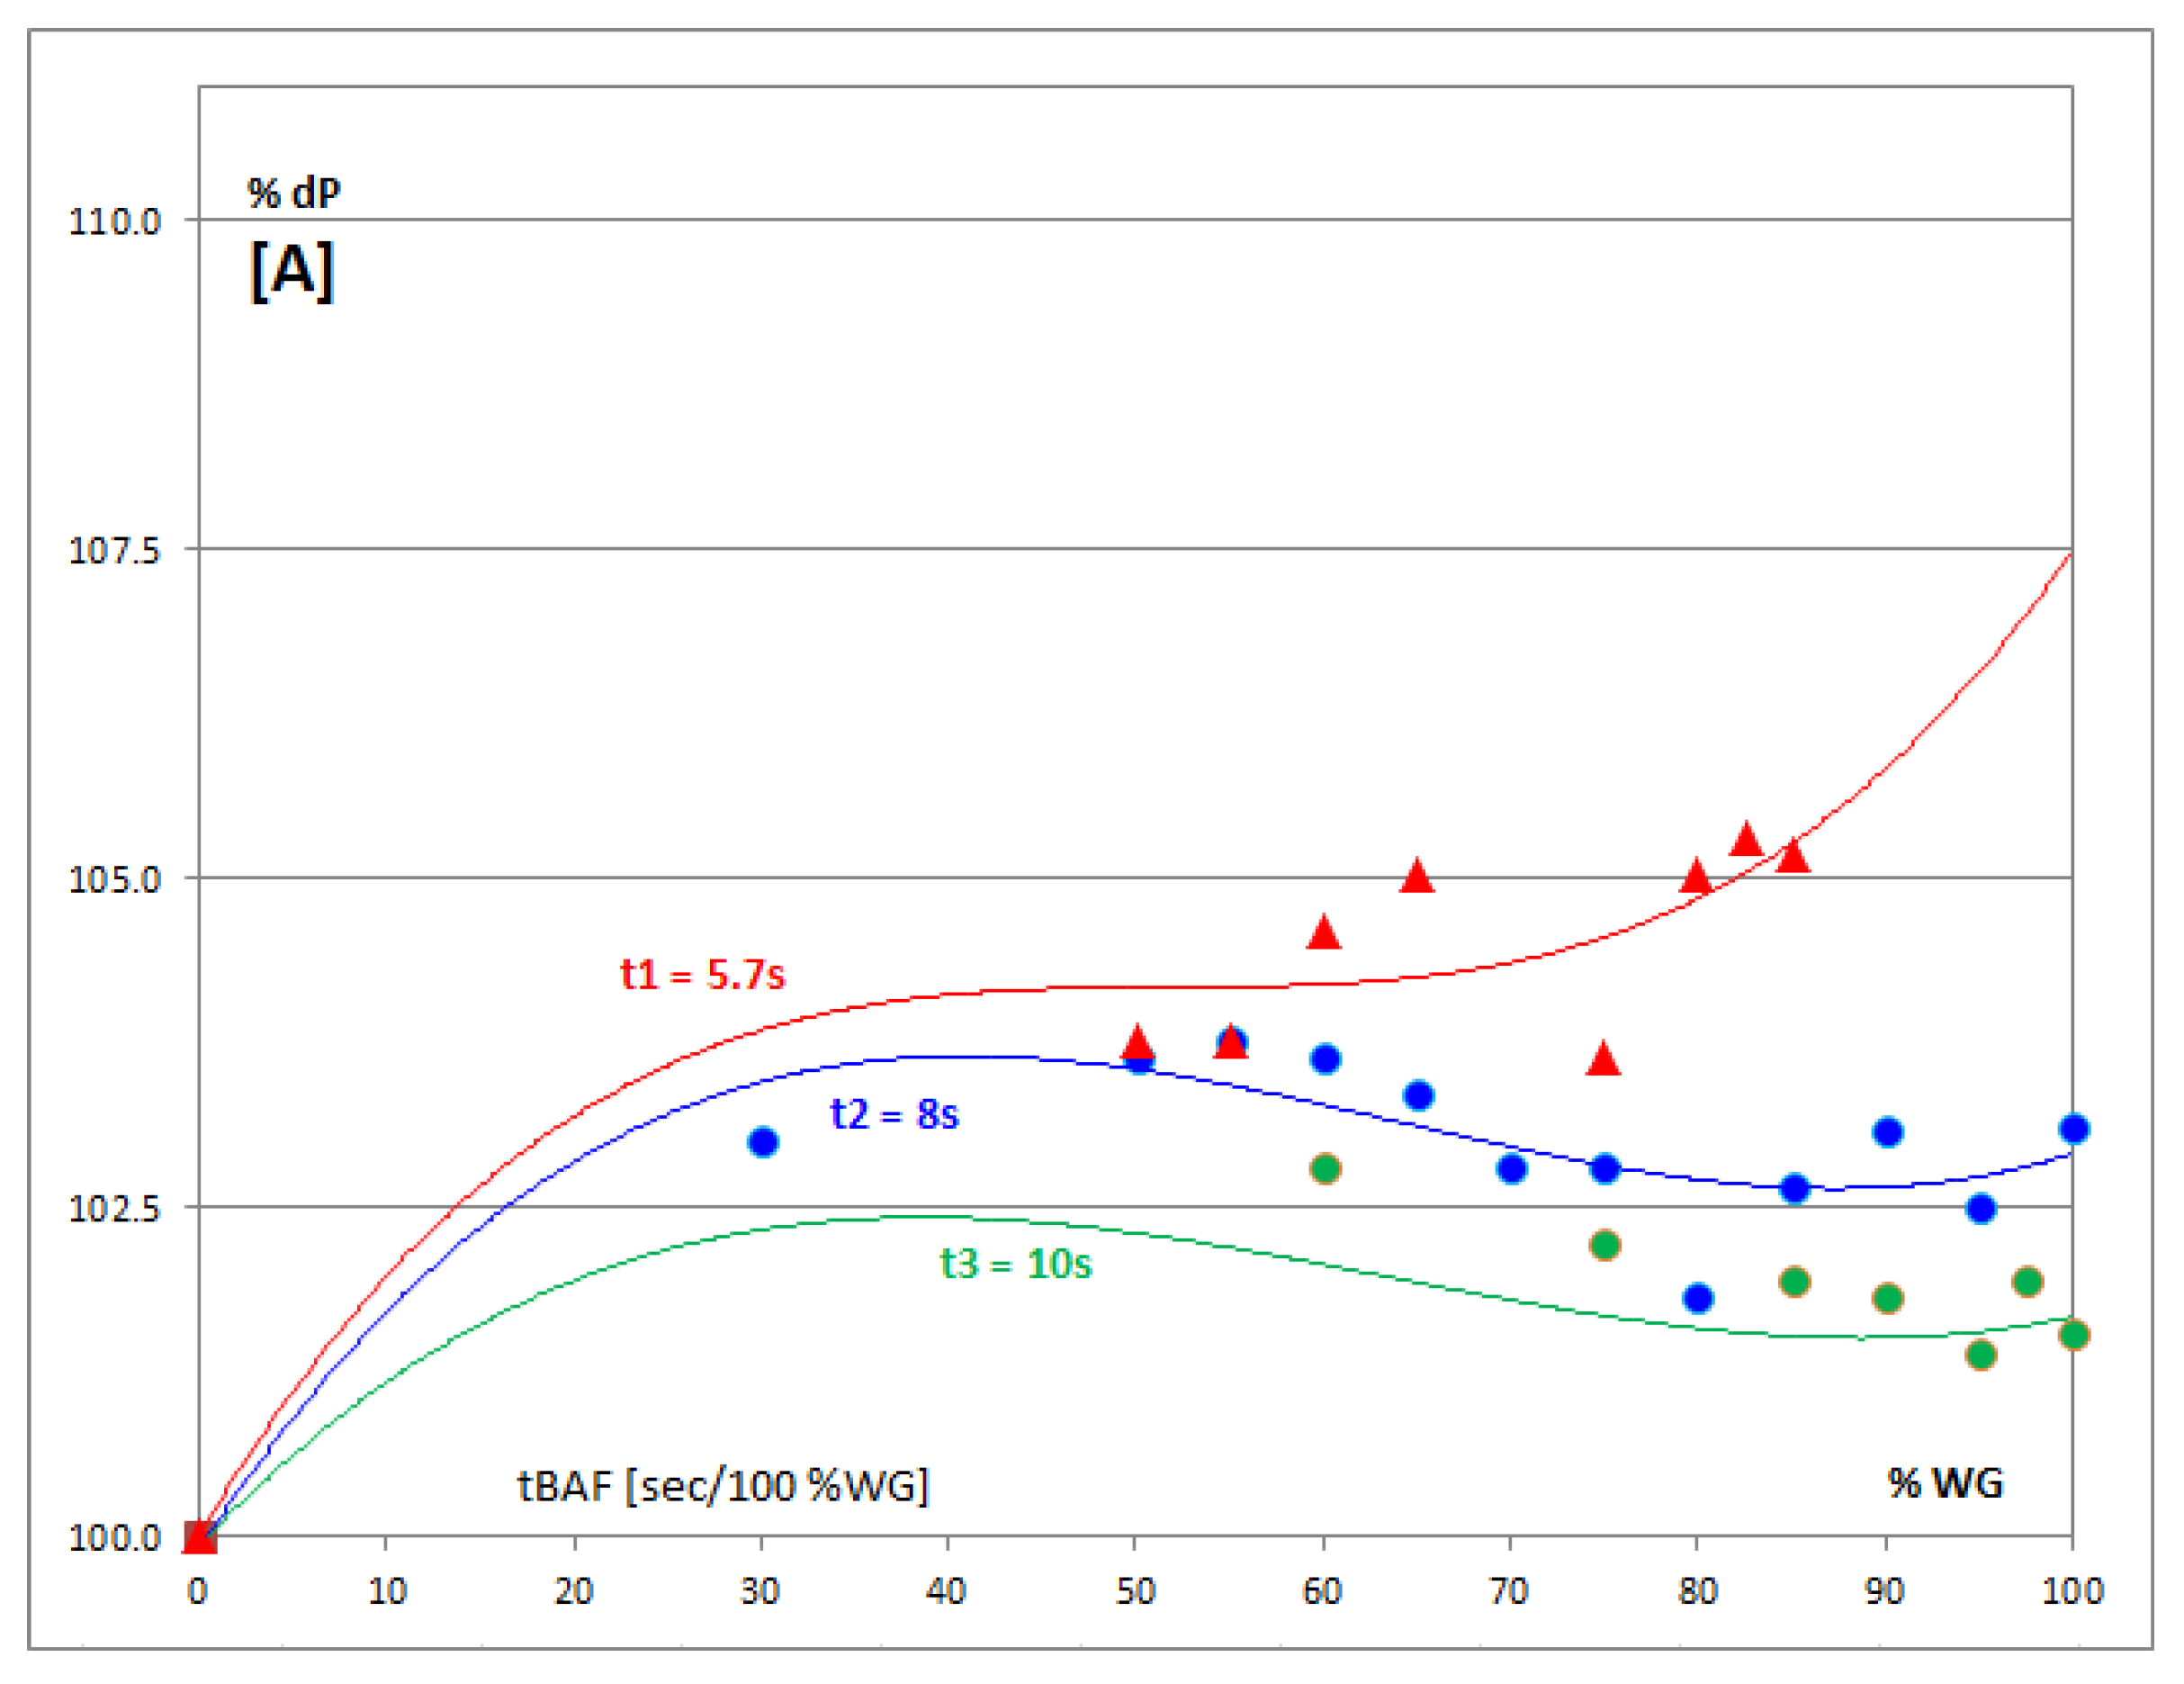
The correlation between overpressure and the variation in the rate of wicket gate rapid closure was studied. The overpressure evolution for different tBAF for a propeller operated in a hydropower plant is shown in Figure 3.
It can be seen that maximum overpressure values are captured for different wicket gate opening values (not necessarily for the maximum opening) for this type of hydraulic turbine. However, it is noted that the maximum overpressure values measured for these three tBAP do not exceed 6%, which is significantly lower than the values recorded for Francis turbines.
A clear correlation between overpressure and the tBAF value used for load rejection was observed. The more rapid the closure, the higher the overpressure values. On the other hand, overspeed values were lower (not figured on graphs).

3.3. Temporal Analysis—Main Factors Interaction

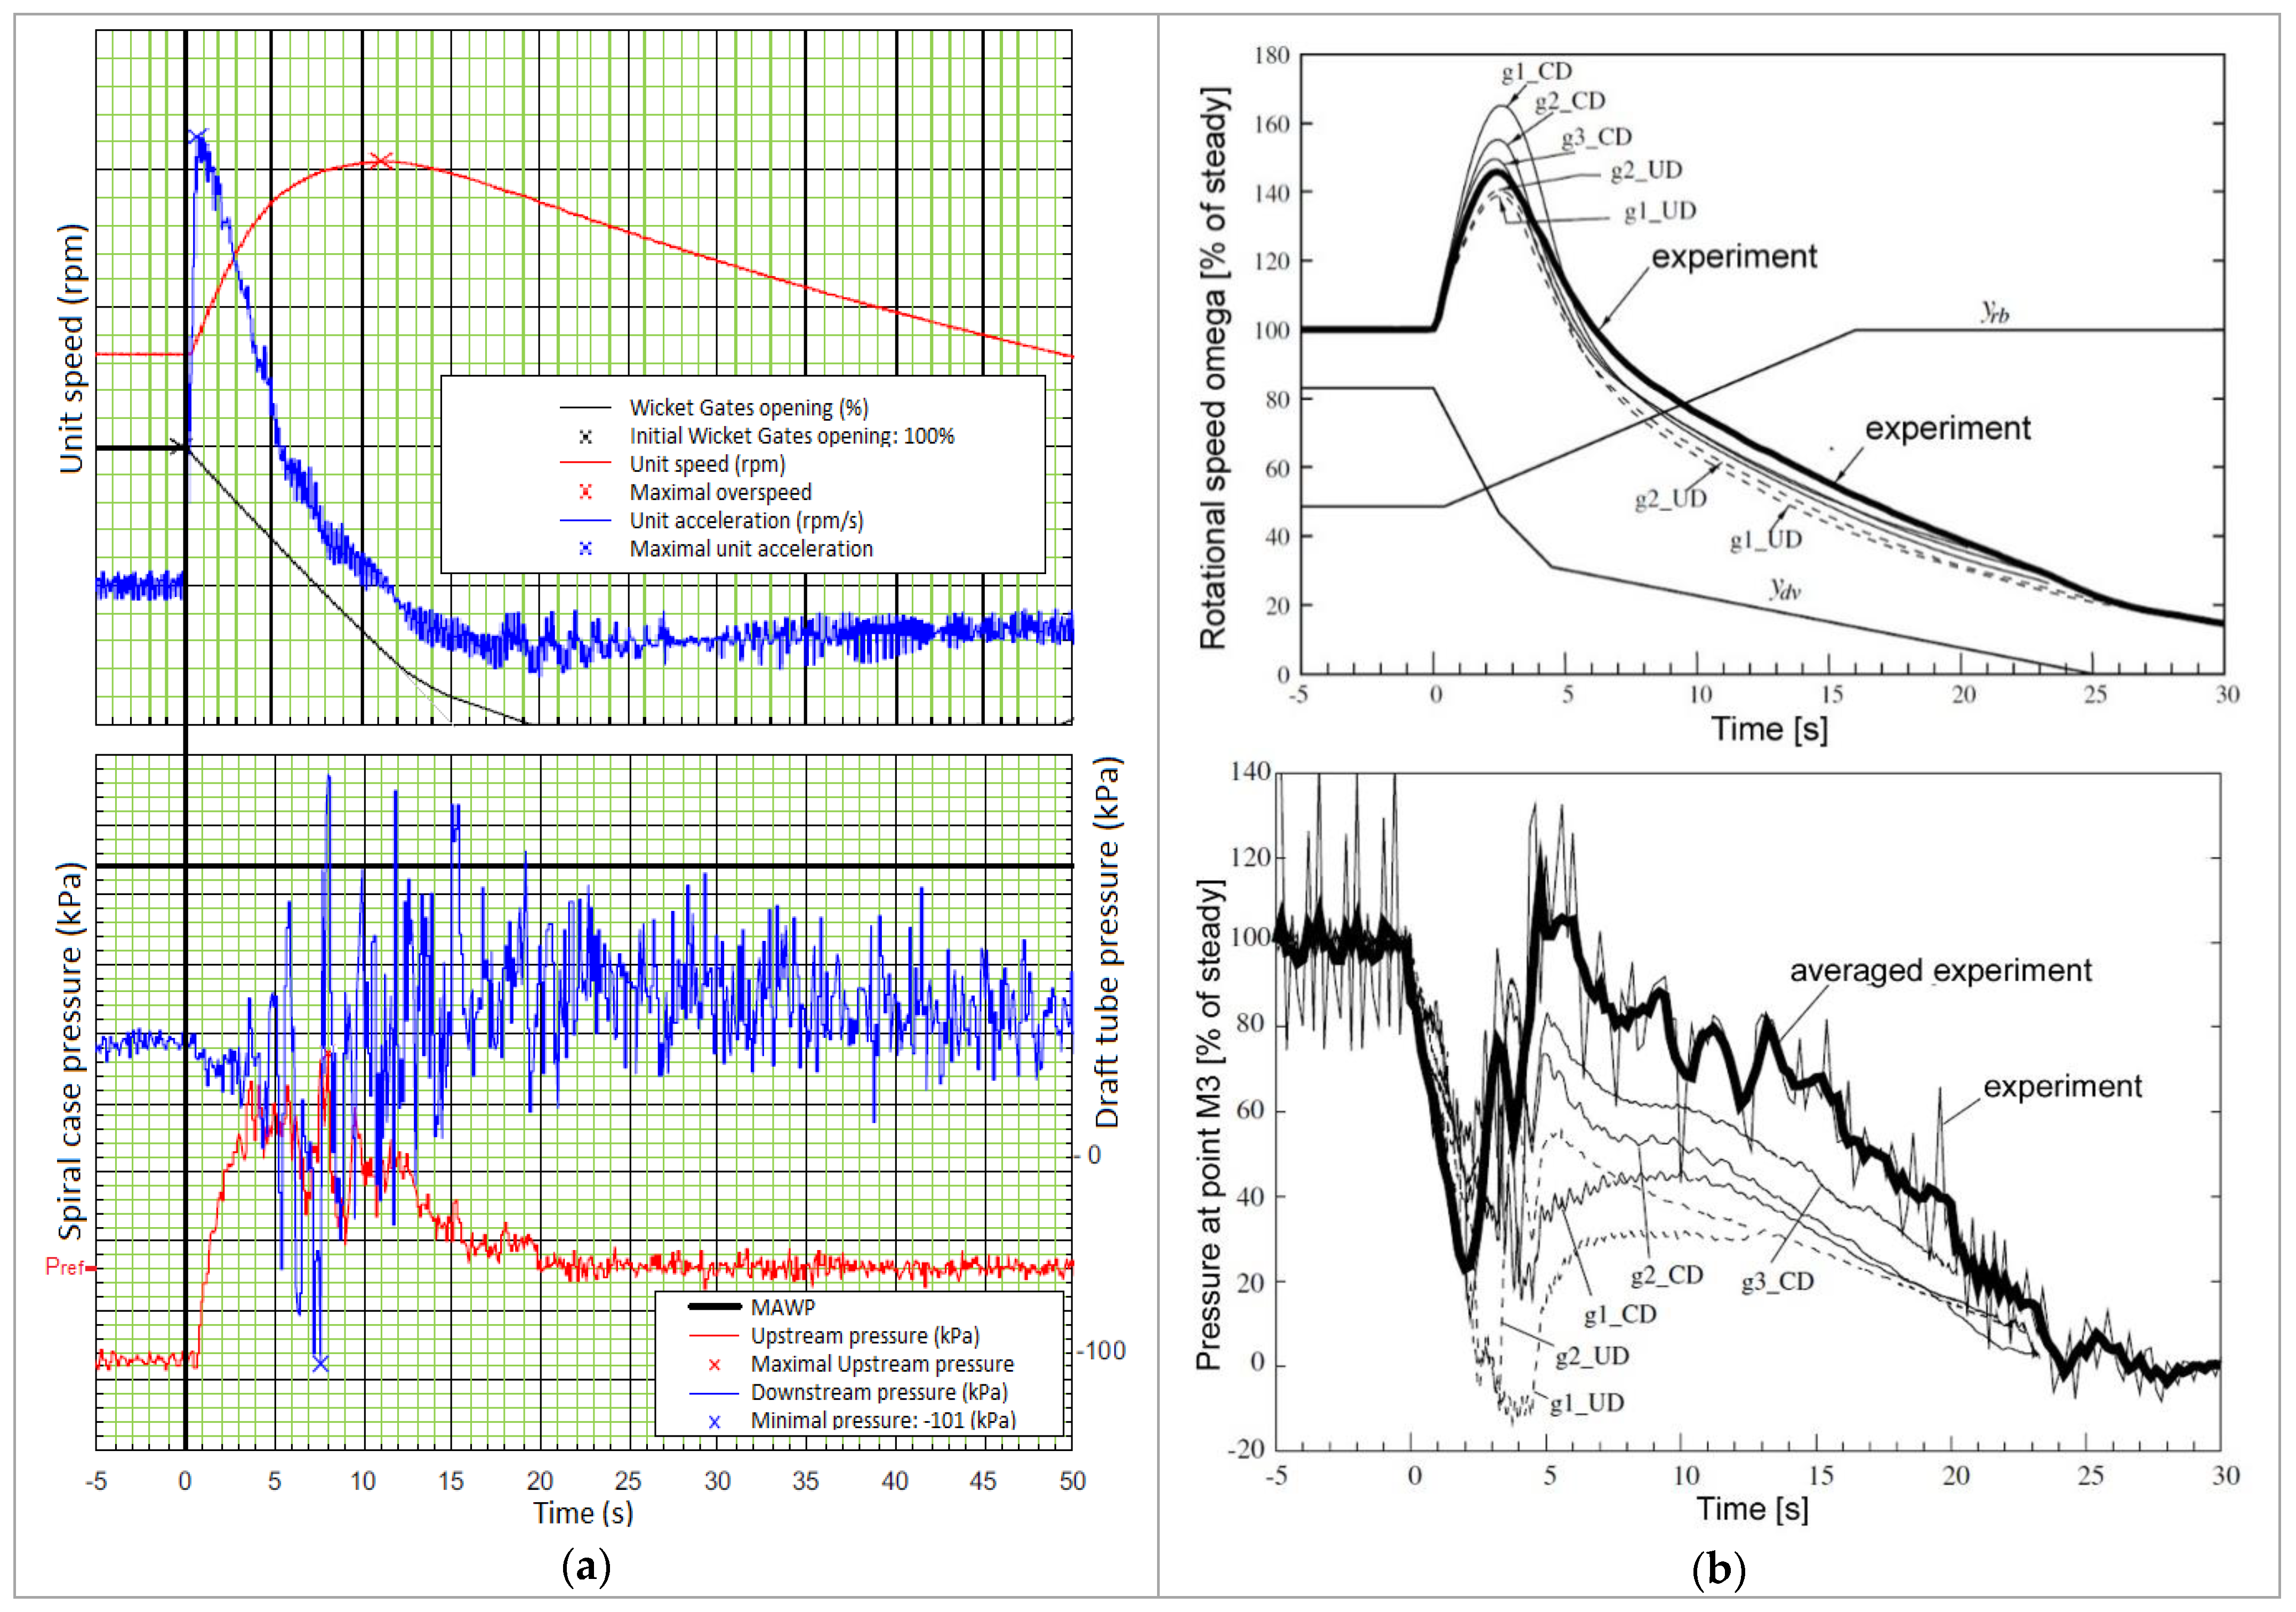
Depending on both the type of HPU and HYP configuration, during a transient regime a reciprocal action takes place among different parameters. This interdependence was studied for the particular case of a load rejection. The interaction in time among different measured values was analyzed: (i) spiral case overpressure, red line on the lower image; (ii) wicket gate closing rate, black line on the upper image; (iii) unit acceleration, blue line on the upper image; (iv) unit speed, red line on the upper image; (v) pressures/vacuum variations in draft tube, blue line on the lower image. The evolution in time of these parameters is presented in Figure 4a for a load rejection procedure of a hydropower plant equipped with a Francis turbine [88]. The emergency shutdown procedure starts with the so-called “zero moment”, when the hydropower unit is disconnected from the power grid and then the wicket gates are ordered to close through the protection sequence. The unit accelerates and the speed rises to the overspeed value (the red “x’’ on the upper graph). It can be observed that the maximum pressure peaks in the spiral case do not occur at the beginning, when the wicket gates start to close from fully open (100%), but later at 70% for the first time, and rise even higher at 50% for the second time. A correlation can be easily detected between the overpressure peaks in the spiral case and the pressure fluctuation inside the draft tube.
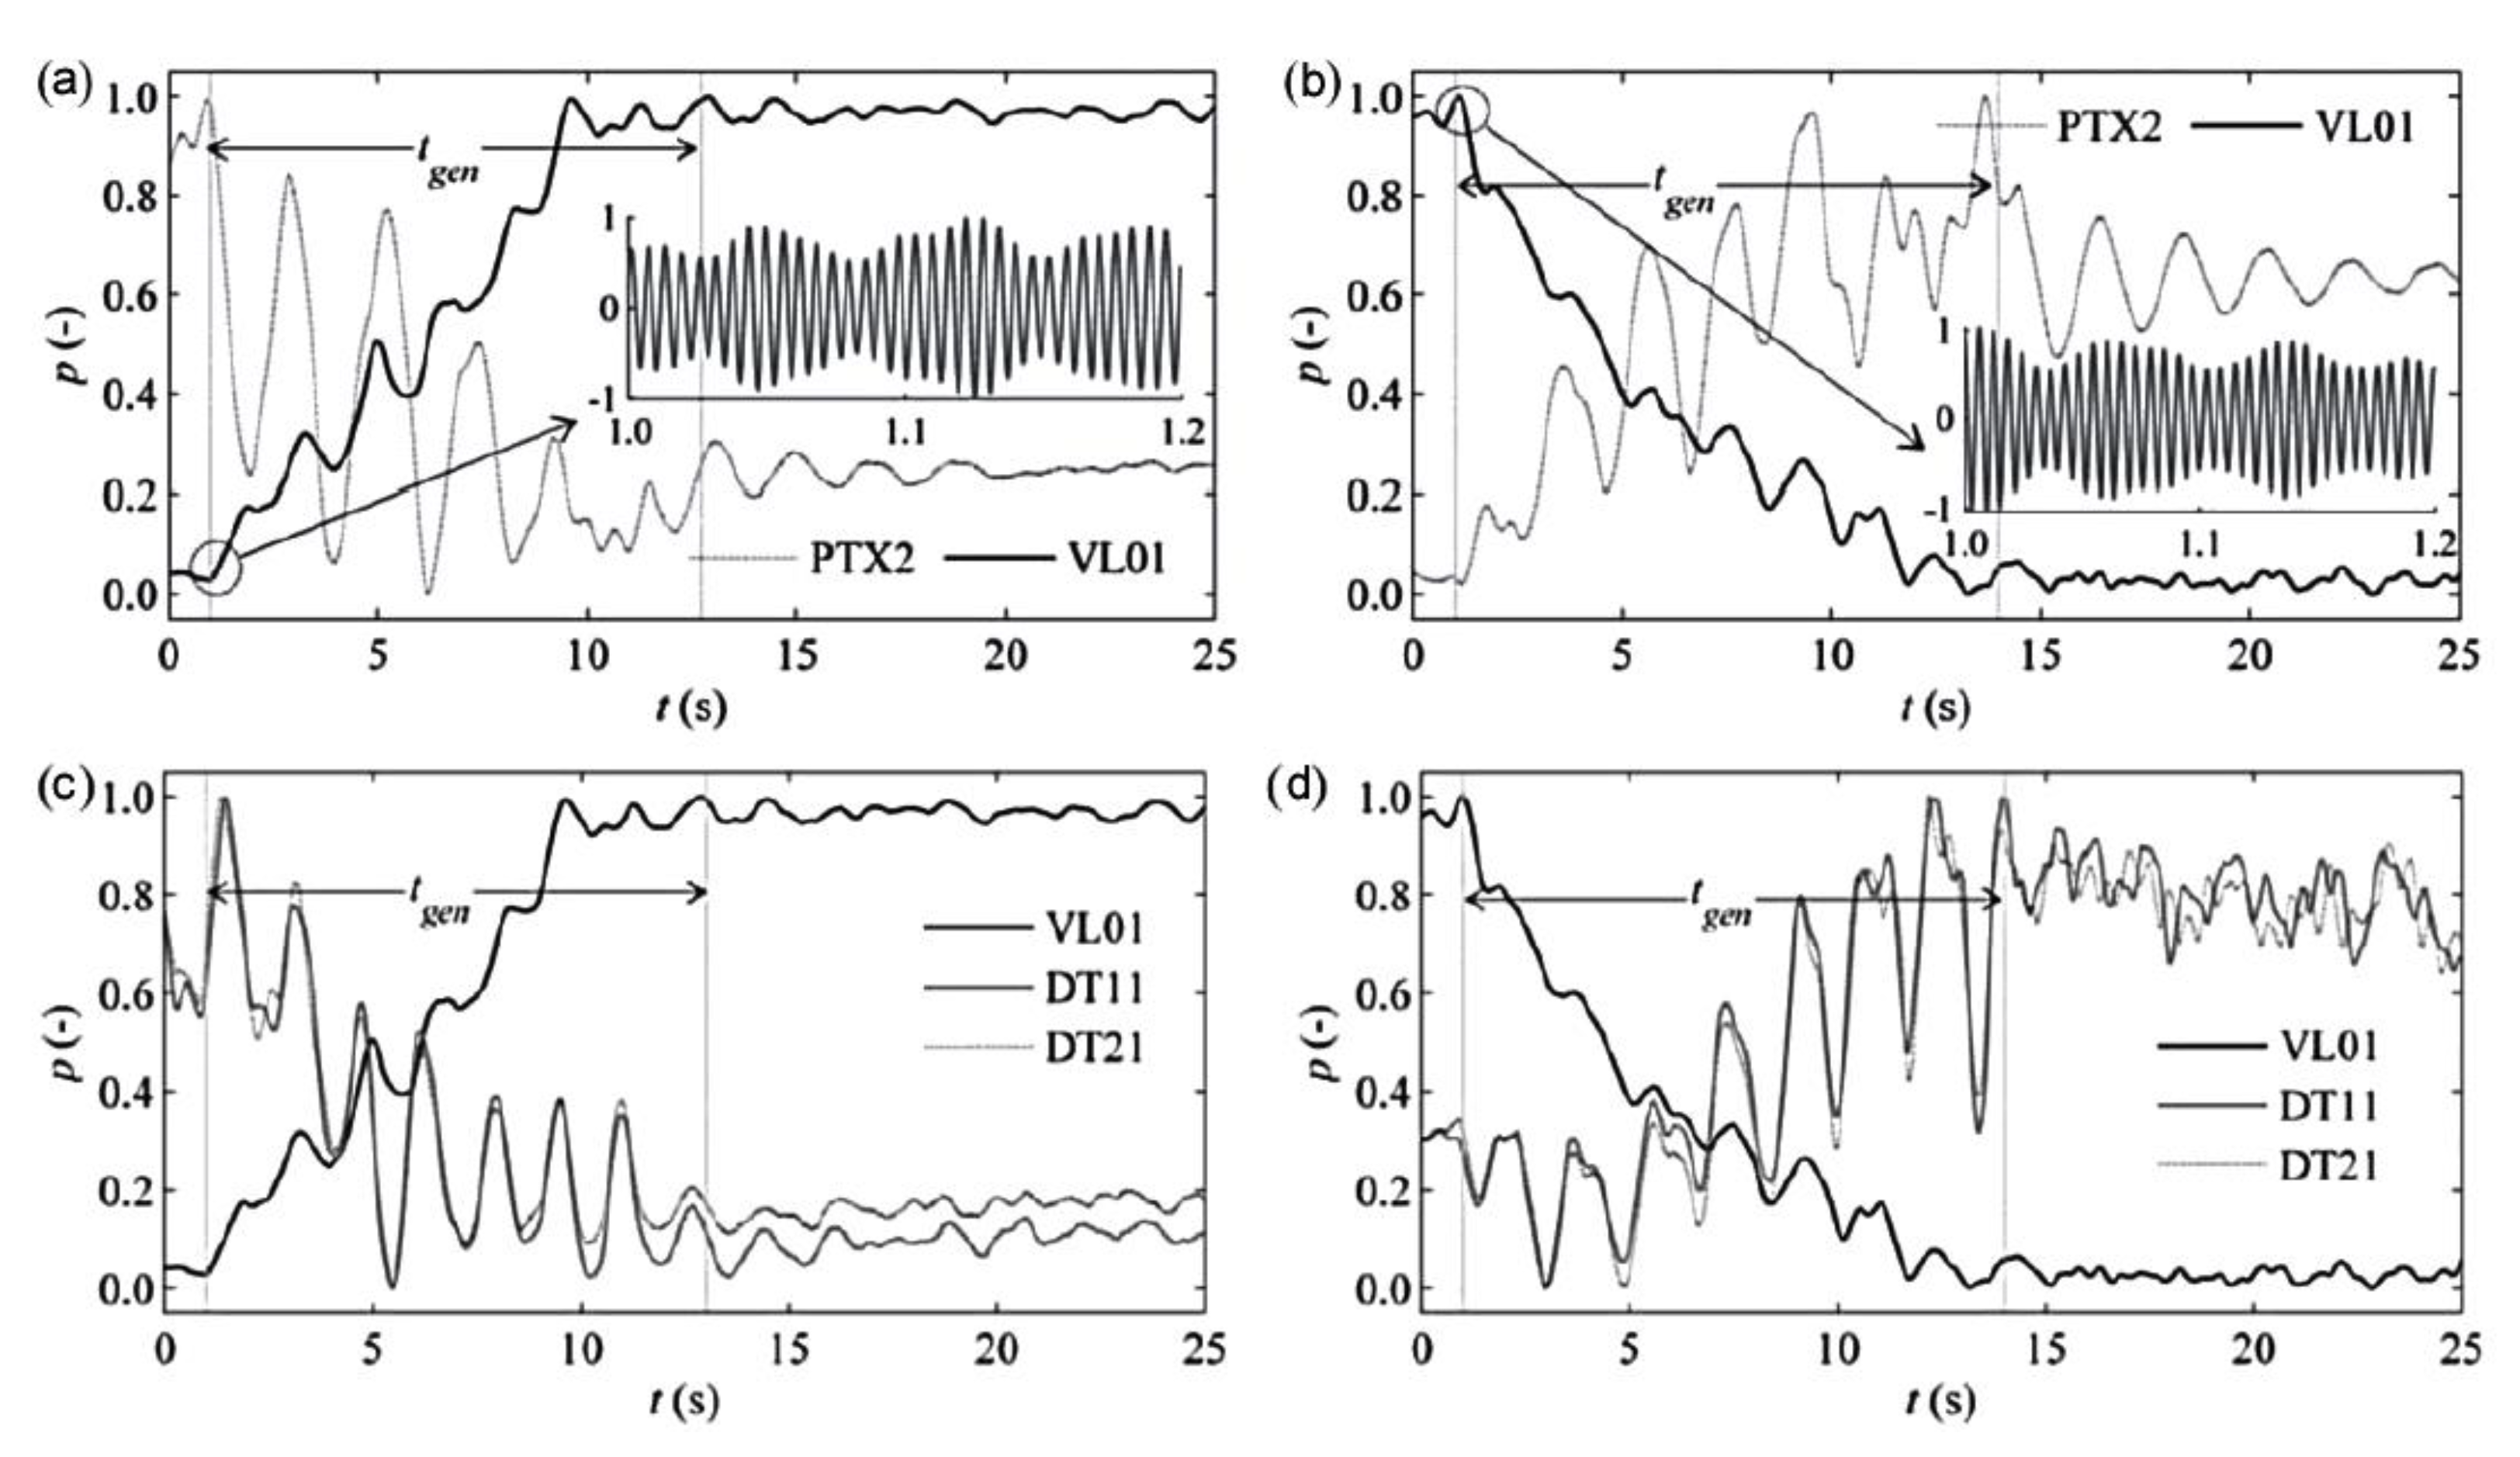
Another evolution and comparison of pressures for a bulb turbine measured in load rejection for the Slovenian power plant Vrhovo is shown in Figure 4b [89]. At “moment zero”, the emergency shutdown sequence sent the wicket gate (ydv on the upper image) closing and the runner blades (yrb on the upper image) opening. The unit accelerates and the speed rises (bold line on the upper graph). Concomitant to the maximum overspeed value, the pressure between the wicket gate and the runner (bold line on the lower graph) reaches its minimum and within 3 s goes to a maximum, near 120% of the steady pressure. In order to validate the numerical method ICCM COMET, the graphs also show the values from simulation for different computational grid scenarios (g1/2/3_UD/CD on the images).
In all cases, a clear interaction between HPU and HYP parameters is determined over time during a load rejection procedure. The following remarks are highlighted based on in situ investigations: (1) overpressure is not directly provoked because the flow is decreasing due to the wicket gate closure (the maximum pressures occur when the wicket gates are still wide open and not when they are about to finish the closing stroke); (2) the advanced overpressure peak is due eventually to the sharp reduction of the flow by the wicket gates combined with another factor (e.g., sudden change in the flow direction); (3) the late overpressure peak could come from the instability induced in the flow by the draft tube pressure fluctuations; (4) the runner “disturbs” the flow, inducing pressure fluctuations.

3.4. Second Slope Influence

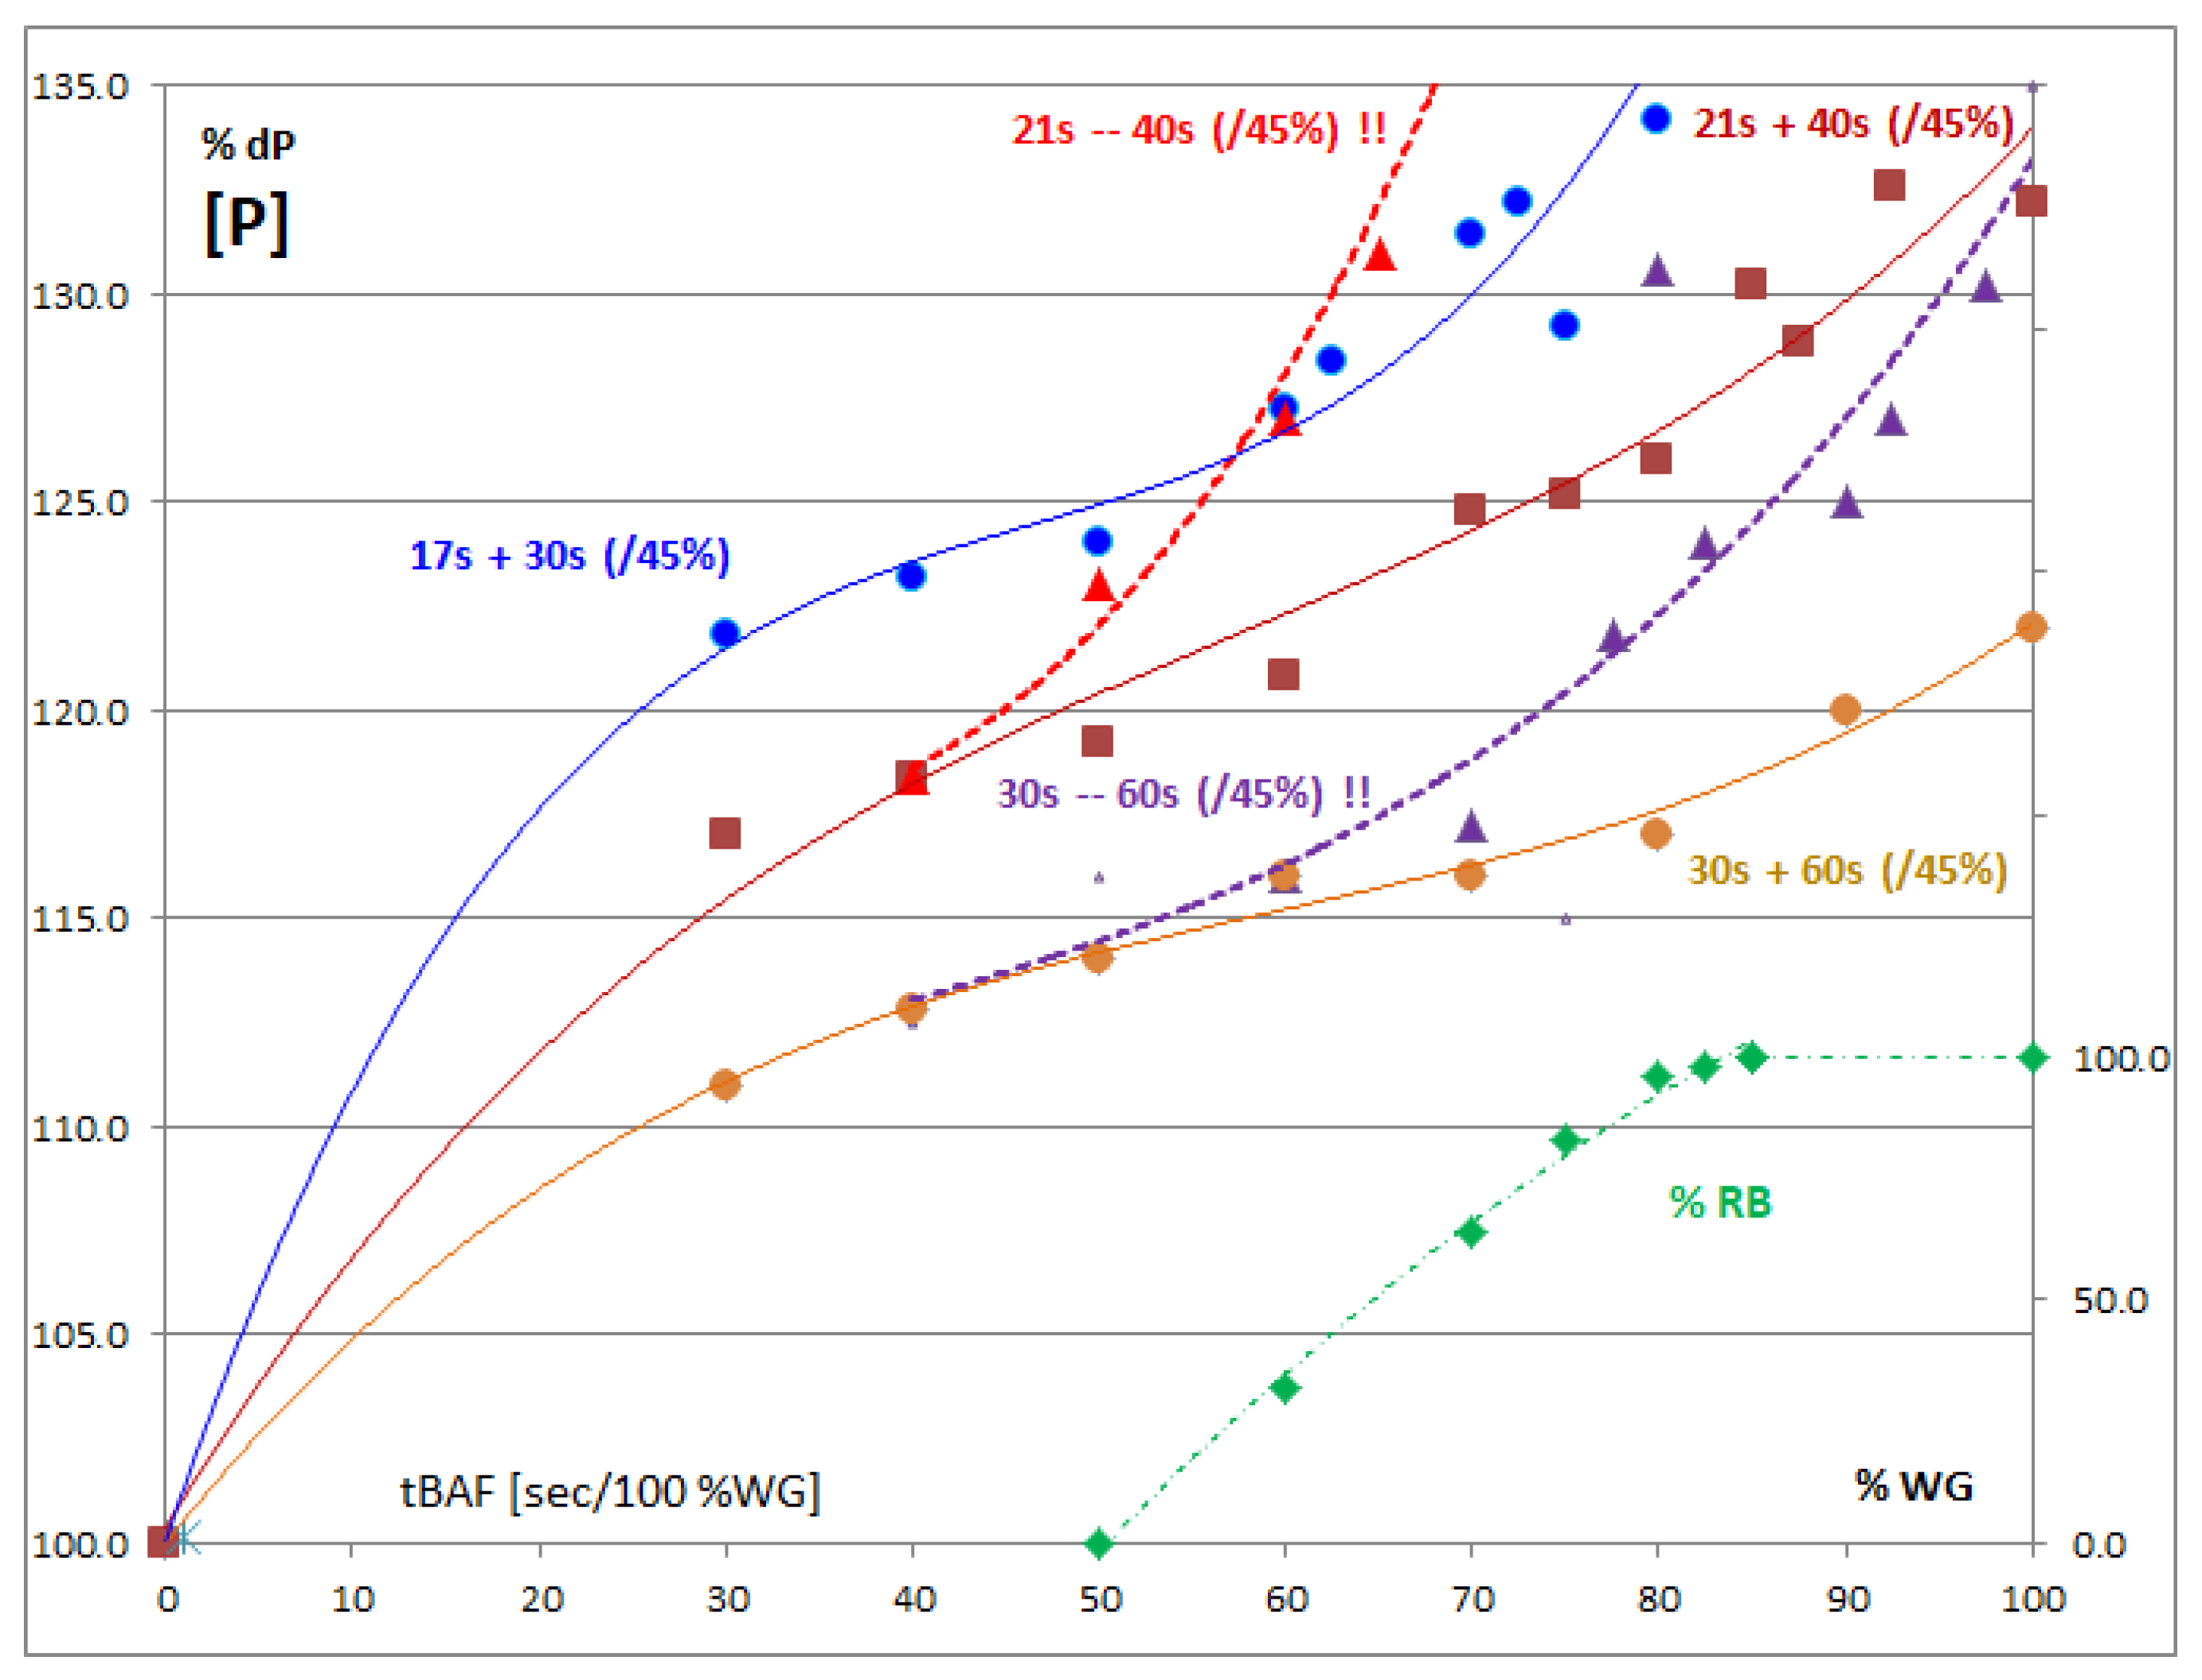
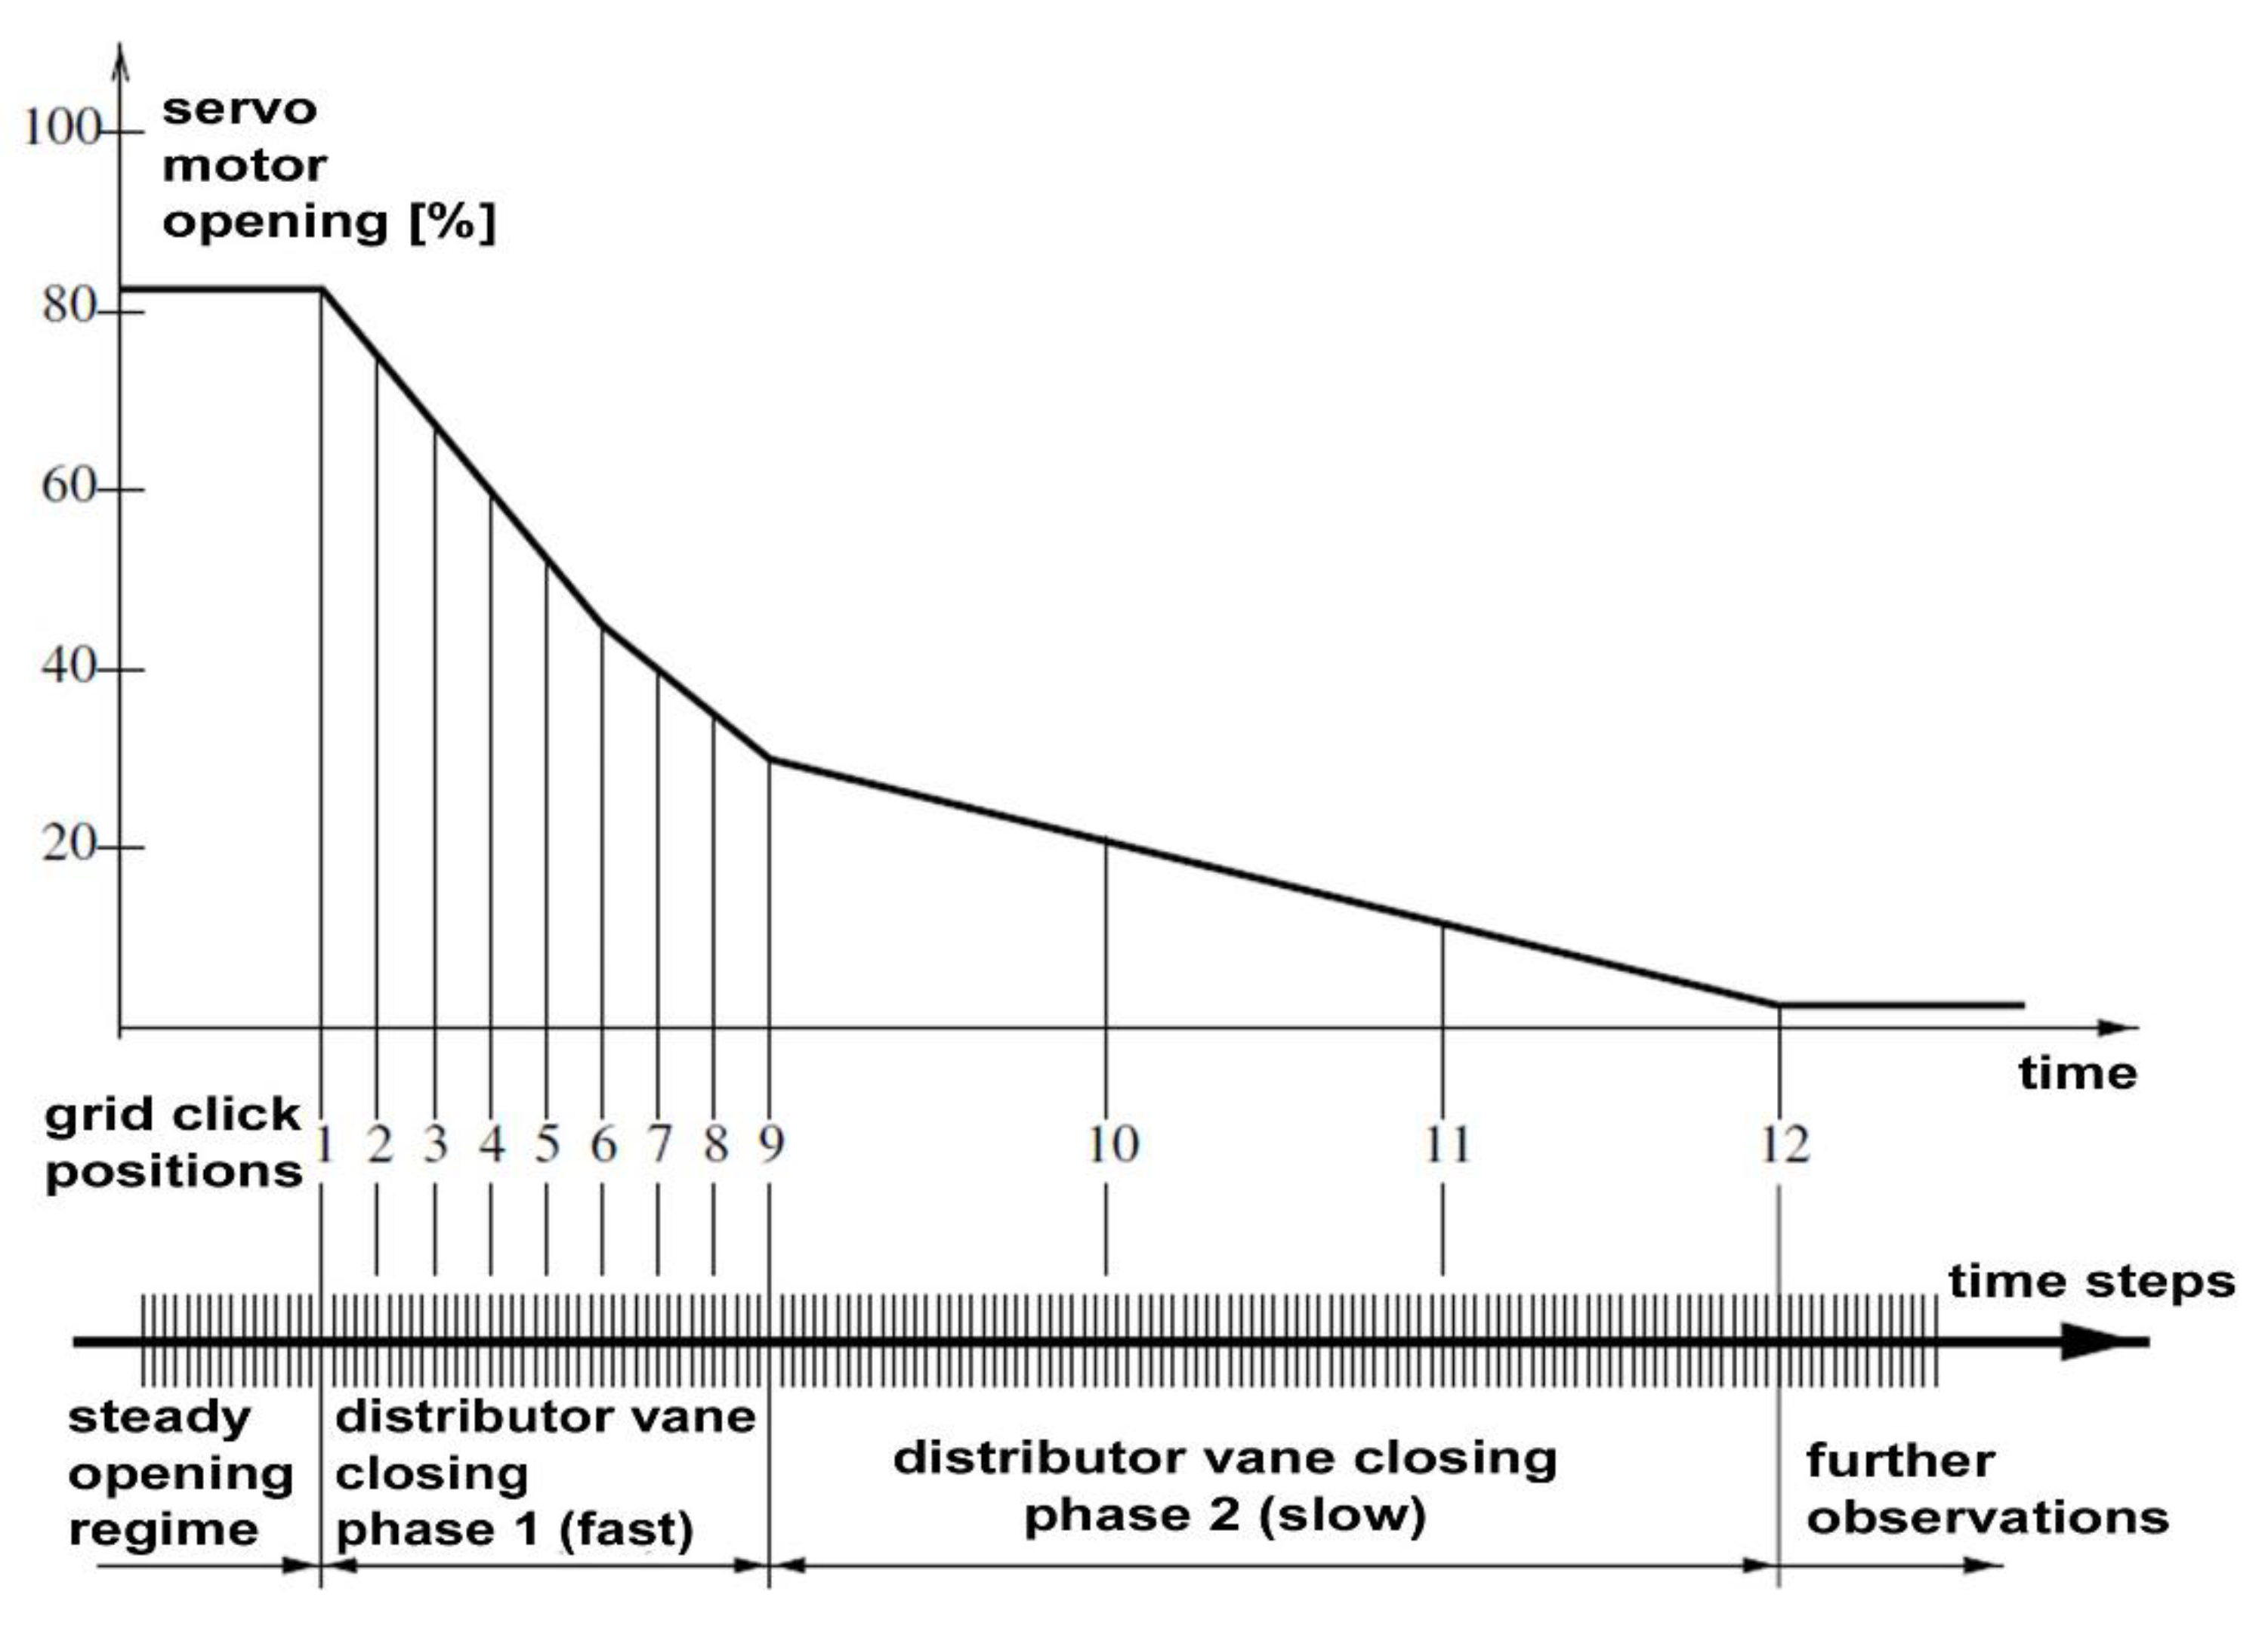
In the case of a Kaplan turbine operated in a hydropower plant, accidental failure of the valve ensuring the second closing slope caused a significant rise in spiral case overpressure and Figure 5 shows overpressure values for three different tBAFs. The continuous lines represent the pressures obtained with a second slope closing below 45% opening for the wicket gates, while the dotted lines show the pressure rise when the slow valve is off service.
The second slope aroused interest in others as well. Figure 6 shows an example of the wicket gates closing low following a second slow phase.
Based on the observed interactions, we can conclude that the second slope has a significant effect on rising pressure, so the second slope closure of the wicket gates is among the influencing factors for overpressure. Moreover, the faster the first rate tBAF, the greater the influence of the second slope on higher overpressures. These results allow us to list the second slope closure of the wicket gates among the key influencing factors for overpressure.

3.5. Overpressure in Closing Sequence from Speed-No-Load

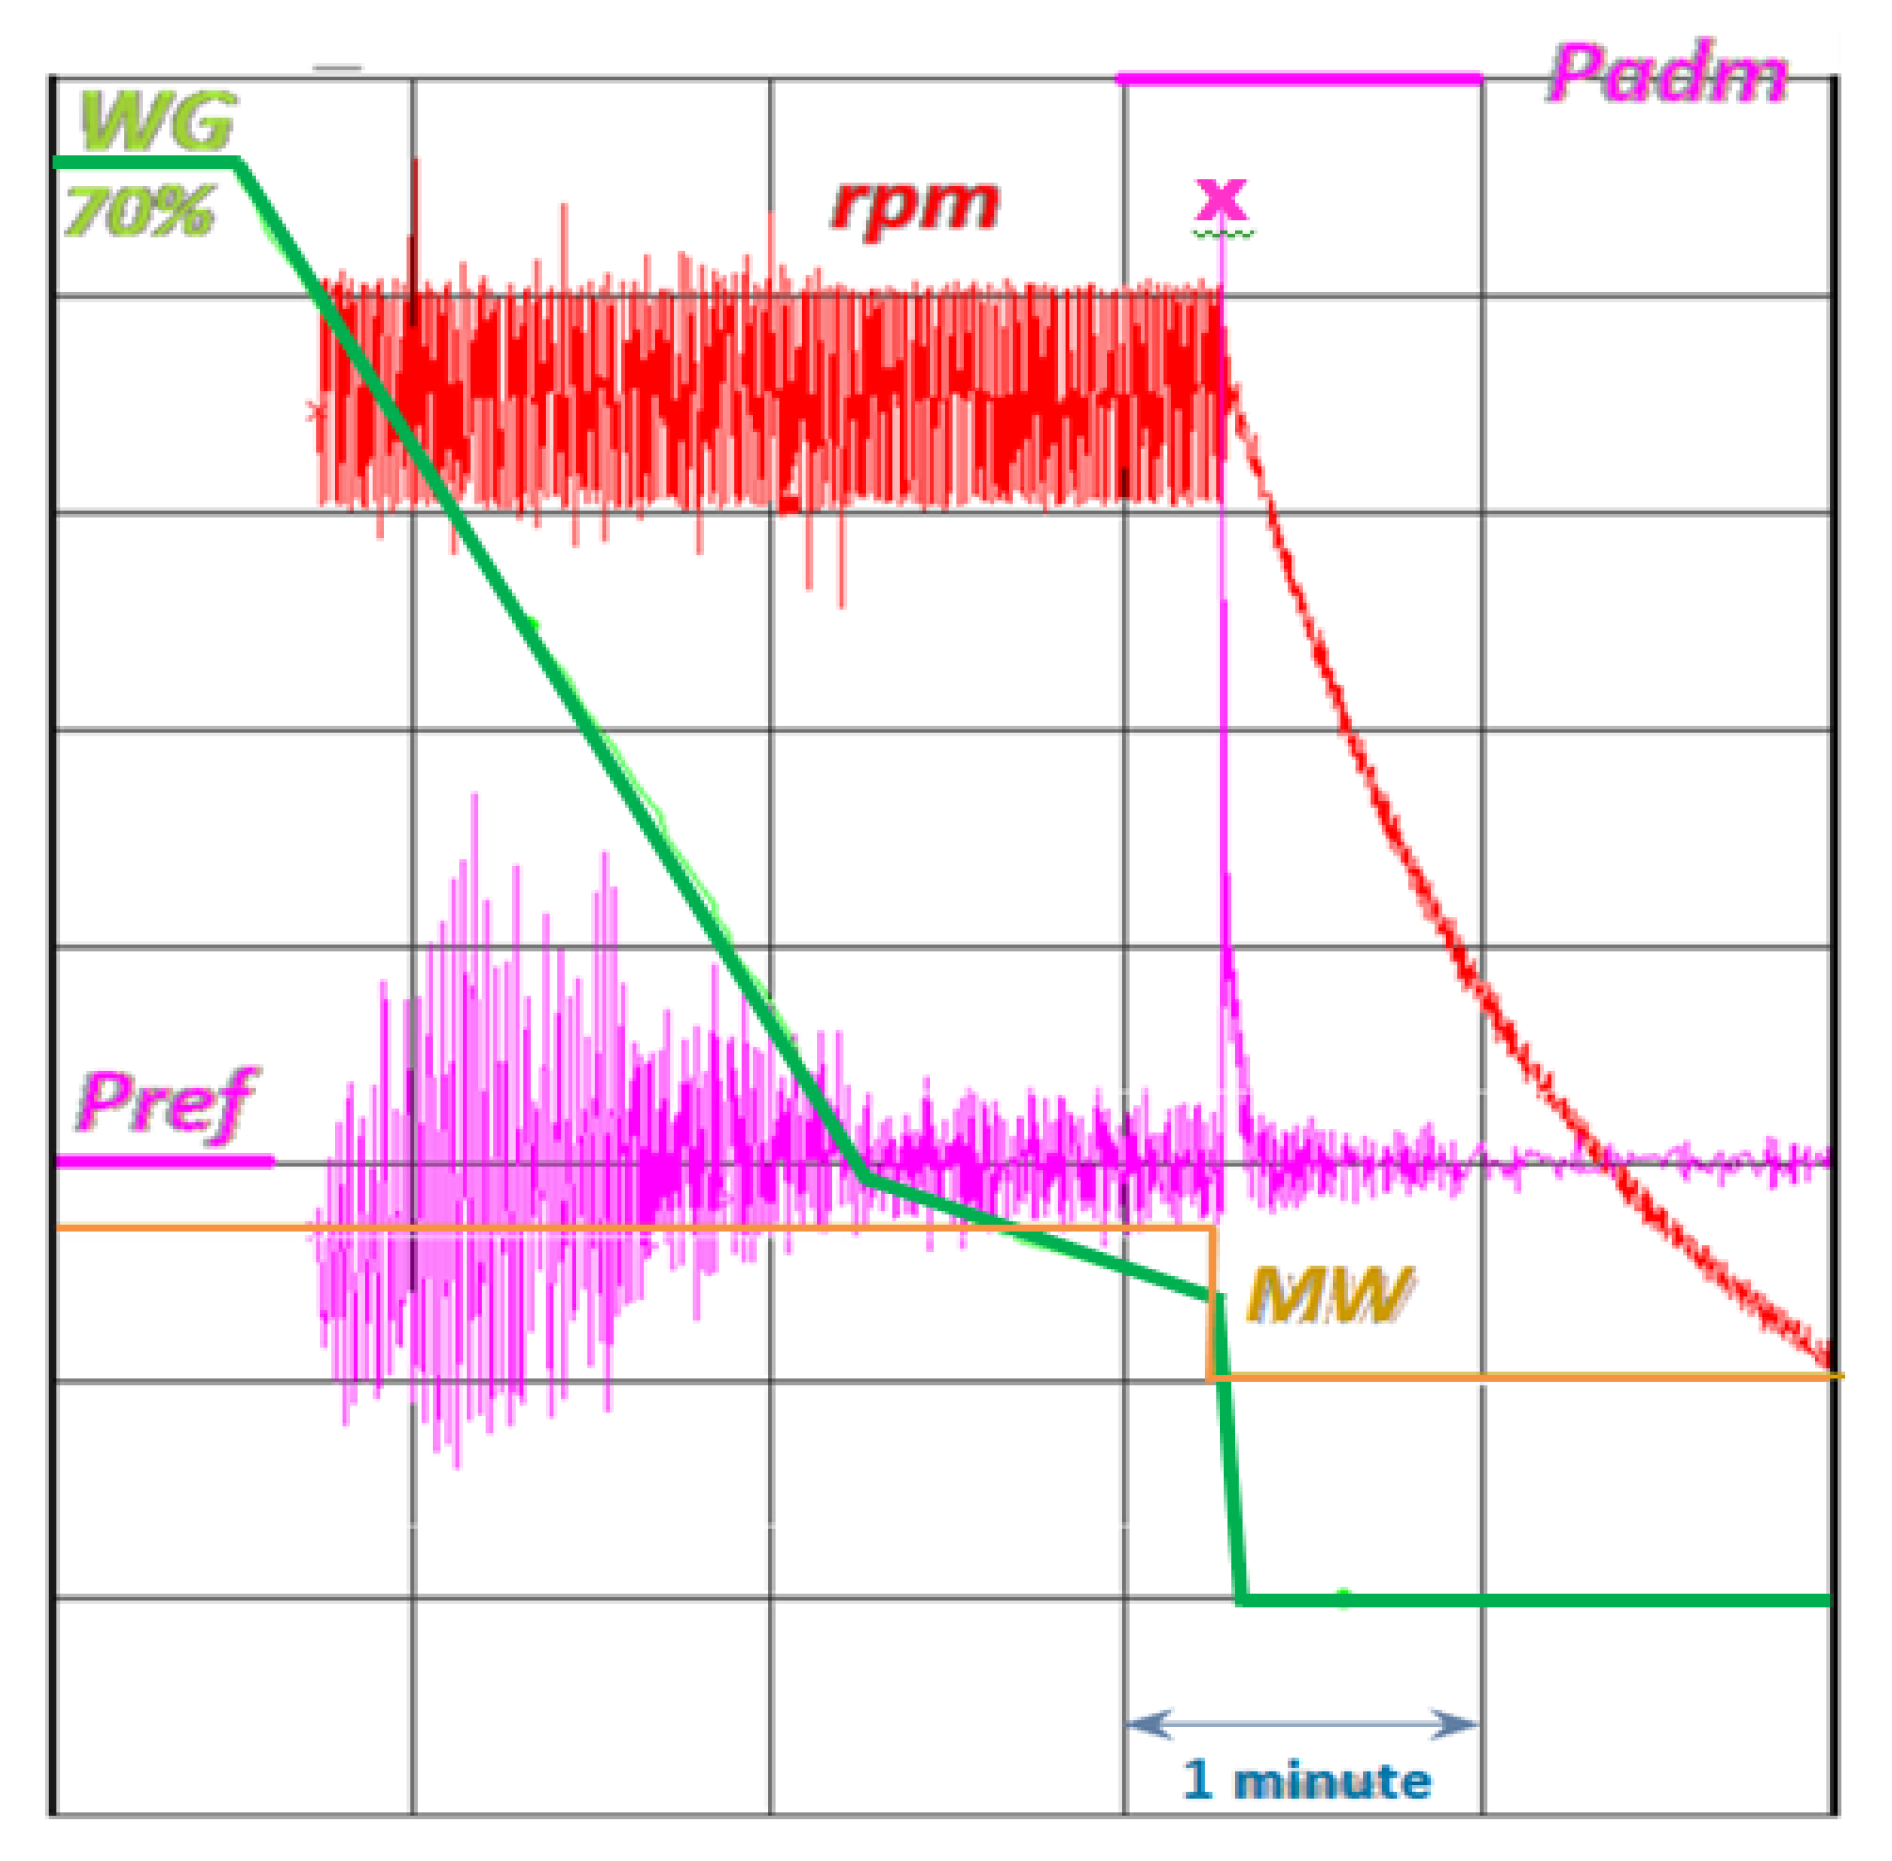
For a power plant equipped with Francis turbines, Figure 7 shows a significant overpressure in the spiral case at the end of an automatic shutdown sequence.
On the recorded parameters, we see the unit executing a normal power drop (within about 3 min), the load is controlled by the governor. At “moment zero” for our study, the wicket gate (WG, green line on the graph) reached the speed-no-load position (about 14% stroke), the runner is turning at synchronous speed (rpm, red line on the graph), so the general breaker (MW, orange line on the graph) opens to disconnect the unit from the power grid. According to the normal operating sequence, the wicket gates are sent in shutdown on the rapid closure slope (tBAF = 15 s/100% stroke). During the transient zone, the spiral case pressure (magenta line on the graph) fluctuated by approximately ±8% from either side of the reference pressure (Pref, magenta bold line on the graph), but at “moment zero”, it surprisingly spikes by about 122% (magenta “x” on the graph) of the reference pressure, near the MAWP (Padm magenta bold line on the graph, about 125% of the reference pressure).
We conclude that a significant water hammer may occur even while the flow is only a small fraction of the nominal (in our case around 20%).

3.6. Overpressure during Speed Regulation

While the unit is in operation, the transient phenomena can induce significant overpressure in the HYP. An example of a load drop for a Francis turbine at the power plant shows in Figure 8 the variation of the regulation parameters and the generated overpressures.
The graphs show the recorded data while the unit is executing a normal power drop followed by a normal shutdown from speed-no-load. The interactions between different parameters can be observed: wicket gates position (CoSM), unit speed (Speed), pressure at the spiral case intake (PrEnBa), pressure at the spiral case manhole (PrPoBa), pressure at the stay vanes (PrDist), pressure at the top of the draft tube manhole (PrPoAspiHaut), pressure at the bottom of the draft tube manhole (PrPoAspiBas). Pressure inside the spiral case particularly fluctuates while the unit is in normal operation.
During wicket gate movement for speed regulation in normal operation, or even in unit load variation, oscillations and instability occurs. During wicket gate movement for speed regulation at stable power on the grid (first red ellipse), all along the unit load variation (second red ellipse) or even during normal shutdown (third red ellipse), oscillations and instability phenomena occur which induce significant overpressures in the HYP.
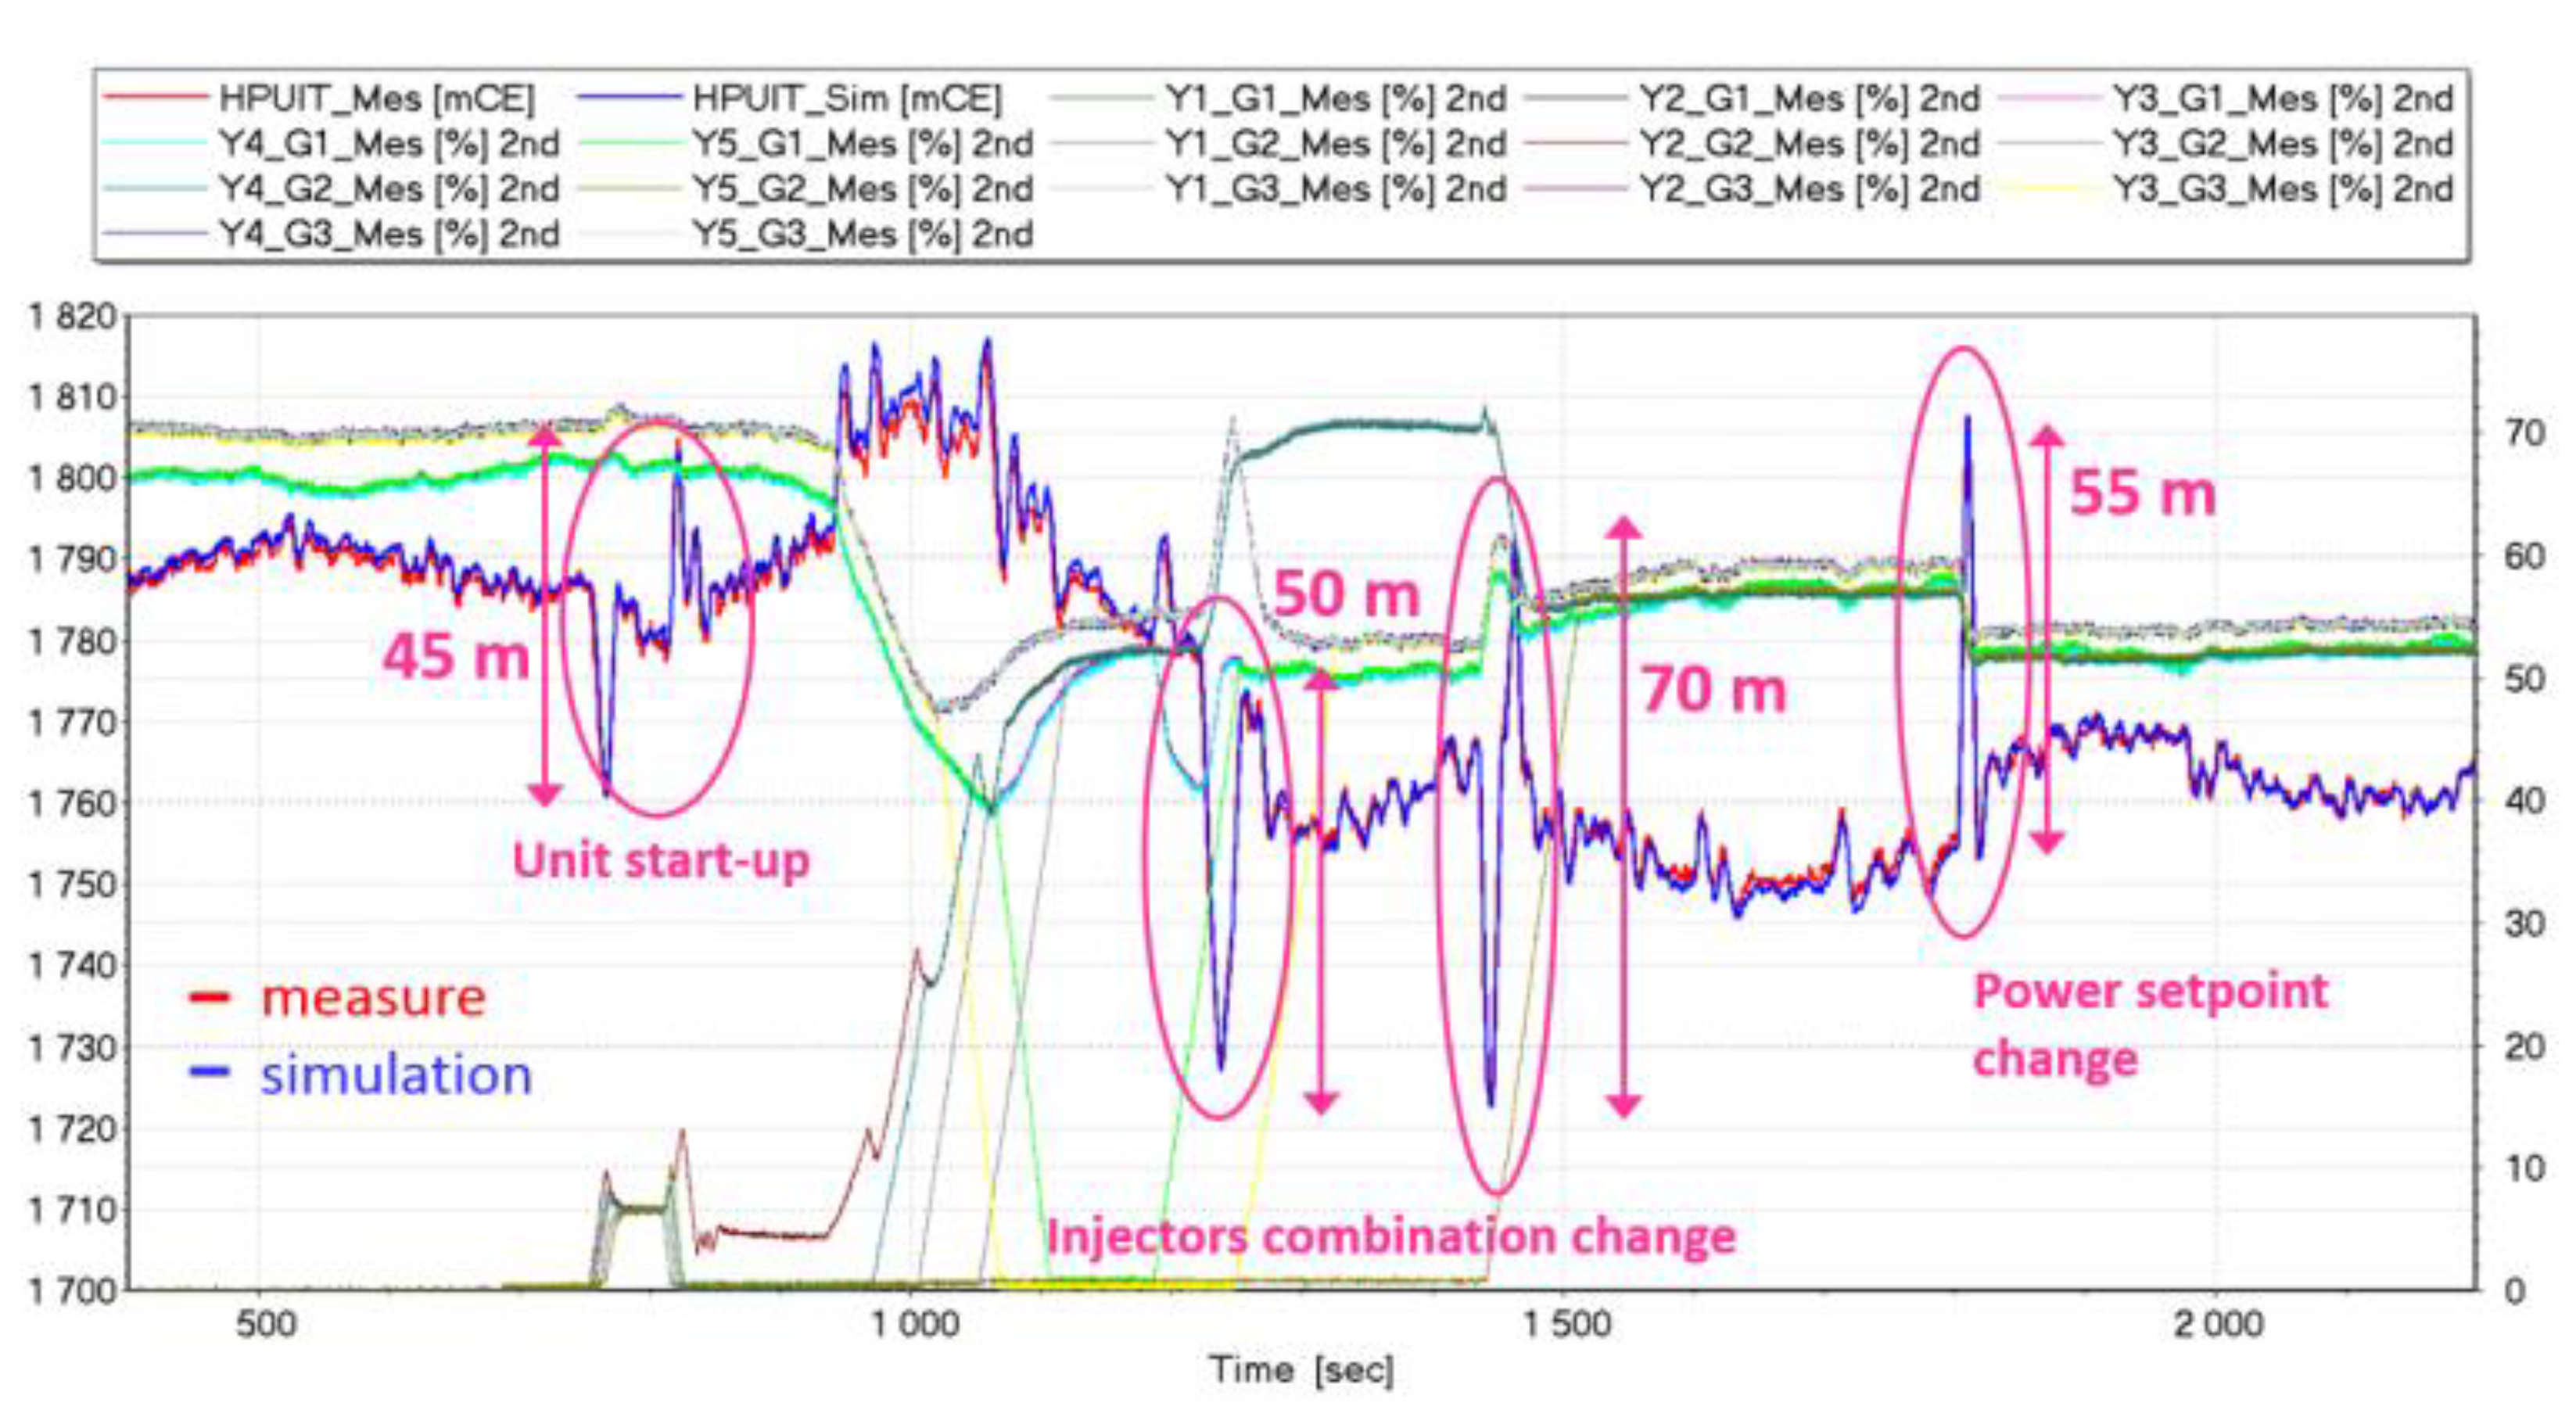
Pressure variation during normal unit operation by the governor was measured and compared with model predictions by Nicolet et al. [82] for a Pelton HPU. The results of the monitored transient pressures and the values issued from the SIMSEN simulation program are depicted in Figure 9.
The transient pressure variation during load acceptance and load rejection in normal operation by the governor was analyzed by Trivedi et al. [90] for a high-head Francis turbine model. The results are depicted in Figure 10.

4. Accidents in Hydropower Plants

A comprehensive database on severe accidents in the energy sector called Energy–Related Severe Accident Database (ENSAD) was developed by Paul Scherrer Institut (PSI) [91]. An accident is considered to be severe if it has one or more of the following consequences: (1) at least 5 fatalities; (2) at least 10 injured; (3) at least 200 evacuees; (4) extensive ban on consumption of food; (5) releases of hydrocarbons exceeding 10,000 t; (6) enforced clean–up of land and water over an area at least 25 km2; (7) economic loss of at least 5 million USD (2000). Hydro and nuclear power with no severe accident with direct fatalities are clearly less vulnerable, but the maximum possible hypothetical consequences could be very large [92]. In the case of hydro and nuclear the difference is in fact dramatic.
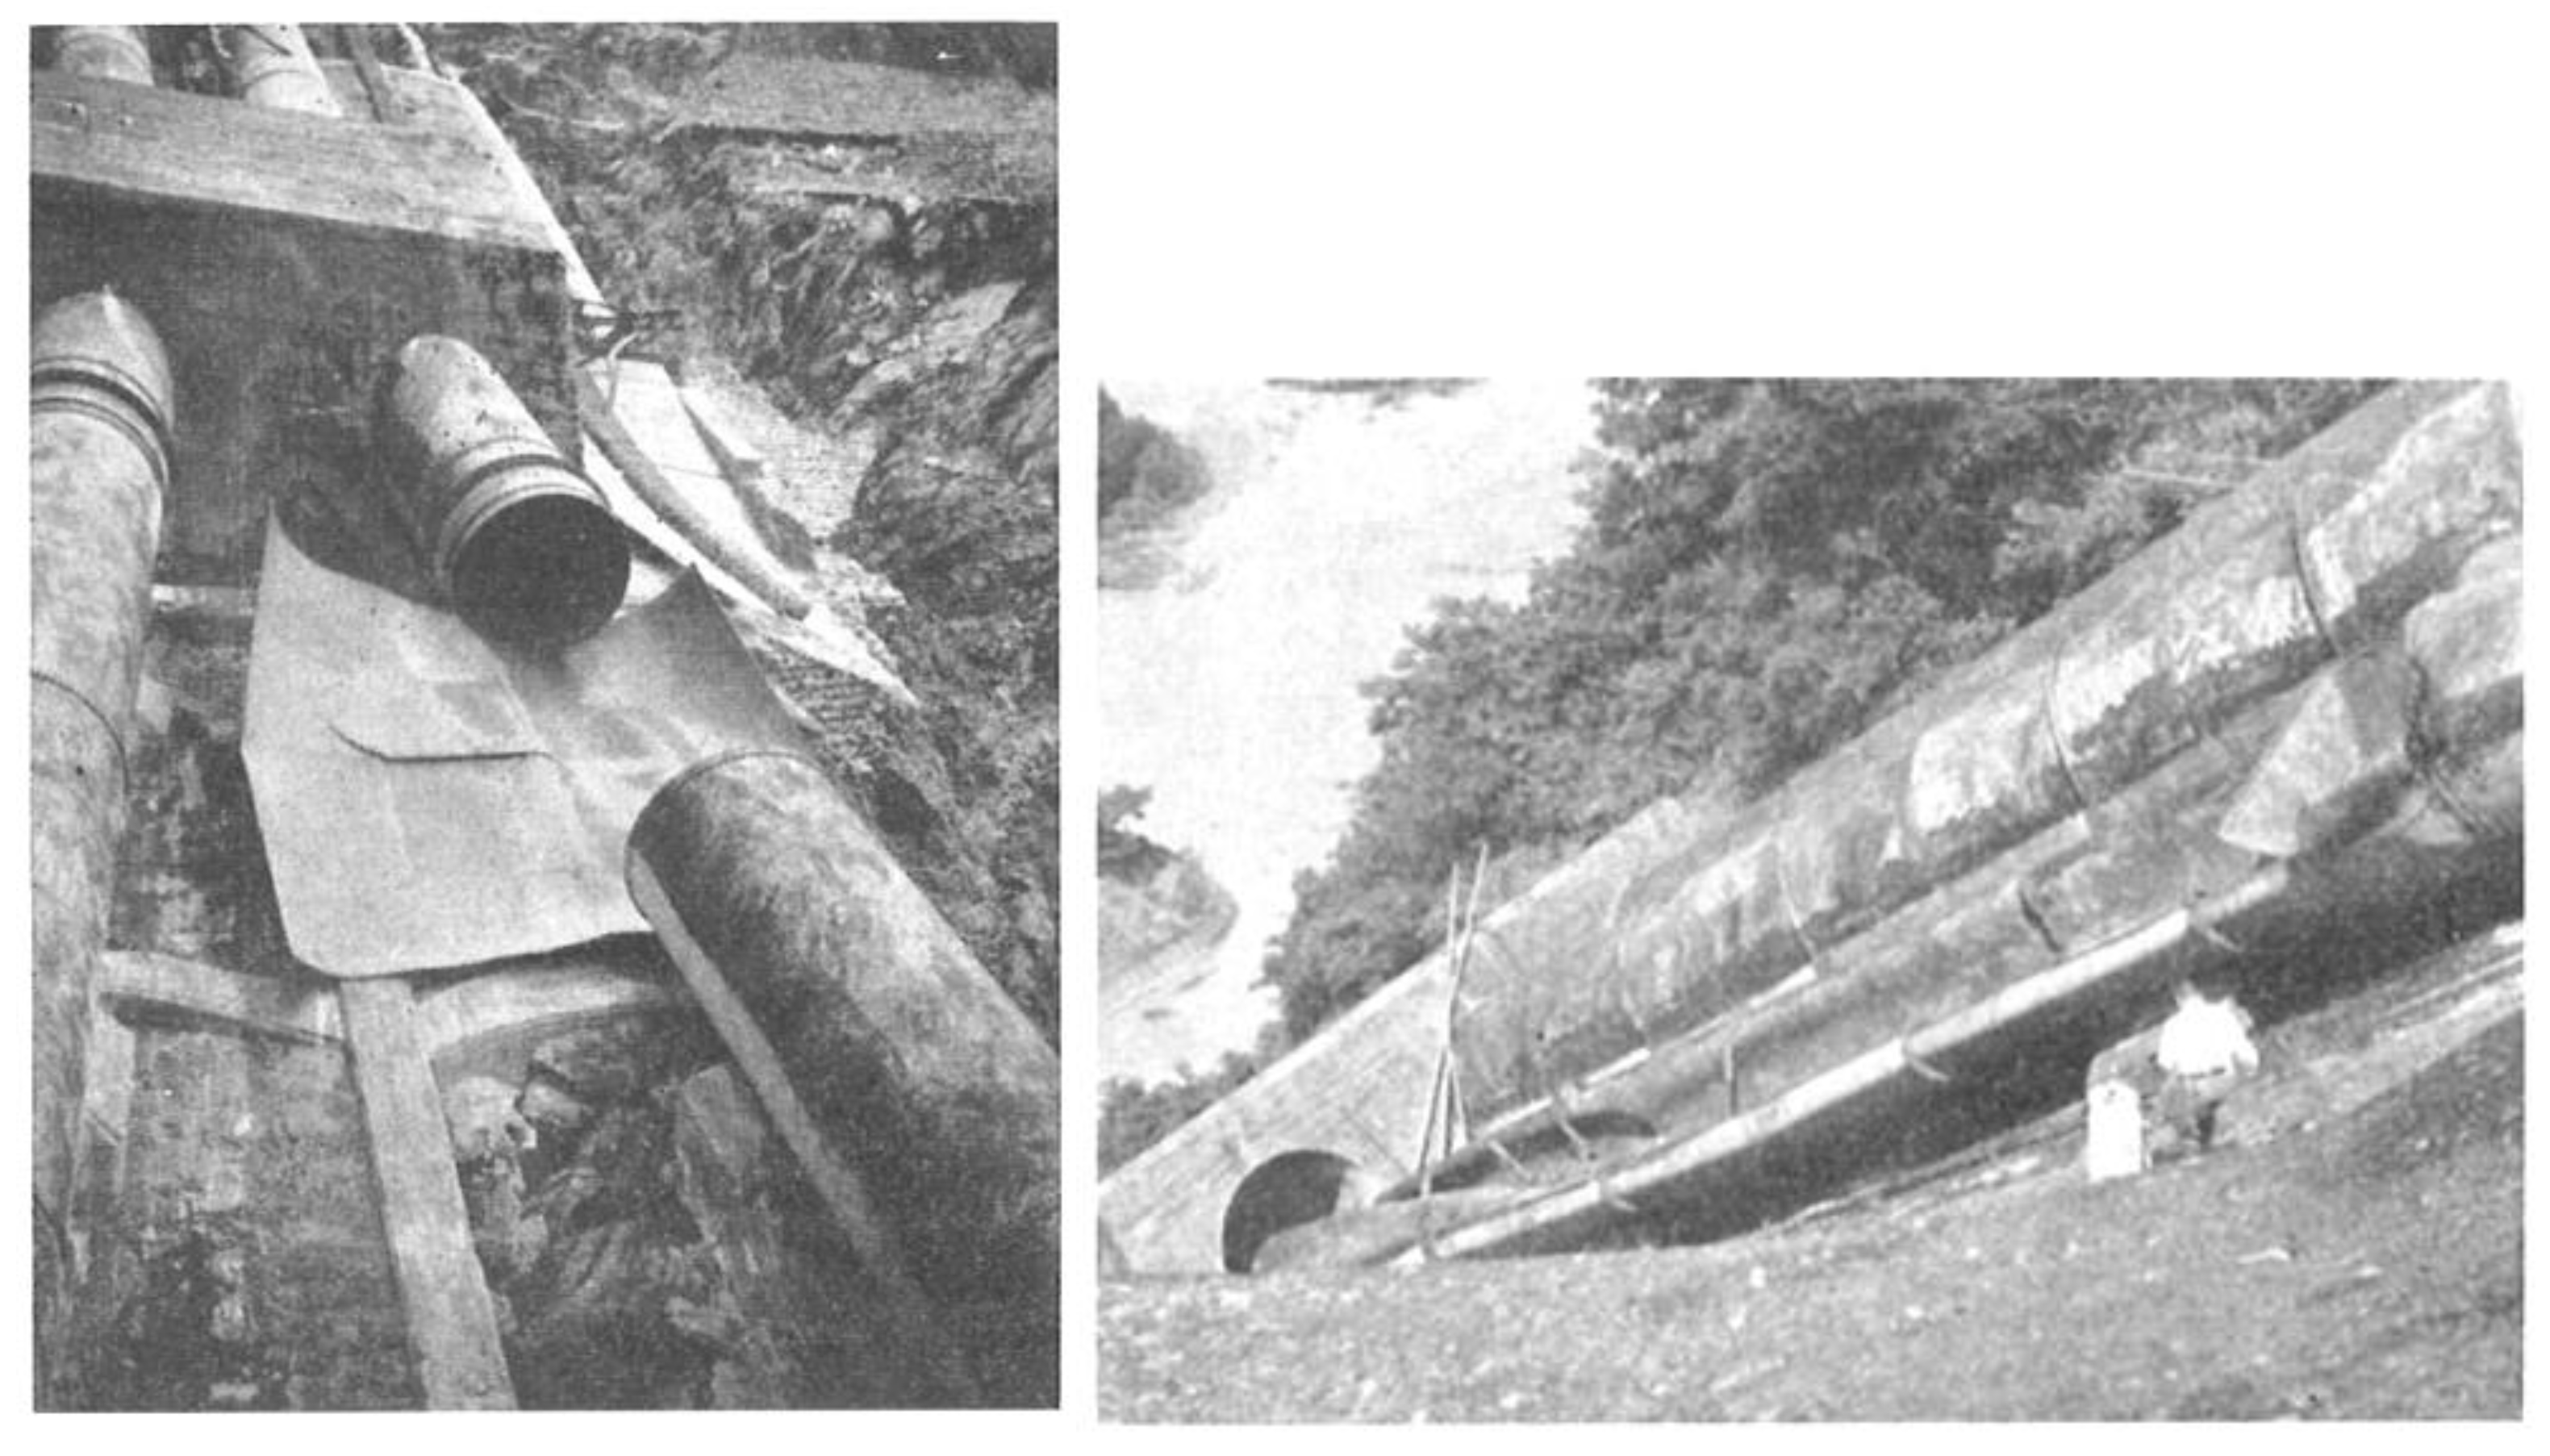
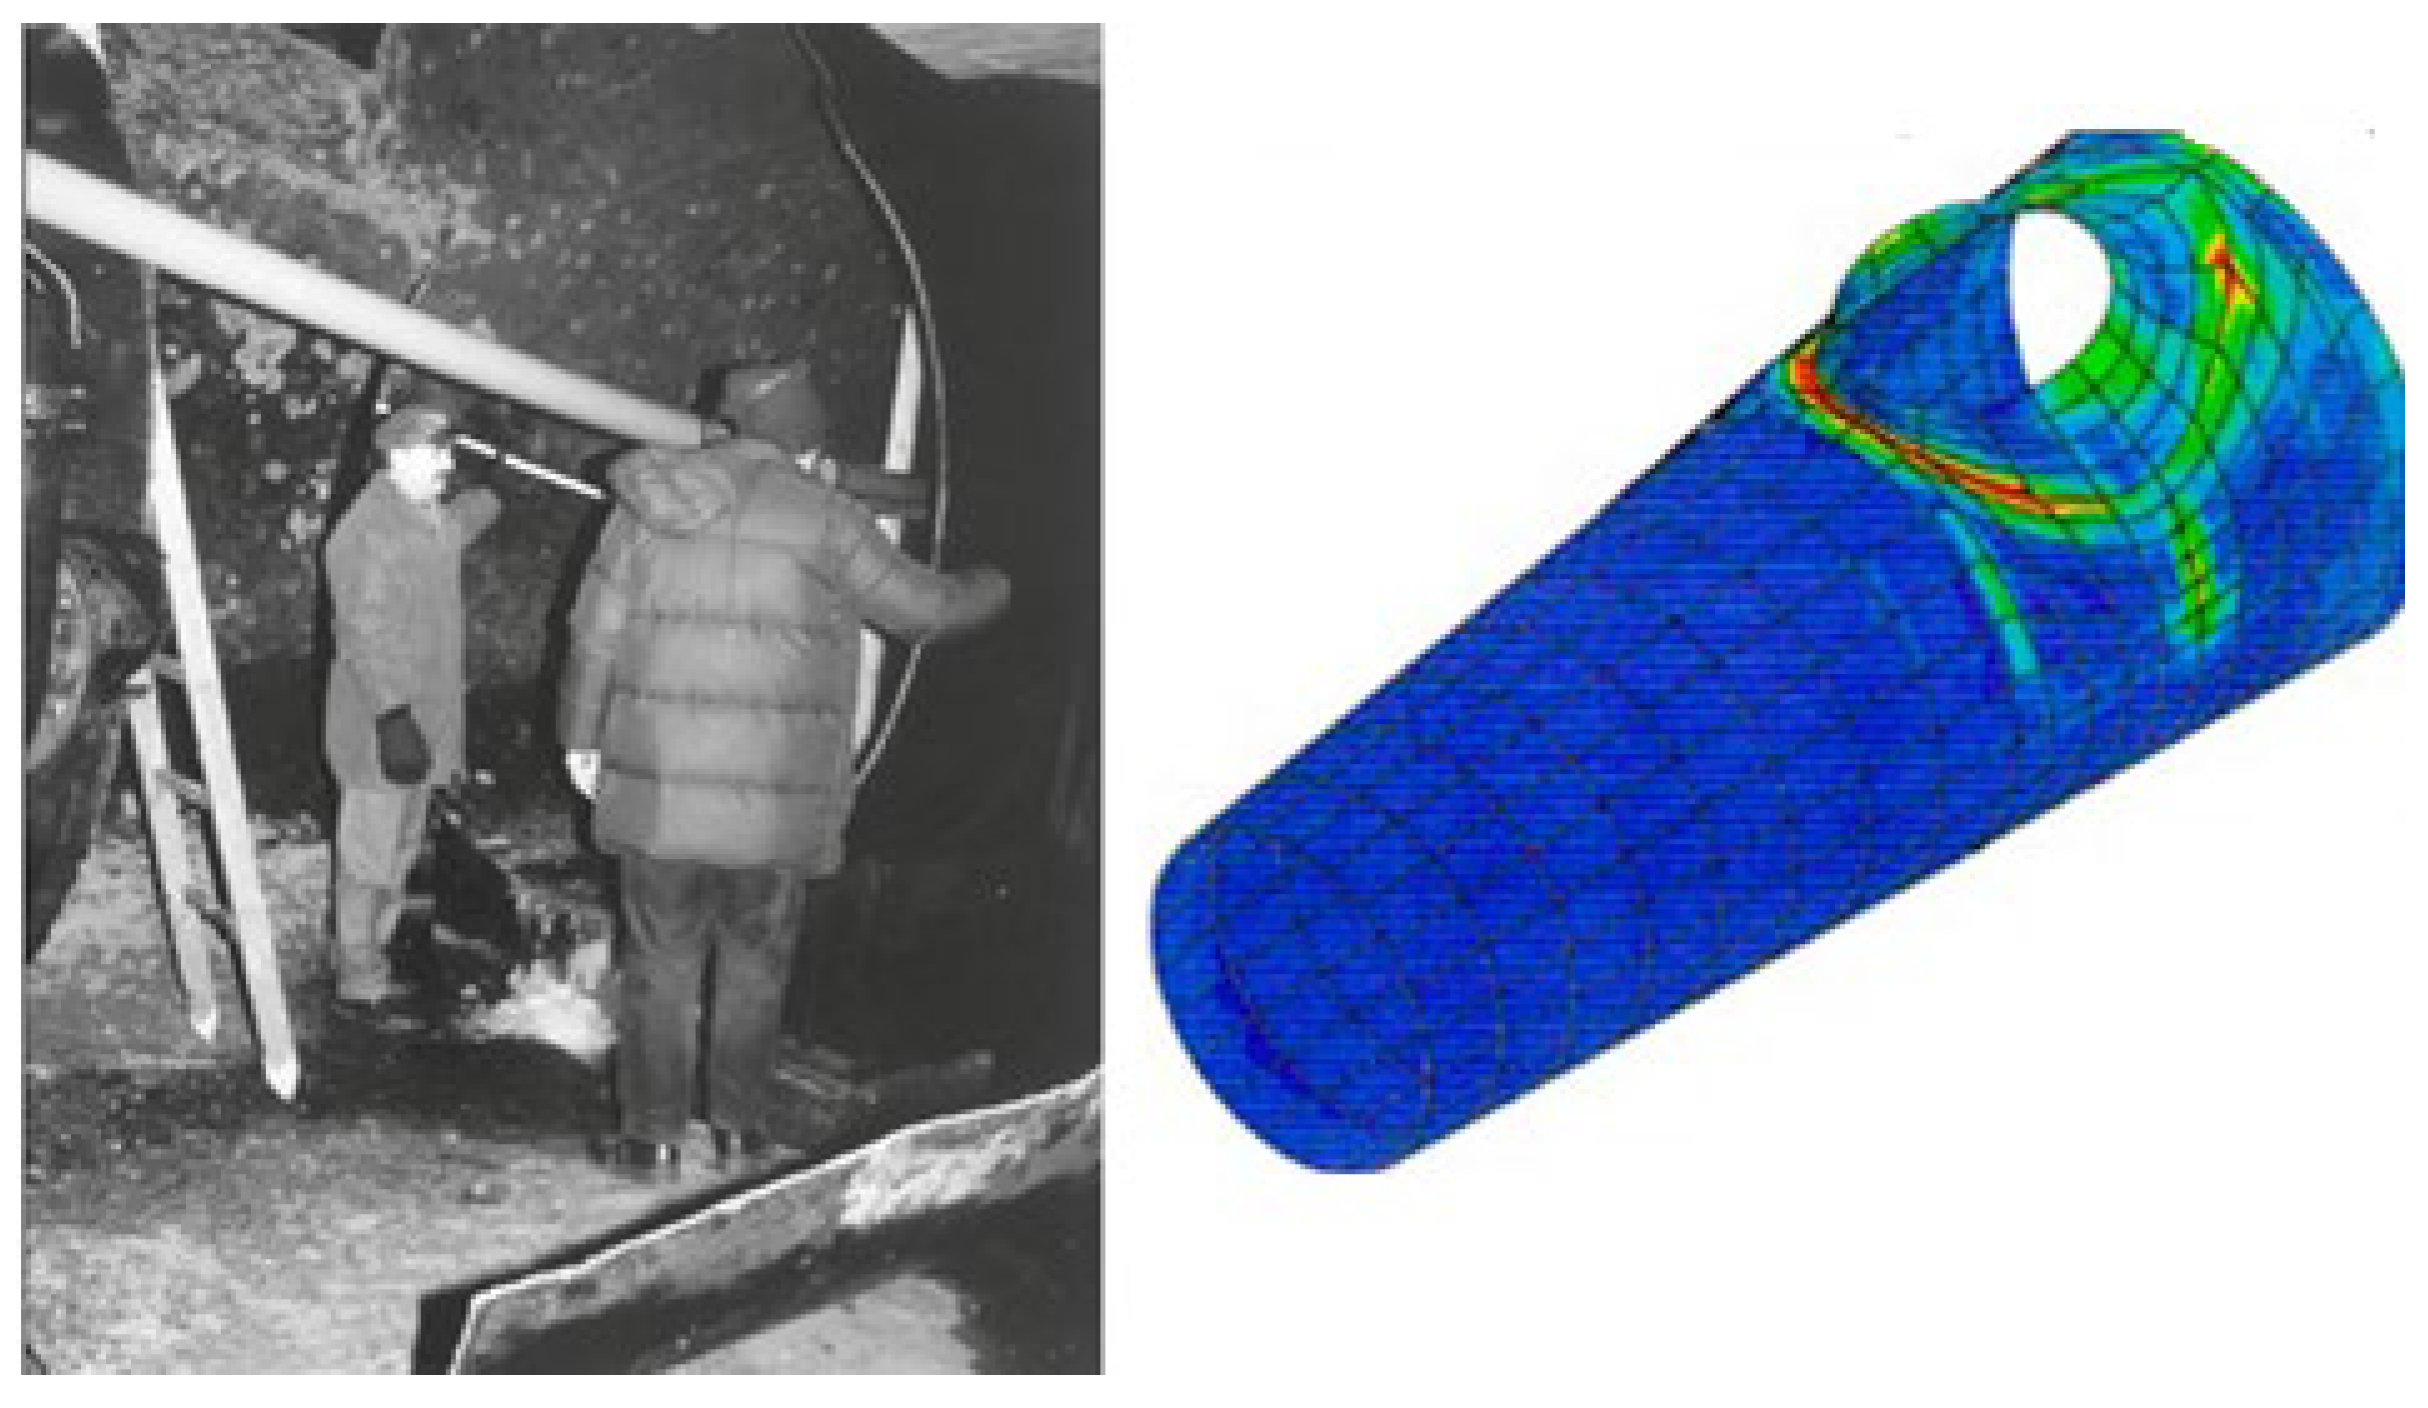
A catastrophic accident was reported at a Oigawa hydropower plant in 1950. The penstock burst 14 years after commissioning due to the sudden closing of a butterfly valve (see Figure 11). The main cause of the accident identified by Bonin [93] was the lack of a secure adjustment of the butterfly valve. This accident killed three employees, caused $500 million in damage and resulted in a 90 GWh energy loss at that time. This accident falls into the category of severe, according to the PSI classification.
Another accident happened at the Lapino hydropower plant in 1997 after 70 years in service. The steel penstock broke during a load rejection procedure of only 50% of the rated power during the acceptance tests of a new governor, Figure 12. In this case, the wicket gates rapid closure (tBAF) was preset at around 2 s for 100% stroke. Fatigue and corrosion during 70 years of operation were identified by Adamkowski [94,95] as the cause of this accident. Fatigue and corrosion affected the penstock MAWP, leading to low quality of the weld joints, as well a lack of strengthening at places of a large concentration of stresses also contributed to penstock failure [94,95].
A severe accident occured on 17 August 2009, at turbine no. 2 of the Sayano–Shushenskaya hydropower plant (SSHPP) [96]. This accident cost the lives of 75 peoples and nearly destroyed the 6400 MW powerhouse [97]. This accident also falls into the category of severe events according to the PSI classification. Sayano–Shushenskaya HPP is equipped with 10 Francis turbines of 650 MW under 194 m designed head making it the largest HPP in Russia and one of the largest in the world. As a result, hydro units no. 2, 7 and 9 were primary destroyed according to the first inspection performed at Sayano–Shushenskaya HPP [98]. It was found that the rupture of the cover attachment to turbine no. 2 has occurred as a result of stud metal fatigue [99]. The failure at Sayano–Shushenskaya HPP revealed a whole series of problems. The technical problems include: significant wear of basic hydropower equipment, lack of comprehensive monitor-ing of the technical condition, lack of automated systems and production safeguards for hydropower unit with respect to a number of important critical factors and vibrations that exceed an established threshold [100,101].
The probable cause of the accident at the Sayano–Shushenskaya HPP based on the examination of turbine No. 2 was the separation of the water column in the turbine draft tube during the load rejection. This transient regime was probably caused by turbine governors that had been sped up to an unsafe level in an attempt to improve frequency stability under changing electrical loads [97,102].

5. Discussion and Recommendations

An evident correlation exists between maximum overpressure values and wicket gate rapid closure. A trend was observed for overpressure function of wicket gate opening at the time of load rejection. The parameters of the related third-order polynomial equations remain to be confirmed and detailed.
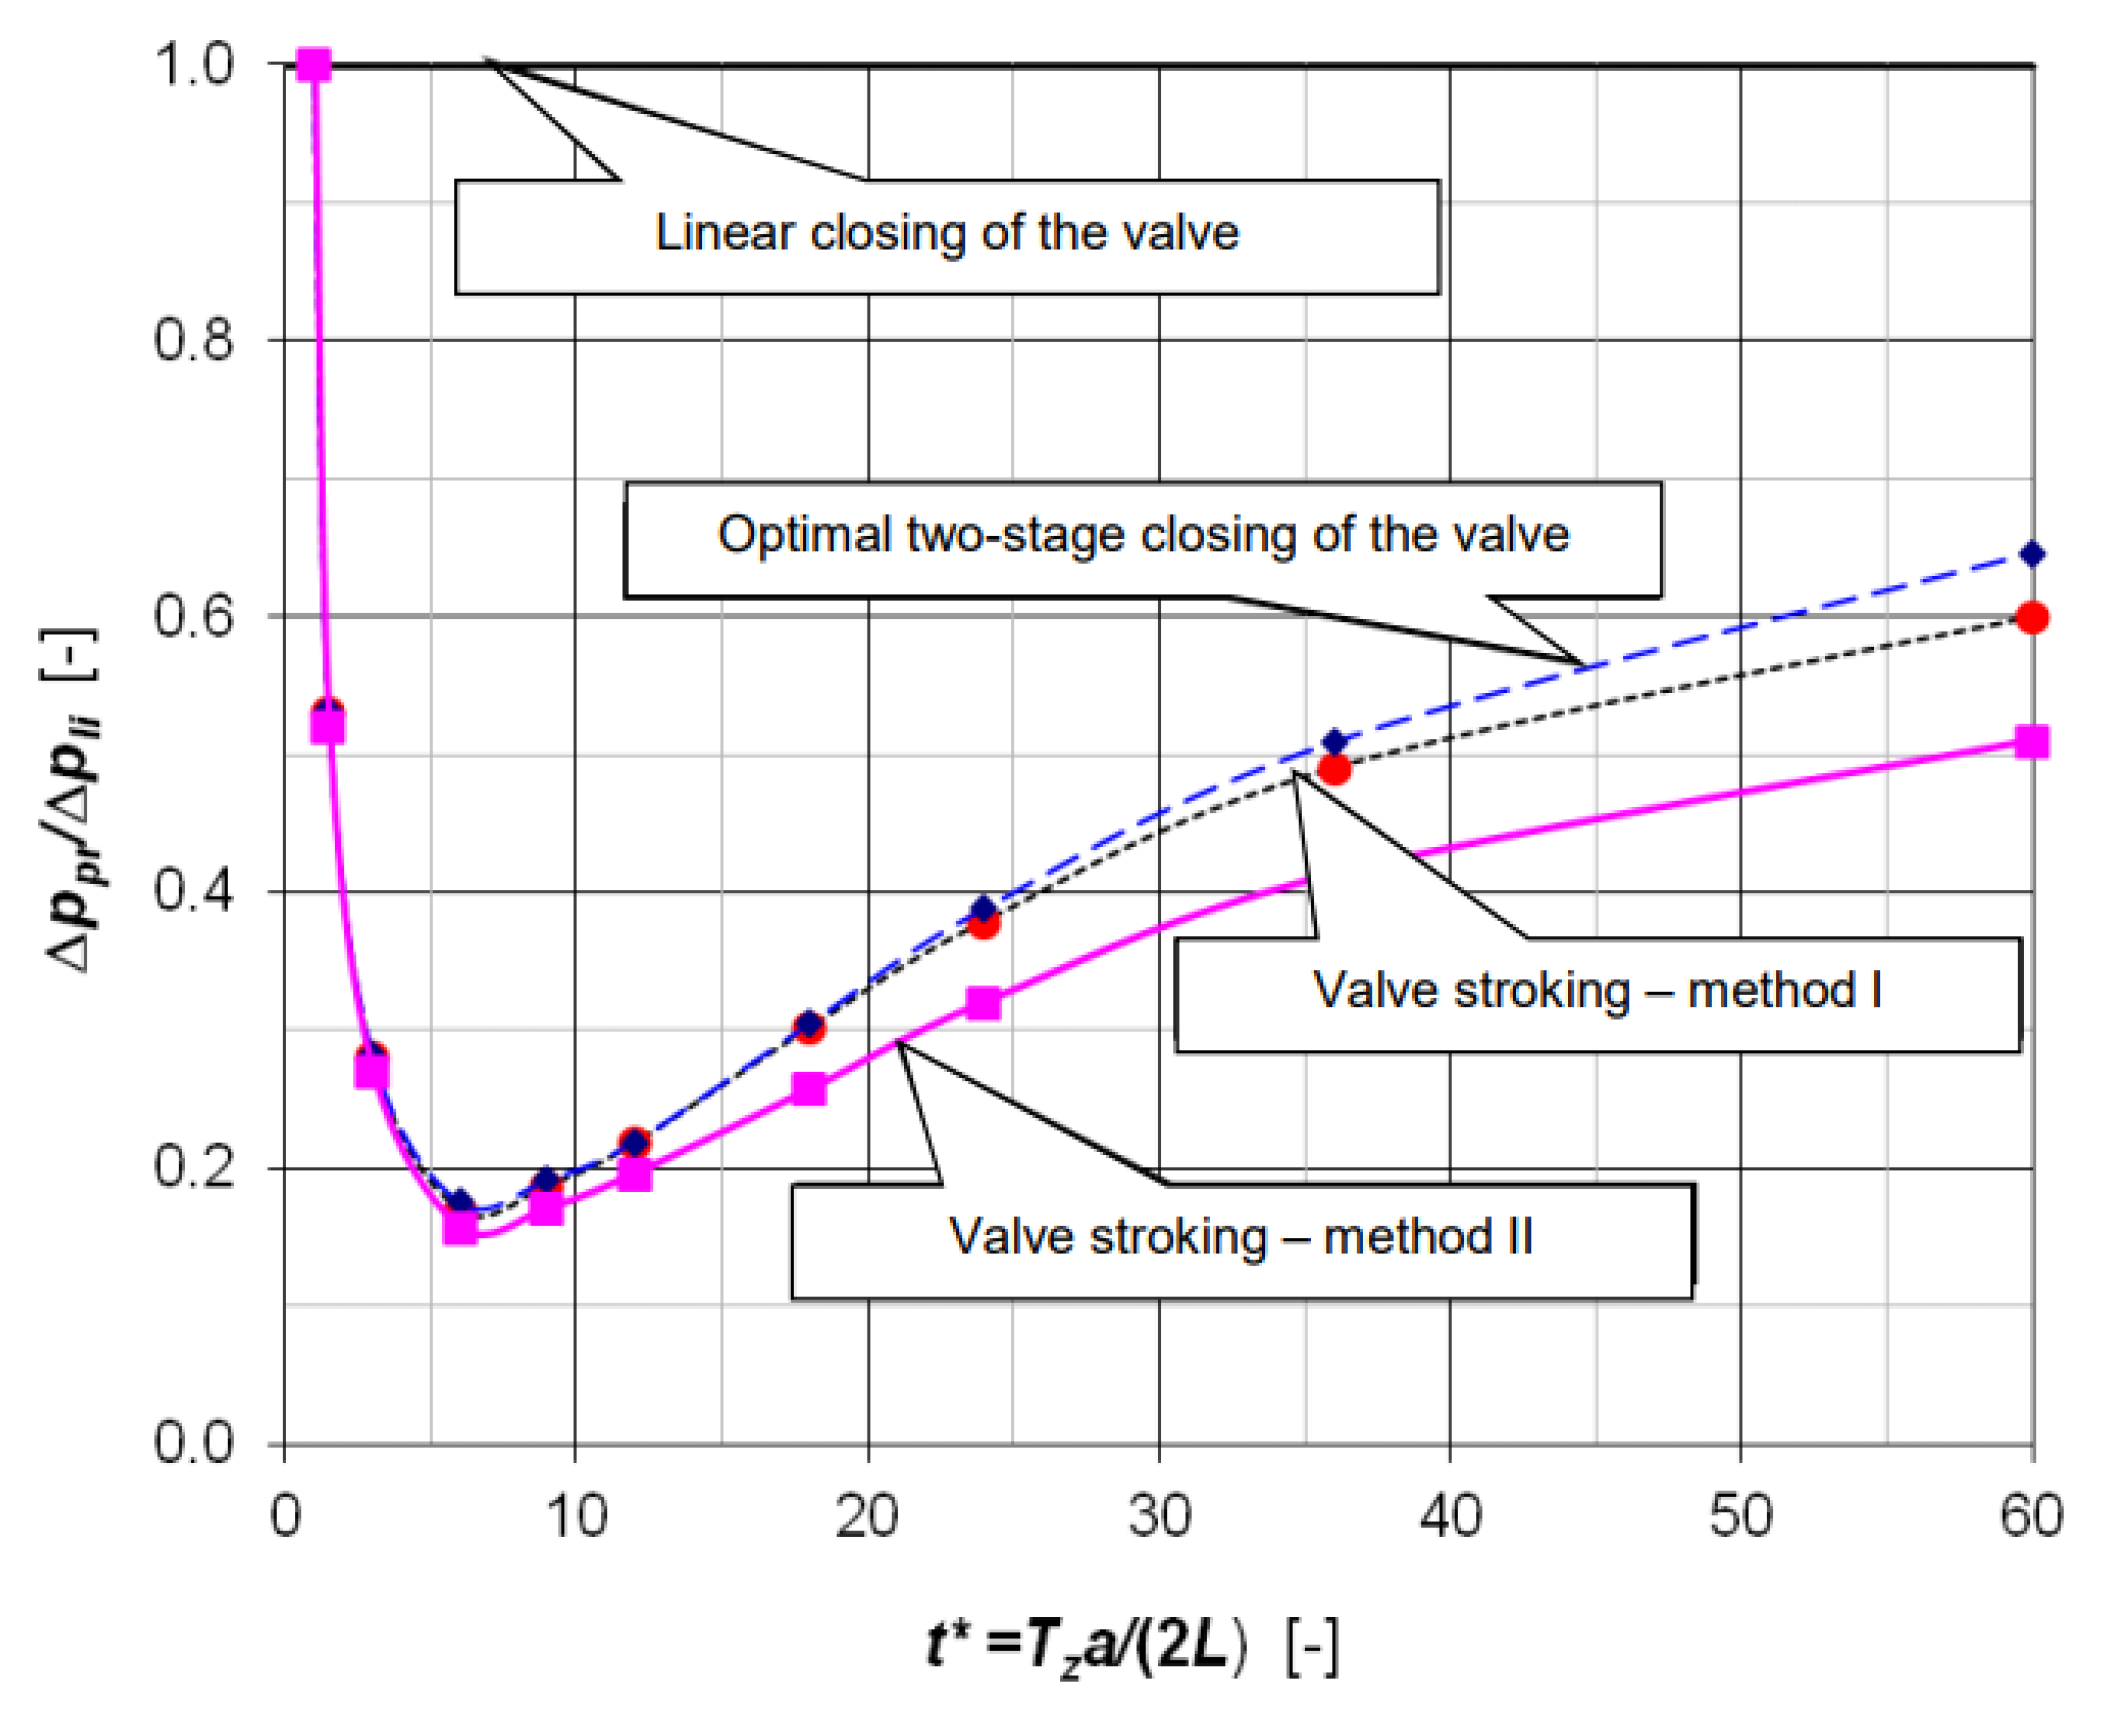
The effect of the second slope on pressure is significant, thus the second slope closure of the wicket gates is a major factor influencing overpressure. Furthermore, Adamkowski and Lewandowski [103] studied a shut-off valve closing following multiple linear or nonlinear slope(s). The results for the reduction of maximum pressure are plotted in Figure 13.
The maximum pressure peaks in the spiral case do not occur immediately at the beginning or towards the end of the wicket gates closing sequence, but in the middle between 90% and 50%. Significant overpressure might occur while the flow is a small fraction of the nominal, like in speed-no-load, or even during wicket gate movement for speed regulation in normal operation.
Because of the advent of new alternative energies, HPUs are often solicited to operate in peaking mode in order to regulate and balance the grid. Consequently, HYP are more exposed to additional loadings caused by HPU operation in transient zones. This oversolicitation will result in supplementary water hammer and pressure fluctuations, which accelerates HYP degradation. Some HYP are very old and continue to receive new generations of refurbished HPU. Hence the importance of having a deep understanding of the water hammer phenomenon, in order to identify the needs of HPU and HYP.
The recommendations will make it possible to prevent accidents and propose optimal operating parameters and protocols for the lifespan of the equipment. Since we concluded by tests that the second slope closure of the wicket gate is a major factor in mitigating overpressure, it is advisable to plan in the design stage to install this device on all appropriate configurations (Kaplan, saxo, propeller, even low-head Francis).
According to measured parameters, significant overpressure can occur during normal operation, so we recommend optimizing the rapid slope, the speed governor parameters and the shut-down from speed-no-load sequence. The impact of extreme loads on equipment should be addressed. Depending on the type of solicitation, the consequences and the inherent risks, the appropriate measures shall be applied.
Mainly, asset management considerations should focus on adopting solutions to ensure reliability and to increase equipment lifespan: (i) apply less demanding operating modes for HPU; (ii) improve existing maintenance; (iii) decrease planned or unexpected shutdown periods.
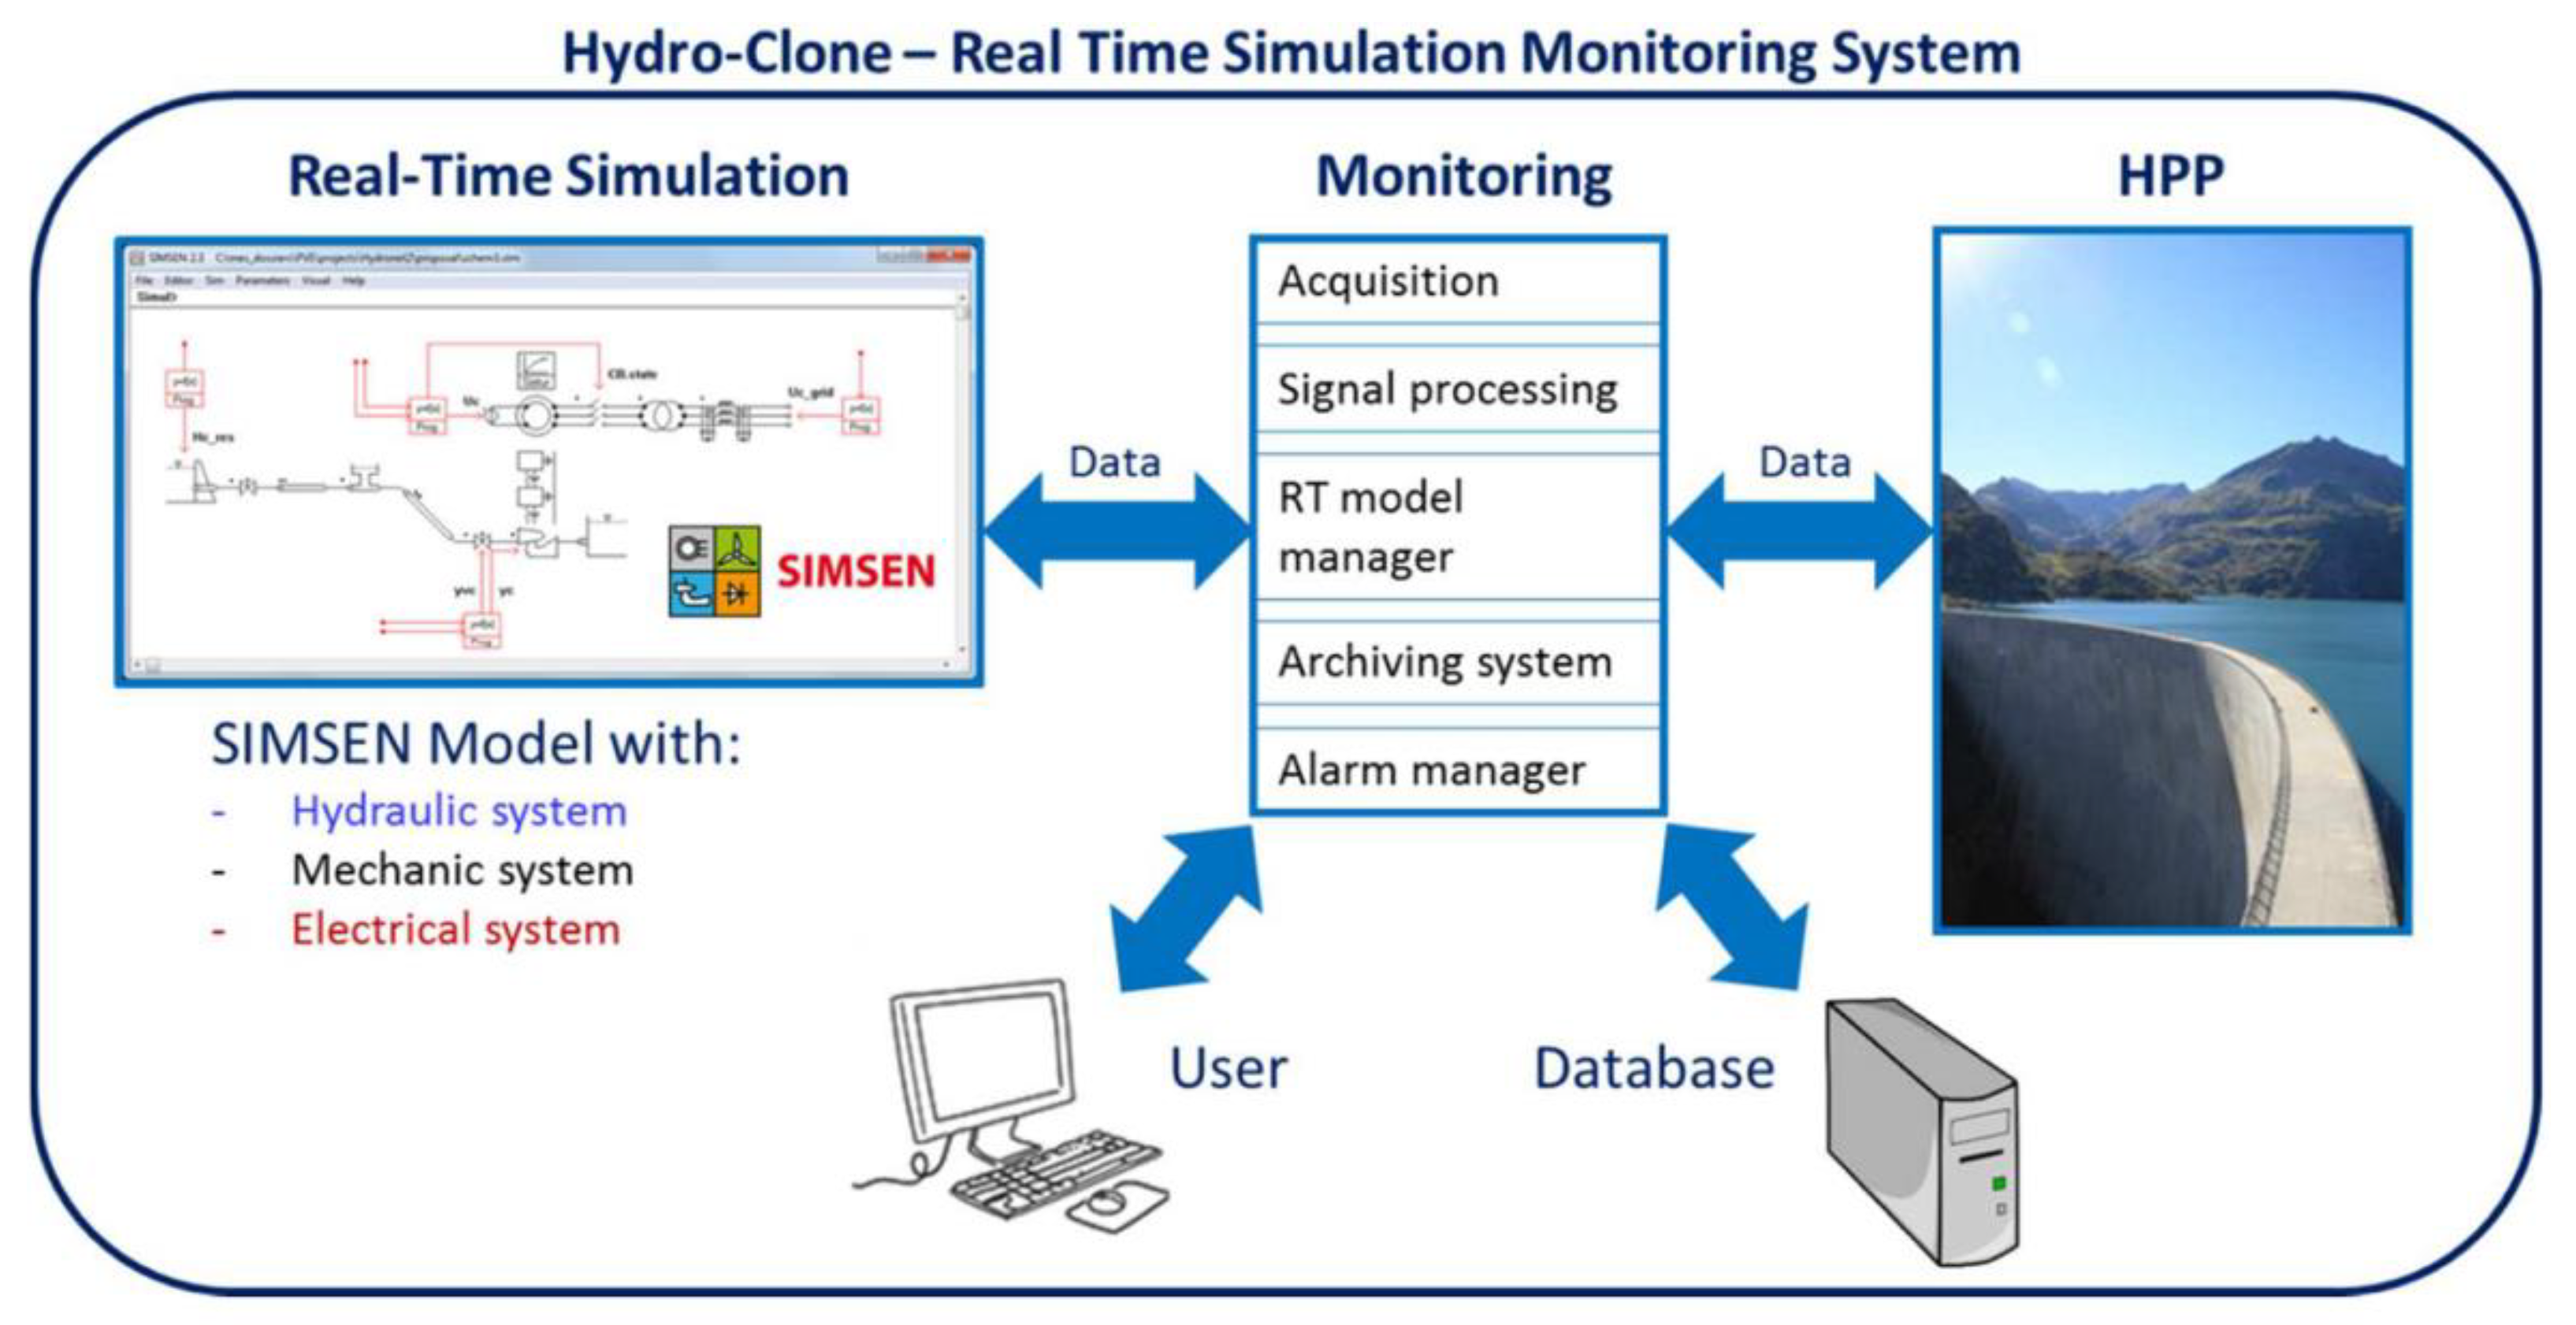
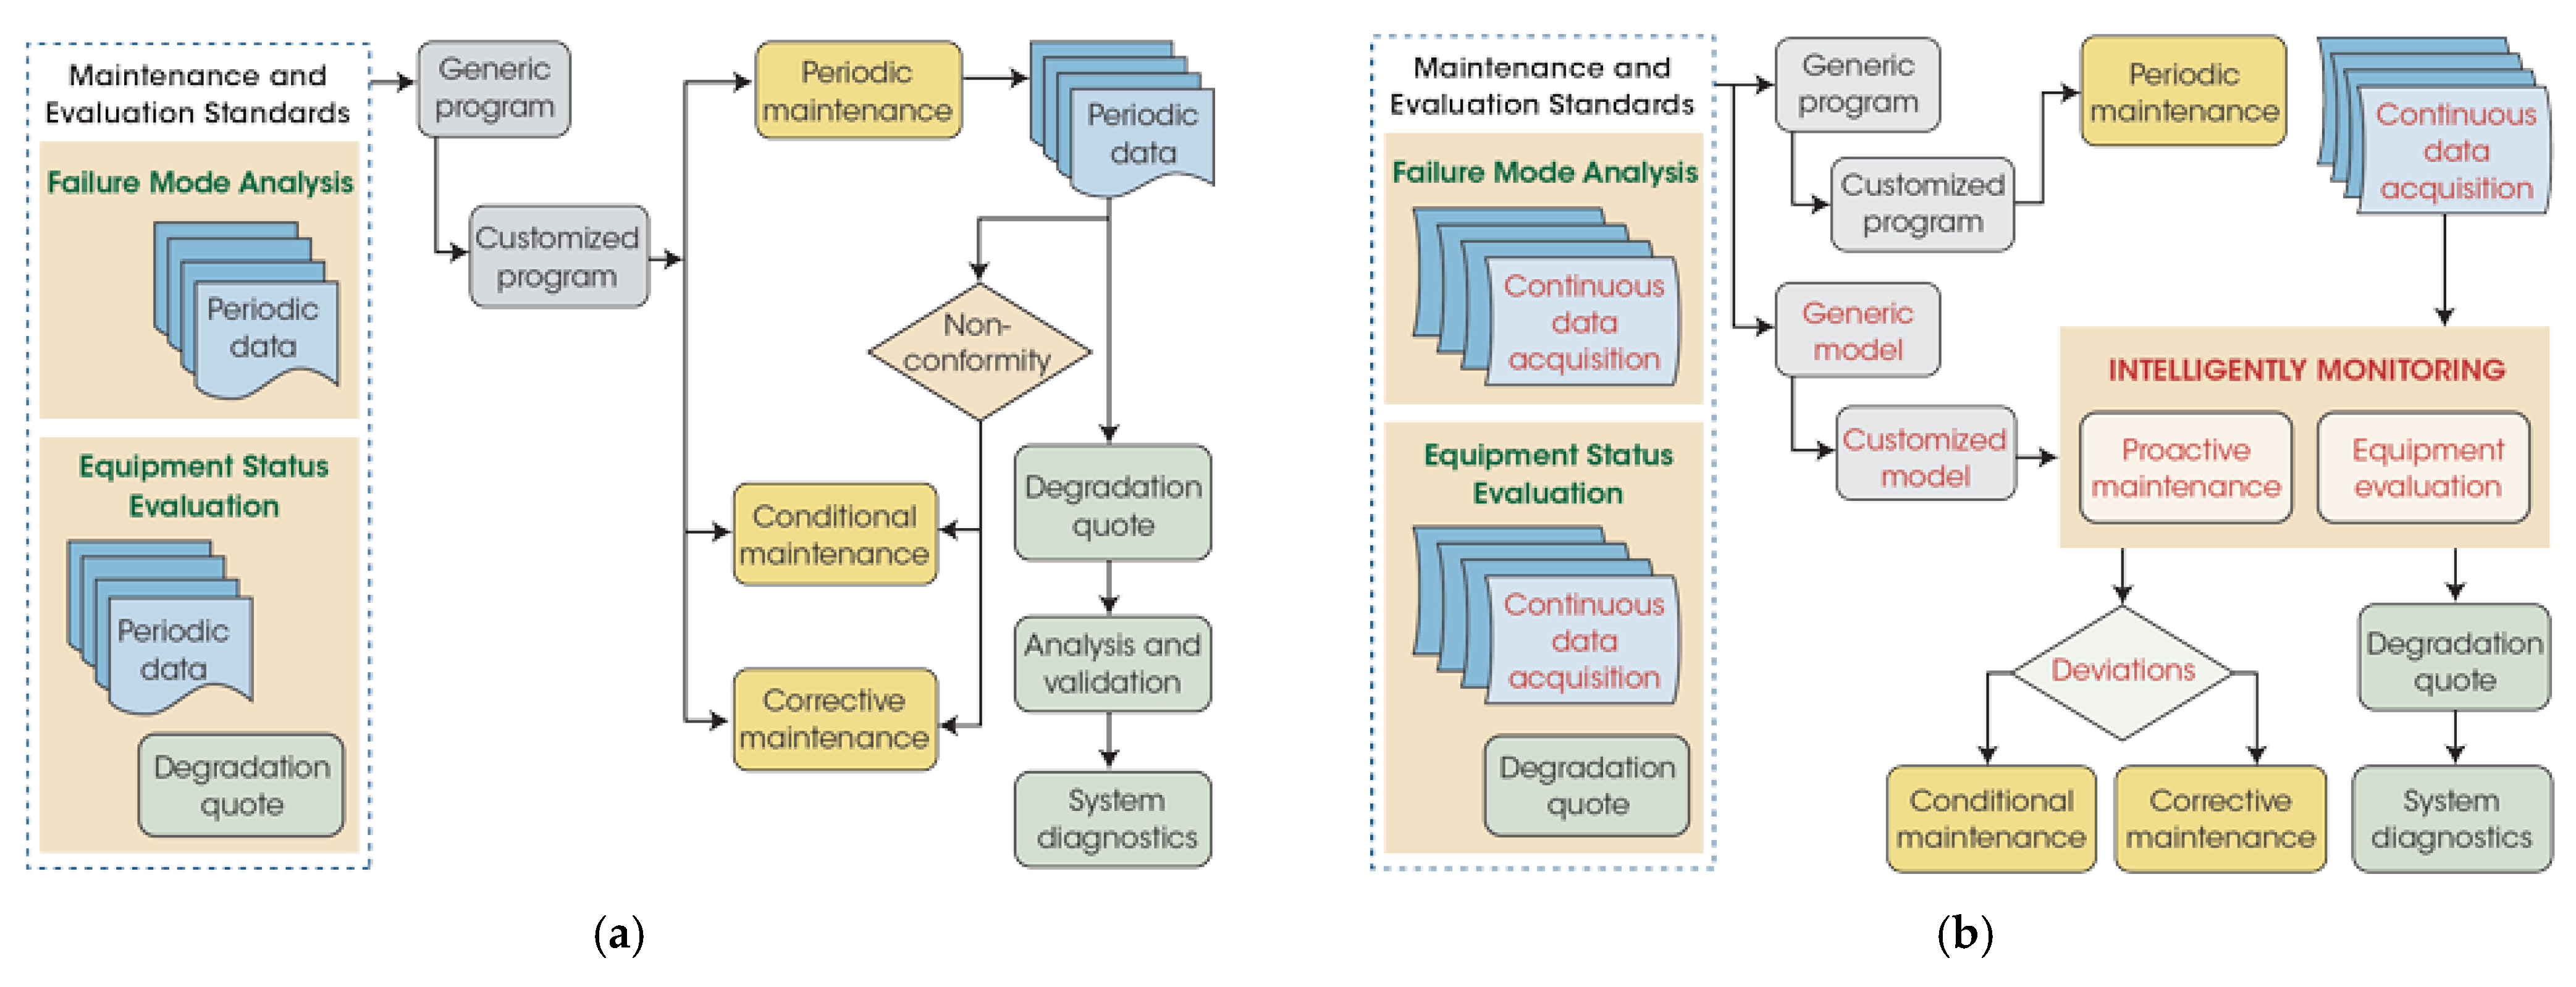
A current method for improving maintenance is continuous monitoring of parameters performed by Nicolet et al. [104] and exemplified in Figure 14, combined with a proactive maintenance program recommended by Lupa [105] and depicted in Figure 15.
Furthermore, some preventive measures are needed to ensure safe operation of the installations and to decrease the risk of accidents: (i) secure critical adjustments protecting equipment from extreme loads; (ii) reconsider the design criteria for projects; (iii) elaborate strategies for upgrades of existing equipment.
Some recommendations require future developments. On the first axis, continuing efforts to advance knowledge in the field of extreme stresses on HYP is recommend:
  • A further analysis remains to be undertaken in order to clearly separate the contribution of each factor.
  • Concerning the temporal analysis of the factors influencing overpressure, more attention need to be paid to the existing recorded data in order to formalize the cause- effect relationships between overpressure and each factor as well as the totality of factors.
  • A supplementary validation by experiments on a test bench will help to identify the influence of main parameters on overpressure.
  • The results obtained shall be validated with tests in the power plants of another producer.
  • The results obtained during the tests shall be compared with the theoretical models as well.
  • Correlation shall be made with simulation programs. Figure 14 above shows the Hydro-Clone concept recommended by Nicolet et al. [104], while the strategy proposed by Kougias et al. [106] is presented Figure 16.
  • In order to complete the present study, additional tests are recommended to investigate the influence of the following parameters on water hammer: (1) closing low; (2) unit overspeed; (3) effective flow rate established in the HYP at the moment of pressure peak; (4) tendency of the hydraulic forces on moving wicket gate during load rejection; (5) behavior of the turbine runner in overspeed; (6) HYP resonance phenomenon; (7) transient flow between wicket gate; (8) air injection downstream from the runner; (9) effect of a surge tank.
  • The particular cases observed during the test campaign need more investigation and reconfirmation.
On a second axis, it is also important to justify the measures required for asset management in order to ensure equipment reliability and availability, to prevent accidents and to guarantee safe service from commissioning to the end of the GTA and PHYDR life cycle. Conclusions on the impact of extreme loads on equipment subjected to overpressure (spiral case, penstock, turbine runner, wicket gate, draft tube) must be drawn and addressed, in particular under current GTA operation for network balancing. This will lead to developing and implementing appropriate procedures and protocols for both GTA and PHYDR for: (i) design criteria; (ii) commissioning; (iii) monitoring; (iv) maintenance.
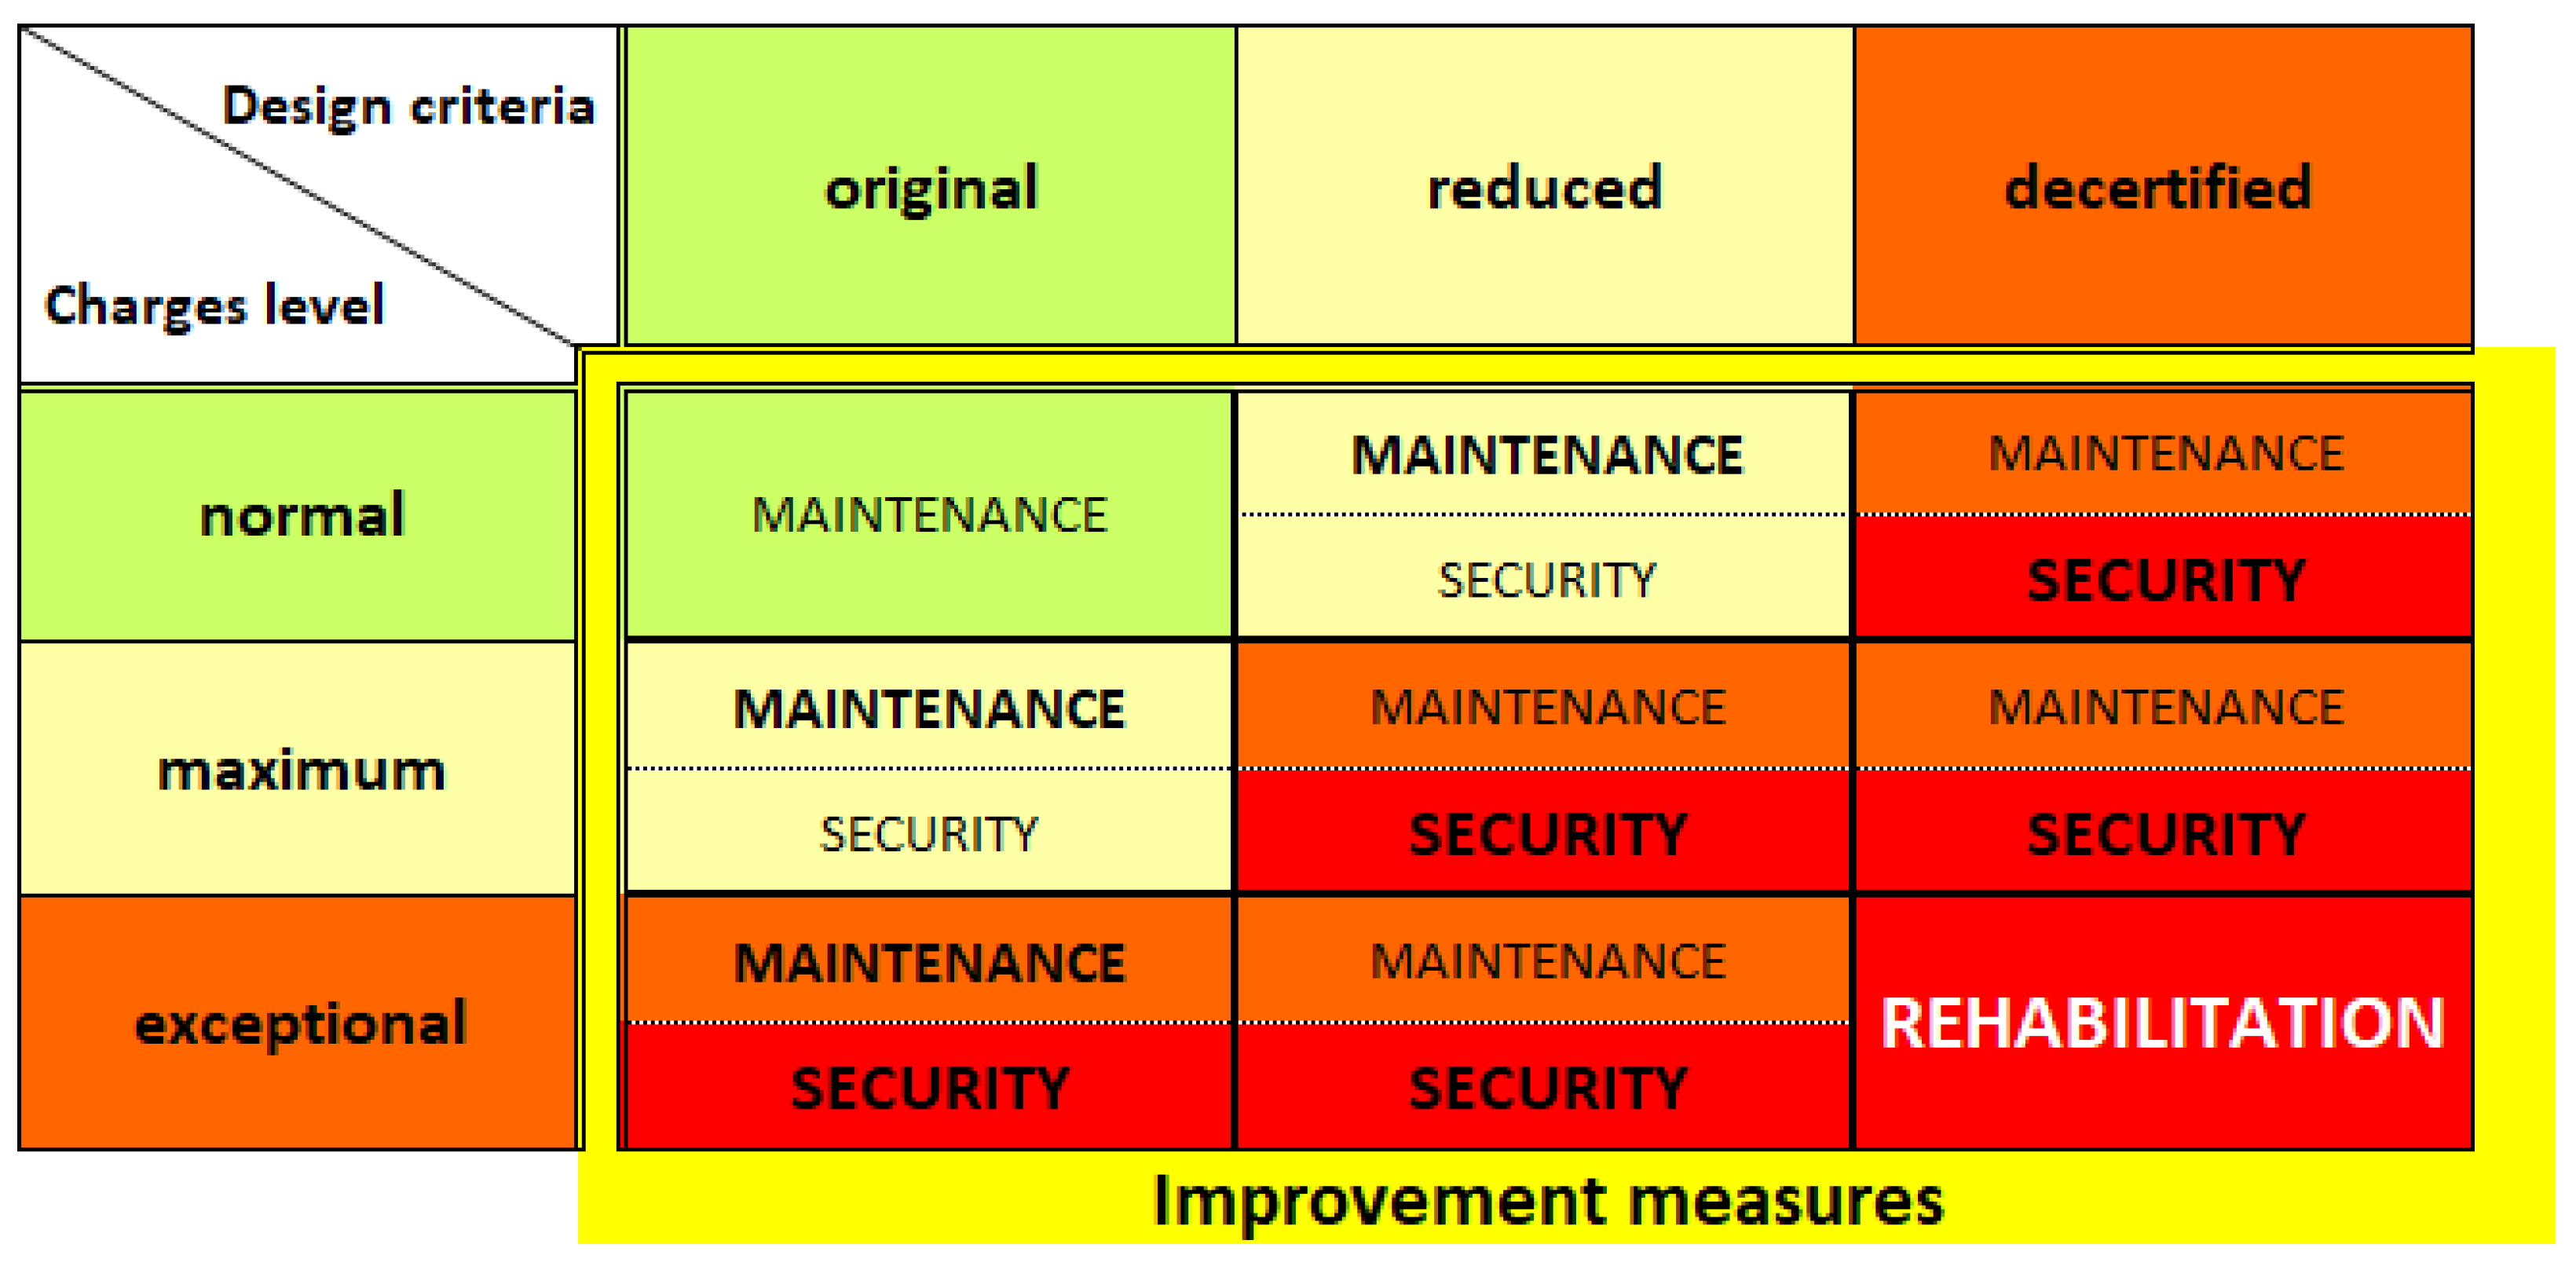
As a first step, the required measures should be chosen, taking into account the loads and depending on the current state of equipment degradation: (1) establish causality between loads and effects; (2) define the most dangerous regimes for the equipment under study: LCF initiates and HCF propagates the crack; (3) complete a grid of improvement measures based on the model proposed in Figure 17.
As a second step, measures to ensure operational safety of the installations, should be implemented: (1) validate the settings in the speed regulator (closing law in the speed controller); (2) revise the design criteria if required.
Third, in collaboration with the hydroelectric industry (manufacturers and designers), make recommendations to increase service life: (1) establish key indicators to measure performance (e.g., hours of downtime/hours of operation; (2) improve existing maintenance; (3) develop strategies for repairs/refurbishments.

6. Conclusions and Perspectives

The paper is a literature survey to identify factors and quantify their influence on overpressure in HYPs during load rejection in different hydropower plants. The review is performed to present the state-of-the art along with the challenges, opening a new perspective to a better understanding of the parameters associated with water hammer effects in HYP.
The study of pressure trends during load discharges and some other transient regimes is examined. An overview of the influence of various factors on overpressure is provided. Higher overpressure occurs during load rejections and transient regimes. A third-order polynomial function of overpressure depending on the gate opening is identified during load rejection. It is shown that an optimal tBAF associated with wicket gate opening can be selected to ensure the balance between overpressure and other factors for any configuration, including unit overspeed. At the same time, other parameters (such as the second closing slope, the injection of air into the water flow and so on) could be applied to mitigate the impact of water hammer. Consequently, the operating time of the wicket gates shall be adjusted in connection with the other parameters that influence water hammer. A few recommendations are provided for asset management that should focus on adopting solutions to ensure the reliability and increase the lifespan of equipment installed in hydropower plants.
Detected correlations and future developments should be used to improve theoretical and numerical models and help find critical factors to consider in the design stage of HYPs. Further investigations will make it possible to adjust key parameters during commissioning as well as establish maintenance strategies adapted to the age of the equipment and the HPU mode of operation. The outcomes of the study will increase the reliability of the equipment and its lifespan while enhancing safety.

Author Contributions

Conceptualization, S.-I.L., M.G., S.M. and G.A.-N.; methodology, S.-I.L., M.G., S.M. and G.A.-N.; investigation, S.-I.L. and M.G.; resources, S.-I.L. and S.M.; writing—original draft preparation, S.-I.L. and S.M.; writing—review and editing, S.-I.L., M.G., S.M. and G.A.-N.; visualization, S.-I.L.; supervision, M.G., S.M. and G.A.-N.; project administration, G.A.-N.; The author contributions are shared as follow: S.-I.L. 50%; M.G. 15%; S.M. 20%; and G.A.-N. 15%. All authors have read and agreed to the published version of the manuscript.

Funding

This research received no external funding.

Acknowledgments

The author affiliated with Romanian Academy—Timisoara Branch has been supported by the research program of Hydrodynamic and Cavitation Laboratory from Center for Fundamental and Advanced Technical Research. Georges Abdul—Nour has been supported by NSERC-RDCPJ-530543-18-HQ-UQTR Foundation Research Chair Grant.

Conflicts of Interest

The authors declare no conflict of interest.

References

  1. March, P. Flexible Operation of Hydropower Plants; Report No. 3002011185; Electric Power Research Institute (EPRI): Palo Alto, CA, USA, 2017. [Google Scholar]
  2. Dreyer, M.; Nicolet, C.; Gaspoz, A.; Biner, D.; Rey-Mermet, S.; Saillen, C.; Boulicaut, B. Digital clone for penstock fatigue monitoring. IOP Conf. Ser. Earth Environ. Sci. 2019, 405, 012013. [Google Scholar] [CrossRef]
  3. Quaranta, E.; Aggidis, G.; Boes, R.M.; Comoglio, C.; De Michele, C.; Ritesh Patro, E.; Georgievskaia, E.; Harby, A.; Kougiasi, I.; Muntean, S.; et al. Assessing the energy potential of modernizing the European hydropower fleet. Energy Convers. Manag. 2021, 246, 114655. [Google Scholar] [CrossRef]
  4. Henry, P. Turbomachines Hydrauliques: Choix Illustré de Réalisations Marquantes, 1st ed.; Presses Polytechniques et Universitaires Romandes (PPUR): Lausanne, Switzerland, 1992. [Google Scholar]
  5. Vitruvius Pollio, M. The Ten Books on Architecture; Harvard University Press: Cambridge, UK, 1914; Book VIII, Chapter VI, Sections 5–8; pp. 244–246, (Translated by Morgan, M.H.). [Google Scholar]
  6. Rouse, H. Highlights: History of Hydraulics. In IIHR-Hydroscience & Engineering, Books at Iowa 38; University of Iowa: Iowa, IA, USA, 1983. [Google Scholar]
  7. Menabrea, L.-F. Note sur les effects de choc de l’eau dans les conduites, C.R. Hebd. Seances Acad. Sci. 1858, 47, 221–224. [Google Scholar]
  8. Michaud, J. Coups de belier dans les conduites—Etude des moyens employees pour en atteneur les effects. Bull. Soc. Vaud. Ing. Arch. 1878, 43, 56–64. [Google Scholar]
  9. Von Kries, J. Ueber die Beziehungen zwischen Druck und Geschwindigkeit, welche bei der Wellenbewegung in elastischen Schläuchen bestehen [On the relationships between pressure and velocity, which exist in connection with wave motion in elastic tubing]. In Festschrift of the 56th Convention of German Scientists and Physicians; Akademische Verlagsbuchhandlung: Tübingen, Germany, 1883; pp. 67–88. (In German) [Google Scholar]
  10. Joukowsky, N. Über den hydraulischen Stoss in Wasserleitungsröhren [On hydraulic shock in water pipes]. In Mémoires de l’Académie Impériale des Sciences de St.-Pétersbourg; 8th series; Académie Impériale des Sciences: Saint Petersburg, Russia, 1898; Volume 9, pp. 1–71. (In German) [Google Scholar]
  11. Tijsseling, A.S.; Anderson, A. The Joukowsky equation for fluids and solids. J. Sci. Comput. 2006, 1–11. Available online: https://www.researchgate.net/publication/254810250_The_Joukowsky_equation_for_fluids_and_solids (accessed on 9 December 2021).
  12. Tijsseling, A.S.; Anderson, A. A precursor in waterhammer analysis—rediscovering Johannes von Kries. In Proceedings of the 9th International Conference on Pressure Surges, Chester, UK, 24–26 March 2016; pp. 739–751. [Google Scholar]
  13. Tijsseling, A.S.; Anderson, A. Johannes von Kries and the history of water hammer. ASCE J. Hydraul. Eng. 2007, 133, 1–8. [Google Scholar] [CrossRef] [Green Version]
  14. Walters, T.A.; Leishear, R.A. When the Joukowsky Equation Does Not Predict Maximum Water Hammer Pressures. In Proceedings of the ASME 2018 Pressure Vessels and Piping Conference, Prague, Czech Republic, 15–20 July 2018. [Google Scholar]
  15. Bouchayer, A. Établissement Des Conduites Forcées. Houille Blanche 1902, 1, 212–218. [Google Scholar] [CrossRef] [Green Version]
  16. Bouchayer, A. Hydraulique. Des ruptures dans les conduites. Houille Blanche 1911, 10, 73–79. [Google Scholar] [CrossRef] [Green Version]
  17. De Sparre, C. Note Au Sujet Des Coups De Bélier. Houille Blanche 1904, 3, 302–308. [Google Scholar] [CrossRef] [Green Version]
  18. De Sparre, C. Remarques au sujet de l’emploi de la méthode de M. Allievi pour le calcul des coups de belier. Houille Blanche 1905, 4, 159–166. [Google Scholar] [CrossRef] [Green Version]
  19. De Sparre, C. Sur les Effets de Résonance dans les coups de Bélier pour le cas des hautes chutes. Houille Blanche 1907, 6, 277–279. [Google Scholar] [CrossRef] [Green Version]
  20. De Sparre, C. L’étude des Coups de Bélier Dans les Canalisations Métalliques Sous Pression. Houille Blanche 1919, 16, 57–58. [Google Scholar] [CrossRef] [Green Version]
  21. Camichel, C.; Eydoux, D.; Gariel, M. Étude théorique et expérimentale des coups de bélier. Essais faits à l’institut électrotechnique de Toulouse et à l’usine hydroélectrique de Soulom. Ann. De La Fac. Des. Sci. De Toulouse 1916, 3, 1–251. [Google Scholar] [CrossRef]
  22. Camichel, C.; Eydoux, D. L’étude des Coups de Bélier Dans les Canalisations Métalliques Sous Pression. Houille Blanche 1920, 17, 127–131. [Google Scholar] [CrossRef] [Green Version]
  23. Allievi, L. Theory of Water-Hammer; R. Garroni Typography: Rome, Italy, 1925. [Google Scholar]
  24. Parmakian, J. Waterhammer Analysis; Dover Publications: New York, NY, USA, 1963. [Google Scholar]
  25. Ramos, H.M.; Almeida, A.B. Dynamic orifice model on waterhammer analysis of high or medium heads of small hydropower schemes. J. Hydraul. Res. 2001, 39, 429–436. [Google Scholar] [CrossRef]
  26. Ramos, H.M.; Almeida, A.B. Parametric Analysis of Waterhammer Effects in Small Hydropower Schemes. ASCE J. Hydraul. Eng. 2002, 128, 689–697. [Google Scholar] [CrossRef]
  27. Selz, A. Recertification of Pressure Vessels and Pressure Systems. J. Press. Vessel Technol. 1986, 108, 514–517. [Google Scholar] [CrossRef]
  28. Levina, S.M.; Vasil’chenko, K.I. General Problem of Condition and Remaining-Life Assessment of Metallic Structures in Water-Delivery Runs of Hydraulic Turbines at HPP. Power Technol. Eng. 2014, 48, 102–111. [Google Scholar] [CrossRef]
  29. Levina, S.M.; Novkunskii, A.A.; Shevchenko, Y.V. Estimate of Remaining Operating Lifetime of Penstock Metal Lining with Due Regard for Its Actual Thickness. Power Technol. Eng. 2016, 50, 248–253. [Google Scholar] [CrossRef]
  30. Kahraman, G. Investigation of the Effect of Operating Conditions Change on Water Hammer in Hydroelectric Power Plants. J. Fail. Anal. Preven. 2020, 20, 1987–1991. [Google Scholar] [CrossRef]
  31. Cassano, S.; Nicolet, C.; Sossan, F. Reduction of Penstock Fatigue in a Medium-Head Hydropower Plant Providing Primary Frequency Control. In Proceedings of the 55th International Universities Power Engineering Conference (UPEC), Turin, Italy, 1–4 September 2020; pp. 1–6. [Google Scholar] [CrossRef]
  32. Adamkowski, A.; Lewandowski, M.; Lewandowski, S. Fatigue life analysis of hydropower pipelines using the analytical model of stress concentration in welded joints with angular distortions and considering the influence of water hammer damping. Thin Wall Struct. 2021, 159, 107350. [Google Scholar] [CrossRef]
  33. Suresh, S. Fatigue of Materials, 2nd ed.; Cambridge University Press: Cambridge, UK, 1998. [Google Scholar]
  34. Schijve, J. Fatigue of Structures and Materials, 2nd ed.; Springer: Dordrecht, NL, USA, 2009. [Google Scholar]
  35. Pachoud, A.J.; Manso, P.A.; Schleiss, A.J. New methodology for safety assessment of steel-lined pressure shafts using high-strength steel. Int. J. Hydropower Dams 2017, 24, 80–88. [Google Scholar]
  36. Pachoud, A.J. Influence of Geometrical Imperfections and Flaws at Welds of Steel Liners on Fatigue Behavior of Pressure Tunnels and Shafts in Anisotropic Rock. Ph.D. Thesis, No. 7305. Ecole Polytechnique Fédérale de Lausanne, Lausanne, Switzerland, 2017. [Google Scholar]
  37. Pachoud, A.J.; Berthod, R.; Manso, P.A.; Schleiss, A.J. Advanced models for stress evaluation and safety assessment in steel-lined pressure tunnels. Int. J. Hydropower Dams 2018, 25, 77–82. [Google Scholar]
  38. Gagnon, M.; Nicolle, J.; Morissette, J.; Lawrence, M. A look at Francis runner blades response during transients. IOP Conf. Ser. Earth Environ. Sci. 2016, 49, 052005. [Google Scholar] [CrossRef] [Green Version]
  39. Thibault, D.; Gagnon, M.; Godin, S. The effect of materials properties on the reliability of hydraulic turbine runners. Int. J. Fluid Mach. Syst. 2015, 8, 254–263. [Google Scholar] [CrossRef] [Green Version]
  40. Gagnon, M.; Tahan, A.; Bocher, P.; Thibault, D. Influence of load spectrum assumptions on the expected reliability of hydroelectric turbines: A case study. Struct. Saf. 2014, 50, 1–8. [Google Scholar] [CrossRef]
  41. Liu, X.; Luo, Y.; Wang, Z. A review on fatigue damage mechanism in hydro turbines. Renew. Sustain. Energy Rev. 2016, 54, 1–14. [Google Scholar] [CrossRef]
  42. Trivedi, C.; Bhupendra, G.; Cervantes, J.M. Effect of transients on Francis turbine runner life: A review. J. Hydraul. Res. 2013, 51, 121–132. [Google Scholar] [CrossRef]
  43. Savin, O.; Baroth, J.; Badina, C.; Charbonnier, S.; Bérenguer, C. Damage due to start-stop cycles of turbine runners under high-cycle fatigue. Int. J. Fatigue 2021, 153, 106458:1–106458:11. [Google Scholar] [CrossRef]
  44. Hydraulic Power Committee. Effect of Speed Regulation and Water Hammer on the Design of Relief Valves, Penstocks and Surge Tanks. In Report of Hydraulic Power Committee; National Electric Light Association: New York, NY, USA, 1927; 26p. [Google Scholar]
  45. United States Department of the Interior Bureau of Reclamation (US-DIBR). Welded Steel Penstock; Engineering Monograph; U.S. Government Printing Office: Washington, WA, USA, 1977.
  46. Chaudry, M.H. Applied Hydraulic Transients, 3rd ed.; Springer: New York, NY, USA, 2014. [Google Scholar]
  47. Selek, B.; Kirkgöz, M.S.; Selek, Z. Comparison of computed water hammer pressures with test results for the Çatalan power plant in Turkey. Can. J. Civ. Eng. 2004, 31, 78–85. [Google Scholar] [CrossRef]
  48. Mandair, S. 1D and 3D Water-Hammer Models: The Energetics of High Friction Pipe Flow and Hydropower Load Rejection. Ph.D. Thesis, No. 7305. University of Toronto, Toronto, ON, Canada, 2020. [Google Scholar]
  49. Mandair, S.; Morissette, J.F.; Magnan, R.; Karney, B. MOC-CFD coupled model of load rejection in hydropower station. IOP Conf. Ser. Earth Environ. Sci. 2021, 774, 012021. [Google Scholar] [CrossRef]
  50. Aminikhah, H. Solution of Wave Equation in Radial Form by VIM, International Scholarly Research Network. ISRN Comput. Math. 2012. [Google Scholar] [CrossRef] [Green Version]
  51. Wichowski, R. Comparative Analysis of Water-Hammer calculation by the Approximate and the Complete Methods of Characteristics. Period. Polytech. Ser. Civil. Eng. 1991, 35, 107–125. [Google Scholar]
  52. Salmasi, F.; Abraham, J. The Method of Characteristics Applied to the Sensitivity Analysis for Water Hammer Problems. New Approaches Eng. Res. 2021, 9, 50–63. [Google Scholar] [CrossRef]
  53. Afshar, M.H.; Rohani, M. Water hammer simulation by implicit method of characteristic. Int. J. Press. Vessels Pip. 2008, 85, 851–859. [Google Scholar] [CrossRef]
  54. Iliev, V.; Popovski, P.; Markov, Z. Water Hammer Analysis Using Characteristics Method and Numerical Simulation. Mech. Eng. Sci. J. 2013, 31, 53–62. [Google Scholar]
  55. Pal, S.; Hanmaiahgari, P.R.; Karney, B.W. An Overview of the Numerical Approaches to Water Hammer Modelling: The Ongoing Quest for Practical and Accurate Numerical Approaches. Water 2021, 13, 1597. [Google Scholar] [CrossRef]
  56. Bakken, B.H.; Bjørkvoll, T. Hydropower unit start-up costs. IEEE Power Eng. Soc. Summer Meet. 2002, 3, 1522–1527. [Google Scholar] [CrossRef]
  57. Gagnon, M.; Tahan, S.A.; Bocher, P.; Thibault, D. Impact of start-up scheme on Francis runner life expectancy. IOP Conf. Ser. Earth Environ. Sci. 2010, 12, 012107. [Google Scholar] [CrossRef]
  58. Bergant, A.; Simpson, A.R.; Tijsseling, A.S. Water hammer with column separation: A review of research in the twentieth century. In Centre for Analysis Scientific Computing and Applications; Report No. 0434; Eindhoven University of Technology: Eindhoven, Poland, 2004. [Google Scholar]
  59. Wylie, E.B.; Streeter, V.L. Fluid Transients in Systems; Prentice-Hall: Englewood Cliffs, NJ, USA, 1993. [Google Scholar]
  60. Marples, E.I.B. The Significance of Surge Diagrams. Proceedings of the Institution of Mechanical Engineers. Conf. Proc. 1965, 180, 3–11. [Google Scholar] [CrossRef]
  61. Bergant, A.; Vítkovský, J.P.; Simpson, A.R.; Lambert, M.F.; Tijsseling, A.S. Discrete vapour cavity model with efficient and accurate convolution type unsteady friction term. In Proceedings of the 23rd IAHR Symposium on Hydraulic Machinery and Systems IAHR2006, Yokohama, Japan, 17–21 October 2006. [Google Scholar]
  62. Bergant, A.; Tijsseling, A.S.; Vítkovský, J.P.; Simpson, A.R.; Lambert, M.F. Discrete Vapour Cavity Model with Improved Timing of Opening and Collapse of Cavities. In Proceedings of the 2nd IAHR International Meeting of the Work Group on Cavitation and Dynamic Problems in Hydraulic Machinery and Systems, IAHRWG2007, Timişoara, Romania, 24–26 October 2007. [Google Scholar]
  63. Santoro, V.C.; Crimì, A.; Pezzinga, G. Developments and Limits of Discrete Vapor Cavity Models of Transient Cavitating Pipe Flow: 1D and 2D Flow Numerical Analysis. ASCE J. Hydraul. Eng. 2018, 144, 04018047. [Google Scholar] [CrossRef]
  64. Zhao, L.; Yang, Y.; Wang, T.; Zhou, L.; Li, Y.; Zhang, M. A Simulation Calculation Method of a Water Hammer with Multpoint Collapsing. Energies 2020, 13, 1103. [Google Scholar] [CrossRef] [Green Version]
  65. Liou, J.C.P. Numerical Properties of the Discrete Gas Cavity Model for Transients. ASME J. Fluids Eng. 2000, 122, 636–639. [Google Scholar] [CrossRef]
  66. Bergant, A.; Karadžić, U.; Vítkovský, J.; Vušanović, I.; Simpson, A.R. A Discrete Gas-Cavity model that Considers the Friction Effects of Unsteady Pipe Flow. Stroj. Vestn J. Mech. E 2005, 51, 692–710. [Google Scholar]
  67. Zhou, L.; Wang, H.; Bergant, A.; Tijsseling, A.S.; Liu, D.; Guo, S. Godunov-Type Solutions with Discrete Gas Cavity Model for Transient Cavitating Pipe Flow. ASCE J. Hydraul. Eng. 2018, 144, 04018017. [Google Scholar] [CrossRef] [Green Version]
  68. Bergant, A.; Simpson, A.R. Interface model for transient cavitating flow in pipelines. In Unsteady Flow and Fluid Transients; Bettess, R., Watts, J., Eds.; Balkema: Rotterdam, The Netherlands, 1992; pp. 333–342. [Google Scholar]
  69. Himr, D. Investigation and Numerical Simulation of a Water Hammer with Column Separation. ASCE J. Hydraul. Eng. 2015, 141, 04014080. [Google Scholar] [CrossRef]
  70. Ilić, J.; Petković, A.; Božić, I. Numerical Analyses of Water Hammer and Water-Mass Oscillations in a Hydropower Plant for the Most Extreme Operational Regimes. FME Trans. 2019, 47, 7–15. [Google Scholar] [CrossRef]
  71. Chen, S.; Zhang, J.; Li, G.H.; Yu, X.D. Influence Mechanism of Geometric Characteristics of Water Conveyance System on Extreme Water Hammer during Load Rejection in Pumped Storage Plants. Energies 2019, 12, 2854. [Google Scholar] [CrossRef] [Green Version]
  72. Adamkowski, A.; Lewandowski, M. Experimental examination of unsteady friction models for transient pipe flow simulation. ASME J. Fluids Eng. 2006, 128, 1351–1363. [Google Scholar] [CrossRef]
  73. Adamkowski, A.; Lewandowski, M. A New Method for Numerical Prediction of Liquid Column Separation Accompanying Hydraulic Transients in Pipelines. ASME J. Fluids Eng. 2009, 131, 071302. [Google Scholar] [CrossRef]
  74. Bergant, A.; Simpson, A.R. Pipeline Column Separation Flow Regimes. ASCE J. Hydraul. Eng. 1999, 125, 835–848. [Google Scholar] [CrossRef] [Green Version]
  75. Karadžić, U.; Bulatović, V.; Bergant, A. Valve-Induced Water Hammer and Column Separation in a Pipeline Apparatus. Stroj. Vestn. J. Mech. E 2014, 60, 742–754. [Google Scholar] [CrossRef] [Green Version]
  76. Vítkovský, J.; Stephens, M.; Bergant, A.; Simpson, A.R.; Lambert, M.F. Numerical Error in Weighting Function-Based Unsteady Friction Models for Pipe Transients. ASCE J. Hydraul. Eng. 2006, 132, 709–721. [Google Scholar] [CrossRef] [Green Version]
  77. Ghidaoui, M.S.; Zhao, M.; McInnis, D.A.; Axworthy, D.H. A review of water hammer theory and practice. Appl. Mech. Rev. 2005, 58, 49–76. [Google Scholar] [CrossRef]
  78. Ramos, H.M. Special Concerns Related to the Runaway Effect in Francis Turbines. Hydro Rev. 2010, 1. Available online: https://www.renewableenergyworld.com/baseload/special-concerns-related-to-the-runaway-effect-in-francis-turbines/#gref (accessed on 9 December 2021).
  79. Li, X.Q.; Chang, J.S.; Chen, P. Wicket Gate Closure Control Law to Improve the Transient of a Water Turbine. In Advanced Materials Research; Zhou, C.C., Ma, G.J., Liao, R., Wang, J.W., Eds.; Trans Tech Publications: Bäch, Switzerland, 2013; Volume 732. [Google Scholar] [CrossRef]
  80. Zheng, T.; Tian, Z.; Gui, S.; Li, J.; Zou, H.Q. Hydraulic transient process research technology and engineering application on the complex water tunnel conveyance system of hydropower station. In Proceedings of the 2014 ISFMFE—6th International Symposium on Fluid Machinery and Fluid Engineering, Wuhan, China, 22–25 October 2014; pp. 1–5. [Google Scholar] [CrossRef]
  81. Chen, D.Y.; Zhang, X.G.; Wu, Y.H.; Li, H.H. Dynamic analysis and modelling of a Francis hydro-energy generation system in the load rejection transient. IET Renew. Power Gener. 2016, 10, 1140–1148. [Google Scholar] [CrossRef]
  82. Nicolet, C.; Dreyer, M.; Béguin, A.; Bollaert, E.; Torrent, S.; Dayer, J.-D. Hydraulic Transient Survey at Cleuson-Dixence with Real-Time Hydro-Clone Monitoring System. In Proceedings of the HYDRO 2018 Conference, Gdansk, Poland, 15–17 October 2018. [Google Scholar]
  83. Pejović, S.; Gajić, A. The Rules for Hydraulic Transient Design Analysis: Guide for Designers and Manufacturers: Recommendations for Investors and Managers; CSPSAG Press: Toronto, ON, Canada, 2018. [Google Scholar]
  84. Bergant, A.; Mazij, J.; Karadžić, U. Design of Water Hammer Control Strategies in Hydropower Plants. Appl. Eng. Lett. 2018, 1, 27–33. [Google Scholar] [CrossRef]
  85. Dollon, Q. Identification des Caractéristiques du Comportement Dynamique des Roues de Turbines Hydroélectriques par l’Étude des Régimes Transitoires; Devis de Recherche, DGA1033; ETS: Montréal, QC, Canada, 2019. [Google Scholar]
  86. Dreyer, M.; Nicolet, C.; Gaspoz, A.; Gonçalves, N.; Rey-Mermet, S.; Boulicaut, B. Monitoring 4.0 of penstocks: Digital twin for fatigue assessment. IOP Conf. Ser. Earth Environ. Sci. 2021, 774, 012009. [Google Scholar] [CrossRef]
  87. Klun, M.; Zupan, D.; Lopatič, J.; Kryžanowski, A. On the Application of Laser Vibrometry to Perform Structural Health Monitoring in Non-Stationary Conditions of a Hydropower Dam. Sensors 2019, 19, 3811. [Google Scholar] [CrossRef] [Green Version]
  88. Lupa, S.I.; Gagnon, M.; Abdul–Nour, G. Water Hammer Interaction between Hydraulic Power Generators and Hydraulic Passages; World Congress on Engineering Asset Management (WCEAM 2021): Bonito, Brasilia, 2021. [Google Scholar]
  89. Kolšek, T.; Duhovnik, J.; Bergant, A. Simulation of unsteady flow and runner rotation during shut-down of an axial water turbine. J. Hydraul. Res. 2006, 44, 129–137. [Google Scholar] [CrossRef]
  90. Trivedi, C.; Cervantes, M.J.; Bhupendrakumr, G.; Dahlhaug, O.G. Pressure measurements on a high-head Francis turbine during load acceptance and rejection. J. Hydraul. Res. 2014, 52, 283–297. [Google Scholar] [CrossRef]
  91. Hirschberg, S.; Spiekemann, G.; Dones, R. Severe Accidents in the Energy Sector; Technical Report No. 98–16; Paul Scherrer Institute: Viligen, Switzerland, 1998. [Google Scholar]
  92. Hirschberg, S.; Burgherr, P.; Spiekerman, G.; Dones, R. Severe accidents in the energy sector: Comparative perspective. J. Hazard. Mater. 2004, 111, 57–65. [Google Scholar] [CrossRef]
  93. Bonin, C.C. Water Hammer Damage to Oigawa power station. J. Eng. Power. 1960, 82, 111–116. [Google Scholar] [CrossRef]
  94. Adamkowski, A. Case Study: Lapino Powerplant Penstock Failure. ASCE J. Hydraul. Eng. 2001, 127, 547–555. [Google Scholar] [CrossRef]
  95. Adamkowski, A.; Lewandowski, M.; Lewandowski, S. Przyczyny i skutki niekontrolowanego uderzenia hydraulicznego [Causes and effects of the uncontrolled water hammer]. Energetika Wodna 2020, 36, 32–39. (In Polish) [Google Scholar]
  96. Fortov, V.; Fedorov, M.; Elistratov, V. Scientific and Technical Problems of the Hydropower Industry after the Accident at the Sayano-Shushenskaya Hydropower Plant. Her. Russ. Acad. Sci. 2011, 81, 333–340. [Google Scholar] [CrossRef]
  97. Hamill, F.A. Sayano Shushenskaya accident—Presenting a possible direct cause. Int. Water Power Dam Constr. 2010, 30–36. Available online: https://www.waterpowermagazine.com/features/featuresayano-shushenskaya-accident-presenting-a-possible-direct-cause/ (accessed on 9 December 2021).
  98. Bellendir, E.; Semenov, Y.; Shtengel, V. First results of inspection of structural components at the Sayano-Shushenskaya HPP after the failure of 17 August 2009. Power Technol. Eng. 2011, 44, 335–341. [Google Scholar] [CrossRef]
  99. Kogan, K. Abnormal operating modes and reability of modern generating sets. Power Technol. Eng. 2010, 44, 202–207. [Google Scholar]
  100. Belash, I. Cause of the failure of the no. 2 hydraulic generating set at the Sayano-Shushenskaya HPP: Criticality of reability enhancement for water–power equipments. Power Technol. Eng. 2010, 44, 165–170. [Google Scholar] [CrossRef]
  101. Berlin, V.; Murav’ev, O. Technical aspects of the failure of the second generating set at the Sayano-Shushenskaya HPP. Power Technol. Eng. 2010, 44, 263–268. [Google Scholar] [CrossRef]
  102. Hamill, F.A. Sayano Shushenskaya 2009 accident update. Hydrolink 2020, 2, 50–53. [Google Scholar]
  103. Adamkowski, A.; Lewandowski, M. Preventing destructive effects of water hammer in hydropower plant penstocks. In Proceedings of the ACI’s Hydropower Development Conference: Europe 2015, Salzburg, Austria, 23–24 September 2015. [Google Scholar]
  104. Nicolet, C.; Béguin, A.; Bollaert, E.; Boulicaut, B.; Gros, G. Real-time simulation monitoring system for hydro plant transient surveys. Int. J. Hydropower Dams 2015, 22, 62–69. [Google Scholar]
  105. Lupa, S.I. Hydro-Quebec Manages Delicate Balance of Old and New Systems. Hydro. Rev. 2015, 34, 10. [Google Scholar]
  106. Kougias, I.; Aggidis, G.; Avellan, F.; Deniz, S.; Lundin, U.; Moro, A.; Muntean, S.; Novara, D.; Pérez-Díaz, J.I.; Quaranta, E.; et al. Analysis of emerging technologies in the hydropower sector. Renew. Sustain. Energy Rev. 2019, 113, 109257. [Google Scholar] [CrossRef]
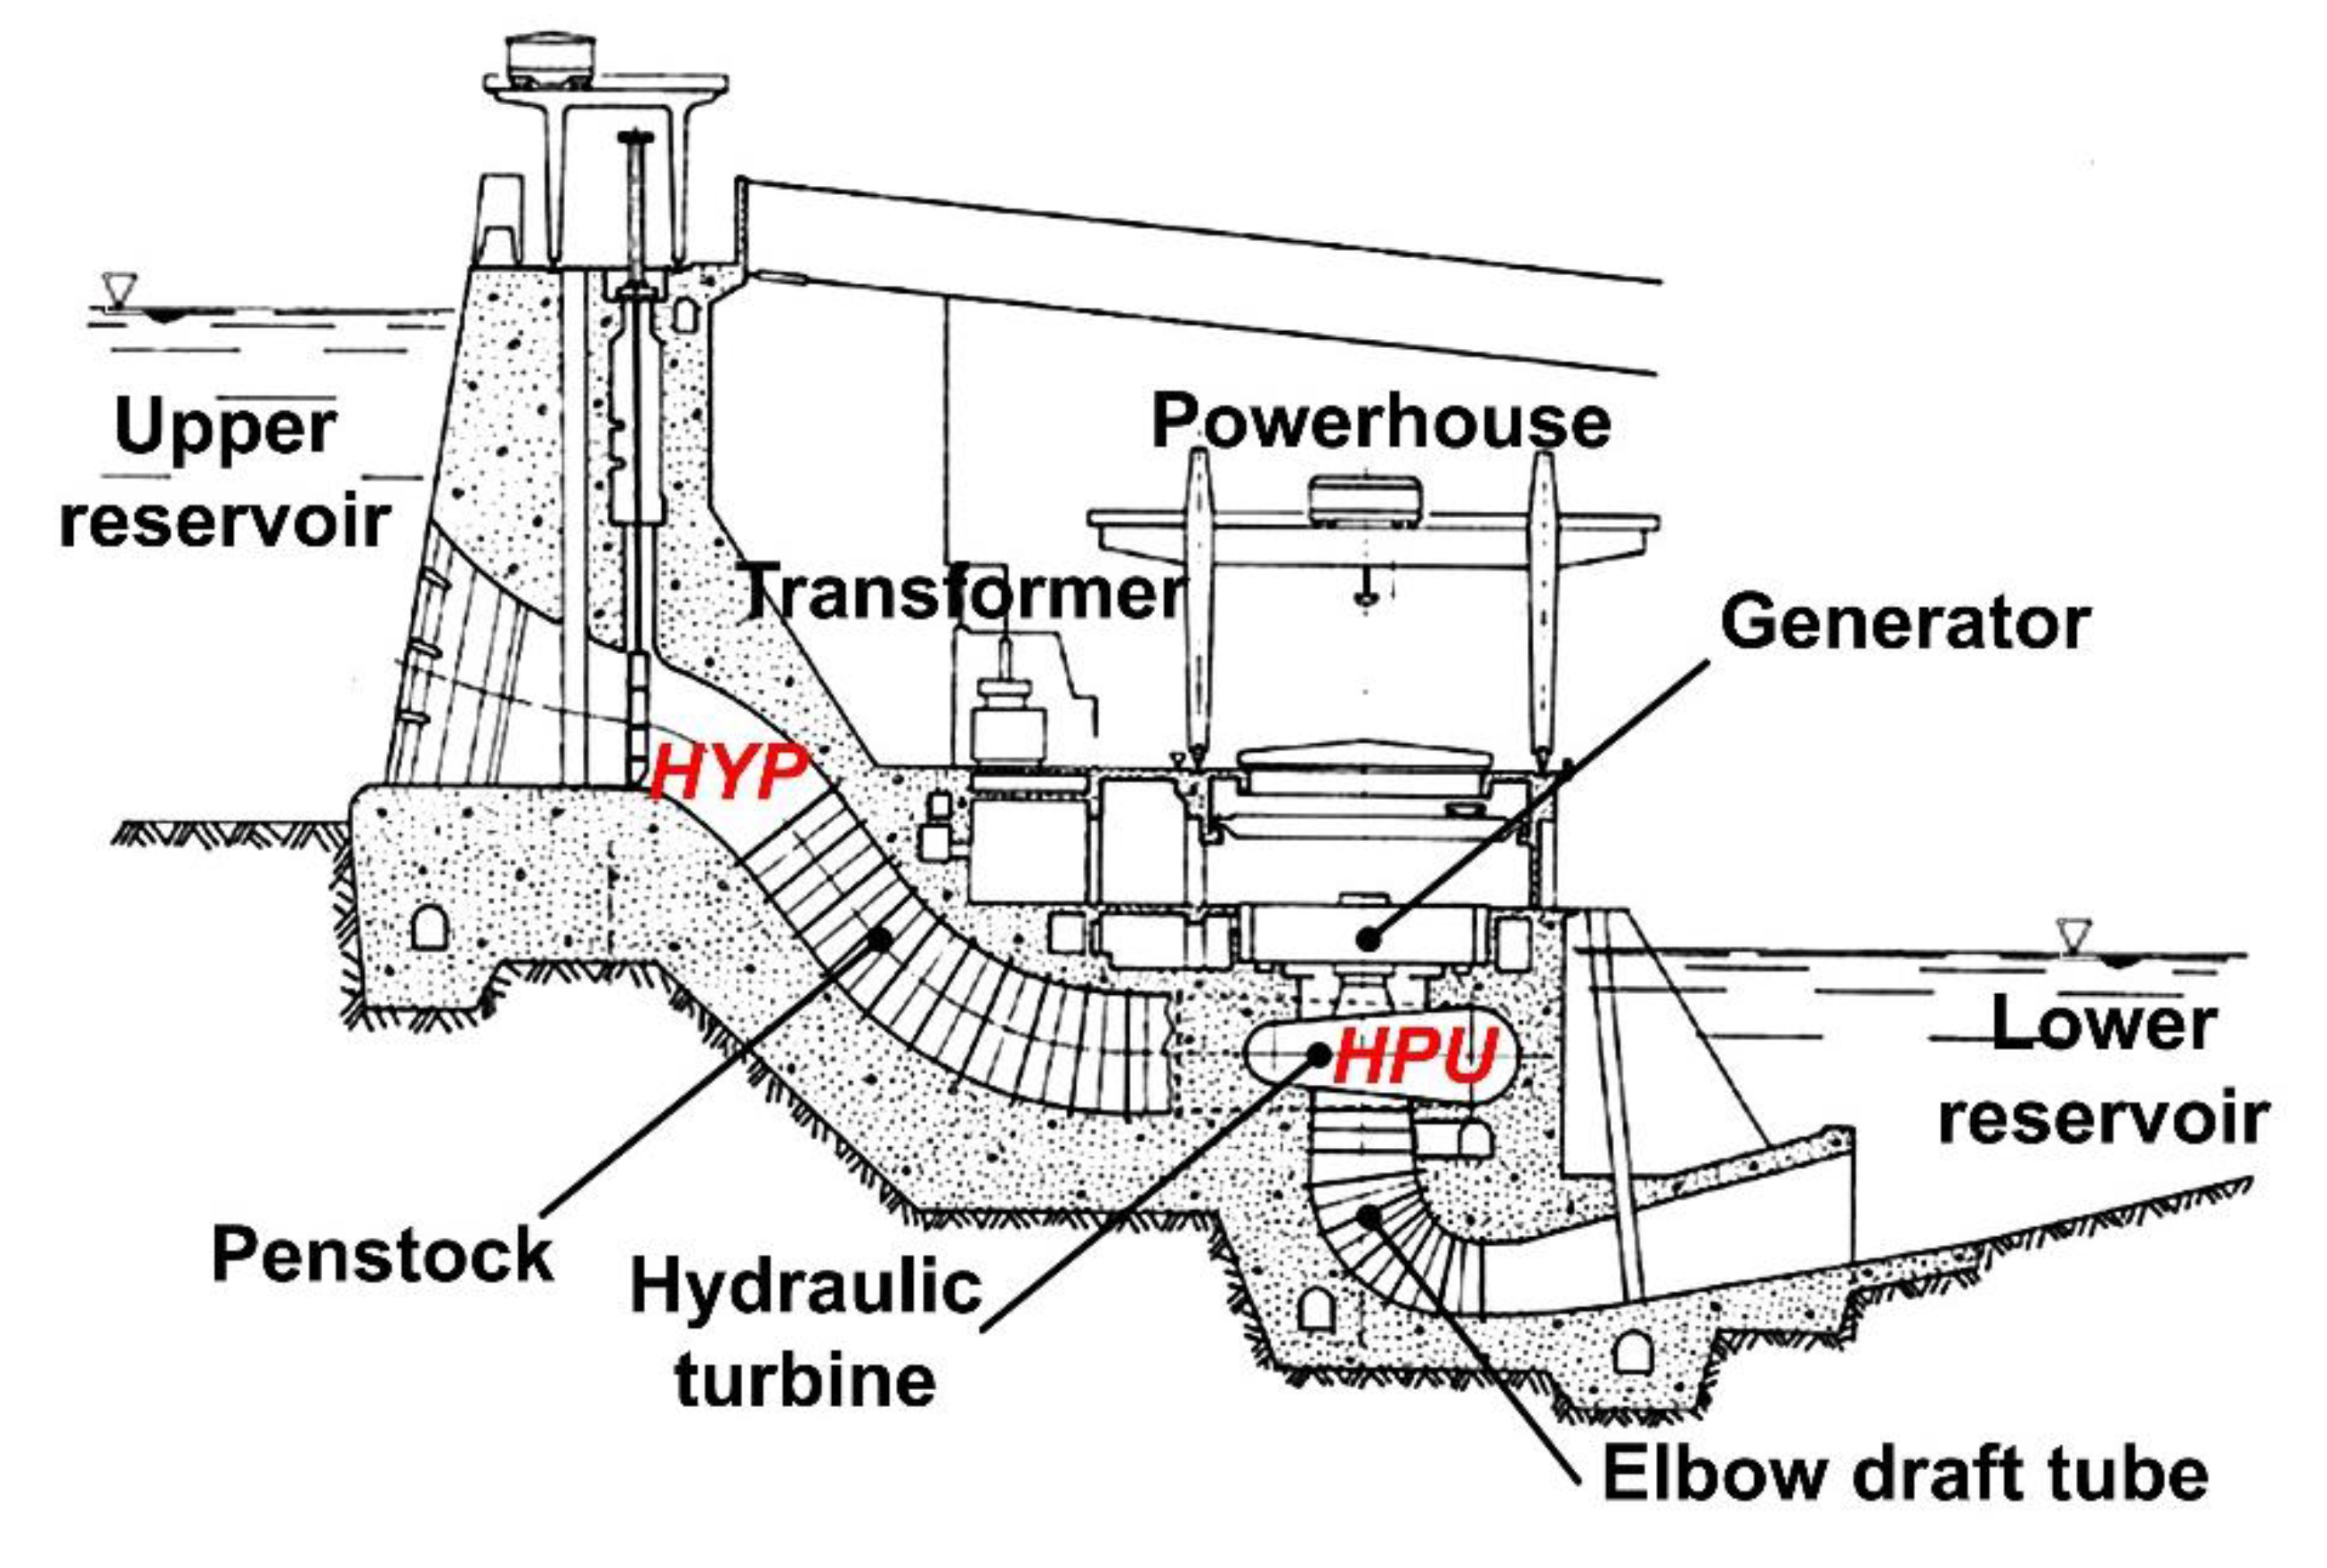
Figure 1. Schematic view of a hydroelectric power plant: Hydro Power Unit (HPU) and Hydraulic Passage (HYP).
Energies 15 01526 g001
Figure 2. Maximum overpressure values in terms of wicket gate opening during load rejection procedure for medium–head Francis turbine (40 to 50 mwc) performed from 2012 to 2018 in the hydropower plants denoted Q (♦), T (▲), S (■), R (▲) and U (●) [88].
Energies 15 01526 g002
Figure 3. Overpressure function of wicket gate opening in load rejection at different tBAF for a propeller in the hydropower plant, tests performed in 2018 [88].
Energies 15 01526 g003
Figure 4. Temporal analysis of the parameters: (a) load rejection of the Francis turbine installed in hydropower plant (tests performed in 2019 by Lupa et al. [88]); (b) measured and calculated pressures during a load rejection for a bulb turbine (tests performed in 2006 by Kolšek et al. [89]).
Energies 15 01526 g004
Figure 5. Influence of second slope closing on overpressure for a hydropower plant equipped with Kaplan turbine performed in 2017 [88].
Energies 15 01526 g005
Figure 6. Study for the second slope closing influence [89].
Energies 15 01526 g006
Figure 7. Overpressure peak from speed-no-load measured in 2016 in hydropower plant equipped with high-head Francis turbines [88].
Energies 15 01526 g007
Figure 8. Pressures in time during a power load drop, tests performed in 2019 in hydropower plant equipped with high-head Francis turbines [88].
Energies 15 01526 g008
Figure 9. Evolution of penstock pressure during normal operation for the grid control [82].
Energies 15 01526 g009
Figure 10. Evolution of transient pressure during load variations at the turbine inlet (PTX2) between the wicket gate and runner (VL01) and in the draft tube cone (DT11, DT21) [90].
Energies 15 01526 g010
Figure 11. Penstock failure at Oigawa HPP in 1950 in Japan [93].
Energies 15 01526 g011
Figure 12. Penstock failure at Lapino HPP in 1997 in Poland [94,95].
Energies 15 01526 g012
Figure 13. Comparison of efficacy in reducing the maximum pressure for different methods of controlling a turbine shut-off valve closing by different laws [103].
Energies 15 01526 g013
Figure 14. Concept of the Hydro-Clone system based on continuous monitoring of parameters linked with a real-time simulation [104].
Energies 15 01526 g014
Figure 15. Strategy of intelligent maintenance based on monitoring linked to system diagnostic and maintenance program [105]: (a) traditional maintenance program methodology with accent on periodic activities; (b) in red the elements of the recommended intelligent maintenance method taking advantage of the recording, analysis and modeling capabilities of current computer systems, which allow much higher proactivity.
Energies 15 01526 g015
Figure 16. Concept of the Digital Avatar simulation method [106].
Energies 15 01526 g016
Figure 17. Concept of the grid for operational safety improvement measures.
Energies 15 01526 g017
Publisher’s Note: MDPI stays neutral with regard to jurisdictional claims in published maps and institutional affiliations.