Article

An NMR-Based Method for Multiphase Methane Characterization in Coals

1
Carbon Neutrality Institute, China University of Mining and Technology, Xuzhou 221008, China
2
The Key Laboratory of Coal-Based CO2 Capture and Geological Storage, China University of Mining and Technology, Xuzhou 221116, China
3
School of Resources and Geosciences, China University of Mining and Technology, Xuzhou 221116, China
4
Xi’an Research Institute, China Coal Technology and Engineering Group, Xi’an 710077, China
5
Key Laboratory of Metallogenic Prediction of Nonferrous Metals and Geological Environment Monitoring, Ministry of Education, School of Geosciences and Info-Physics, Central South University, Changsha 410083, China
6
College of Civil Engineering, Anhui Jianzhu University, Hefei 230601, China
*
Authors to whom correspondence should be addressed.
Energies 2022, 15(4), 1532; https://doi.org/10.3390/en15041532
Submission received: 9 January 2022 / Revised: 6 February 2022 / Accepted: 16 February 2022 / Published: 18 February 2022
(This article belongs to the Special Issue Advances in Methane Production from Coal, Shale and Other Tight Rocks)

Abstract

:
Discriminating multiphase methane (adsorbed and free phases) in coals is crucial for evaluating the optimal gas recovery strategies of coalbed methane (CBM) reservoirs. However, the existing volumetric-based adsorption isotherm method only provides the final methane adsorption result, limiting real-time dynamic characterization of multiphase methane in the methane adsorption process. In this study, via self-designed nuclear magnetic resonance (NMR) isotherm adsorption experiments, we present a new method to evaluate the dynamic multiphase methane changes in coals. The results indicate that the T2 distributions of methane in coals involve three different peaks, labeled as P1 (T2 < 8 ms), P2 (T2 = 20–300 ms), and P3 (T2 > 300 ms) peaks, corresponding to the adsorbed phase methane, free phase methane between particles, and free phase methane in the sample cell, respectively. The methane adsorption Langmuir volumes calculated from the conventional volumetric-based method qualitatively agree with those obtained from the NMR method, within an allowable limit of approximately ~6.0%. Real-time dynamic characterizations of adsorbed methane show two different adsorption rates: an initial rapid adsorption of methane followed by a long stable state. It can be concluded that the NMR technique can be applied not only for methane adsorption capacity determination, but also for dynamic monitoring of multiphase methane in different experimental situations, such as methane adsorption/desorption and CO2-enhanced CBM.

1. Introduction

The increasing attention paid to clean energy has promoted the efficient development and exploration of the coalbed methane (CBM) industry [1,2,3,4]. At the same time, the scientific characterization of coals’ petrophysical properties, such as pore structure, permeability, and methane adsorption capacity, have recently aroused great research interest [5,6,7,8]. For example, the methane adsorption capacity is a crucial parameter in evaluating the methane content of CBM reservoirs [7,9,10,11]. Additionally, investigating the methane adsorption process in coal pore systems is essential to establish and assess CBM wells’ production [12,13]. Thus, an accurate and real-time dynamic characterization of the methane adsorption process in coals is necessary for CBM production.
Commonly, the methane adsorption capacity is determined using the volumetric-based adsorption isotherm [14,15]. However, this method is quite complicated and susceptible to impurities or the volume effect, may result in larger variations in experimental results [16]. Furthermore, the Langmuir isotherm curve consists only of cross-plots of adsorbed methane content and experimental pressure, and has the significant shortcoming that it is incapable of depicting any details in the methane adsorption process. The dynamic characterization of the methane adsorption process in coals is usually evaluated based on the assumption of a single pore or regular structure pore network model, which is derived from well-established sandstone or tight sandstone [17,18]. However, due to complicated and heterogeneous coal pore structures, the model obtained from sandstone or tight sandstone needs to be modified, which is complex and time consuming. To the best of the authors’ knowledge, few methods can be individually and directly applied for the dynamic characterization of methane adsorption in coals.
Nuclear magnetic resonance (NMR) is a non-destructive technique that has been widely applied for investigating hydrogen-bearing reservoir fluids’ petrophysical properties [19,20,21,22,23,24,25]. Based on the fully water-saturated and centrifuged NMR transverse relaxation time (T2) distribution of coals, Zheng et al. [22] calculated the T2 cutoff values and then used them to classify pore types and evaluate the full-scale pore size distribution. Guo et al. [26] first applied the NMR T2 measurement to evaluate the methane T2 distributions of low-rank coals. They found three different methane relaxation mechanisms existing in coals: adsorbed methane, porous medium confined methane, and free methane. Vasilenko [27] presented an NMR study of the ratio between the free and adsorbed phase methane in fossil coals, and found that the adsorbed methane was the predominant phase state, only upon the opening of a high-pressure chamber after the emission of methane from filtration channels. Liu et al. [28] discussed the CO2 enhanced gas recovery efficiency in shales based on NMR measurement. They found that the higher concentration ratios of CO2/CH4 are more efficient for gas recovery. By introducing the NMR relaxation method, Yao et al. [29] investigated the multiphase methane relaxation characterization in shales. In their study, NMR peaks with T2 < 1 ms and 1–50 ms corresponded to the adsorbed phase methane and free phase methane in shale, respectively. Additionally, Yao et al. [30] characterized the methane adsorption capacity on two low volatile bituminous coals using low-field NMR measurements and revealed that the P1 peak amplitude increases rapidly at the beginning stages, and then trends to attain an ultimate value, in a manner similar to the Langmuir equation. However, the research objects in Yao et al. [30] were only two low-rank coals, which restricted the NMR relaxation measurement application for medium- and high-rank coals, especially for some coals containing paramagnetic minerals. Previous achievements have verified the qualitative ability of the NMR relaxation method in methane adsorption characterization in unconventional reservoirs (e.g., shale and coal). Moreover, few studies relate to the application of the NMR data for estimating the real-time dynamic methane adsorption process in coals.
In this paper, a series of comparative volumetric- and NMR-based methane adsorption measurements were performed for eight coals whose ranks were strikingly different. Comparing experimental results from the volumetric method, the accuracy of the NMR-based method for methane adsorption characterization in coals having different ranks was validated. Based on the NMR T2 distribution in different time intervals, the methane adsorption dynamic process characteristics in coals were investigated.

2. Experimental Methods
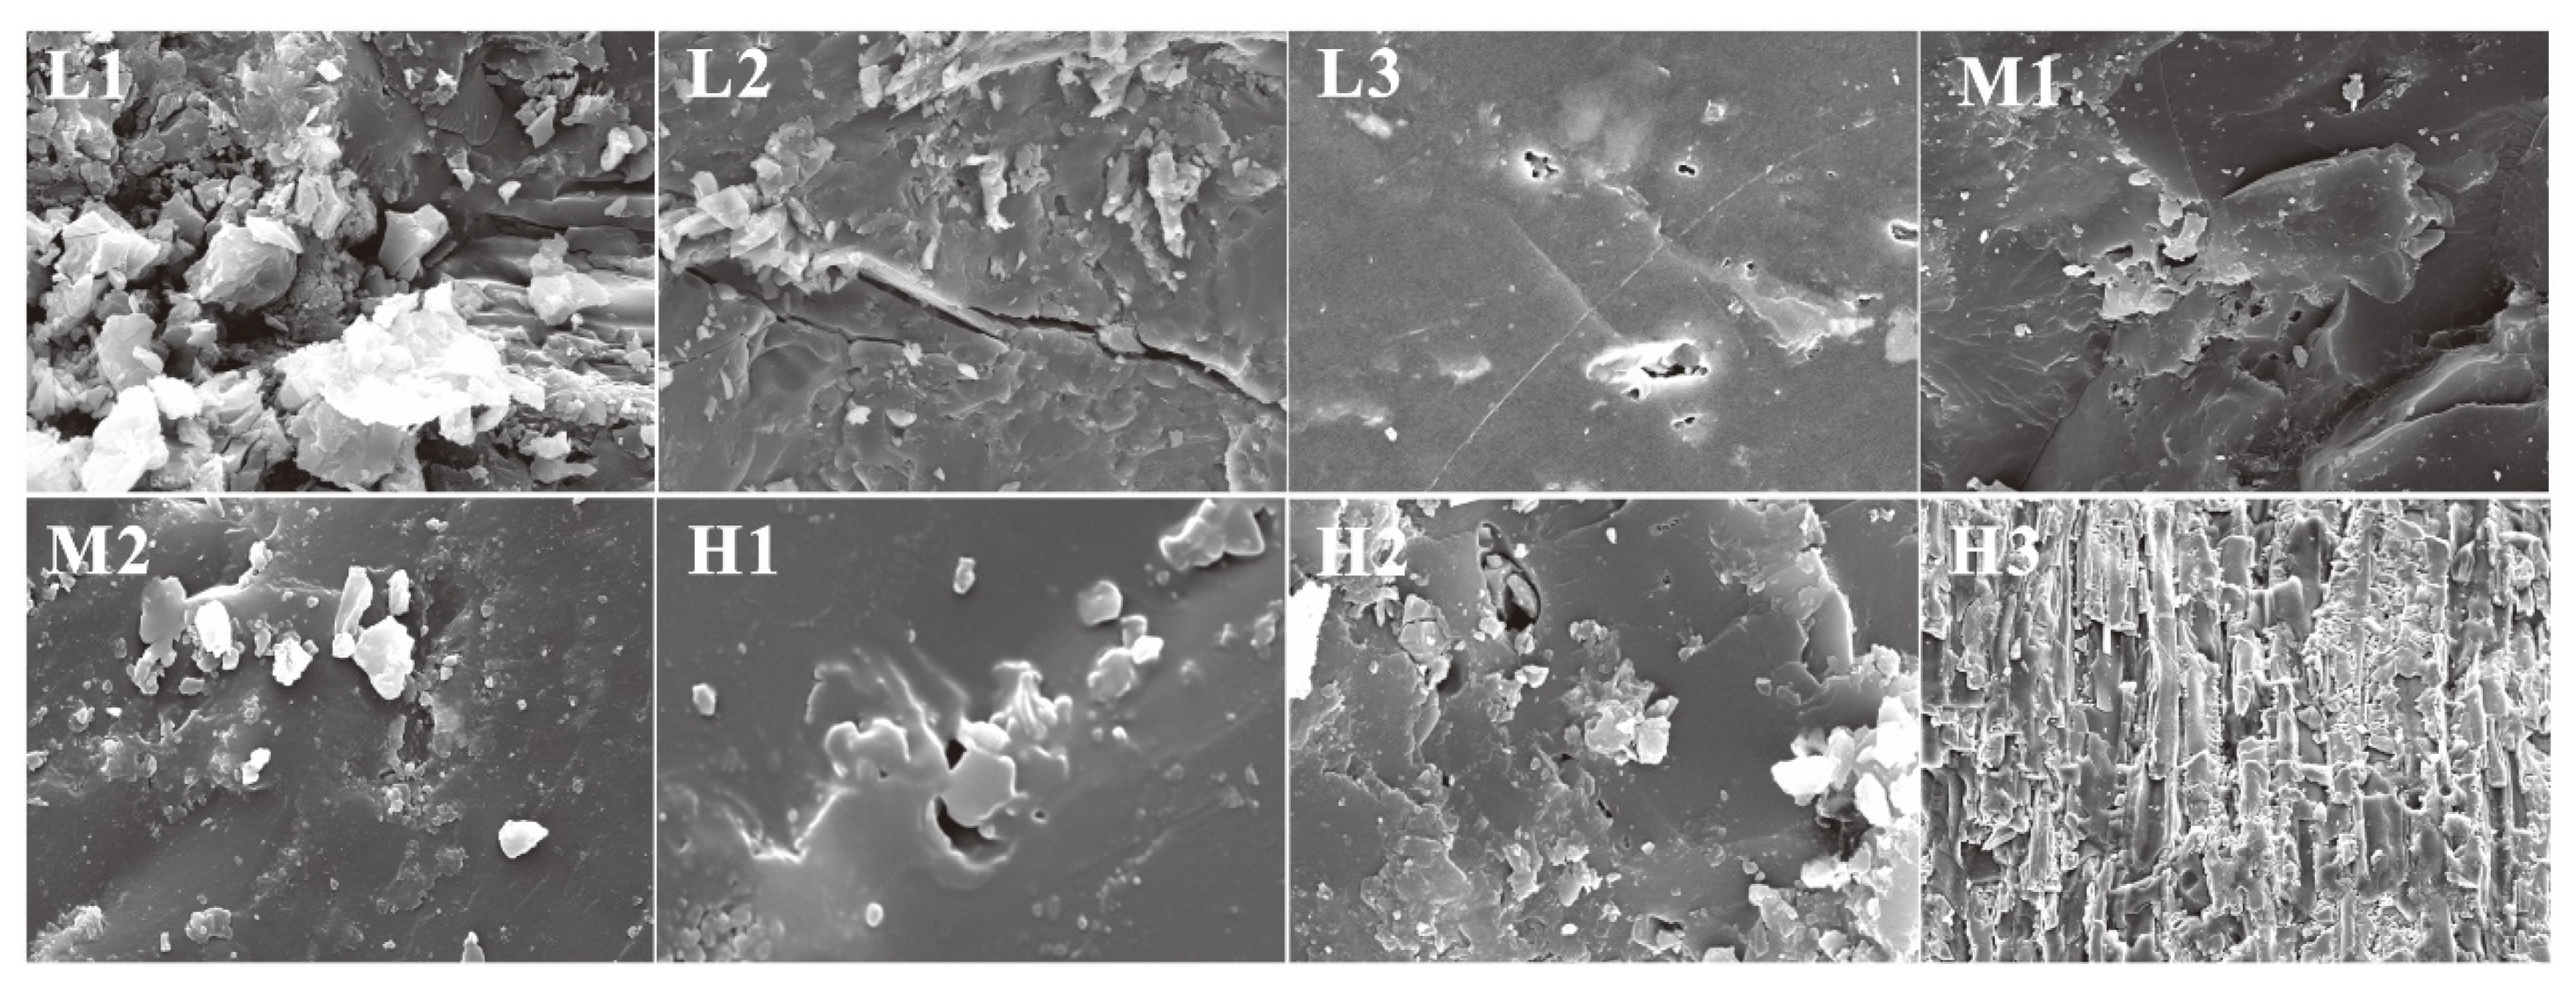
2.1. Coal Sampling

In this study, a total of eight block coals (20 × 20 × 20 cm3) having different ranks were collected from the Junggar basin, Ordos basin, and Qinshui basin, China. Table 1 shows the summary of the detailed basic petrophysical coal information. The maximum vitrinite reflectance (Ro,m) of the selected samples ranges from 0.52% to 3.03%, covering a wide array of coal ranks, including low, medium, and high ranks.
Figure 1 shows the pore morphology characteristics of the selected coals by the scanning electron microscope (SEM) measurement. Results show that the pore types developed in samples L3, M1, H1, and H2 are mainly gas pores. Intergranular pores and residual plant tissue pores are found in samples M2 and H3, respectively, whereas fractures are well developed in samples L1 and L2.

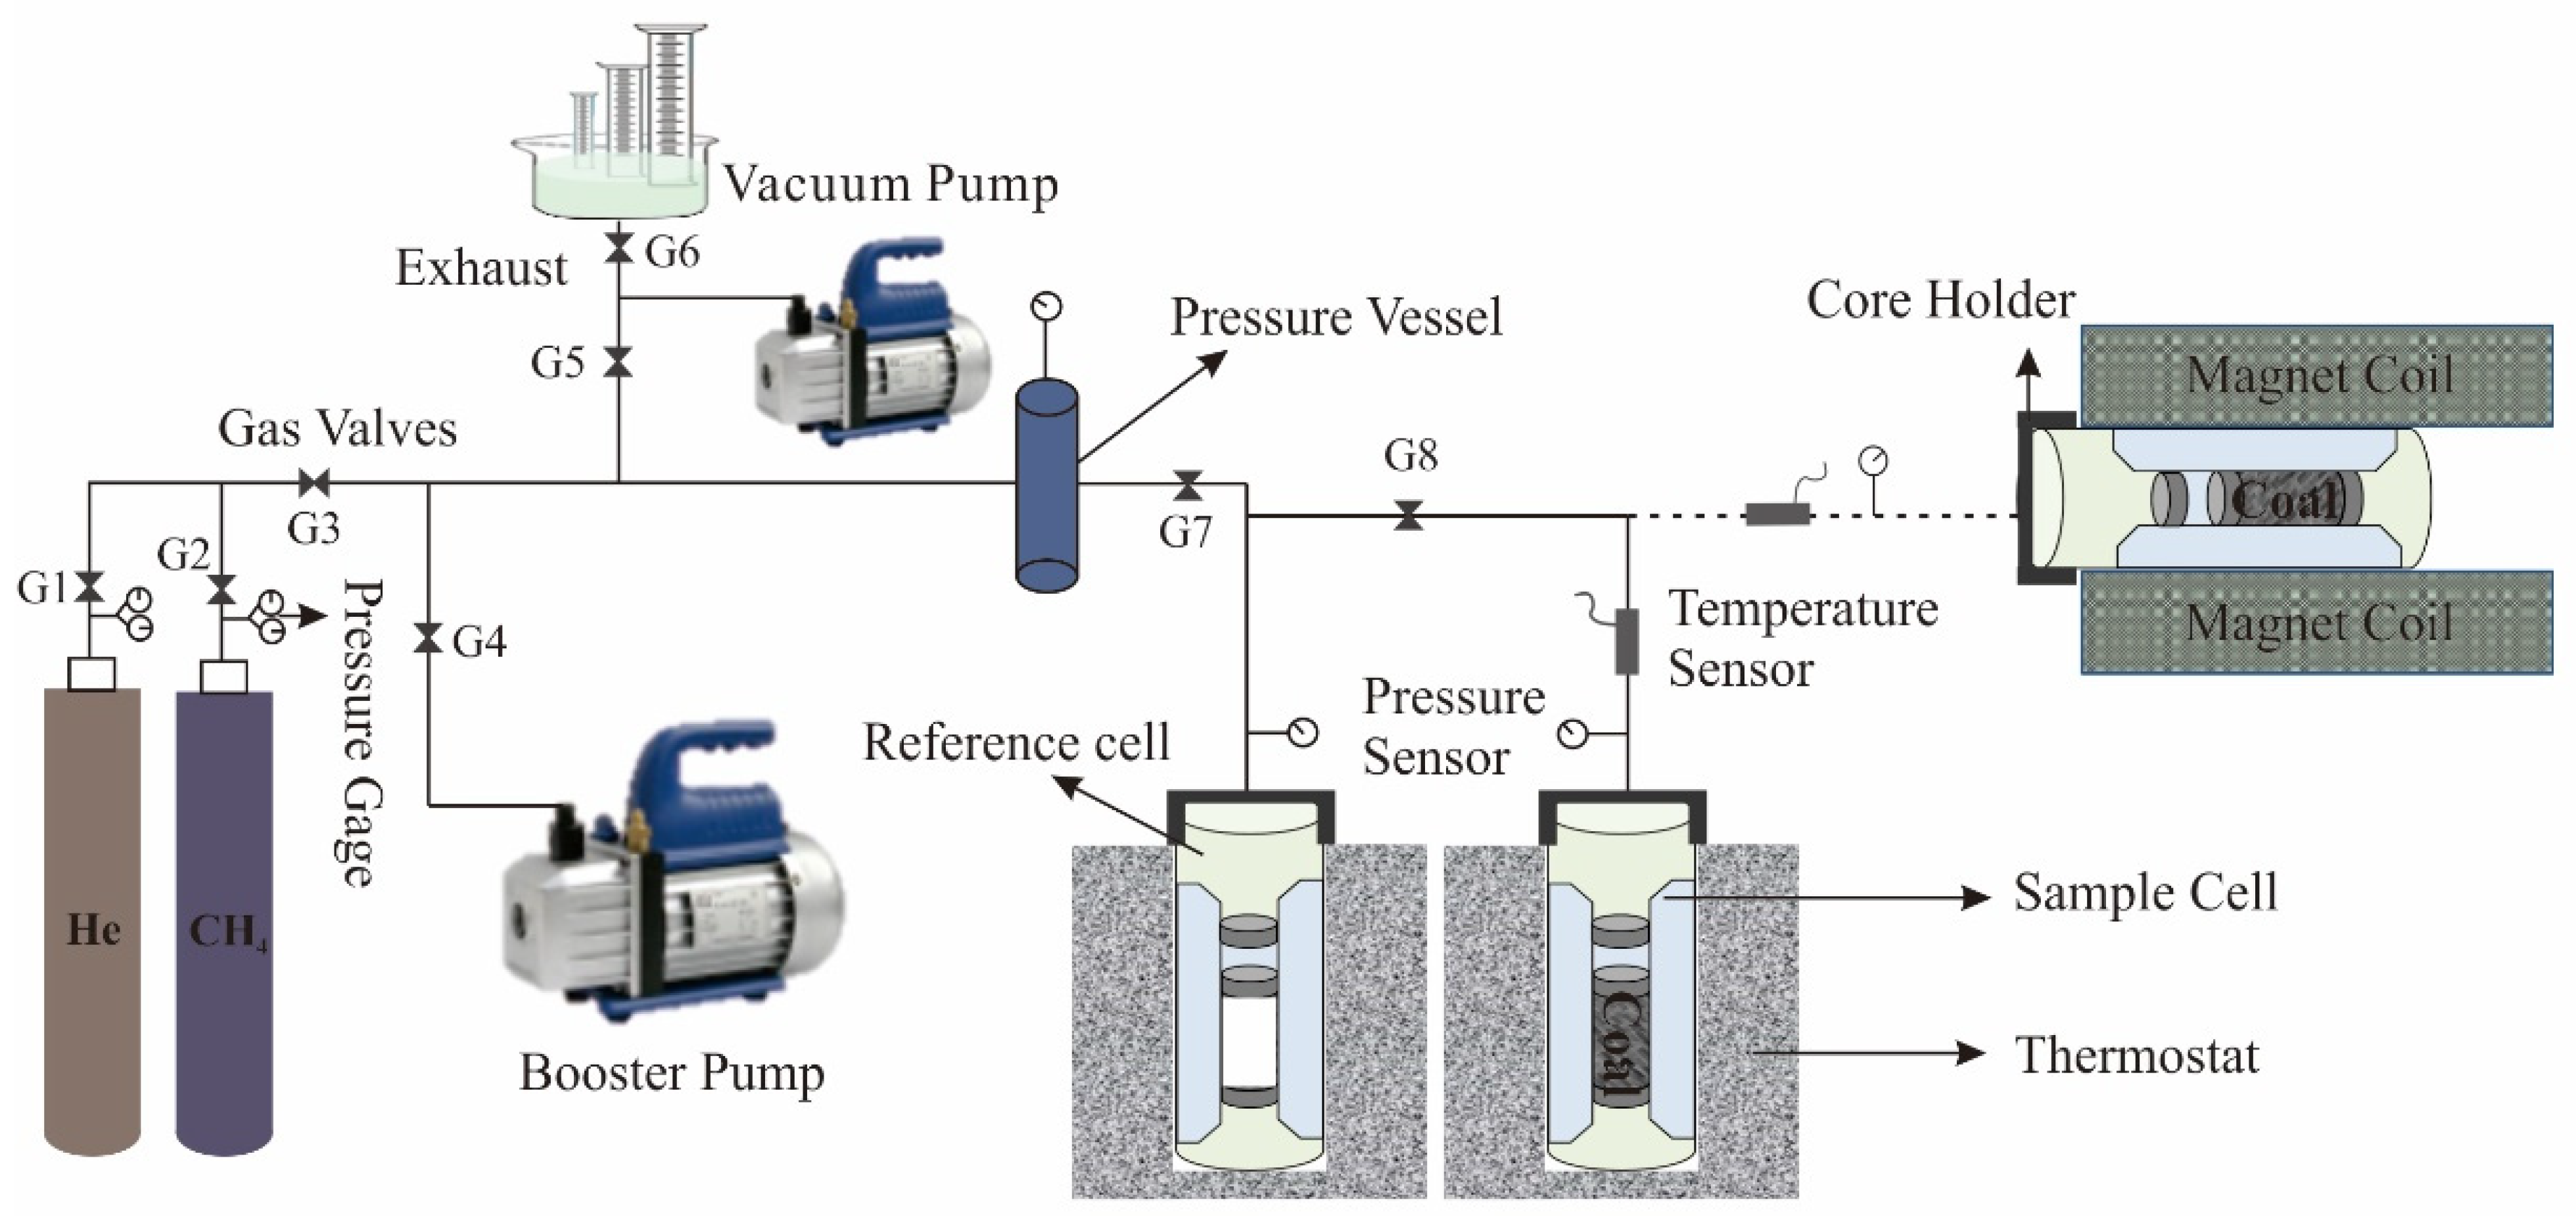
2.2. NMR Adsorption Measurements

Compared with NMR T1 measurements, T2 measurements are preferred for the characterization of petrophysical properties in rocks due to their obvious advantages, such as short testing time, good applicability, and convenient operation. Generally, the NMR T2 characteristics are tested by applying the CPMG sequence. Based on the NMR principle, T2 can be characterized as follows [31,32,33,34,35]:
1 T 2 = 1 T 2 B + 1 T 2 S + 1 T 2 D = 3 T k 298 η + ρ 2 ( S V ) + D ( γ G T E ) 2 12
where T2B represents bulk relaxation; T2S represents surface relaxation; T2D represents diffuse relaxations; Tk means experimental temperature; η means methane viscosity; ρ2 means surface relaxivity of the sample; S means specific surface area; V means pore volume; D means methane diffusion coefficient; γ means proton gyromagnetic ratio; G means magnetic field intensity; TE means echo spacing time.
1   T 2 = 1 T 2 B + ρ 2 ( S V )
As shown in Figure 2, the experimental set-up of NMR methane adsorption measurement mainly includes five parts: (1) the gas supply system, providing a different gas source for the experimental system; (2) the gas exhaust system, recycling exhaust gas after experiments; (3) a non-magnetic PEEK sample cell, for placement of coal powders; (4) a non-magnetic PEEK reference cell, for transporting and sustaining methane pressure for the sample cell; and (5) an NMR measurement device, measuring the NMR T2 distributions in methane adsorption process. Here, NMR experimental parameters were set to: waiting time, 3000 ms; echo spacing, 0.3 ms; echo numbers, 10,000.
Two independent experiments were performed for methane adsorption characterization by the NMR measurement; one was a free methane T2 relaxation property experiment (no powder coals in the sample cell) and the other was a methane adsorption T2 relaxation experiment.
The free methane T2 relaxation property was measured under different methane pressures, at a stable temperature (304.15 K). The amount of free methane can be determined according to the ideal-gas equation. At the same time, the NMR relaxation distributions of free methane under different pressures were measured using an NMR device.
Prior to methane adsorption T2 relaxation experiments, the sample cell and reference cell must be cleaned to prevent the contamination of impurities. Then, 60–80 mesh powder coals were dried at 368 K in a vacuum oven at least for one day. The workflow of methane adsorption T2 relaxation experiments was as follows:
P1: The powder coals were transformed into the sample cell and placed in vacuum for three hours;
P2: ~8 MPa free methane was injected into the reference cell;
P3: The G8 valve was switched on to introduce the reference cell methane into the sample chamber until it reached the set pressure;
P4: The NMR T2 distributions were continuously measured for methane adsorption until completely adsorbed, with an interval time of 45 min;
P5: The sample cell methane pressure was increased to six different pressure levels, which were repeated for the same sample.

3. Results and Discussions

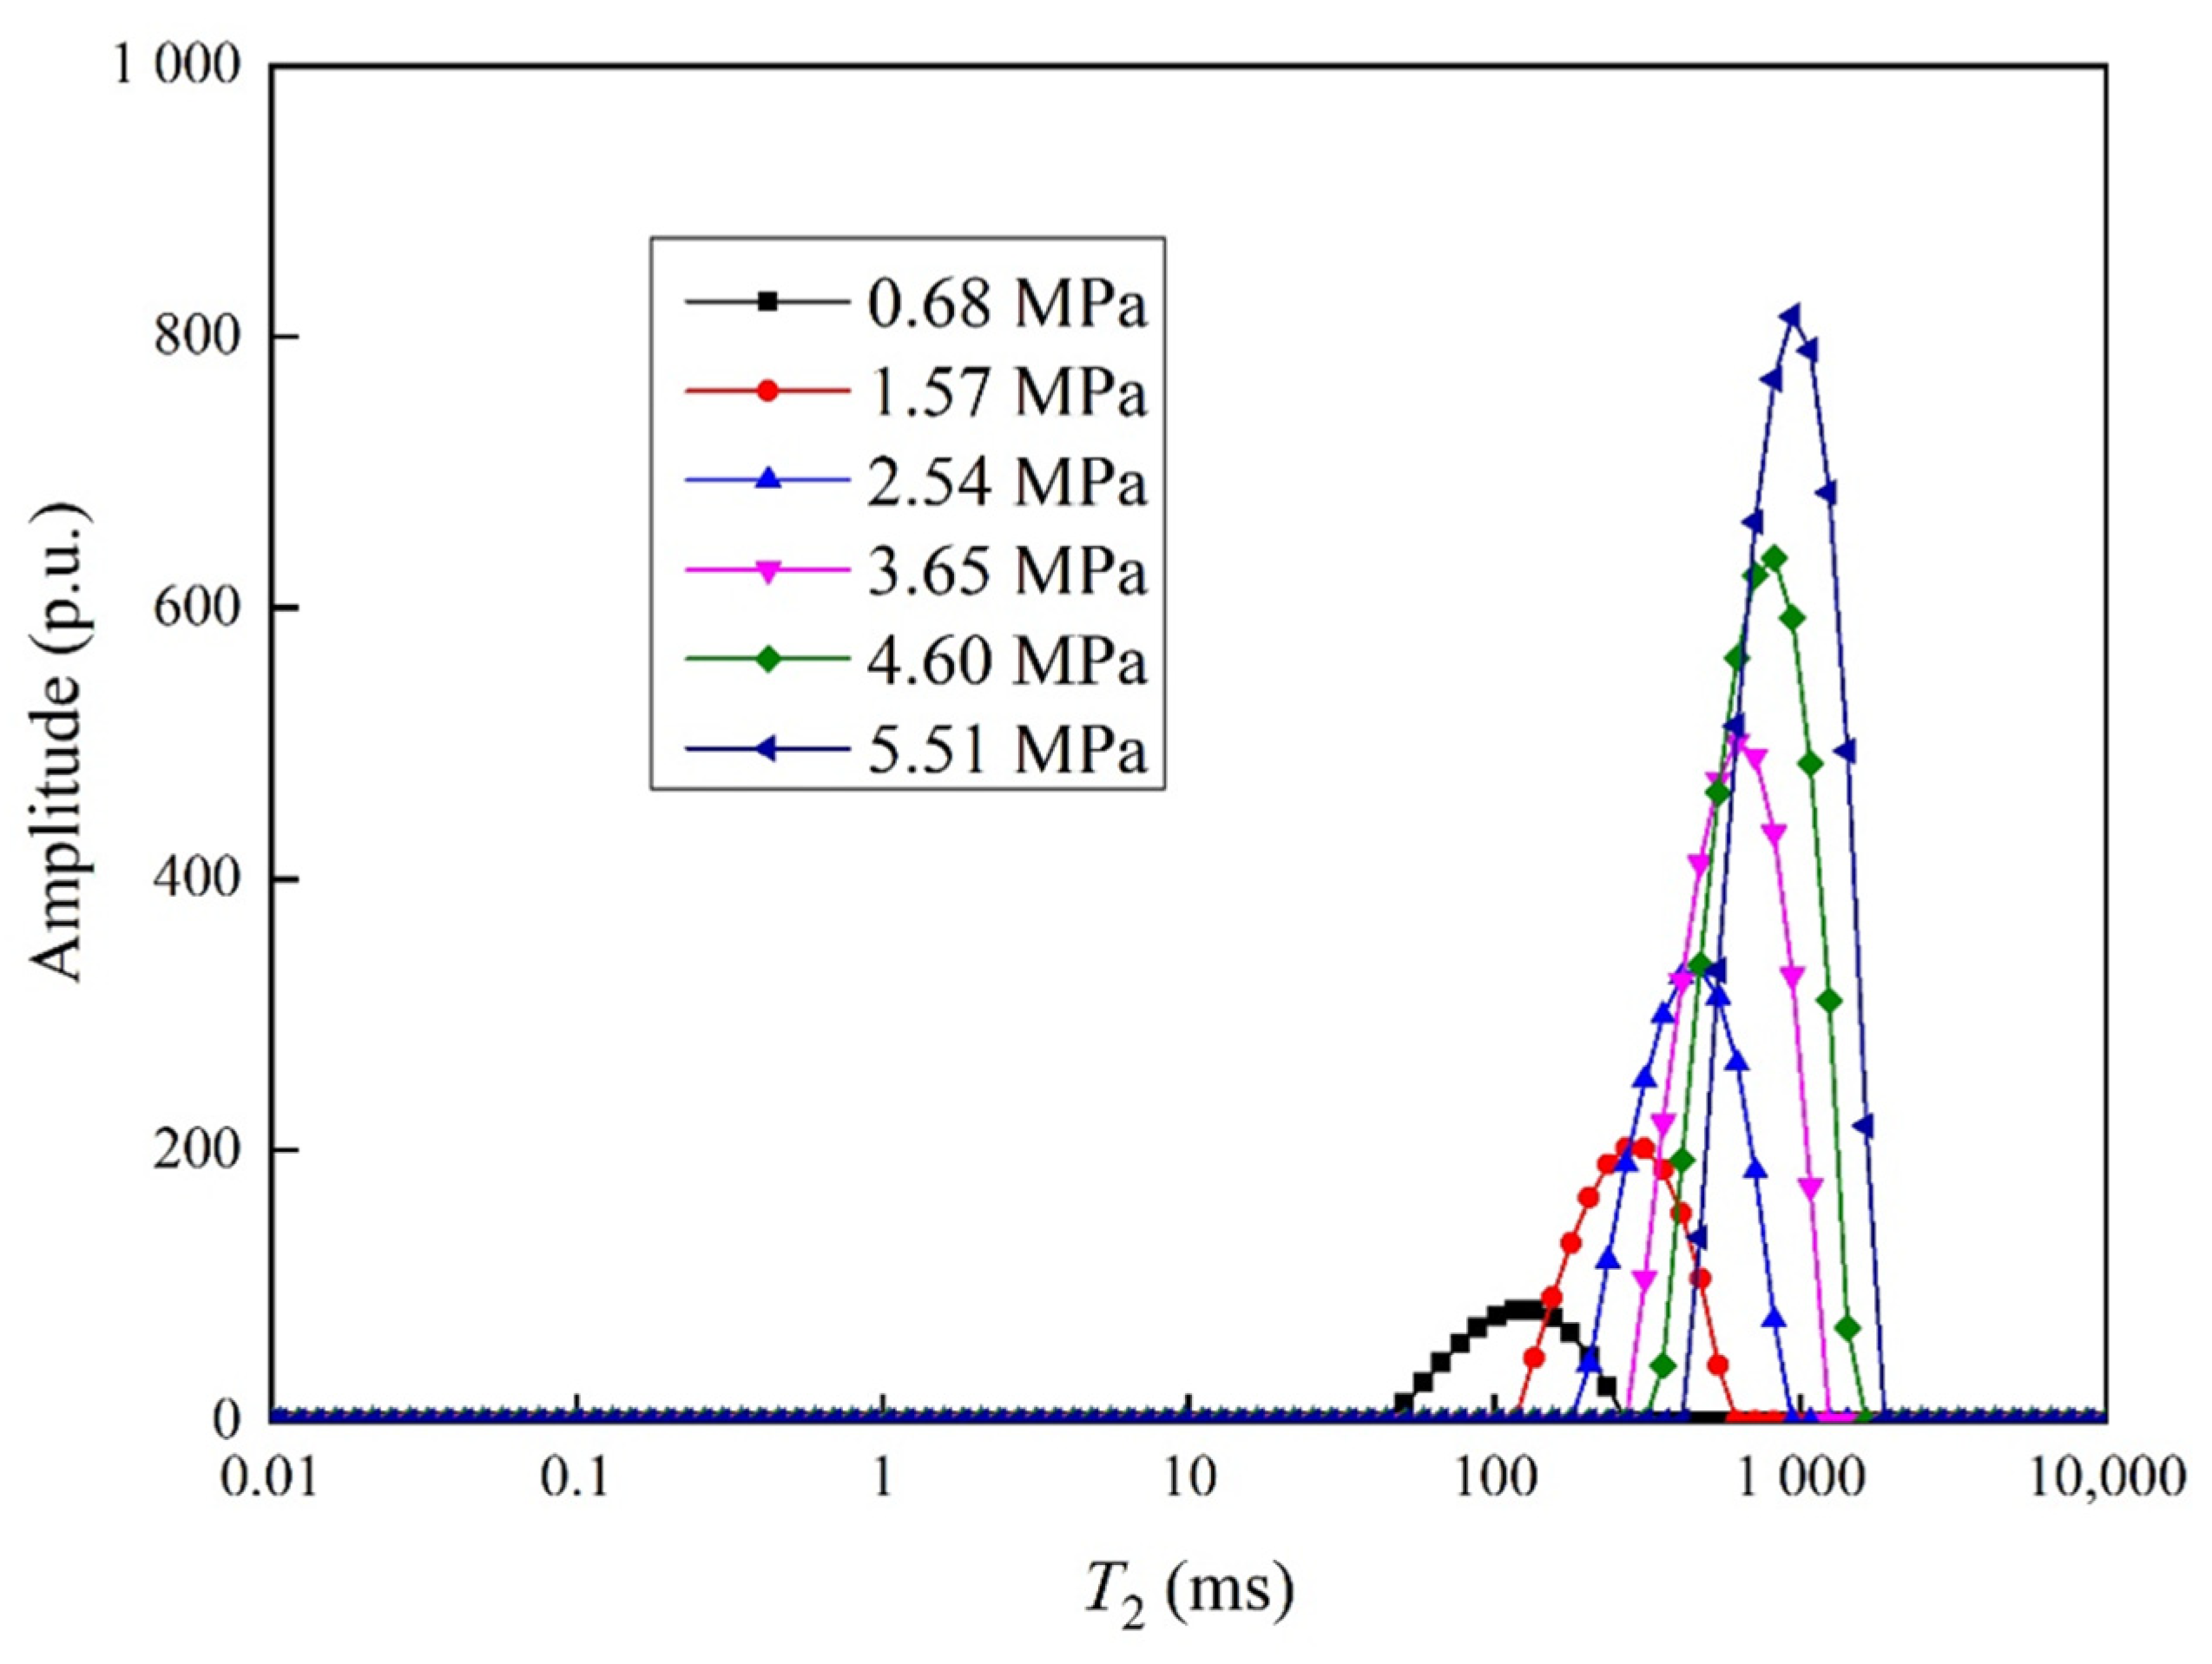
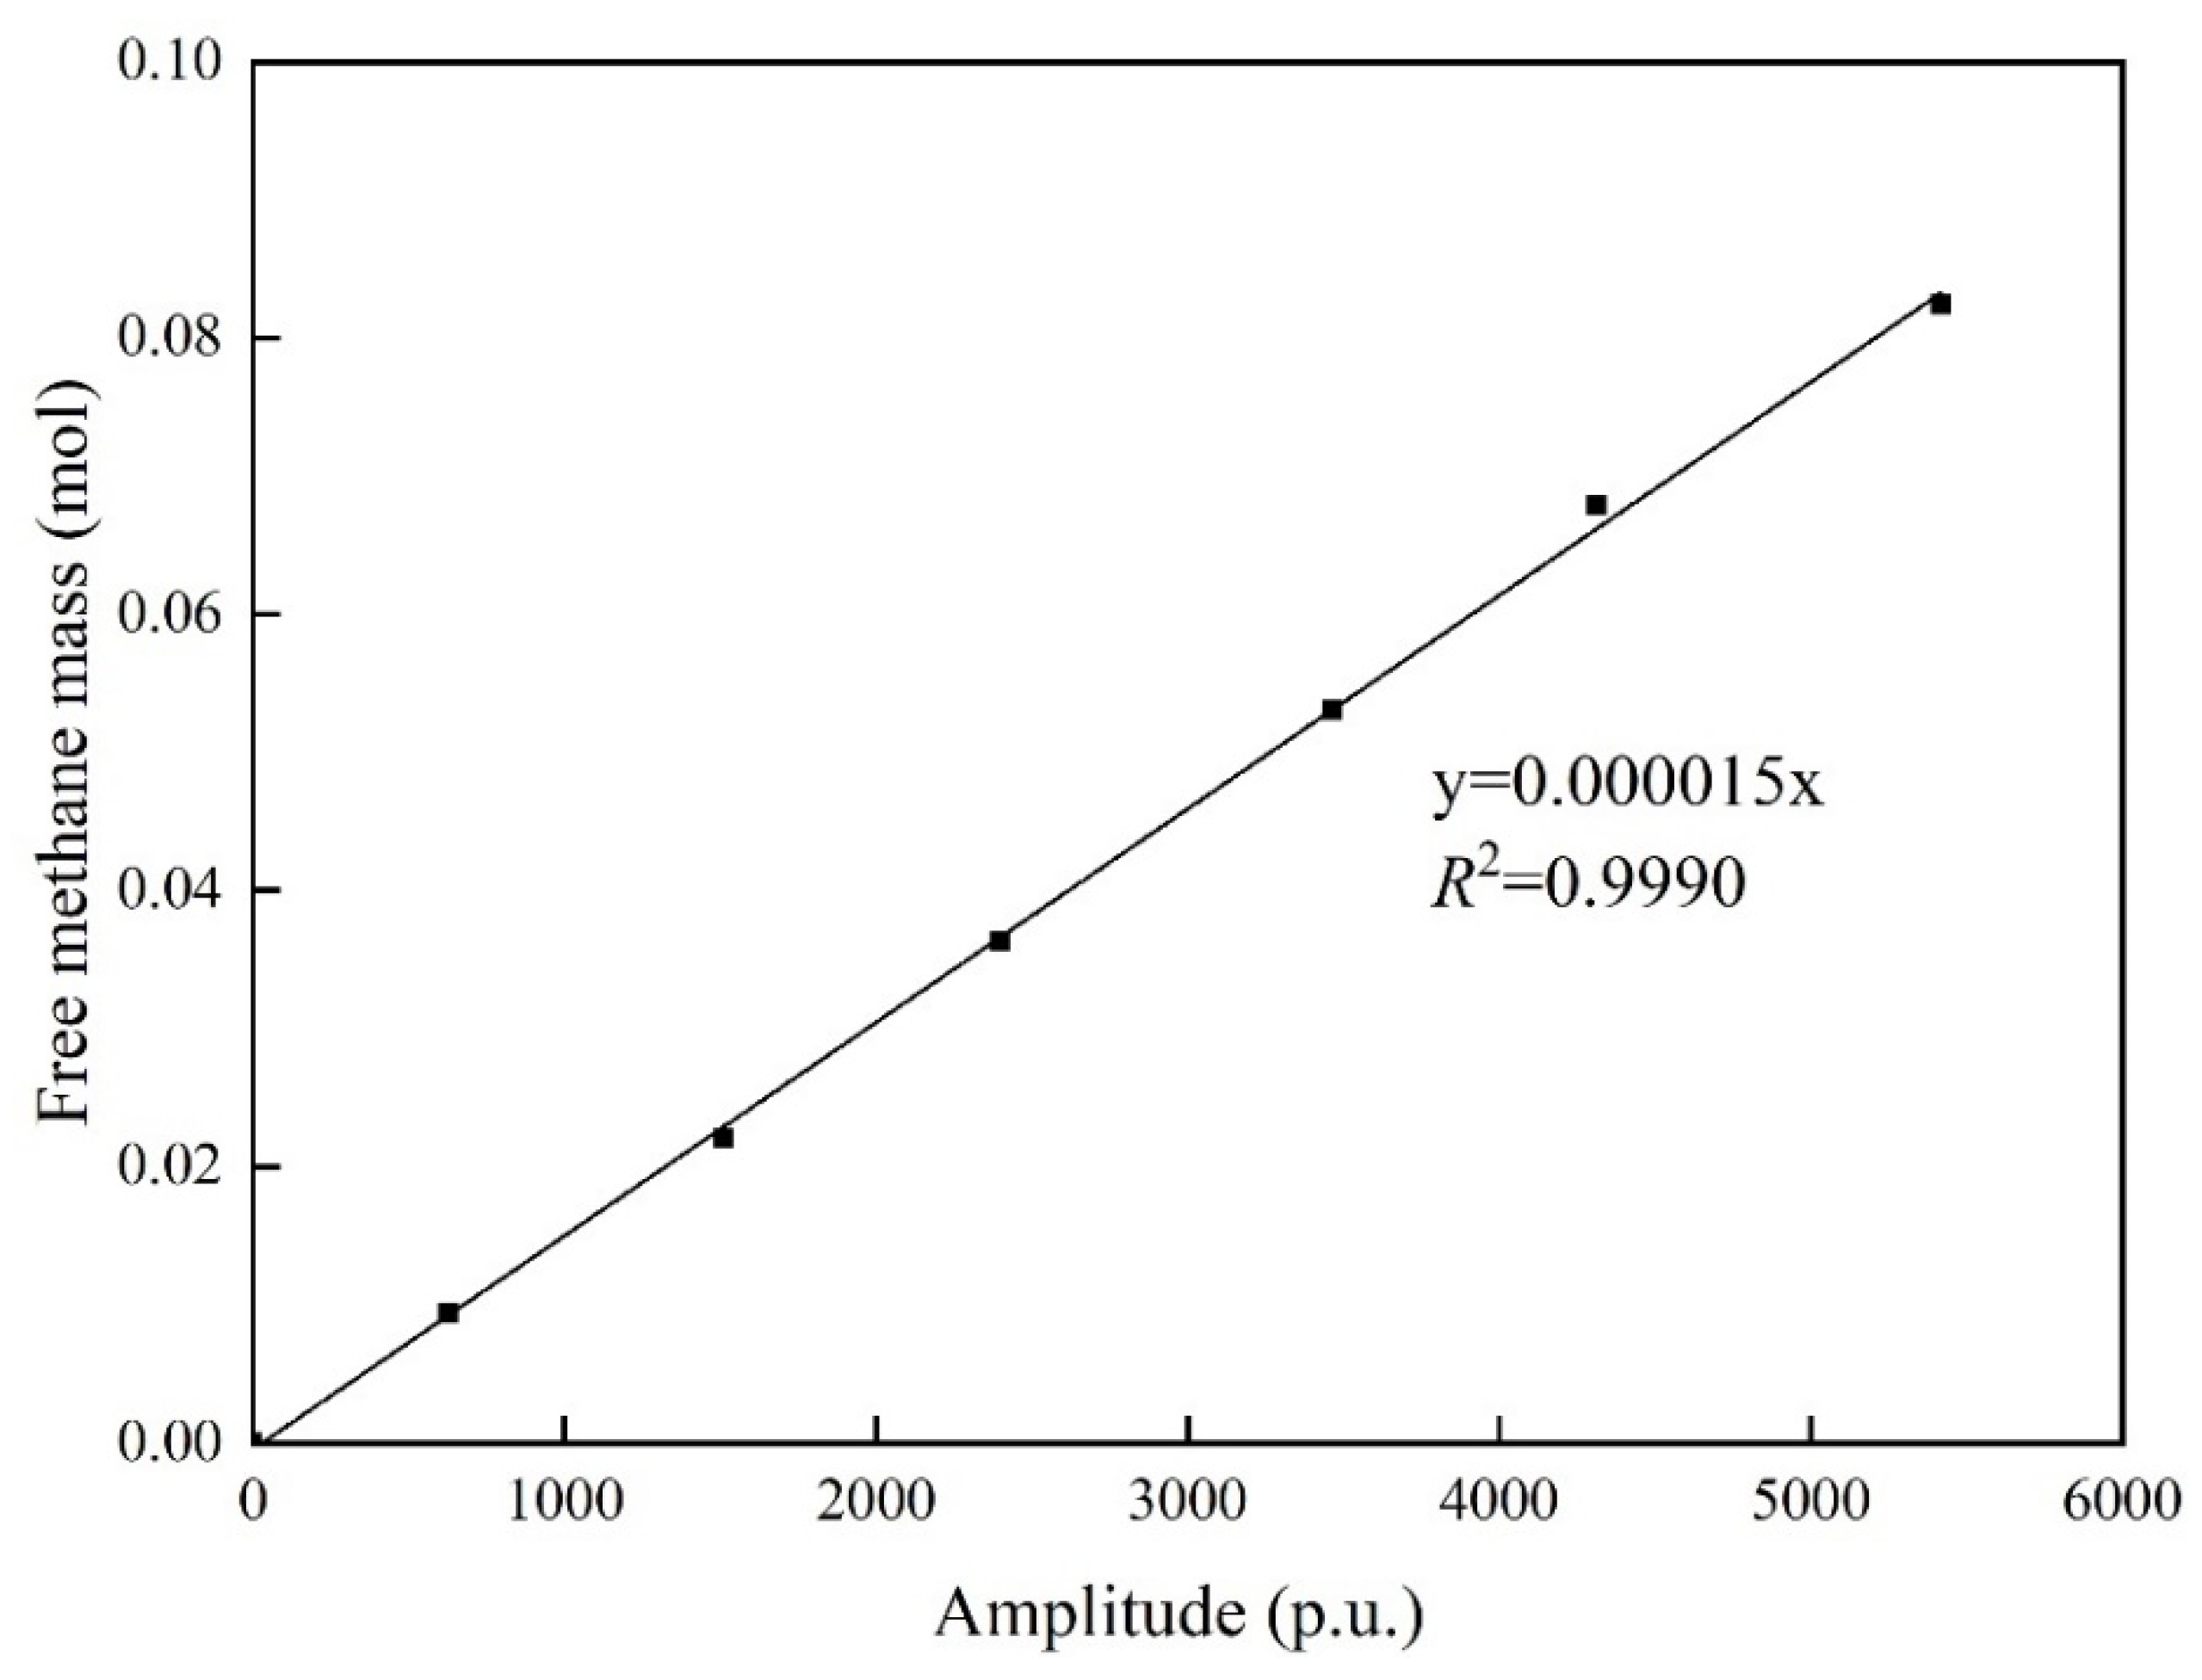
3.1. Free Methane T2 Distributions

As shown in Figure 3, the T2 characteristics for free methane under different pressures exhibit one significant peak. This peak appears at approximately ~50–1500 ms. As shown in Figure 4, the NMR spectra amplitude shows an evident linear relationship with the free methane mass:
y = 0.000015 x ( R 2 = 0.9990 )
where y means the free methane mass; x means the free methane NMR signal amplitude.

3.2. Methane Adsorption T2 Relaxation Characteristics

Methane adsorption T2 spectra for the selected coals are presented in Figure 5. The minimal T2 amplitude of the dry samples (solid purple line) indicates the nuclear responses from the coal itself can be ignored. Results show that the methane adsorption T2 spectra exhibit three peaks: P1, P2, and P3. The NMR P1 peak appears in approximately ~0.1–8 ms, whereas the P2 and P3 peaks emerge in approximately ~20–300 ms and 300–2000 ms, respectively. Based on the NMR principle in Equation (2) and the research results in Yao et al. [30], the multiphase methane in coals characterized by NMR was divided into three parts: (1) the adsorbed phase occurring in the coal pore surface, represented by the NMR P1 peak; (2) the free phase emerging between coal particles, represented by the NMR P2 peak; and (3) the free phase occurring in the sample cell free space, represented by the NMR P3 peak. Here, we defined the multiphase methane in coals as the adsorbed phase and the free phase.
Figure 5 shows that all peak (P1, P2, and P3) amplitudes have an increasing trend with the increase in methane pressure. In order to advance quantitative characterization of the NMR P1 peak variation, the relationship between NMR P1 peak amplitude and methane pressure is plotted in Figure 6a. The results show that the NMR P1 peak amplitude rapidly increases at the beginning stages, and then trends to attain an ultimate value, in a manner similar to the Langmuir equation.
Figure 6b shows that the free phase methane amplitudes have a linear relationship with the methane pressure. The results in Figure 6 confirm that the NMR P1 peak represents the adsorbed phase methane, and NMR P2 + P3 represent the free phase methane. Moreover, the adsorbed methane content cannot be determined by NMR P1 amplitude directly because the relaxation mechanisms are obviously different between free phase methane and adsorbed phase methane. Free phase methane was controlled by bulk relaxation, whereas adsorbed phase methane surface relaxation was controlled by surface relaxation [36].

3.3. Methane Adsorption Capacity Determination

Methane adsorption capacity is crucial for understanding and predicting the CBM content [37,38,39,40]. This section provides a detailed comparison of the methane adsorption capacity based on the volumetric method and the self-designed NMR method. Then, the application of the NMR-based method to different coals is further estimated and discussed.

3.3.1. Volumetric-Based Method

Volumetric-based adsorption measurements are commonly used for calculating the methane adsorption capacity in coals. Based on the equation of the state of an ideal gas, the reduced amount of free phase methane can be calculated based on the reduction in sample cell pressure:
P V = n Z R T
where P means experimental pressure; V′ means free methane volume; n means free methane amount; Z means compressibility factor; R is 8.3144 J/(mol·K); T means experimental temperature.
Based on the volumetric-based adsorption experimental data, including adsorption pressure (P) and adsorption volume (V), the Langmuir volume (VL) and pressure (PL) can be calculated using the Langmuir equation:
V = V L P P + P L
where V means experimental adsorption volume, equaling to the reduction in free methane volume in the cells; P means experimental pressure, which can be obtained directly from a pressure sensor in the sample cell. VL and PL mean the Langmuir volume and Langmuir pressure, which can be determined based on Langmuir curve fitting between the parameters of experimental adsorption volume (V) and experimental pressure (P).
As shown by the blue dotted line in Figure 7, the volumetric-based adsorption experimental data exhibit an excellent fit with the Langmuir curve (Figure 7). As listed in Table 2, the volumetric-based Langmuir volumes (VL-vol) are in the range of 5.79–21.14 cm3/g, whereas the volumetric-based Langmuir pressure (PL-vol) ranges from 0.65 to 2.75 MPa.
Figure 8 displays the relationships between VL-vol and coal’s basic petrophysical parameters (Ro,m, vitrinite + inertinite content, FCd, and Ad content). The VL-vol shows a ‘U-morph’ relationship, with Ro,m, having a minimum value at approximately ~1.6% (Figure 8a). The ‘vitrinite + inertinite’ content shows a positive relationship with the values of VL-vol (Figure 8b), but no significant correlations were found between the vitrinite content, inertinite content, and VL-vol (data not shown here). As shown in Figure 8c, the VL-vol is positively correlated with the FCd content. Compared with the results in Figure 8a, the influence of FCd content on Langmuir volume is weaker than that of Ro,m. Figure 8d displays the relationship between the Ad content and VL-vol. The results show that, with the increase in the Ad content, VL-vol shows a decreasing trend, probably because the presence of ash can decrease the concentration of organic matter and reduce the methane adsorption capacity in coals [41].

3.3.2. NMR-Based Method

As discussed in Section 3.2, Equation (3) may lead to an erroneous adsorbed methane content. In the process of methane adsorption, only injected methane initially consists of a pressure-tight sample cell. Based on conservation of mass, the increase in adsorbed methane must have resulted entirely from the decrement in free methane. Similarly, the amount of adsorbed methane under specific pressures can be indirectly determined as:
V a d s = V t o t V p i p V f r e
where Vads means the adsorbed methane content, cm3; Vpip means the free methane content in the pipeline between two cells, 34.5 cm3; Vtot means the total methane content in the sample cell, which can be determined according to the equation of state of ideal gas, cm3; Vfre means the free methane content in sample cell, cm3.
Similar to the calculation steps of the volumetric-based Langmuir parameter, the NMR-based adsorption experimental data, including adsorption pressure (P) and adsorption volume (V), are fitted by the Langmuir equation using Excel. As shown in Figure 7, the adsorption isotherms determined by the NMR method fitted well with the Langmuir equation.

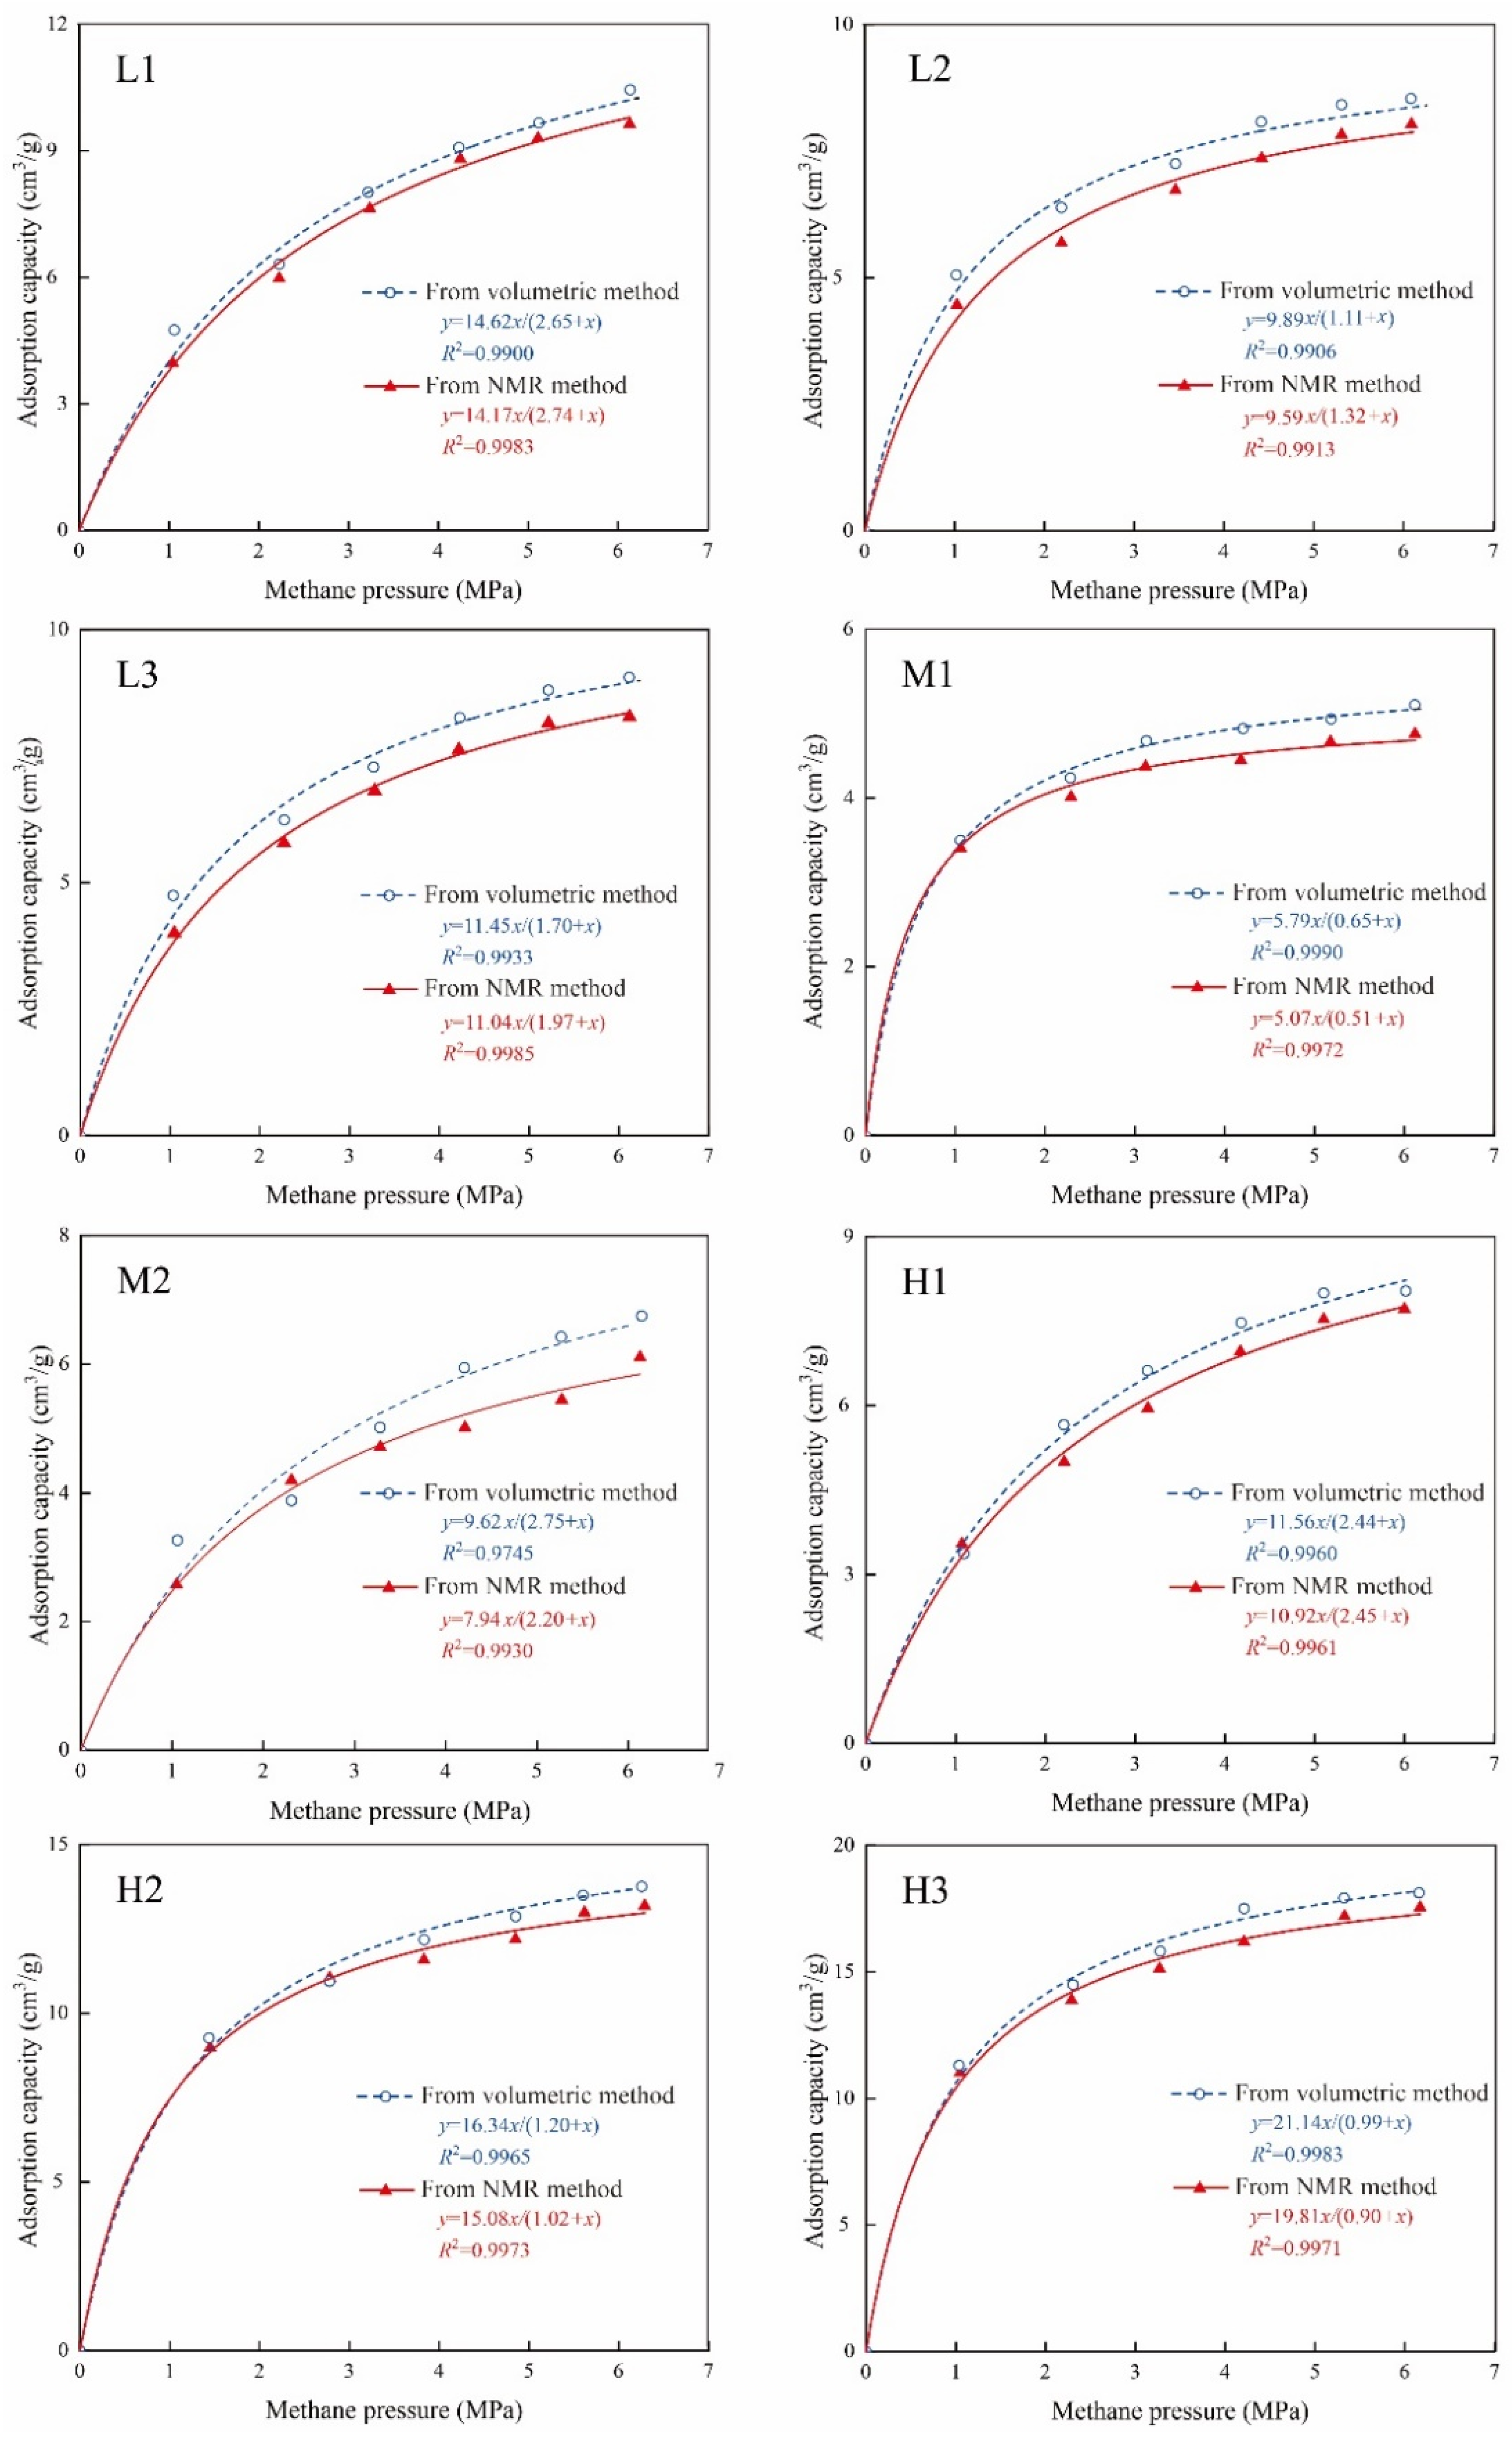
3.3.3. Validity Application of the NMR Method

To verify the NMR method for quantitative evaluation of adsorbed phase methane content in coals, the results from the NMR method were compared with those from the volumetric-based method. Figure 7 shows the adsorption isotherms evaluated by the two different methods (volumetric- and NMR-based methods). The results show that the adsorption isotherms from these two methods have an excellent agreement for the selected coals (except for M2). Additionally, Figure 9 shows the scatter plots of the Langmuir volume obtained from the two methods contrasted in this study. The results show that all data points are approximately distributed on the 45° diagonal line (the dashed line in Figure 9), with the exception of sample M2. It is worth noting that the VL-NMR values are slightly less than VL-vol (Figure 9); this is probably because: (1) the minimum TE value of NMR device in this study is 0.24 ms, thus does not detect the NMR distributions when T2 is smaller than 0.24 ms; and (2) due to the methane adsorption exothermic in coals, the temperature error would have little effect on the experimental results. The relative deviation between the NMR and volumetric methods is ~5.95% (except for sample M2), which is within an allowable error. Additionally, the coal powders used in this study may result in a discrepancy in the experimental data for granulated samples because the grinding of samples would destroy the primary texture of the coal pore systems.
For the sample M2, the adsorption isotherms determined from the NMR method show a large deviation from those of the volumetric-based method (Figure 7), and the Langmuir volume relative deviation is relatively high, at ~17.15%. Previous literature has found that paramagnetic minerals can form larger internal magnetic fields, and thus influence the NMR signal response [42]. SEM-EDS results demonstrate that some paramagnetic minerals were present in sample M2, namely, pyrite (Figure 10a) and ferrocalcite (Figure 10b). This probably results in a larger variation in methane adsorption capacity. The experimental results indicate that NMR T2 measurements can be considered to be an effective method for the characterization of adsorbed methane content, even though some limitations exist due to paramagnetic minerals containing coals. Thus, the results observed in this study identify the directions for future work because the influence of paramagnetic minerals on NMR signals cannot be neglected.

3.4. Methane Adsorption Dynamic Process Characterization

It is known that the Langmuir isotherm curves are only cross-plots of the adsorbed methane content and methane pressure. The shortcoming of this is that it is incapable of depicting any details of the methane adsorption dynamic process. An evident advantage of the NMR measurement designed in this study is that it can dynamically monitor multiphase methane in the methane adsorption process, because the NMR device can automatically measure the multiphase methane T2 characteristics at any time. Here, the sample L2 is taken as a representative sample to discuss the application of the NMR relaxation method to dynamic characterization methane adsorption.
Figure 11a shows the NMR methane adsorption spectra under a methane pressure of 3.46 MPa with an interval time of 45 min. At the methane first injection, the NMR P1 peak shows a clear increasing trend, whereas the NMR P2 peak shows a decreasing trend. By comparison, the NMR P3 peak has changed to an obvious spectral peak. This is probably because of the larger amount of methane injected into the sample cell free space, which results in the clearer T2 relaxation. The amplitude of the P1 peak increases rapidly from 1150.71 to 1652.53 during the first 45 min, and then decreases to an essentially stable level after 180 min (Figure 11b). The NMR P2 peak shows a rapidly decreasing trend during the first 135 min, and then increases slowly to reach an equilibrium condition.
Figure 12 displays the relationship between the adsorbed methane T2 amplitude and injection time under six different pressures for sample L2. The results indicate that the NMR T2 amplitude of the adsorbed methane increased rapidly at about 45 min, and then decreased to an equilibrium condition at approximately 3 h, indicating the adsorption time was approximately ~3 h. Compared with the conventional method (e.g., volumetric- or gravimetric-based methods), the unique features of the NMR-based method not only enable the determination of methane adsorption capacity, but also allow dynamic monitoring of multiphase methane in different experimental situations, such as methane adsorption/desorption and CO2-enhanced CBM.

4. Conclusions

This paper proposed a novel method for the evaluation of the methane adsorption capacity and the quantitative characterization of the methane adsorption dynamic process based on NMR T2 measurements. The main conclusions are:
(1)
The NMR T2 distributions of methane in coals exhibit three peaks, which are P1 (T2 < 8 ms), P2 (T2 = 20–300), and P3 (T2 > 300 ms), corresponding to adsorbed phase methane, free phase methane between pores, and free phase methane in the sample cell, respectively.
(2)
According to the results from the self-designed NMR isotherm adsorption measurements for eight coal samples, the NMR-based Langmuir volume ranges from 5.07 to 19.81 cm3/g. The adsorption isothermal curves evaluated from the NMR and volumetric methods show an excellent agreement, and the Langmuir volume relative deviation, of approximately ~6.0%, was within an allowable limit.
(3)
The NMR technique provides an alternative method for dynamic monitoring of multiphase methane in the methane adsorption process, which is difficult to implement using conventional methods, such as the volumetric- and gravimetric-based methods.

Author Contributions

S.S. and S.L. (Shiqi Liu) provided the funding acquisition; S.Z. performed the experiments and wrote the paper; M.W. and S.L. (Shijian Lu) analyzed the data; G.F. and J.H. revised the paper; Y.Y. and X.J. provided technical support. All authors have read and agreed to the published version of the manuscript.

Funding

This research was funded by the National Natural Science Foundation of China (grant number: 42141012; 42030810; 41972168), and A Project Funded by the Priority Academic Program Development of Jiangsu Higher Education Institutions.

Institutional Review Board Statement

Not applicable.

Informed Consent Statement

Not applicable.

Data Availability Statement

The data presented in this study are available on request from the corresponding author.

Conflicts of Interest

The authors declare no conflict of interest.

References

  1. Fu, X.H.; Qin, Y.; Wang, G.X.; Rudolph, V. Evaluation of coal structure and permeability with the aid of geophysical logging technology. Fuel 2009, 88, 2278–2285. [Google Scholar] [CrossRef]
  2. Karacan, C.Ö.; Ruiz, F.A.; Cotè, M.; Phipps, S. Coal mine methane: A review of capture and utilization practices with benefits to mining safety and to greenhouse gas reduction. Int. J. Coal Geol. 2011, 86, 121–156. [Google Scholar] [CrossRef]
  3. Moore, T.A. Coalbed methane: A review. Int. J. Coal Geol. 2012, 101, 36–81. [Google Scholar] [CrossRef]
  4. Cai, Y.D.; Liu, D.M.; Mathews, J.P.; Pan, Z.J.; Elsworth, D.; Yao, Y.B.; Li, J.Q.; Guo, X.Q. Permeability evolution in fractured coal—Combining triaxial confinement with X-ray computed tomography, acoustic emission and ultrasonic techniques. Int. J. Coal Geol. 2014, 122, 91–104. [Google Scholar] [CrossRef]
  5. Li, Y.; Zhang, C.; Tang, D.Z.; Gan, Q.; Niu, X.L.; Wang, K.; Shen, R.Y. Coal pore size distributions controlled by the coalification process: An experimental study of coals from the Junggar, Ordos and Qinshui basins in China. Fuel 2017, 206, 352–363. [Google Scholar] [CrossRef]
  6. Li, Y.; Tang, D.Z.; Wu, P.; Niu, X.L.; Wang, K.; Qian, P.; Wang, Z.S. Continuous unconventional natural gas accumulations of Carboniferous-Permian coal-bearing strata in the Linxing area, northeastern Ordos basin, China. J. Nat. Gas Sci. Eng. 2016, 36, 317–324. [Google Scholar] [CrossRef]
  7. Cai, Y.D.; Liu, D.M.; Yao, Y.B.; Li, J.Q.; Qiu, Y.K. Geological controls on prediction of coalbed methane of No. 3 coal seam in Southern Qinshui Basin, North China. Int. J. Coal Geol. 2011, 88, 101–112. [Google Scholar] [CrossRef]
  8. Zheng, S.J.; Yao, Y.B.; Liu, D.M.; Cai, Y.D.; Liu, Y.; Li, X.W. Nuclear magnetic resonance T2 cutos of coals: A novel method by multifractal analysis. Fuel 2019, 241, 715–724. [Google Scholar] [CrossRef]
  9. Li, J.Q.; Lu, S.F.; Xie, L.J.; Zhang, J.; Xue, H.T.; Zhang, P.F.; Tian, S.S. Modeling of hydrocarbon adsorption on continental oil shale: A case study on n-alkane. Fuel 2021, 206, 603–613. [Google Scholar] [CrossRef]
  10. Li, J.Q.; Wang, S.Y.; Lu, S.F.; Zhang, P.F.; Cai, J.C.; Zhao, J.H.; Li, W.B. Microdistribution and mobility of water in gas shale: A theoretical and experimental study. Mar. Petrol. Geol. 2019, 102, 496–507. [Google Scholar] [CrossRef]
  11. Hou, H.H.; Shao, L.Y.; Li, Y.H.; Li, Z.; Wang, S.; Zhang, W.L.; Wang, X.T. Influence of coal petrology on methane adsorption capacity of the Middle Jurassic coal in the Yuqia Coalfield, northern Qaidam Basin, China. J. Pet. Sci. Eng. 2017, 149, 218–227. [Google Scholar] [CrossRef]
  12. Li, J.Q.; Lu, S.F.; Zhang, P.F.; Cai, J.C.; Li, W.B.; Wang, S.Y.; Feng, W.J. Estimation of gas-in-place content in coal and shale reservoirs: A process analysis method and its preliminary application. Fuel 2020, 259, 116266. [Google Scholar] [CrossRef]
  13. Song, W.H.; Jun, Y.; Wang, D.Y.; Li, Y.; Sun, H.; Yang, Y.F. Dynamic pore network modelling of real gas transport in shale nanopore structure. J. Pet. Sci. Eng. 2020, 184, 105506. [Google Scholar] [CrossRef]
  14. Pajdak, A.; Kudasik, M.; Skoczylas, N.; Wierzbicki, M.; Teixeira Palla Braga, L. Studies on the competitive sorption of CO2 and CH4 on hard coal. Int. J. Greenh. Gas Con. 2019, 90, 102798. [Google Scholar] [CrossRef]
  15. Kudasik, M.; Skoczylas, N.; Pajdak, A. The repeatability of sorption processes occurring in the coal-methane system during multiple measurement series. Energies 2017, 10, 661. [Google Scholar] [CrossRef] [Green Version]
  16. Genserblum, Y.; van Hemert, P.; Billemont, P.; Bush, A.; Charriére, D.; Li, D.; Krooss, B.M.; de Weireld, G.; Prinz, D.; Wolf, H.A.A. European inter-laboratory comparison of high-pressure CO2 sorption isotherms. I: Activated carbon. Carbon 2009, 47, 2958–2969. [Google Scholar]
  17. Ye, Z.H.; Chen, D.; Pan, Z.J.; Zhang, G.Q.; Xia, Y.; Ding, X. An improved Langmuir model for evaluating methane adsorption capacity in shale under various pressures and temperatures. J. Nat. Gas Sci. Eng. 2016, 31, 658–680. [Google Scholar] [CrossRef]
  18. Krooss, B.M.; van Bergen, F.; Gensterblum, Y.; Siemons, N.; Pagnier, H.J.M.; David, P. High-pressure methane and carbon dioxide adsorption on dry and moisture-equilibrated Pennsylvanian coals. Int. J. Coal Geol. 2002, 51, 69–92. [Google Scholar] [CrossRef]
  19. Coates, G.R.; Xiao, L.Z.; Primmer, M.G. NMR Logging Principles and Applications; Gulf Publishing Company: Houston, TX, USA, 1999. [Google Scholar]
  20. Akkurt, R.; Vinegar, H.J.; Tutunjian, P.N.; Guillory, A.J. NMR logging of natural gas reservoirs. Log. Anal. 1996, 37, 33–42. [Google Scholar]
  21. Howard, J.J. Quantitative estimates of porous media wettability from proton NMR. Magn. Reson. Imaging 1998, 16, 529–533. [Google Scholar] [CrossRef]
  22. Zheng, S.J.; Yao, Y.B.; Liu, D.M.; Cai, Y.D.; Liu, Y. Characterizations of full-scale pore size distribution, porosity and permeability of coals: A novel methodology by nuclear magnetic resonance and fractal analysis theory. Int. J. Coal Geol. 2018, 196, 148–158. [Google Scholar] [CrossRef]
  23. Zheng, S.J.; Yao, Y.B.; Liu, D.M.; Cai, Y.D.; Liu, Y. Nuclear magnetic resonance surface relaxivity of coals. Int. J. Coal Geol. 2019, 205, 1–13. [Google Scholar] [CrossRef]
  24. Hari, P.; Chang, C.T.P.; Kulkarni, R.; Lien, J.R.; Watson, A.T. NMR characterization of hydrocarbon gas in porous media. Magn. Reson. Imaging 1998, 16, 545–547. [Google Scholar] [CrossRef]
  25. Safiullin, K.; Kuzmin, V.; Bogaychuk, A.; Alakshin, E.; González, L.M.; Kondratyeva, E.; Dolgorukov, G.; Gafurov, M.; Klochkov, A.; Tagirov, M. Determination of pores properties in rocks by means of helium-3 NMR: A case study of oil-bearing arkosic conglomerate from North belt of crude oil, Republic of Cuba. J. Petrol. Sci. Eng. 2022, 210, 110010. [Google Scholar] [CrossRef]
  26. Guo, R.; Mannhardt, D.; Kantzas, A. Characterizing moisture and gas content of coal by low-field NMR. J. Can. Pet. Technol. 2007, 46, 49–54. [Google Scholar] [CrossRef]
  27. Vasilenko, T.A.; Kirillov, A.K.; Molchanov, A.N.; Pronskii, E.A. An NMR study of the ratio between free and sorbed methane in the pores of fossil coals. Solid Fuel Chem. 2018, 52, 361–369. [Google Scholar] [CrossRef]
  28. Liu, J.; Yao, Y.B.; Liu, D.M.; Elsworth, D. Experimental evaluation of CO2 enhanced recovery of adsorbed-gas from shale. Int. J. Coal Geol. 2017, 179, 211–218. [Google Scholar] [CrossRef]
  29. Yao, Y.B.; Liu, J.; Liu, D.M.; Chen, J.Y.; Pan, Z.J. A new application of NMR in characterization of multiphase methane and adsorption capacity of shale. Int. J. Coal Geol. 2019, 131, 76–85. [Google Scholar] [CrossRef]
  30. Yao, Y.B.; Liu, D.M.; Xie, S.B. Quantitative characterization of methane adsorption on coal using a low-field NMR relaxation method. Int. J. Coal Geol. 2014, 201, 32–40. [Google Scholar] [CrossRef]
  31. Li, Y.; Wang, Y.B.; Wang, J.; Pan, Z.J. Variation in permeability during CO2–CH4 displacement in coal seams: Part 1—Experimental insights. Fuel 2020, 263, 116666. [Google Scholar] [CrossRef]
  32. Yao, Y.B.; Liu, D.M.; Che, Y.; Tang, D.Z.; Tang, S.H.; Huang, W.H. Petrophysical characterization of coals by low-field nuclear magnetic resonance (NMR). Fuel 2010, 89, 1371–1380. [Google Scholar] [CrossRef]
  33. Yuan, Y.J.; Rezaee, R.; Verrall, M.; Hu, S.Y.; Zou, J.; Testmanti, N. Pore characterization and clay bound water assessment in shale with a combination of NMR and low-pressure nitrogen gas adsorption. Int. J. Coal Geol. 2018, 194, 11–21. [Google Scholar] [CrossRef]
  34. Zhao, Y.X.; Zhu, G.P.; Dong, Y.H.; Danesh, N.N.; Chen, Z.W.; Zhang, T. Comparison of low-field NMR and microfocus X-ray computed tomography in fractal characterization of pores in artificial cores. Fuel 2017, 210, 217–226. [Google Scholar] [CrossRef]
  35. Sun, X.X.; Yao, Y.B.; Liu, D.M.; Zhou, Y. Investigations of CO2-water wettability of coal: NMR relaxation method. Int. J. Coal Geol. 2018, 188, 38–50. [Google Scholar] [CrossRef] [Green Version]
  36. Zheng, S.J.; Yao, Y.B.; Liu, D.M.; Cai, Y.D.; Liu, Y. Quantitative characterization of multiphase methane in coals using the NMR relaxation method. J. Petrol. Sci. Eng. 2021, 198, 108148. [Google Scholar] [CrossRef]
  37. Perera, M.S.A.; Ranjith, P.G.; Choi, S.K.; Airey, D.; Weniger, P. Estimation of gas adsorption capacity in coal: A review and an analytical study. Int. J. Coal Prep. Util. 2012, 32, 25–55. [Google Scholar] [CrossRef]
  38. Siemons, N.; Wolf, K.A.A.; Bruining, J. Interpretation of carbon dioxide diffusion behavior in coals. Int. J. Coal Geol. 2007, 72, 315–324. [Google Scholar] [CrossRef]
  39. Weniger, P.; Franců, J.; Hemza, P.; Krooss, B.M. Investigations on the methane and carbon dioxide sorption capacity of coals from the SW upper Silesian Coal Basin Czech Republic. Int. J. Coal Geol. 2012, 93, 23–39. [Google Scholar] [CrossRef]
  40. Zhang, M.; Fu, X.H. Characterization of pore structure and its impact on methane adsorption capacity for semi-anthracite in Shizhuangnan Block, Qinshui Basin. J. Nat. Gas Sci. Eng. 2018, 60, 49–62. [Google Scholar] [CrossRef]
  41. Laxminarayana, C.; Crosdale, P.J. Role of coal type and rank on methane sorption of Bowen Basin, Australia coals. Int. J. Coal Geol. 1999, 40, 309–325. [Google Scholar] [CrossRef]
  42. Sadian, M.; Prasad, M. Effect of mineralogy on nuclear magnetic resonance surface relaxivity: A case study of Middle Bakken and Three Forks formations. Fuel 2015, 161, 197–206. [Google Scholar] [CrossRef]
Figure 1. Pore morphology characteristics of the selected coals by SEM measurement.
Energies 15 01532 g001
Figure 2. Schematic diagram of the NMR methane adsorption experimental set-up.
Energies 15 01532 g002
Figure 3. NMR T2 distributions of free methane.
Energies 15 01532 g003
Figure 4. Correlations between T2 amplitude vs. methane mass.
Energies 15 01532 g004
Figure 5. NMR T2 spectra of methane adsorption in coals.
Energies 15 01532 g005
Figure 6. NMR P1 (a) and P2 + P3 (b) amplitude changes during the process of methane adsorption.
Energies 15 01532 g006
Figure 7. Adsorption isotherms obtained from two different methods.
Energies 15 01532 g007
Figure 8. The cross-plots of Ro,m, vitrinite + inertinite content, FCd content, and Ad content versus Langmuir volume VL-vol. (a) Ro,m versus Langmuir volume VL-vol, (b) vitrinite + inertinite content versus Langmuir volume VL-vol, (c) FCd content versus Langmuir volume VL-vol, (d) Ad content versus Langmuir volume VL-vol.
Energies 15 01532 g008
Figure 9. Scatter plots of Langmuir volume obtained from two contrasting methods.
Energies 15 01532 g009
Figure 10. SEM-EDS results in sample M2. (a) pyrite minerals occured in sample M2, (b) ferrocalcite minerals occured in sample M2.
Energies 15 01532 g010
Figure 11. NMR T2 spectra of methane adsorbed (a) and peak amplitude change characteristics (b) under a pressure of 3.46 MPa with an interval time of 45 min for sample L2.
Energies 15 01532 g011
Figure 12. Relationship between adsorbed methane T2 amplitude and injection time under six different pressures, for sample L2.
Energies 15 01532 g012
Table 1. Detailed information of the selected coals.
Sample No.Ro,m (%)Maceral Composition (%)Proximate Analysis (%)
VIEMMadAdFCd
L10.5264.330.74.70.37.6721.3444.95
L20.6064.816.116.42.75.8211.1545.83
L30.7050.237.24.77.92.5515.4956.42
M11.5250.920.319.19.75.4333.5433.77
M21.6858.622.114.35.06.3029.1936.51
H12.3680.310.71.08.00.8817.887.21
H22.5483.415.900.70.7412.0675.05
H33.0386.210.103.71.461.6295.94
Notes: Ro,m—maximum vitrinite reflectance, V—vitrinite; I—inertinite; E—exinite; M—minerals. Mad—moisture (air-dried basis); Ad—ash (dry basis); FCd—carbon (air-dried basis).
Table 2. Comparison of the Langmuir parameters determined by volumetric-based and NMR-based methods.
Sample No.Volumetric Isotherm Adsorption MethodNMR Isotherm Adsorption MethodPowder Mass
(g)
VL-vol
(cm3/g)
PL-vol
(MPa)
Adjusted R-SquareVL-NMR
(cm3/g)
PL-NMR
(MPa)
Adjusted R-Square
L114.622.650.990014.172.740.998314.6
L29.891.110.99069.591.320.991316.5
L311.451.700.993311.041.970.998517.3
M15.790.650.99905.070.510.997212.9
M29.622.750.97457.972.200.993018.9
H111.562.440.996010.922.450.996117.4
H216.341.200.996515.081.020.997313.7
H321.140.990.998319.810.900.997114.5
Note: The index variables ‘vol’ and ‘NMR’ represent the results from the volumetric isotherm adsorption method and NMR isotherm adsorption method, respectively.
Publisher’s Note: MDPI stays neutral with regard to jurisdictional claims in published maps and institutional affiliations.

