
Holistic View on Synthetic Natural Gas Production: A Technical, Economic and Environmental Analysis

 , , ,
, , ,
Abstract
:1. Introduction
2. Methodology
2.1. Technical Assessment
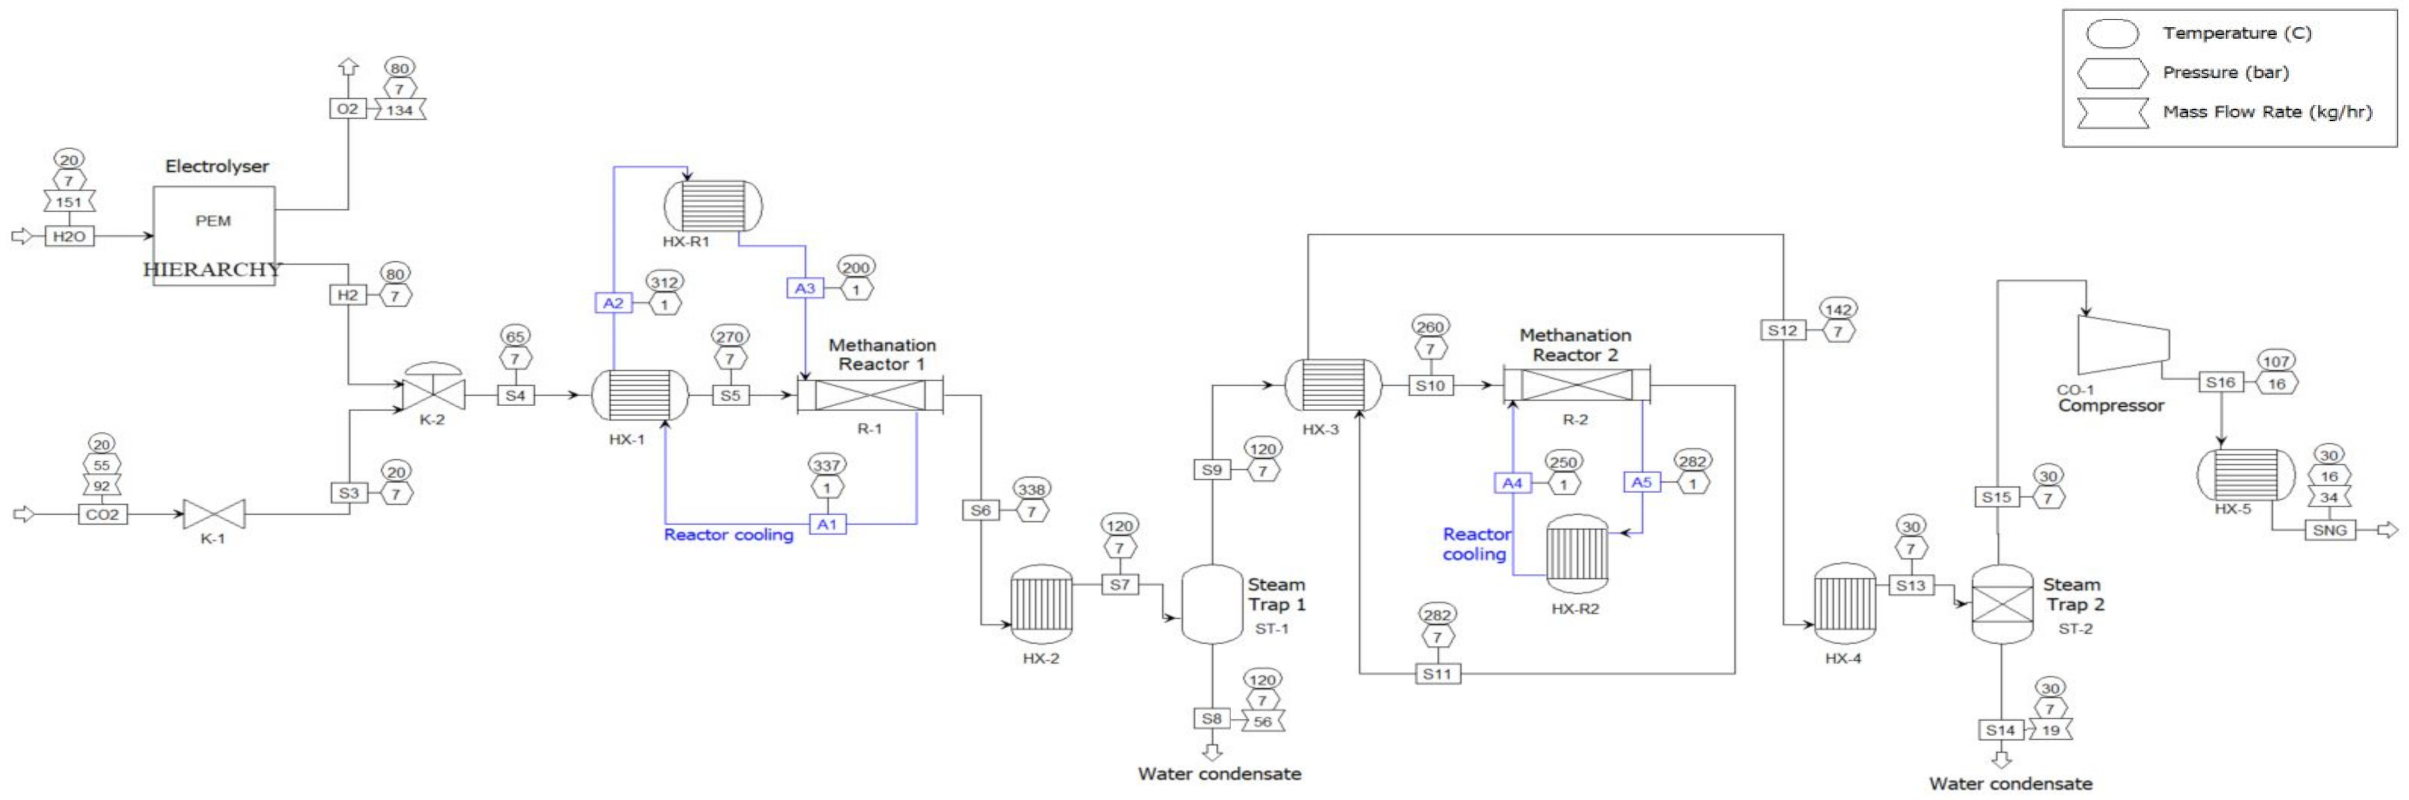
2.1.1. Process Description
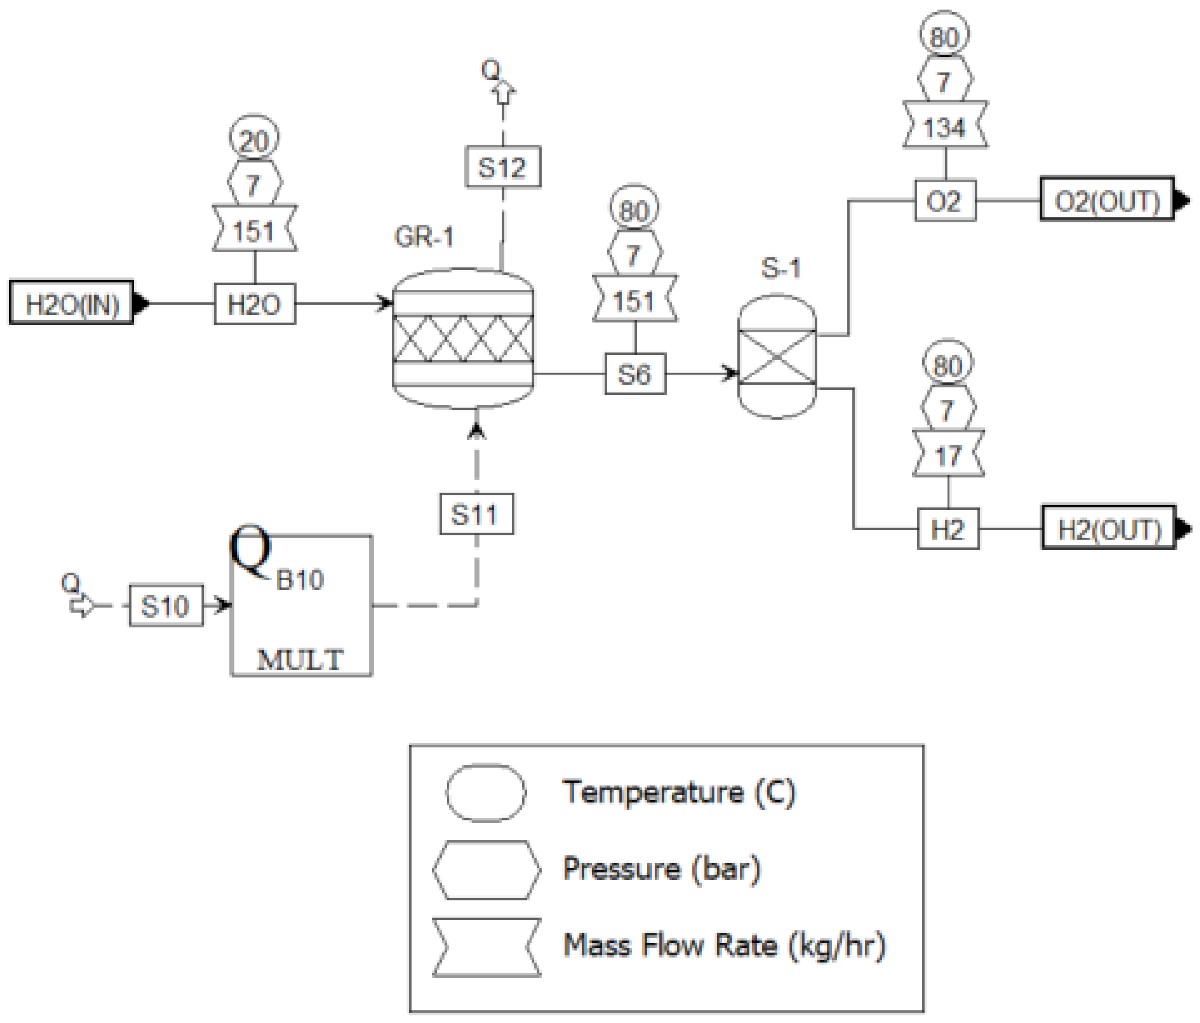
2.1.2. Simulation Model
Electrolysis Unit
Methanation Unit
Reactor Modeling
Gas Upgrading Unit
Thermal Integration
2.1.3. Definition of Performance Parameters
2.2. Economic Assessment
- Estimation of total capital and operational expenditures (CAPEX and OPEX);
- Determination of total annualized cost (TAC);
- Calculation of net production cost (NPC).
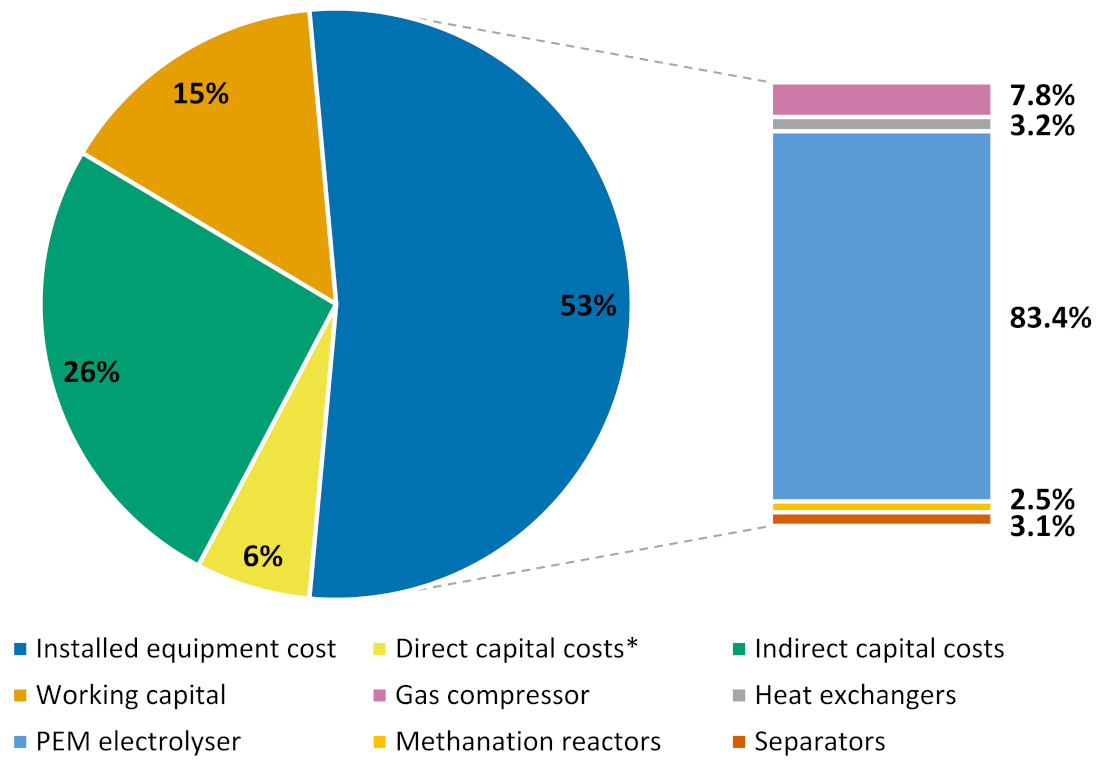
2.2.1. Calculation of CAPEX
2.2.2. Calculation of OPEX
2.2.3. Total Annualized Cost
2.2.4. Net Production Cost
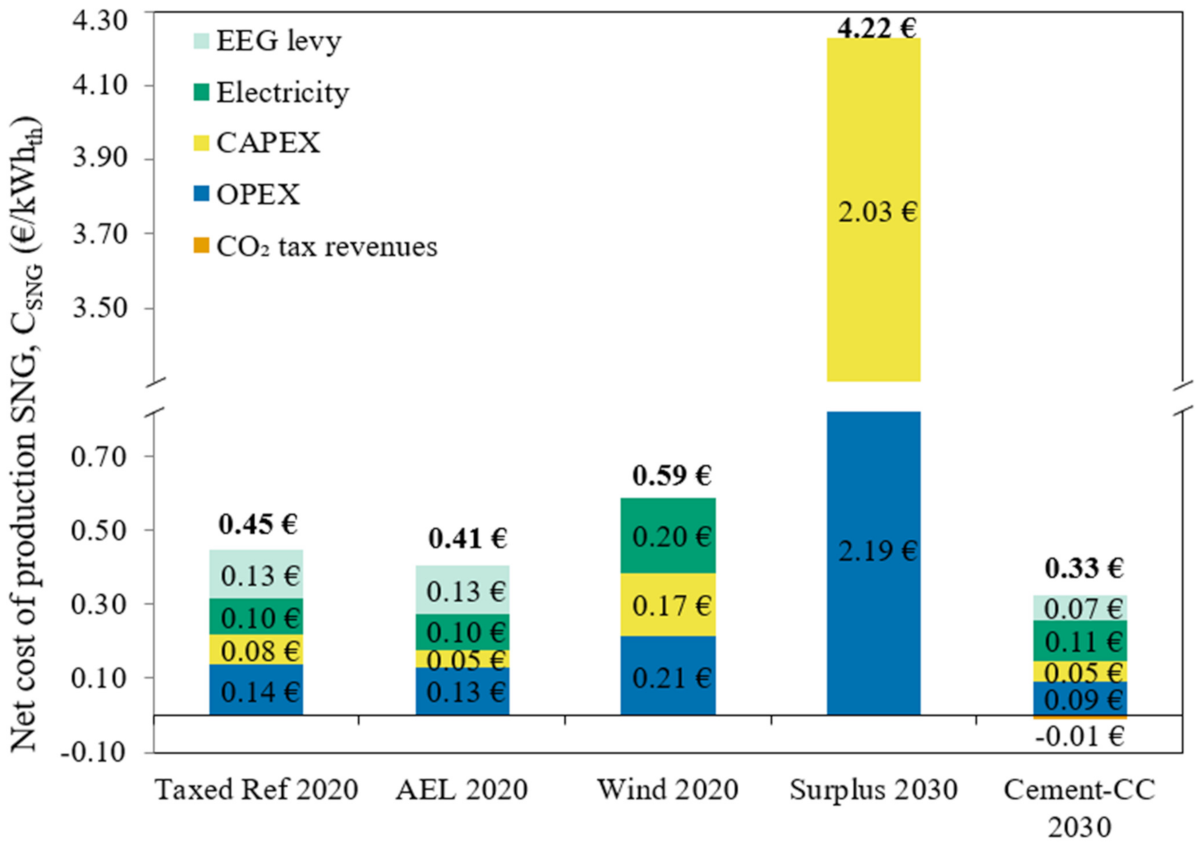
2.2.5. Scenario Definition
- Taxed Ref 2020: Previously described Reference case but considering EEG taxation;
- AEL 2020: Analogous to the Reference case but operation with an alkaline electrolyzer;
- Wind 2020: The pilot plant only utilizes offshore wind energy for hydrogen production in 2020, assuming a direct coupling between the offshore wind turbine and the PtSNG plant. Standby consumption from electrolyzer is assumed to be 1%;
- Surplus 2030: The PtSNG plant only operates with surplus electricity coming from renewable generation in Germany in 2030. Electricity costs during surplus hours equal zero, as the plant consumes electricity that would otherwise be curtailed. At all other times the electrolyzer is shut down and standby operating mode is not considered;
- Cement-CC 2030: The PtSNG plant operates with electricity from the grid in 2030 and benefits from carbon trading. A cement company is assumed to pay the pilot plant to consume its CO2.
2.3. Environmental Assessment
3. Results and Discussion
3.1. Technical
3.2. Economic
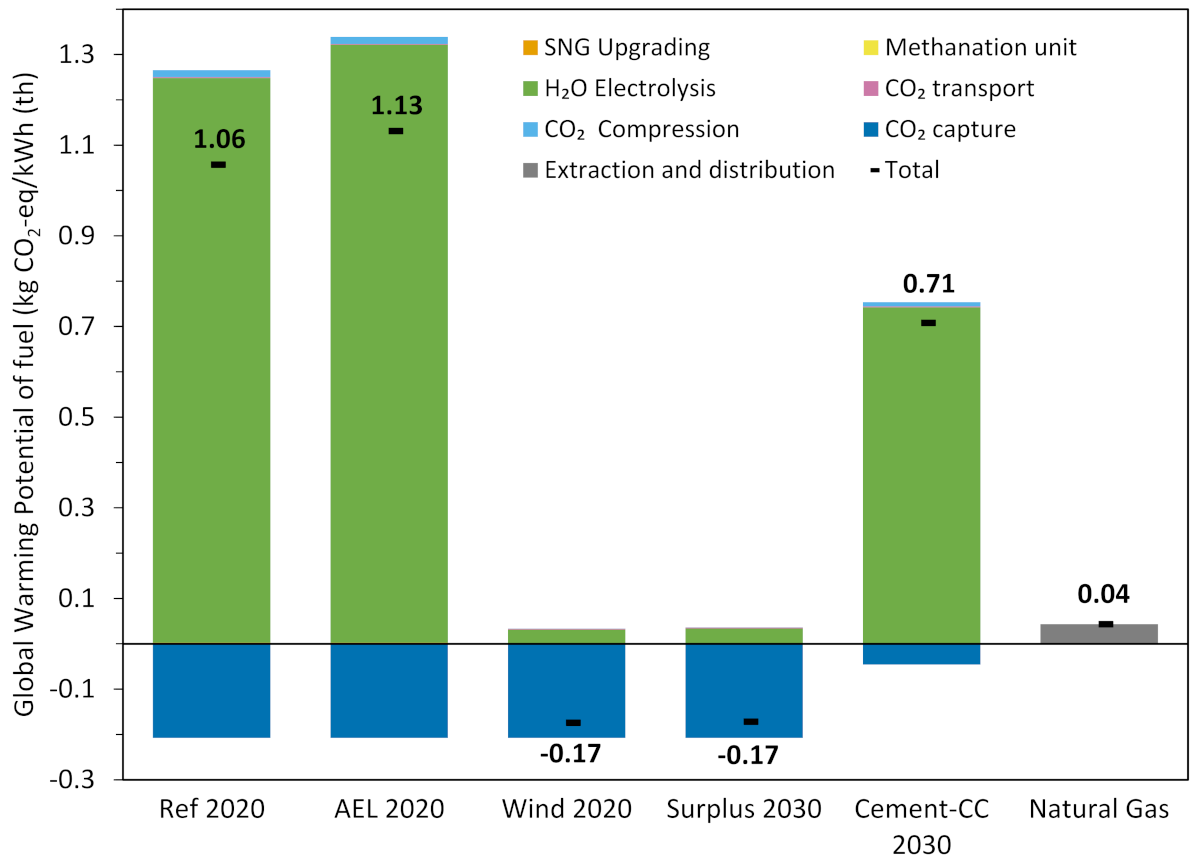
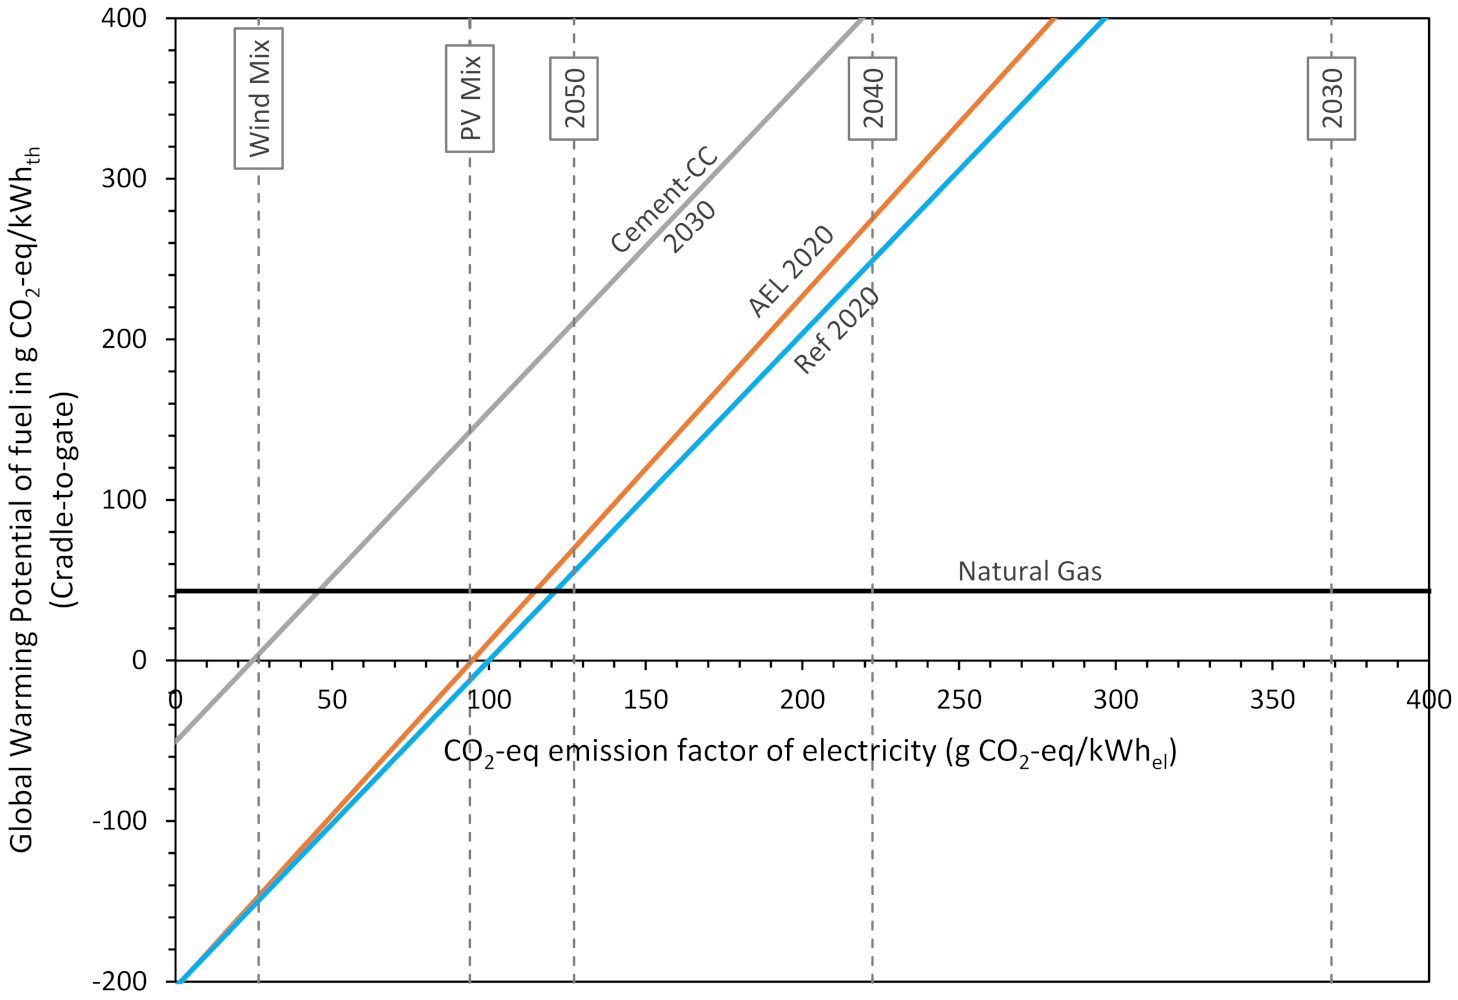
3.3. Environmental
3.4. Sensitivity Analysis
4. Conclusions
Supplementary Materials
Author Contributions
Funding
Institutional Review Board Statement
Informed Consent Statement
Data Availability Statement
Conflicts of Interest
References
- Federal German Government. Climate Change Act 2021. 2021. Available online: https://www.legislation.gov.uk/ (accessed on 1 January 2022).
- Schemme, S.; Breuer, J.L.; Köller, M.; Meschede, S.; Walman, F.; Samsun, R.C.; Peters, R.; Stolten, D. H2-based synthetic fuels: A techno-economic comparison of alcohol, ether and hydrocarbon production. Int. J. Hydrogen Energy 2020, 45, 5395–5414. [Google Scholar] [CrossRef]
- Götz, M.; Lefebvre, J.; Mörs, F.; McDaniel Koch, A.; Graf, F.; Bajohr, S.; Reimert, R.; Kolb, T. Renewable Power-to-Gas: A technological and economic review. Renew. Energy 2016, 85, 1371–1390. [Google Scholar] [CrossRef] [Green Version]
- DVGW. Wo aus Wind und Sonne Grünes Gas Wird... Eine Übersicht der Power-to-Gas-Projekte in Deutschland. 2019. Available online: https://www.dvgw.de/medien/dvgw/verein/energiewende/bilder/karte-power-to-gas-anlagen.pdf (accessed on 1 January 2022).
- Wulf, C.; Linßen, J.; Zapp, P. Review of Power-to-Gas Projects in Europe. Energy Procedia 2018, 155, 367–378. [Google Scholar] [CrossRef]
- DENA. Strategieplattform Power to Gas: Projektkarte. 2020. Available online: https://www.powertogas.info/projektkarte/ (accessed on 1 January 2022).
- Bailera, M.; Lisbona, P.; Romeo, L.M.; Espatolero, S. Power to Gas projects review: Lab, pilot and demo plants for storing renewable energy and CO2. Renew. Sustain. Energy Rev. 2017, 69, 292–312. [Google Scholar] [CrossRef]
- Benjaminsson, G.; Benjaminsson, J.; Rudberg, R. Power-to-Gas—A technical review. Malmö Sven. Gastek. Cent. AB 2013, 284, 13–64. [Google Scholar]
- De Saint Jean, M.; Baurens, P.; Bouallou, C. Parametric study of an efficient renewable power-to-substitute-natural-gas process including high-temperature steam electrolysis. Int. J. Hydrogen Energy 2014, 39, 17024–17039. [Google Scholar] [CrossRef]
- De Saint Jean, M.; Baurens, P.; Bouallou, C.; Couturier, K. Economic assessment of a power-to-substitute-natural-gas process including high-temperature steam electrolysis. Int. J. Hydrogen Energy 2015, 40, 6487–6500. [Google Scholar] [CrossRef]
- König, D.H.; Freiberg, M.; Dietrich, R.-U.; Wörner, A. Techno-economic study of the storage of fluctuating renewable energy in liquid hydrocarbons. Fuel 2015, 159, 289–297. [Google Scholar] [CrossRef] [Green Version]
- Albrecht, F.G.; König, D.H.; Baucks, N.; Dietrich, R.-U. A standardized methodology for the techno-economic evaluation of alternative fuels—A case study. Fuel 2017, 194, 511–526. [Google Scholar] [CrossRef] [Green Version]
- Michailos, S.; McCord, S.; Sick, V.; Stokes, G.; Styring, P. Dimethyl ether synthesis via captured CO2 hydrogenation within the power to liquids concept: A techno-economic assessment. Energy Convers. Manag. 2019, 184, 262–276. [Google Scholar] [CrossRef]
- Tremel, A.; Wasserscheid, P.; Baldauf, M.; Hammer, T. Techno-economic analysis for the synthesis of liquid and gaseous fuels based on hydrogen production via electrolysis. Int. J. Hydrogen Energy 2015, 40, 11457–11464. [Google Scholar] [CrossRef]
- Schiebahn, S.; Grube, T.; Robinius, M.; Tietze, V.; Kumar, B.; Stolten, D. Power to gas: Technological overview, systems analysis and economic assessment for a case study in Germany. Int. J. Hydrogen Energy 2015, 40, 4285–4294. [Google Scholar] [CrossRef]
- Buchholz, O.S.; van der Ham, A.G.J.; Veneman, R.; Brilman, D.W.F.; Kersten, S.R.A. Power-to-Gas: Storing Surplus Electrical Energy. A Design Study. Energy Procedia 2014, 63, 7993–8009. [Google Scholar] [CrossRef] [Green Version]
- Giglio, E.; Deorsola, F.A.; Gruber, M.; Harth, S.R.; Morosanu, E.A.; Trimis, D.; Bensaid, S.; Pirone, R. Power-to-Gas through High Temperature Electrolysis and Carbon Dioxide Methanation: Reactor Design and Process Modeling. Ind. Eng. Chem. Res. 2018, 57, 4007–4018. [Google Scholar] [CrossRef]
- Parra, D.; Patel, M.K. Techno-economic implications of the electrolyser technology and size for power-to-gas systems. Int. J. Hydrogen Energy 2016, 41, 3748–3761. [Google Scholar] [CrossRef]
- Reiter, G.; Lindorfer, J. Global warming potential of hydrogen and methane production from renewable electricity via power-to-gas technology. Int. J. Life Cycle Assess. 2015, 20, 477–489. [Google Scholar] [CrossRef]
- Sternberg, A.; Bardow, A. Life Cycle Assessment of Power-to-Gas: Syngas vs Methane. ACS Sustain. Chem. Eng. 2016, 4, 4156–4165. [Google Scholar] [CrossRef]
- Hoppe, W.; Bringezu, S.; Thonemann, N. Comparison of global warming potential between conventionally produced and CO2-based natural gas used in transport versus chemical production. J. Clean. Prod. 2016, 121, 231–237. [Google Scholar] [CrossRef]
- Collet, P.; Flottes, E.; Favre, A.; Raynal, L.; Pierre, H.; Capela, S.; Peregrina, C. Techno-economic and Life Cycle Assessment of methane production via biogas upgrading and power to gas technology. Appl. Energy 2017, 192, 282–295. [Google Scholar] [CrossRef] [Green Version]
- Parra, D.; Zhang, X.; Bauer, C.; Patel, M.K. An integrated techno-economic and life cycle environmental assessment of power-to-gas systems. Appl. Energy 2017, 193, 440–454. [Google Scholar] [CrossRef]
- Aspen Technology Inc. Aspen Plus. USA. 2021. Available online: https://www.aspentech.com/en/products/engineering/aspen-plus (accessed on 1 January 2022).
- DVGW. Technische Regel—Arbeitsblatt DVGW G 260 (A); DVGW: Bonn, Germany, 2013. [Google Scholar]
- Peters, R.; Baltruweit, M.; Grube, T.; Samsun, R.C.; Stolten, D. A techno economic analysis of the power to gas route. J. CO2 Util. 2019, 34, 616–634. [Google Scholar] [CrossRef]
- König, D.H.; Baucks, N.; Dietrich, R.-U.; Wörner, A. Simulation and evaluation of a process concept for the generation of synthetic fuel from CO2 and H2. Energy 2015, 91, 833–841. [Google Scholar] [CrossRef] [Green Version]
- NOW GmbH. Studie IndWEDe—Kurzfassung Industrialisierung der Wasserelektrolyse in Deutschland: Chancen und Herausforderungen für Nachhaltigen Wasserstoff für Verkehr, Strom und Wärme; NOW GmbH: Berlin, Germany, 2018. [Google Scholar]
- Solar Fuel GmbH. Hocheffizientes Verfahren zur katalytischen Methanisierung von Kohlendioxid und Wasserstoffenthaltenden Gasgemischen; Markenamt, D., Ed.; Hitachi Zosen Inova Etogas GmbH: Stuttgart, Germany, 2011. [Google Scholar]
- Rönsch, S.; Schneider, J.; Matthischke, S.; Schlüter, M.; Götz, M.; Lefebvre, J.; Prabhakaran, P.; Bajohr, S. Review on methanation—From fundamentals to current projects. Fuel 2016, 166, 276–296. [Google Scholar] [CrossRef]
- Porubova, J.; Bazbauers, G.; Markova, D. Modeling of the Adiabatic and Isothermal Methanation Process. Environ. Clim. Technol. 2011, 6, 79–84. [Google Scholar] [CrossRef] [Green Version]
- Schlereth, D.; Hinrichsen, O. A fixed-bed reactor modeling study on the methanation of CO2. Chem. Eng. Res. Des. 2014, 92, 702–712. [Google Scholar] [CrossRef]
- Kuznik, F. Energy Storage by Adsorption Technology for Building. In Handbook of Energy Systems in Green Buildings; Wang, R., Zhai, X., Eds.; Springer: Berlin/Heidelberg, Germany, 2018; pp. 1–27. [Google Scholar] [CrossRef]
- Falbo, L.; Martinelli, M.; Visconti, C.G.; Lietti, L.; Bassano, C.; Deiana, P. Kinetics of CO2 methanation on a Ru-based catalyst at process conditions relevant for Power-to-Gas applications. Appl. Catal. B Environ. 2018, 225, 354–363. [Google Scholar] [CrossRef]
- Lunde, P.J.; Kester, F.L. Carbon Dioxide Methanation on a Ruthenium Catalyst. Ind. Eng. Chem. Process Des. Dev. 1974, 13, 27–33. [Google Scholar] [CrossRef]
- Bassano, C.; Deiana, P.; Lietti, L.; Visconti, C.G. P2G movable modular plant operation on synthetic methane production from CO2 and hydrogen from renewables sources. Fuel 2019, 253, 1071–1079. [Google Scholar] [CrossRef]
- Ulrich, G.D.; Vasudevan, P.T. Chemical Engineering Process Design and Economics: A Practical Guide, 2nd ed.; Taylor & Francis Group: Abingdon-on-Thames, UK, 2004. [Google Scholar]
- Linnhoff, B.; Hindmarsh, E. The pinch design method for heat exchanger networks. Chem. Eng. Sci. 1983, 38, 745–763. [Google Scholar] [CrossRef]
- Brynolf, S.; Taljegard, M.; Grahn, M.; Hansson, J. Electrofuels for the transport sector: A review of production costs. Renew. Sustain. Energy Rev. 2018, 81, 1887–1905. [Google Scholar] [CrossRef]
- Billig, E.; Decker, M.; Benzinger, W.; Ketelsen, F.; Pfeifer, P.; Peters, R.; Stolten, D.; Thrän, D. Non-fossil CO2 recycling—The technical potential for the present and future utilization for fuels in Germany. J. CO2 Util. 2019, 30, 130–141. [Google Scholar] [CrossRef]
- Becker, W.L.; Penev, M.; Braun, R.J. Production of Synthetic Natural Gas From Carbon Dioxide and Renewably Generated Hydrogen: A Techno-Economic Analysis of a Power-to-Gas Strategy. J. Energy Resour. Technol. 2018, 141. [Google Scholar] [CrossRef]
- Towler, G.; Sinnott, R. Chemical engineering Design: Principles, Practice, and Economics of Plant and Process Design, 2nd ed.; Butterworth-Heinemann: Boston, MA, USA, 2013. [Google Scholar] [CrossRef]
- Association of the Advancement of Cost Engineering. Cost Estimate Classification System—As Applied in Engineering, Procurement, and Construction for the Process Industries; AACE International: Morgantown, WV, USA, 2011. [Google Scholar]
- Peters, M.S.; Timmerhaus, K.D.; West, R.E. Plant Design and Economics for Chemical Engineers, 5th ed.; McGraw-Hill Education: New York, NY, USA, 2003. [Google Scholar]
- Jenkins, S. Chemical Engineering Plant Cost Index: 2018 Annual Value. Access Intelligence LLC. 2019. Available online: https://www.chemengonline.com/2019-cepci-updates-january-prelim-and-december-2018-final/ (accessed on 1 January 2022).
- European Central Bank. ECB Euro Reference Exchange Rate: US Dollar (USD); European Central Bank: Frankfurt, Germany, 2020. [Google Scholar]
- Pichlmaier, S.; Regett, A.; Kigle, S.; Haas, S.; Feinauer, M.; Oswald, M. Ökobilanzen Synthetischer Kraftstoffe Methodikleitfaden; Begleitsforschung Energiewende im Verkehr: München, Germany, 2020. [Google Scholar]
- Viebahn, P.; Horst, J.; Scholz, A.; Zelt, O. Technologiebericht 4.4 Verfahren der CO2-Abtrennung aus Faulgasen und Umgebungsluft; Wuppertal Institut I, IZES (Hrsg.), Technologien für die Energiewende Teilbericht 2 an das Bundesministerium für Wirtschaft und Energie (BMWi): Wuppertal/Karlsruhe/Saarbrücken, Germany, 2018. [Google Scholar]
- Fu, Q.; Mabilat, C.; Zahid, M.; Brisse, A.; Gautier, L. Syngas production via high-temperature steam/CO2 co-electrolysis: An economic assessment. Energy Environ. Sci. 2010, 3, 1382–1397. [Google Scholar] [CrossRef]
- Panos, K. Praxisbuch Energiewirtschaft: Energieumwandlung, -Transport und -Beschaffung im Liberalisierten Markt; Springer: Berlin/Heidelberg, Germany, 2008. [Google Scholar]
- Wirth, H. Recent Facts about Photovoltaics in Germany; Fraunhofer ISE: Freiburg, Germany, 2021. [Google Scholar]
- Fraunhofer IWES. The European Power System in 2030: Flexibility Challenges and Integration Benefits. An Analysis with a Focus on the Pentalateral Energy Forum Region; Agora Energiewende: Berlin, Germany, 2015. [Google Scholar]
- IRENA. Renewable Power Generation Costs in 2019; IRENA: Abu Dhabi, United Arab Emirates, 2020. [Google Scholar]
- Hein, F.; Peter, F.; Graichen, P. The German Power Market State of Affairs in 2019; Agora Energiewende: Berlin, Germany, 2020. [Google Scholar]
- Lewis, M. Closing the Gap to a Paris Compliant EU-ETS; Carbon Tracker: London, UK, 2018. [Google Scholar]
- Swiss Centre for Life Cycle Inventories. Life Cycle Inventories of Chemicals; Ecoinvent Centre: Dübendorf, Switzerland, 2007. [Google Scholar]
- EWI Energy Research and Scenarios. The Energy Market in 2030 and 2050—The Contribution of Gas and Heat Infrastructure to Efficient Carbon Emission Reductions; ewi ERS: Köln, Germany, 2018. [Google Scholar]
- Kuramochi, T.; Ramírez, A.; Turkenburg, W.; Faaij, A. Comparative assessment of CO2 capture technologies for carbon-intensive industrial processes. Prog. Energy Combust. Sci. 2012, 38, 87–112. [Google Scholar] [CrossRef]
- Lotrič, A.; Sekavčnik, M.; Kuštrin, I.; Mori, M. Life-cycle assessment of hydrogen technologies with the focus on EU critical raw materials and end-of-life strategies. Int. J. Hydrogen Energy 2021, 46, 10143–10160. [Google Scholar] [CrossRef]
- Bareiß, K.; de la Rua, C.; Möckl, M.; Hamacher, T. Life cycle assessment of hydrogen from proton exchange membrane water electrolysis in future energy systems. Appl. Energy 2019, 237, 862–872. [Google Scholar] [CrossRef]
- Elbe Energie. Erdgaspreise: Preisanstieg bis 2030 um 35%. 2022. Available online: https://www.elbe-energie.de/erdgaspreise-preisanstieg-bis-2030-um-35-erwartet/ (accessed on 1 January 2022).
- Gibgas. Fakten—Preisfindung. 2020. Available online: www.gibgas.de%2Fincl%2Fdownload%2Fegt_preisfinder.xls&usg=AOvVaw0Gy848NN4UxgZJk0cqCD20 (accessed on 1 January 2022).
- Zauner, A.; Rosenfeld, D.; Tichler, R. Analysis on future technology options and on techno-economic optimization. Store & Go 2019, 7, 2–89. [Google Scholar]
- Giglio, E.; Lanzini, A.; Santarelli, M.; Leone, P. Synthetic natural gas via integrated high-temperature electrolysis and methanation: Part II—Economic analysis. J. Energy Storage 2015, 2, 64–79. [Google Scholar] [CrossRef]
- Jentsch, M.; Trost, T.; Sterner, M. Optimal Use of Power-to-Gas Energy Storage Systems in an 85% Renewable Energy Scenario. Energy Procedia 2014, 46, 254–261. [Google Scholar] [CrossRef]
- Mohseni, F.; Görling, M.; Alvfors, P. The competitiveness of synthetic natural gas as a propellant in the Swedish fuel market. Energy Policy 2013, 52, 810–818. [Google Scholar] [CrossRef]
- Tichler, R.; Steinmüller, H.; Reiter, G. Teilprojekt D “Wirthschaftlichkeit und Systemanalyse von Power-to-Gas-Konzepten; DVGW: Bonn, Germany, 2014. [Google Scholar]
- Becker, W.L.; Braun, R.J.; Penev, M.; Melaina, M. Production of Fischer–Tropsch liquid fuels from high temperature solid oxide co-electrolysis units. Energy 2012, 47, 99–115. [Google Scholar] [CrossRef]
- Fraunhofer ISE. Wege zu Einem Klimaneutralen Energiesystem—Die Deutsche Energiewende im Kontext Gesellschaftlicher Verhaltensweisen; Fraunhofer ISE: Freiburg, Germany, 2020. [Google Scholar]
- von der Assen, N.; Jung, J.; Bardow, A. Life-cycle assessment of carbon dioxide capture and utilization: Avoiding the pitfalls. Energy Environ. Sci. 2013, 6, 2721–2734. [Google Scholar] [CrossRef]
- Rasmusson, H.B.; Cigarida, H.; Gerstein, D.; Graf, F.; Isik, V.; Jepma, C.S.; Spijker, E.; Tichler, R.; Veseli, A.; Zauner, A. Roadmap and Policy Recommendations for Power-to-Gas in the EU up to 2050. Available online: https://www.storeandgo.info/fileadmin/dateien/STORE_GO_power_to_gas_roadmap_update.pdf (accessed on 1 January 2022).


| 95.43 | 75.3 | 0.152 | 0.91 | 350 |
| Design/Process Parameter | Reactor R-1 | Reactor R-2 |
|---|---|---|
| Number of tubes | 20 | 20 |
| Tube diameter [m] | 0.075 | 0.075 |
| Length [m] | 0.85 | 0.45 |
| Catalyst loading [kg] | 51.49 | 25.04 |
| Residence time [h] | 0.0005 | 0.0007 |
| Operating pressure [bar] | 7.00 | 7.00 |
| Gas inlet temperature, Tin [°C] | 270 | 260 |
| Name | Formula | |
|---|---|---|
| Power-to-SNG efficiency | (4) | |
| Fuel synthesis efficiency | (5) | |
| CO2 conversion in reactor | (6) | |
| Variable Cost Item | Market Price | |
|---|---|---|
| Electricity | 50 | €/MWh |
| Cooling water | 0 | €/t |
| Distilled Water | 1 | €/t |
| CO2 | 20 | €/t |
| 0.5 wt.% Ru/Al2O3 Catalyst | 1288 | €/kg |
| Taxed Ref. 2020 | AEL 2020 | Wind 2020 | Surplus 2030 | Cement-CC 2030 | |
|---|---|---|---|---|---|
| Electrolyzer | PEM | Alkaline | PEM | PEM | PEM |
| Annual full-load hours | 8000 | 8000 | 3800 [51] | 205 [52] | 8000 |
| Electricity source | German grid b | German grid b | Offshore wind | Offshore wind | German grid (2030) c |
| Electricity cost (€/MWh) | 50 | 50 | 102 [53] | 0 | 58 |
| EEG levy (€/MWh) | 67 [54] | 67 [54] | 0 | 0 | 35 [54] |
| CO2 source | Biomethane plant | Biomethane plant | Biomethane plant | Biomethane plant | Cement plant |
| CO2 cost (€/t) | 20 | 20 | 20 | 20 | 5 a |
| CO2 credits (€/t) | - | - | - | - | 55 [55] |
| Plant operators | 3 | 3 | 2 | 1 | 3 |
| Source | Process | Description | Reference |
|---|---|---|---|
| CO2 | Biomethane | Burden-free CO2 | [56] |
| Cement plant | Electricity: 0.103 kWh/kg CO2 captured | [58] | |
| Steam: 1.03 kWh/kg CO2 captured | [58] | ||
| MEA: 0.013 kg MEA/kg CO2 captured | [56] | ||
| Capture efficiency: 85% Emissions are divided between cement and CO2 production by applying substitution | [58] | ||
| H2 | AEL | Alkaline electrolyzer stack inventory and balance of plant inventory | [59] |
| Electricity: 58.27 kWh/kg H2 Source according to scenario | Process simulation | ||
| Water, deionised: 8.94 kg H2O/kg H2 | Process simulation | ||
| PEM | Balance of plant inventory BOP lifetime: 20 years | [60] | |
| PEM stack inventory for 2017 Stack: 1 MW; Stack lifetime: 7 years | [60] | ||
| Electricity: 55 kWh/kg H2 Source according to scenario | [60] | ||
| Water, deionised: 8.94 kg H2O/kg H2 | Process simulation | ||
| PEM (2030) | Balance of plant inventory BOP lifetime: 20 years | [60] | |
| PEM stack inventory for ‘near future’ Stack 1 MW; Stack lifetime: 10 years | [60] | ||
| Electricity: 55 kWh/kg H2 Source according to scenario | [60] | ||
| Water, deionised: 8.94 kg H2O/kg H2 | Process simulation |
| Characteristic | Required Gas Value | SNG Value |
|---|---|---|
| Wobbe Index [kWhth /m3] | 13.6–15.7 | 13.7 |
| Calorific Value [kWhth /m3] | 8.4–13.1 | 10.1 (HHV) 9.1 (LHV) |
| Water content [mg/m3] | <50 in grids >10 bar 10 bar | 40 |
| Hydrogen content [vol%] | <2 in exceptional cases up to <10 | 4 |
| Carbon dioxide content [vol%] | in L-gas grids <10 in H-gas grids <5 | 1 |
| Parameter | Value |
|---|---|
| Material flows [kg/h] | |
| CO2 | 91.96 |
| Distilled water for electrolysis | 150.58 |
| Cooling water | 5788.57 |
| Oxygen | 133.73 |
| 33.83 | |
| Energy flows | |
| [MW] | 1.002 |
| Waste heat [MJ] | 0.525 |
| SNG output [MW] | 0.513 (HHV); 0.461 (LHV) |
| Performance parameters | |
| CO2 conversion in reactor | R-1: 96%; R-2: 76% |
| Power-to-SNG efficiency | 46% |
| Fuel synthesis efficiency | 82% |
Publisher’s Note: MDPI stays neutral with regard to jurisdictional claims in published maps and institutional affiliations. |
© 2022 by the authors. Licensee MDPI, Basel, Switzerland. This article is an open access article distributed under the terms and conditions of the Creative Commons Attribution (CC BY) license (https://creativecommons.org/licenses/by/4.0/).
Share and Cite
Vega Puga, E.; Moumin, G.; Neumann, N.C.; Roeb, M.; Ardone, A.; Sattler, C. Holistic View on Synthetic Natural Gas Production: A Technical, Economic and Environmental Analysis. Energies 2022, 15, 1608. https://doi.org/10.3390/en15051608
Vega Puga E, Moumin G, Neumann NC, Roeb M, Ardone A, Sattler C. Holistic View on Synthetic Natural Gas Production: A Technical, Economic and Environmental Analysis. Energies. 2022; 15(5):1608. https://doi.org/10.3390/en15051608
Chicago/Turabian StyleVega Puga, Estefania, Gkiokchan Moumin, Nicole Carina Neumann, Martin Roeb, Armin Ardone, and Christian Sattler. 2022. "Holistic View on Synthetic Natural Gas Production: A Technical, Economic and Environmental Analysis" Energies 15, no. 5: 1608. https://doi.org/10.3390/en15051608
APA StyleVega Puga, E., Moumin, G., Neumann, N. C., Roeb, M., Ardone, A., & Sattler, C. (2022). Holistic View on Synthetic Natural Gas Production: A Technical, Economic and Environmental Analysis. Energies, 15(5), 1608. https://doi.org/10.3390/en15051608